The proton structure function F The proton structure function F The proton structure function F 2 2 2 in the resonance region in the resonance region in the resonance region GDH 2002, Genova, Italy, July 2002. Presented by M. Osipenko
Transcript
The proton structure function FThe proton structure function FThe proton structure function F222in the resonance regionin the resonance regionin the resonance region
GDH 2002, Genova, Italy, July 2002.Presented by M. Osipenko
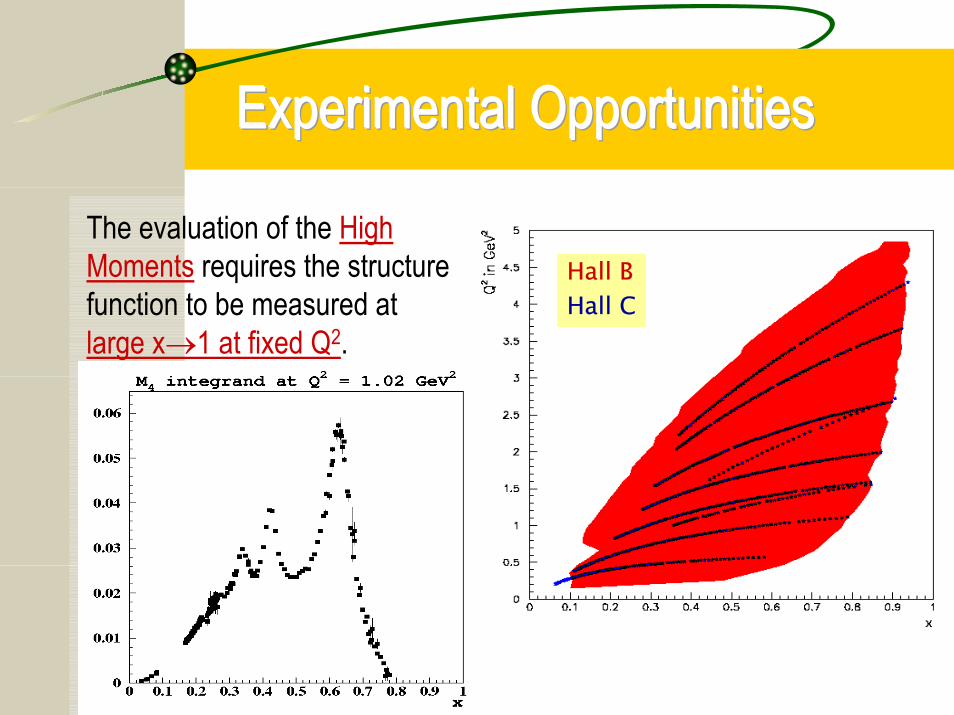
The evaluation of the High Moments requires the structure function to be measured at large x→1 at fixed Q2.
Jefferson LaboratoryJefferson LaboratoryJefferson Laboratory
Detector CLASDetector CLASDetector CLAS4π detector operating at luminosity 1034 cm-2s-1, designed for detecting many particles in the final state, necessary for exploring exclusive channels of the photo- and electro-production;due to large acceptance, well suited for measuring integrated characteristics, in particularly – moments.
Data AnalysisData AnalysisData Analysis
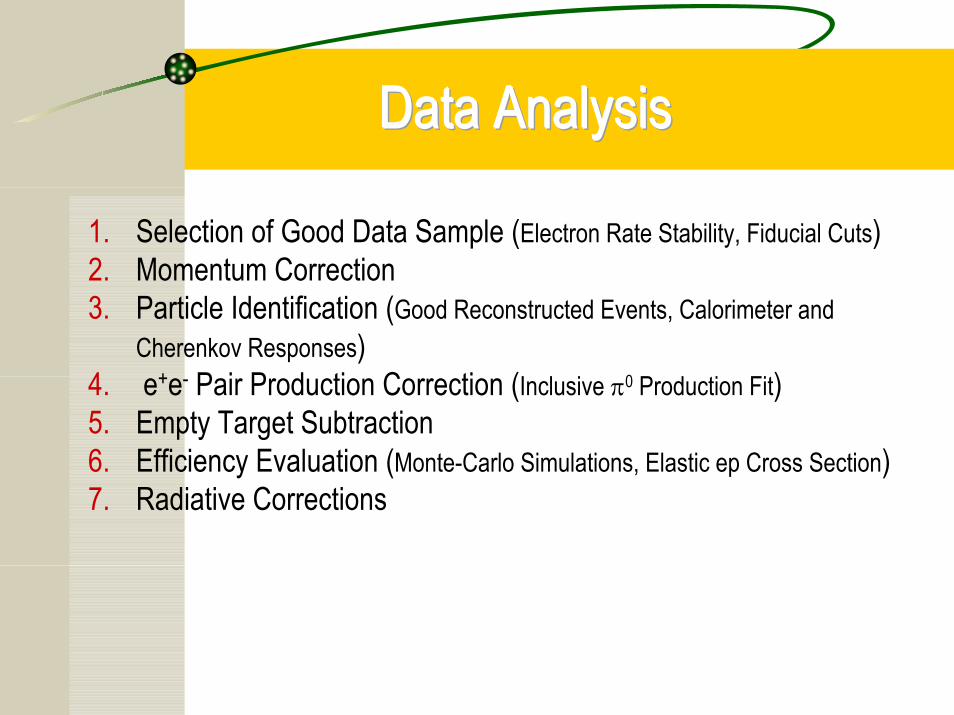
1. Selection of Good Data Sample (Electron Rate Stability, Fiducial Cuts)2. Momentum Correction3. Particle Identification (Good Reconstructed Events, Calorimeter and
Cherenkov Responses)4. e+e- Pair Production Correction (Inclusive π0 Production Fit)5. Empty Target Subtraction6. Efficiency Evaluation (Monte-Carlo Simulations, Elastic ep Cross Section)7. Radiative Corrections
Electron Rate StabilityElectron Rate StabilityElectron Rate Stability
The number of event candidates taken each 10 seconds, normalized to the live-gated FC charge, have to be within ±2σG interval from the average electron rate.
Num
ber
of e
vent
s/FC
Time (10sec) Number of events/FC
Fiducial CutsFiducial CutsFiducial Cuts
θ P
φφ
“Fiducial Cuts” define the most uniform and properly operating volume of the detector. They were obtained by studying φ-distribution of the electron yield for each kinematical bin.
The Momentum Correction was based on the study of measured positions of the elastic peak and second resonance peak. They resulted in the significant improvement of the elastic peak width.
Particle IdentificationParticle IdentificationParticle IdentificationFor the sake of confidence in the proper particle identification, only those event candidates were selected for the analysis, whose signals matched all systems of the detector CLAS (DC, EC, CC, TOF).
In order to remove remaining pion background photo-electron distributions in PMTs of the Cherenkov Counter were studied and the separation was performed by a combined fit, using two Poisson distributions convoluted with the Gaussian, accounted for the PMT resolution.
Efficiency EvaluationEfficiency EvaluationEfficiency EvaluationThe Efficiency has been extracted using Monte Carlo simulations of the detector CLAS. Careful test of the simulations results was performed by the comparison of the measured elastic cross section with simulated one. Two cross sections showed good agreement. Extracted efficiency is very smooth function of kinematics and it is very close to 100%.
Structure Function FStructure Function FStructure Function F222
The extracted Structure Function F2 is in agreement with World data and cover whole resonance region in Q2 range from 0.3 to 4 GeV2, giving access to high moments in this region.
Experimental momentsof the structure function F2 were extracted for n=2-8 with percentage of experimental points in the integral greater than 70% at Q2<5 GeV2.
Higher twist contribution was evaluated with ~10% precision from the fit of the data.
The cross section averaged over each separate resonance peak exhibits the Q2 evolution quite similar to that obtained in DIS.
Correlations and ResonancesCorrelations and ResonancesCorrelations and Resonances
Q2=0.675 Q2=1.725
A combined fit of the cross sections, based on the available information on resonance couplings, gives some indications about the nature of background and nucleon resonances.
SummarySummarySummary
Proton structure function F2 was measured with high precision in a wide two-dimensional range in x from 0.1 to 0.9 and Q2 from 0.3 up to 5 GeV2.
The higher twist contribution was extracted from the data with ~10% precision and it was interpreted in terms of the phenomenological approach.
The phenomenon of Bloom-Gilman duality was studied and showed interesting properties of the resonance-background separation.