FACT BOOK 2021 2021 年3 月期 For the Year Ended March 31, 2021 テーマパークデータ Theme Park Data 連結指標 Financial Results and Key Indicators (Consolidated) 有利子負債の状況 Interest-Bearing Debt セグメント情報 Segment Information セグメント別主要施設データ Principal Facility Data Classified by Segment 連結財務諸表 Consolidated Financial Statements 単体財務諸表 Nonconsolidated Financial Statements 業界動向 Market Data 株式情報 Stock Information 7 目次 Contents 9 11 13 1 15 19 23 24
Transcript
F A C T BOOK 2 0 2 1
2021年3月期For the Year Ended March 31, 2021
テーマパークデータ Theme Park Data
連結指標 Financial Results and Key Indicators (Consolidated)
有利子負債の状況 Interest-Bearing Debt
セグメント情報 Segment Information
セグメント別主要施設データ Principal Facility Data Classified by Segment
連結財務諸表 Consolidated Financial Statements
単体財務諸表 Nonconsolidated Financial Statements
業界動向 Market Data
株式情報 Stock Information
7
目次 Contents
9
11
13
1
15
19
23
24
Oriental Land Fact Book 2021 Oriental Land Fact Book 2021 31 2
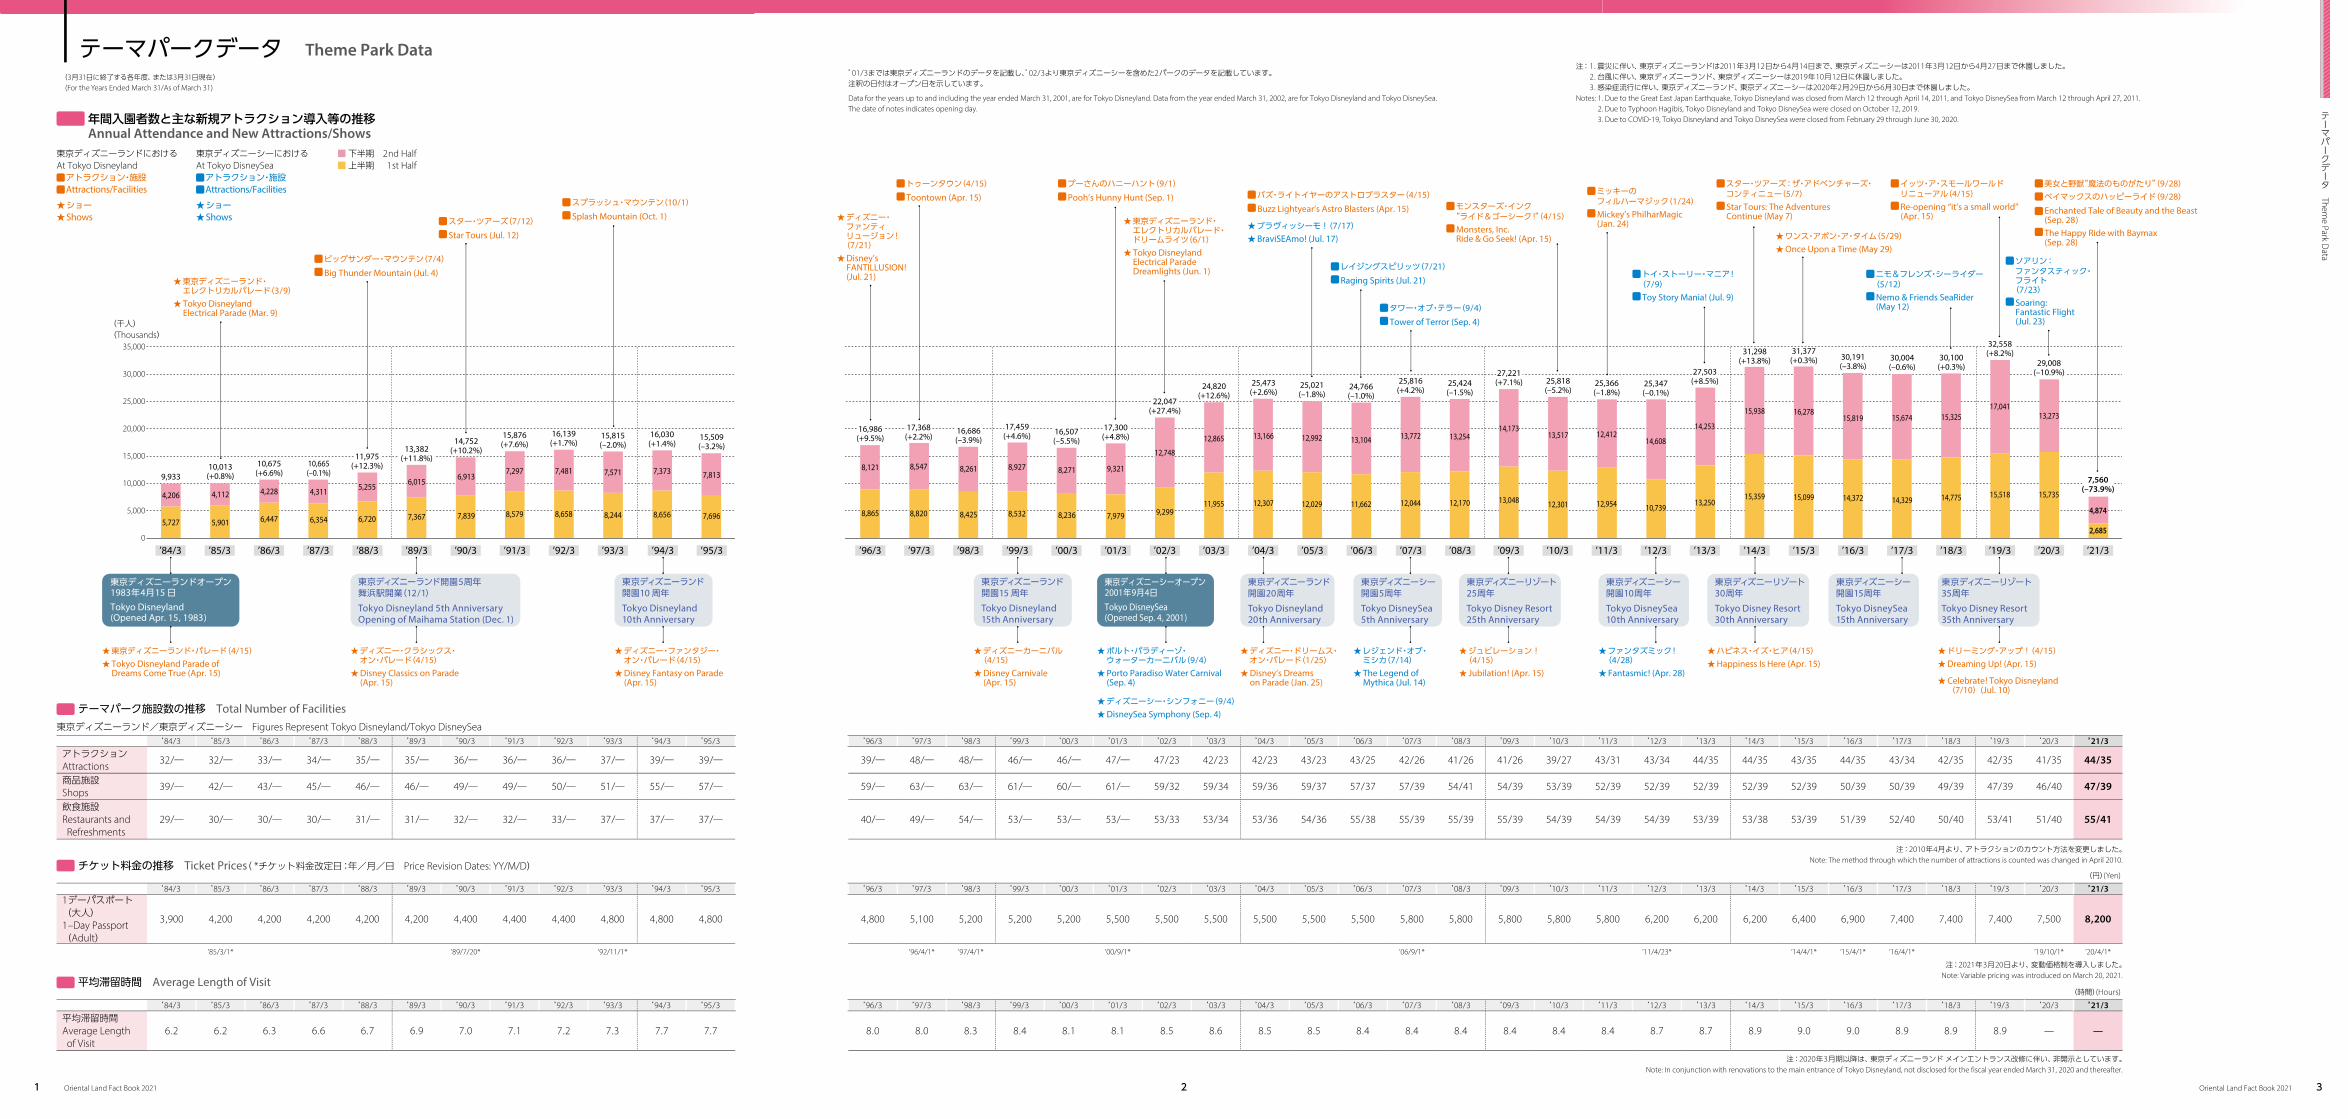
Data for the years up to and including the year ended March 31, 2001, are for Tokyo Disneyland. Data from the year ended March 31, 2002, are for Tokyo Disneyland and Tokyo DisneySea.The date of notes indicates opening day.
Notes: 1. Due to the Great East Japan Earthquake, Tokyo Disneyland was closed from March 12 through April 14, 2011, and Tokyo DisneySea from March 12 through April 27, 2011.2. Due to Typhoon Hagibis, Tokyo Disneyland and Tokyo DisneySea were closed on October 12, 2019.3. Due to COVID-19, Tokyo Disneyland and Tokyo DisneySea were closed from February 29 through June 30, 2020.
(For the Years Ended March 31/As of March 31)(3月31日に終了する各年度、または3月31日現在)
テーマパークデータ Theme Park Data
年間入園者数と主な新規アトラクション導入等の推移Annual Attendance and New Attractions/Shows
注:2020年3月期以降は、東京ディズニーランド メインエントランス改修に伴い、非開示としています。Note: In conjunction with renovations to the main entrance of Tokyo Disneyland, not disclosed for the fiscal year ended March 31, 2020 and thereafter.
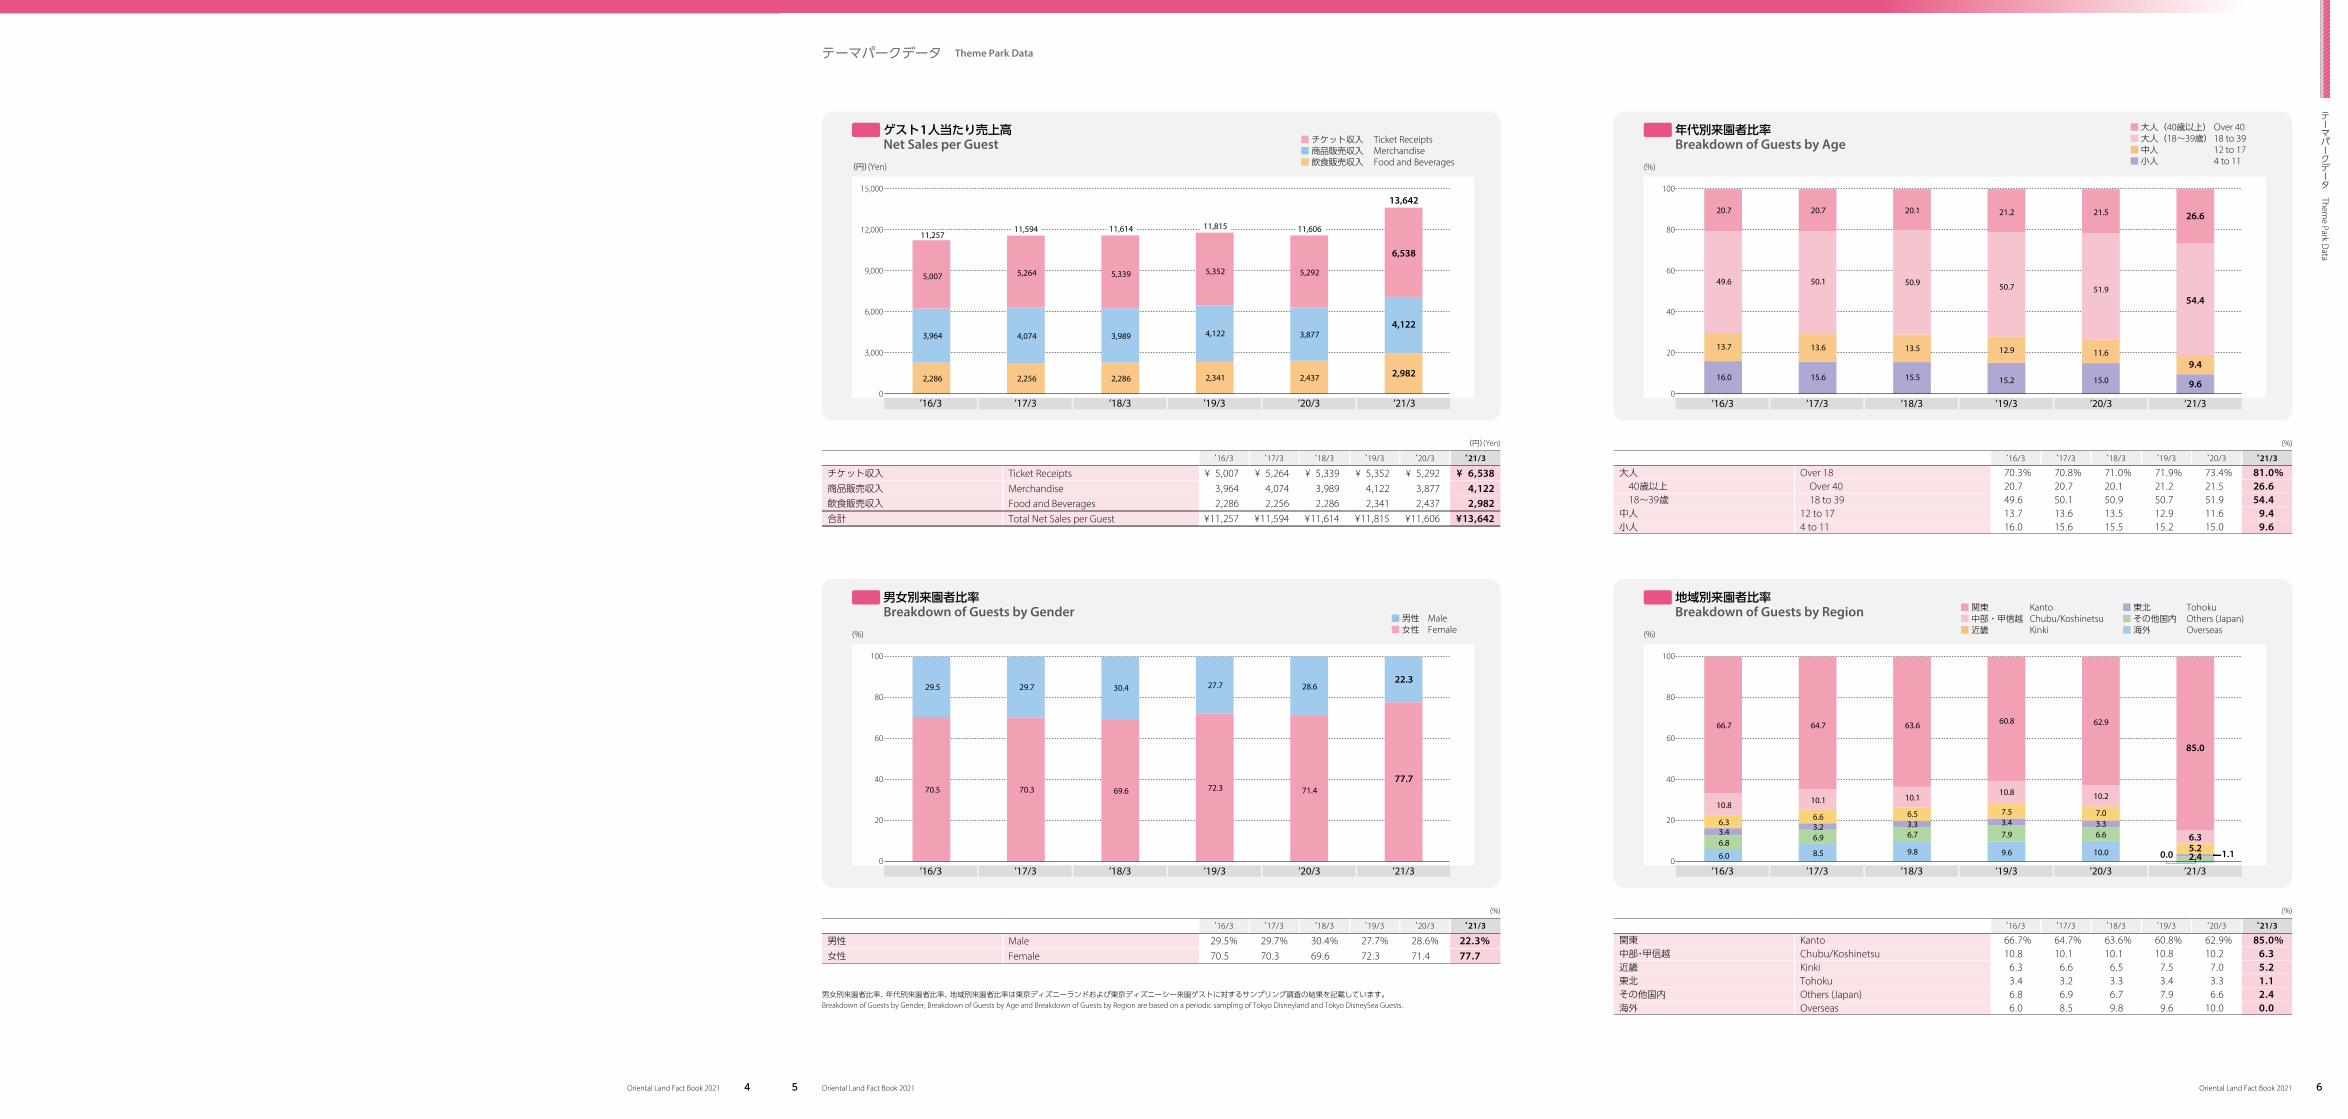
男女別来園者比率、年代別来園者比率、地域別来園者比率は東京ディズニーランドおよび東京ディズニーシー来園ゲストに対するサンプリング調査の結果を記載しています。Breakdown of Guests by Gender, Breakdown of Guests by Age and Breakdown of Guests by Region are based on a periodic sampling of Tokyo Disneyland and Tokyo DisneySea Guests.
テーマパークデータ Theme Park Data
テーマパークデータ Them
e Park Data
Oriental Land Fact Book 2021 Oriental Land Fact Book 20217 8
連結指標 Financial Results and Key Indicators (Consolidated)
連結指標 Financial Results and Key Indicators (Consolidated)
(For the Years Ended March 31/As of March 31)(3月31日に終了する各年度、または3月31日現在)
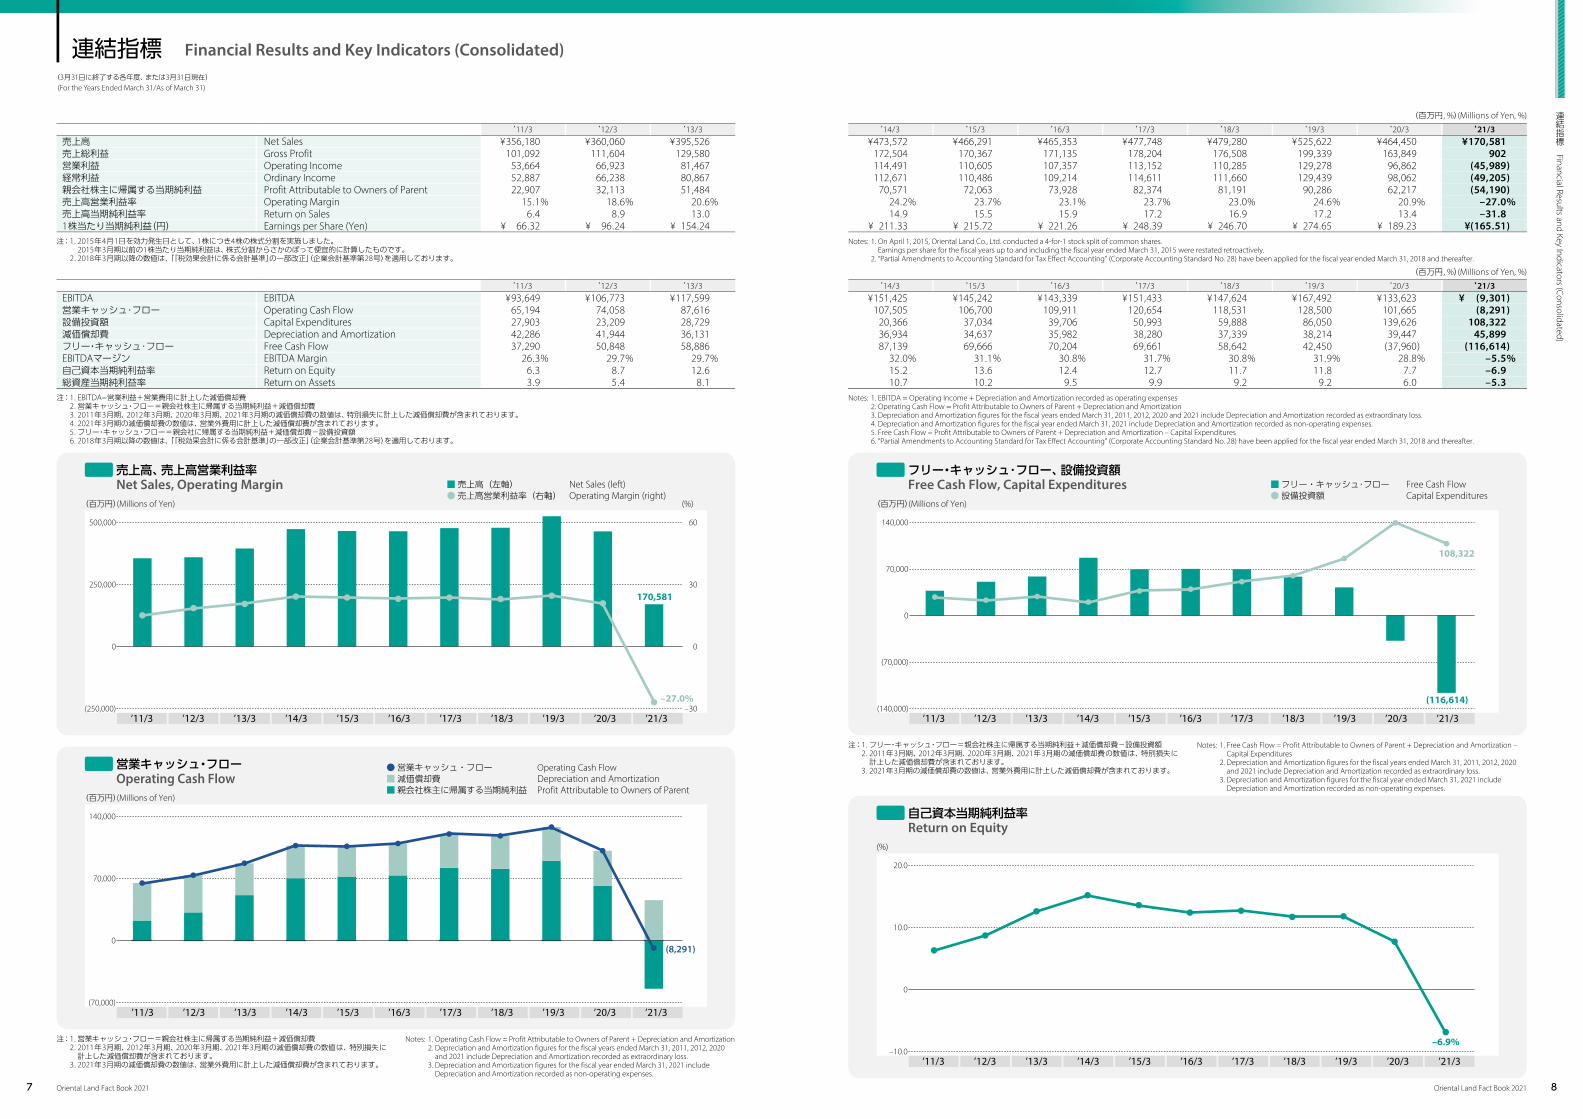
Notes: 1. Operating Cash Flow = Profit Attributable to Owners of Parent + Depreciation and Amortization 2. Depreciation and Amortization figures for the fiscal years ended March 31, 2011, 2012, 2020
and 2021 include Depreciation and Amortization recorded as extraordinary loss. 3. Depreciation and Amortization figures for the fiscal year ended March 31, 2021 include
Depreciation and Amortization recorded as non-operating expenses.
Notes: 1. EBITDA = Operating Income + Depreciation and Amortization recorded as operating expenses 2. Operating Cash Flow = Profit Attributable to Owners of Parent + Depreciation and Amortization 3. Depreciation and Amortization figures for the fiscal years ended March 31, 2011, 2012, 2020 and 2021 include Depreciation and Amortization recorded as extraordinary loss. 4. Depreciation and Amortization figures for the fiscal year ended March 31, 2021 include Depreciation and Amortization recorded as non-operating expenses. 5. Free Cash Flow = Profit Attributable to Owners of Parent + Depreciation and Amortization – Capital Expenditures 6. “Partial Amendments to Accounting Standard for Tax Effect Accounting” (Corporate Accounting Standard No. 28) have been applied for the fiscal year ended March 31, 2018 and thereafter.
Notes: 1. On April 1, 2015, Oriental Land Co., Ltd. conducted a 4-for-1 stock split of common shares. Earnings per share for the fiscal years up to and including the fiscal year ended March 31, 2015 were restated retroactively.
2. “Partial Amendments to Accounting Standard for Tax Effect Accounting” (Corporate Accounting Standard No. 28) have been applied for the fiscal year ended March 31, 2018 and thereafter.
Notes: 1. Free Cash Flow = Profit Attributable to Owners of Parent + Depreciation and Amortization – Capital Expenditures
2. Depreciation and Amortization figures for the fiscal years ended March 31, 2011, 2012, 2020 and 2021 include Depreciation and Amortization recorded as extraordinary loss.
3. Depreciation and Amortization figures for the fiscal year ended March 31, 2021 include Depreciation and Amortization recorded as non-operating expenses.
売上高、売上高営業利益率Net Sales, Operating Margin
フリー・キャッシュ・フロー、設備投資額Free Cash Flow, Capital Expenditures
営業キャッシュ・フローOperating Cash Flow
自己資本当期純利益率Return on Equity
■ 売上高(左軸) Net Sales (left)● 売上高営業利益率(右軸) Operating Margin (right)
■ フリー・キャッシュ・フロー Free Cash Flow● 設備投資額 Capital Expenditures
● 営業キャッシュ・フロー Operating Cash Flow■ 減価償却費 Depreciation and Amortization■ 親会社株主に帰属する当期純利益 Profit Attributable to Owners of Parent
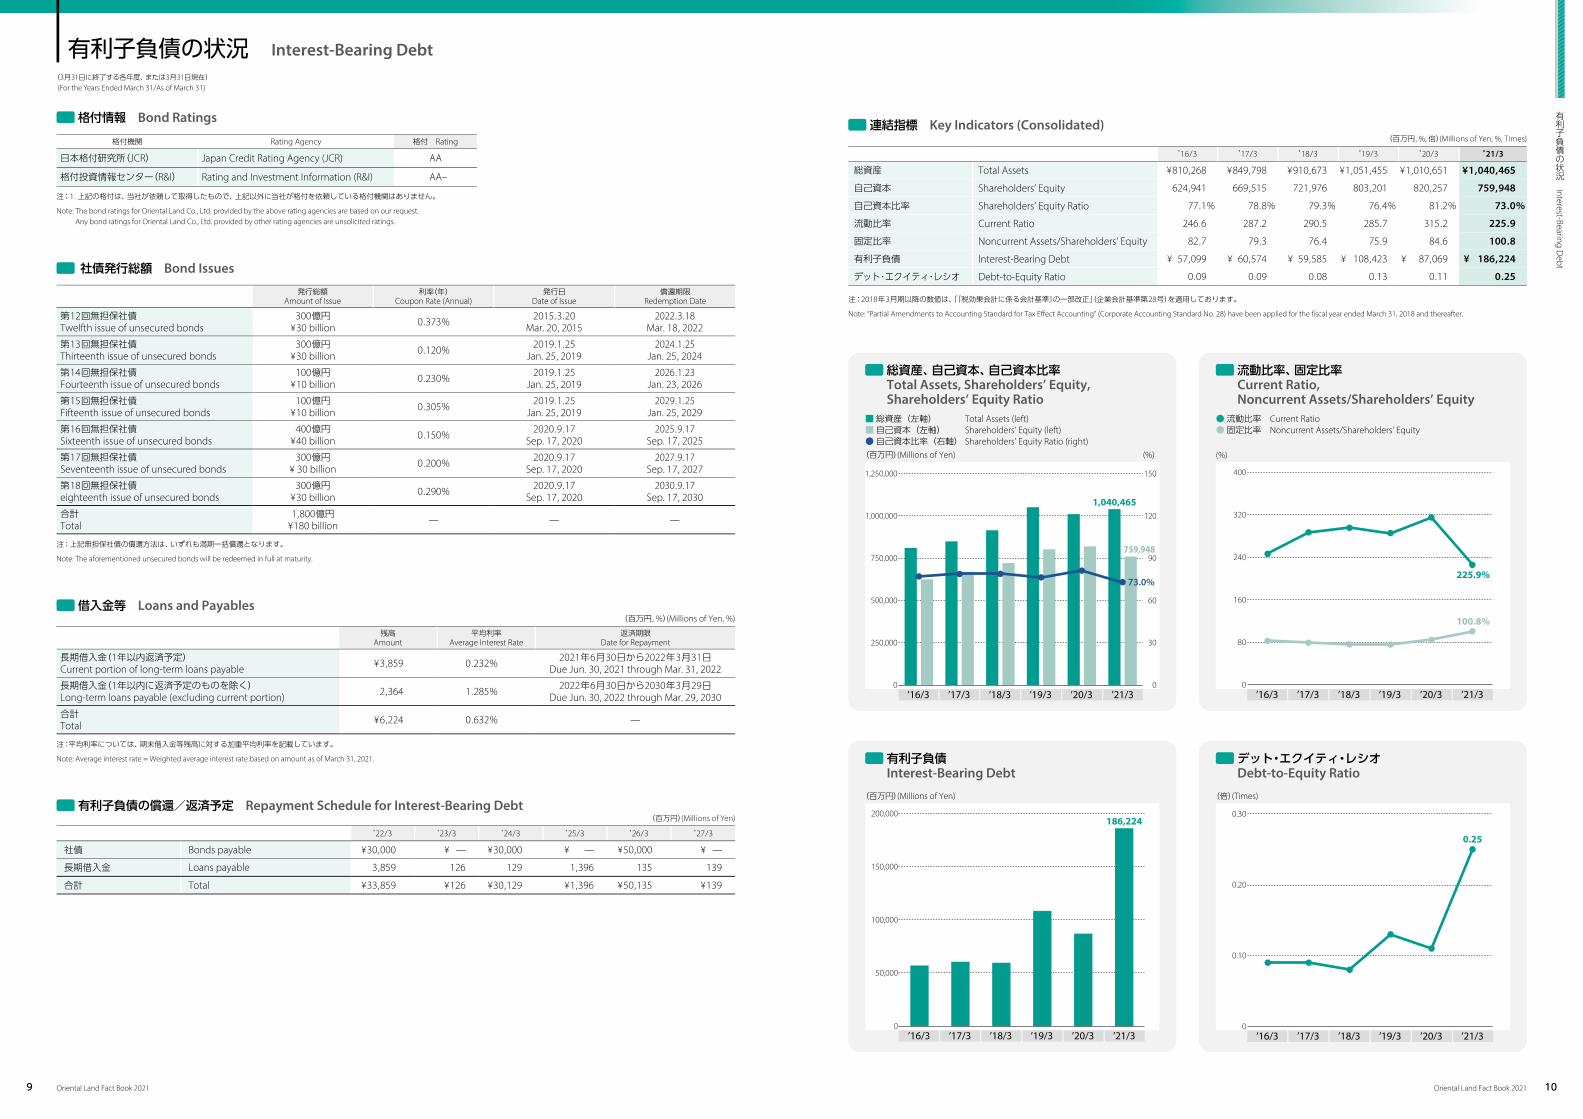
Note: The bond ratings for Oriental Land Co., Ltd. provided by the above rating agencies are based on our request.Any bond ratings for Oriental Land Co., Ltd. provided by other rating agencies are unsolicited ratings.
格付情報 Bond Ratings
総資産、自己資本、自己資本比率Total Assets, Shareholders’ Equity,Shareholders’ Equity Ratio
Note: “Partial Amendments to Accounting Standard for Tax Effect Accounting” (Corporate Accounting Standard No. 28) have been applied for the fiscal year ended March 31, 2018 and thereafter.
社債発行総額 Bond Issues
発行総額Amount of Issue
利率(年)Coupon Rate (Annual)
発行日Date of Issue
償還期限Redemption Date
第12回無担保社債Twelfth issue of unsecured bonds
300億円¥30 billion 0.373% 2015.3.20
Mar. 20, 20152022.3.18
Mar. 18, 2022
第13回無担保社債Thirteenth issue of unsecured bonds
300億円¥30 billion 0.120% 2019.1.25
Jan. 25, 20192024.1.25
Jan. 25, 2024
第14回無担保社債Fourteenth issue of unsecured bonds
100億円¥10 billion 0.230% 2019.1.25
Jan. 25, 20192026.1.23
Jan. 23, 2026
第15回無担保社債Fifteenth issue of unsecured bonds
100億円¥10 billion 0.305% 2019.1.25
Jan. 25, 20192029.1.25
Jan. 25, 2029
第16回無担保社債Sixteenth issue of unsecured bonds
400億円¥40 billion 0.150% 2020.9.17
Sep. 17, 20202025.9.17
Sep. 17, 2025
第17回無担保社債Seventeenth issue of unsecured bonds
300億円¥ 30 billion 0.200% 2020.9.17
Sep. 17, 20202027.9.17
Sep. 17, 2027
第18回無担保社債eighteenth issue of unsecured bonds
300億円¥30 billion 0.290% 2020.9.17
Sep. 17, 20202030.9.17
Sep. 17, 2030
合計Total
1,800億円¥180 billion ̶ ̶ ̶
注: 上記無担保社債の償還方法は、いずれも満期一括償還となります。
Note: The aforementioned unsecured bonds will be redeemed in full at maturity.
(百万円, %)(Millions of Yen, %)
残高Amount
平均利率Average Interest Rate
返済期限Date for Repayment
長期借入金(1年以内返済予定)Current portion of long-term loans payable ¥3,859 0.232% 2021年6月30日から2022年3月31日
Due Jun. 30, 2021 through Mar. 31, 2022
長期借入金(1年以内に返済予定のものを除く)Long-term loans payable (excluding current portion) 2,364 1.285% 2022年6月30日から2030年3月29日
Due Jun. 30, 2022 through Mar. 29, 2030
合計Total ¥6,224 0.632% ̶
注:平均利率については、期末借入金等残高に対する加重平均利率を記載しています。
Note: Average interest rate = Weighted average interest rate based on amount as of March 31, 2021.
借入金等 Loans and Payables
有利子負債の償還/返済予定 Repayment Schedule for Interest-Bearing Debt (百万円)(Millions of Yen)
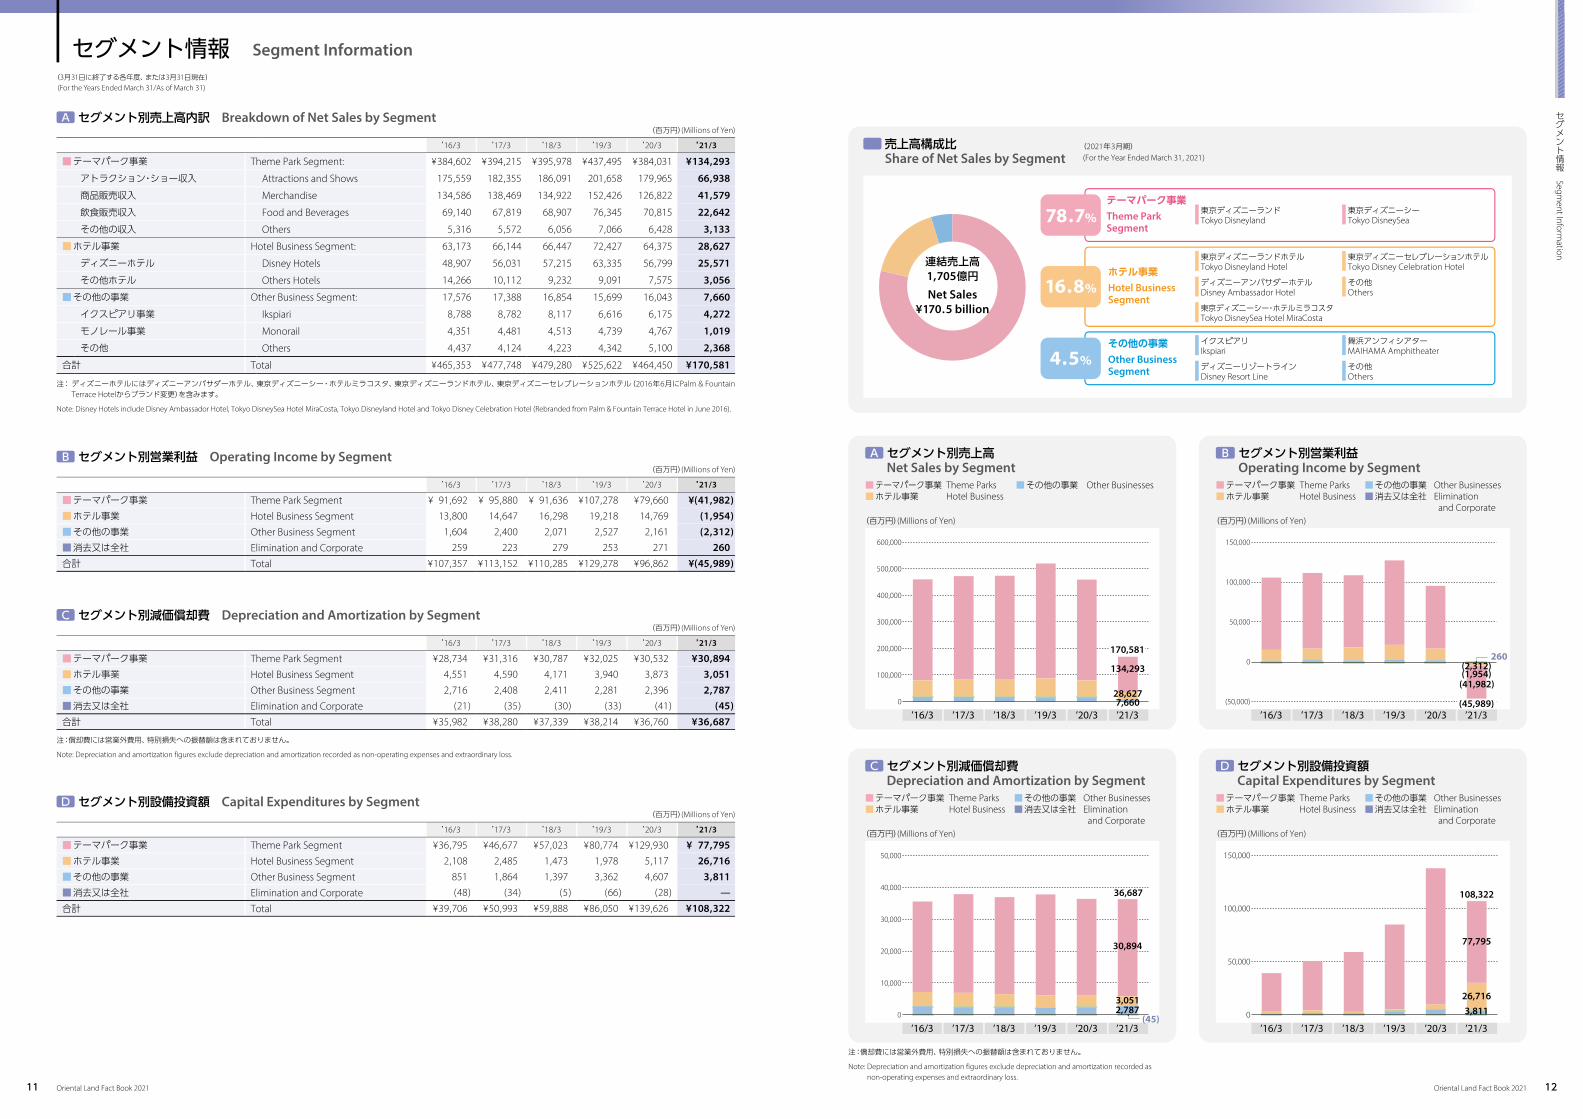
Note: Disney Hotels include Disney Ambassador Hotel, Tokyo DisneySea Hotel MiraCosta, Tokyo Disneyland Hotel and Tokyo Disney Celebration Hotel (Rebranded from Palm & Fountain Terrace Hotel in June 2016).
セグメント別営業利益 Operating Income by SegmentB (百万円)(Millions of Yen)
’16/3 ’17/3 ’18/3 ’19/3 ’20/3 ’21/3
■ テーマパーク事業 Theme Park Segment ¥ 91,692 ¥ 95,880 ¥ 91,636 ¥107,278 ¥79,660 ¥(41,982)■ ホテル事業 Hotel Business Segment 13,800 14,647 16,298 19,218 14,769 (1,954)■ その他の事業 Other Business Segment 1,604 2,400 2,071 2,527 2,161 (2,312)■ 消去又は全社 Elimination and Corporate 259 223 279 253 271 260合計 Total ¥107,357 ¥113,152 ¥110,285 ¥129,278 ¥96,862 ¥(45,989)
セグメント別減価償却費 Depreciation and Amortization by SegmentC (百万円)(Millions of Yen)
’16/3 ’17/3 ’18/3 ’19/3 ’20/3 ’21/3
■ テーマパーク事業 Theme Park Segment ¥28,734 ¥31,316 ¥30,787 ¥32,025 ¥30,532 ¥30,894■ ホテル事業 Hotel Business Segment 4,551 4,590 4,171 3,940 3,873 3,051■ その他の事業 Other Business Segment 2,716 2,408 2,411 2,281 2,396 2,787■ 消去又は全社 Elimination and Corporate (21) (35) (30) (33) (41) (45)合計 Total ¥35,982 ¥38,280 ¥37,339 ¥38,214 ¥36,760 ¥36,687
注:償却費には営業外費用、特別損失への振替額は含まれておりません。
Note: Depreciation and amortization figures exclude depreciation and amortization recorded as non-operating expenses and extraordinary loss.
セグメント別設備投資額 Capital Expenditures by SegmentD (百万円)(Millions of Yen)
’16/3 ’17/3 ’18/3 ’19/3 ’20/3 ’21/3
■ テーマパーク事業 Theme Park Segment ¥36,795 ¥46,677 ¥57,023 ¥80,774 ¥129,930 ¥ 77,795■ ホテル事業 Hotel Business Segment 2,108 2,485 1,473 1,978 5,117 26,716■ その他の事業 Other Business Segment 851 1,864 1,397 3,362 4,607 3,811■ 消去又は全社 Elimination and Corporate (48) (34) (5) (66) (28) ̶合計 Total ¥39,706 ¥50,993 ¥59,888 ¥86,050 ¥139,626 ¥108,322
注:償却費には営業外費用、特別損失への振替額は含まれておりません。
Note: Depreciation and amortization figures exclude depreciation and amortization recorded as non-operating expenses and extraordinary loss.
セグメント情報 Segm
ent Information
Oriental Land Fact Book 2021 Oriental Land Fact Book 202113 14
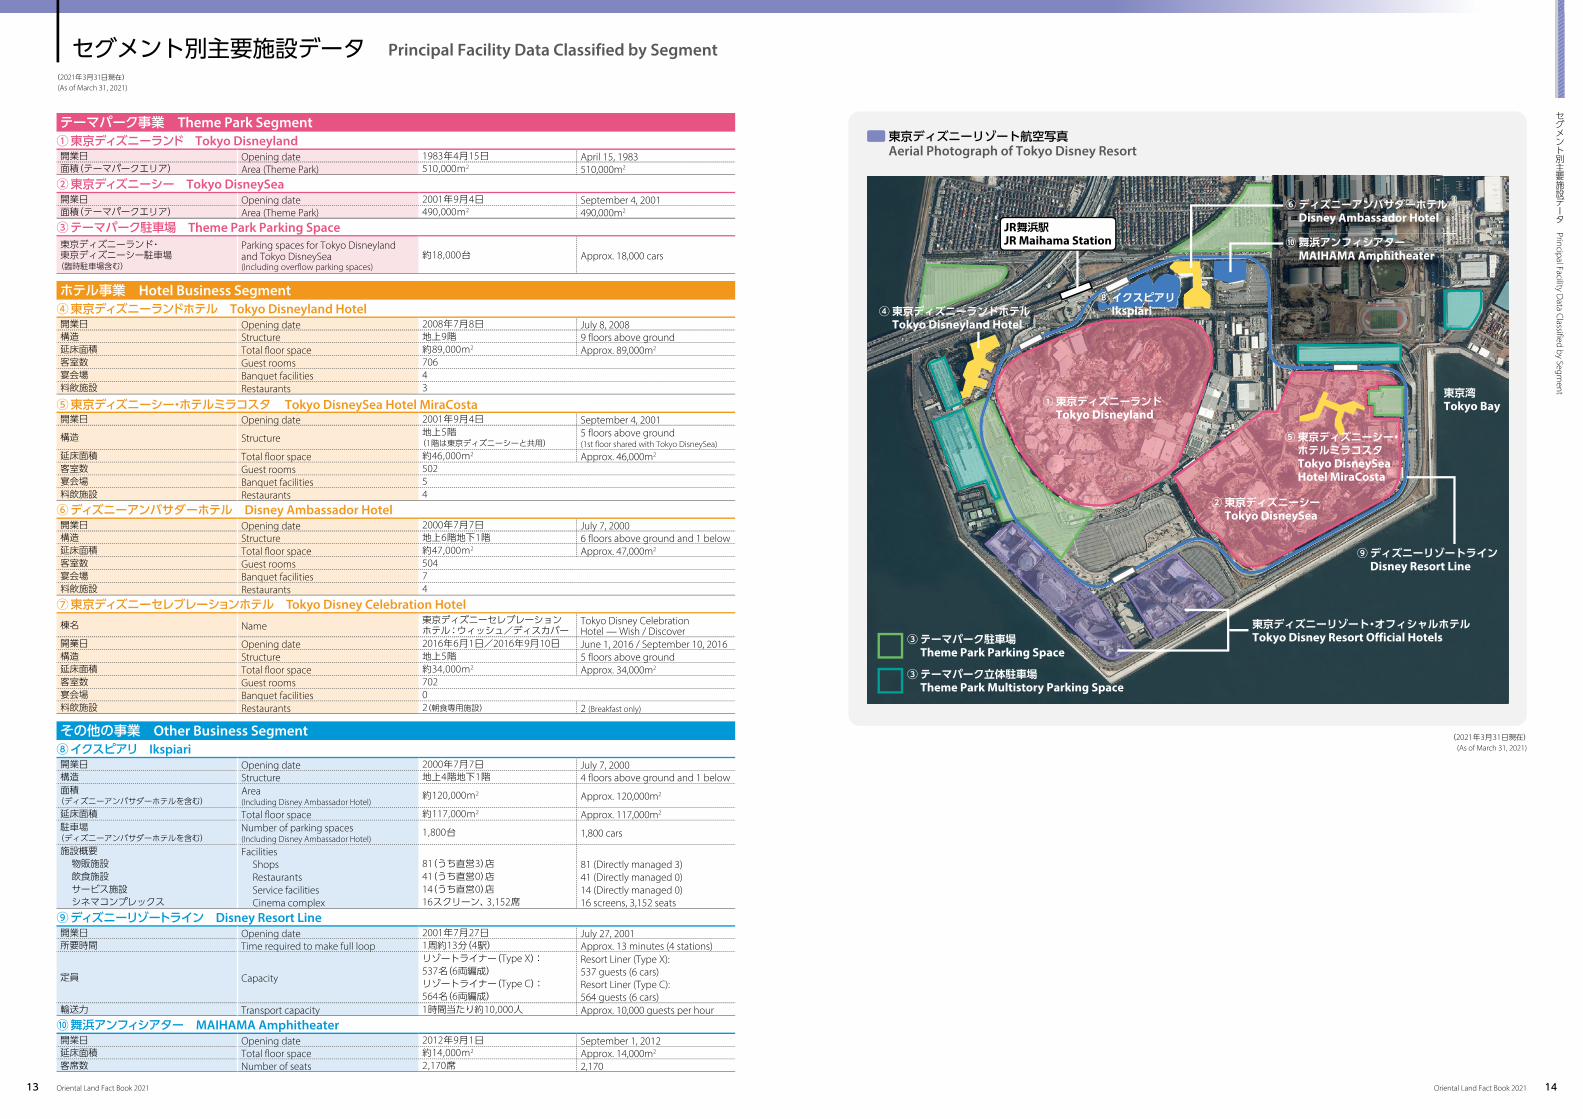
(As of March 31, 2021)(2021年3月31日現在)
セグメント別主要施設データ Principal Facility Data Classified by Segment
テーマパーク事業 Theme Park Segment① 東京ディズニーランド Tokyo Disneyland開業日 Opening date 1983年4月15日 April 15, 1983面積(テーマパークエリア) Area (Theme Park) 510,000m2 510,000m2
② 東京ディズニーシー Tokyo DisneySea開業日 Opening date 2001年9月4日 September 4, 2001面積(テーマパークエリア) Area (Theme Park) 490,000m2 490,000m2
③ テーマパーク駐車場 Theme Park Parking Space東京ディズニーランド・東京ディズニーシー駐車場(臨時駐車場含む)
Parking spaces for Tokyo Disneyland and Tokyo DisneySea (Including overflow parking spaces)
約18,000台 Approx. 18,000 cars
ホテル事業 Hotel Business Segment④ 東京ディズニーランドホテル Tokyo Disneyland Hotel開業日 Opening date 2008年7月8日 July 8, 2008構造 Structure 地上9階 9 floors above ground延床面積 Total floor space 約89,000m2 Approx. 89,000m2
⑥ ディズニーアンバサダーホテル Disney Ambassador Hotel開業日 Opening date 2000年7月7日 July 7, 2000構造 Structure 地上6階地下1階 6 floors above ground and 1 below延床面積 Total floor space 約47,000m2 Approx. 47,000m2
⑦ 東京ディズニーセレブレーションホテル Tokyo Disney Celebration Hotel棟名 Name 東京ディズニーセレブレーション
ホテル:ウィッシュ/ディスカバーTokyo Disney Celebration Hotel — Wish / Discover
開業日 Opening date 2016年6月1日/2016年9月10日 June 1, 2016 / September 10, 2016構造 Structure 地上5階 5 floors above ground延床面積 Total floor space 約34,000m2 Approx. 34,000m2
その他の事業 Other Business Segment⑧イクスピアリ Ikspiari開業日 Opening date 2000年7月7日 July 7, 2000構造 Structure 地上4階地下1階 4 floors above ground and 1 below面積(ディズニーアンバサダーホテルを含む)
Area(Including Disney Ambassador Hotel)
約120,000m2 Approx. 120,000m2
延床面積 Total floor space 約117,000m2 Approx. 117,000m2
駐車場(ディズニーアンバサダーホテルを含む)
Number of parking spaces(Including Disney Ambassador Hotel)
⑨ディズニーリゾートライン Disney Resort Line開業日 Opening date 2001年7月27日 July 27, 2001所要時間 Time required to make full loop 1周約13分(4駅) Approx. 13 minutes (4 stations)
輸送力 Transport capacity 1時間当たり約10,000人 Approx. 10,000 guests per hour⑩舞浜アンフィシアター MAIHAMA Amphitheater開業日 Opening date 2012年9月1日 September 1, 2012延床面積 Total floor space 約14,000m2 Approx. 14,000m2
客席数 Number of seats 2,170席 2,170
東京ディズニーリゾート航空写真 Aerial Photograph of Tokyo Disney Resort
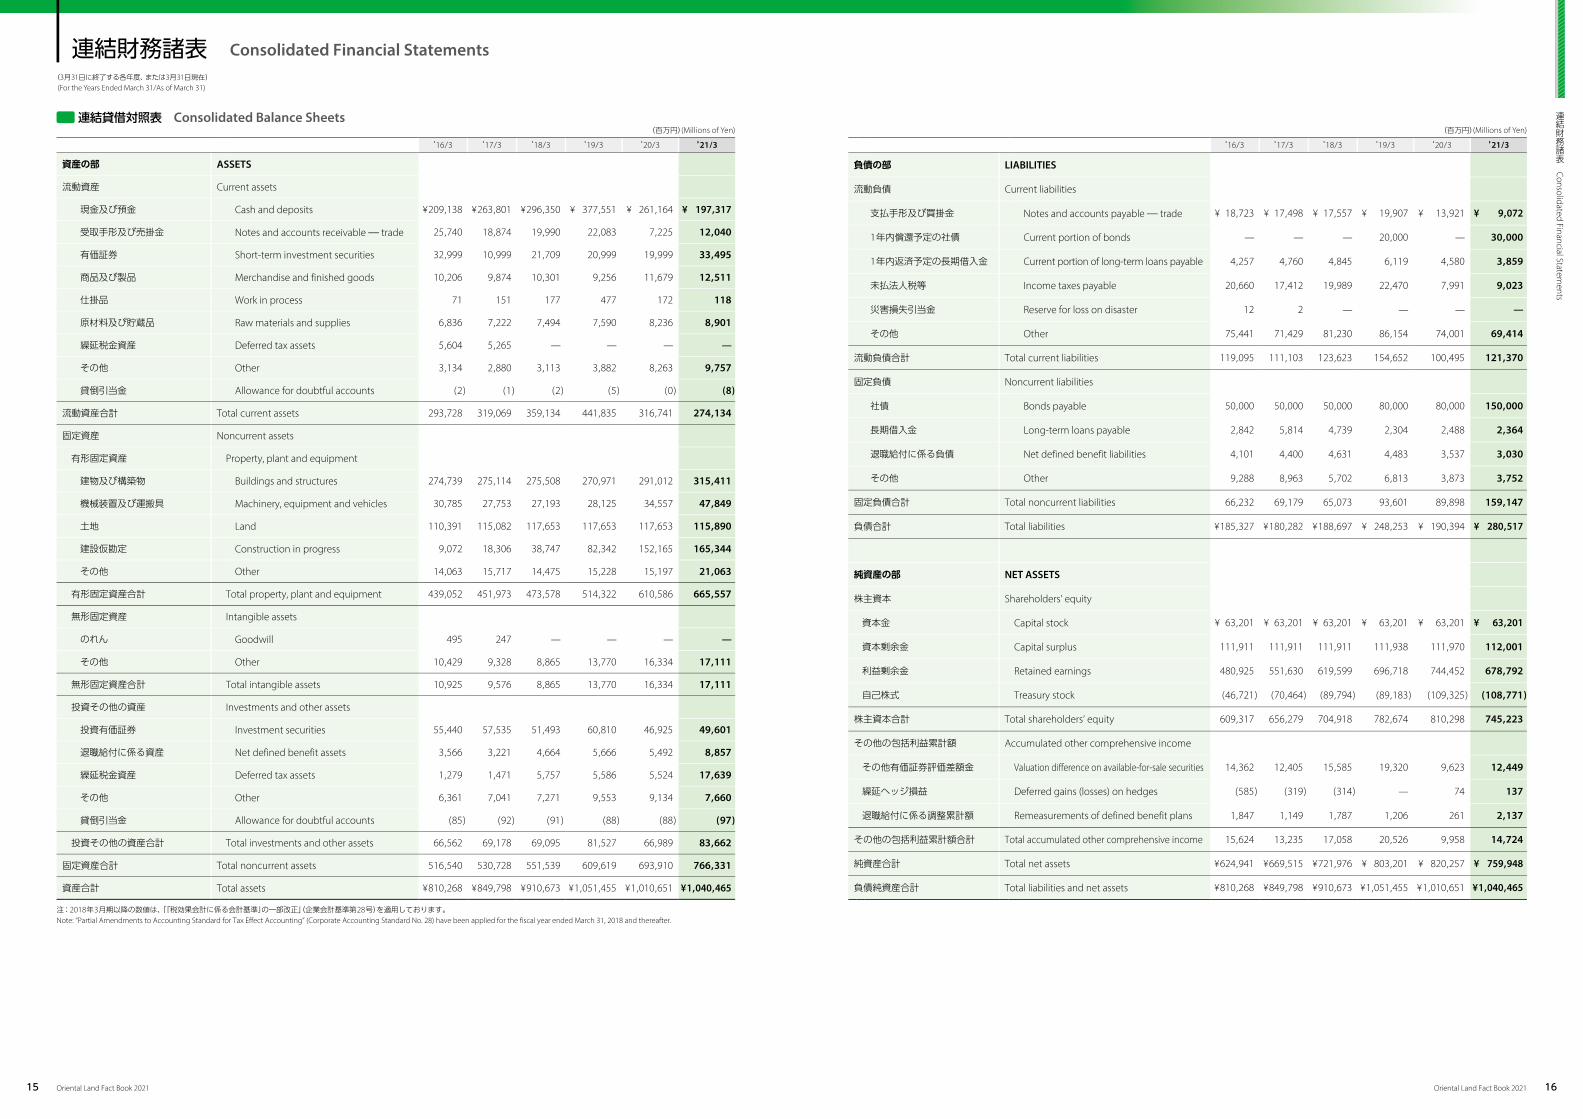
投資その他の資産合計 Total investments and other assets 66,562 69,178 69,095 81,527 66,989 83,662
固定資産合計 Total noncurrent assets 516,540 530,728 551,539 609,619 693,910 766,331
資産合計 Total assets ¥810,268 ¥849,798 ¥910,673 ¥1,051,455 ¥1,010,651 ¥1,040,465
注: 2018年3月期以降の数値は、「『税効果会計に係る会計基準』の一部改正」(企業会計基準第28号)を適用しております。Note: “Partial Amendments to Accounting Standard for Tax Effect Accounting” (Corporate Accounting Standard No. 28) have been applied for the fiscal year ended March 31, 2018 and thereafter.
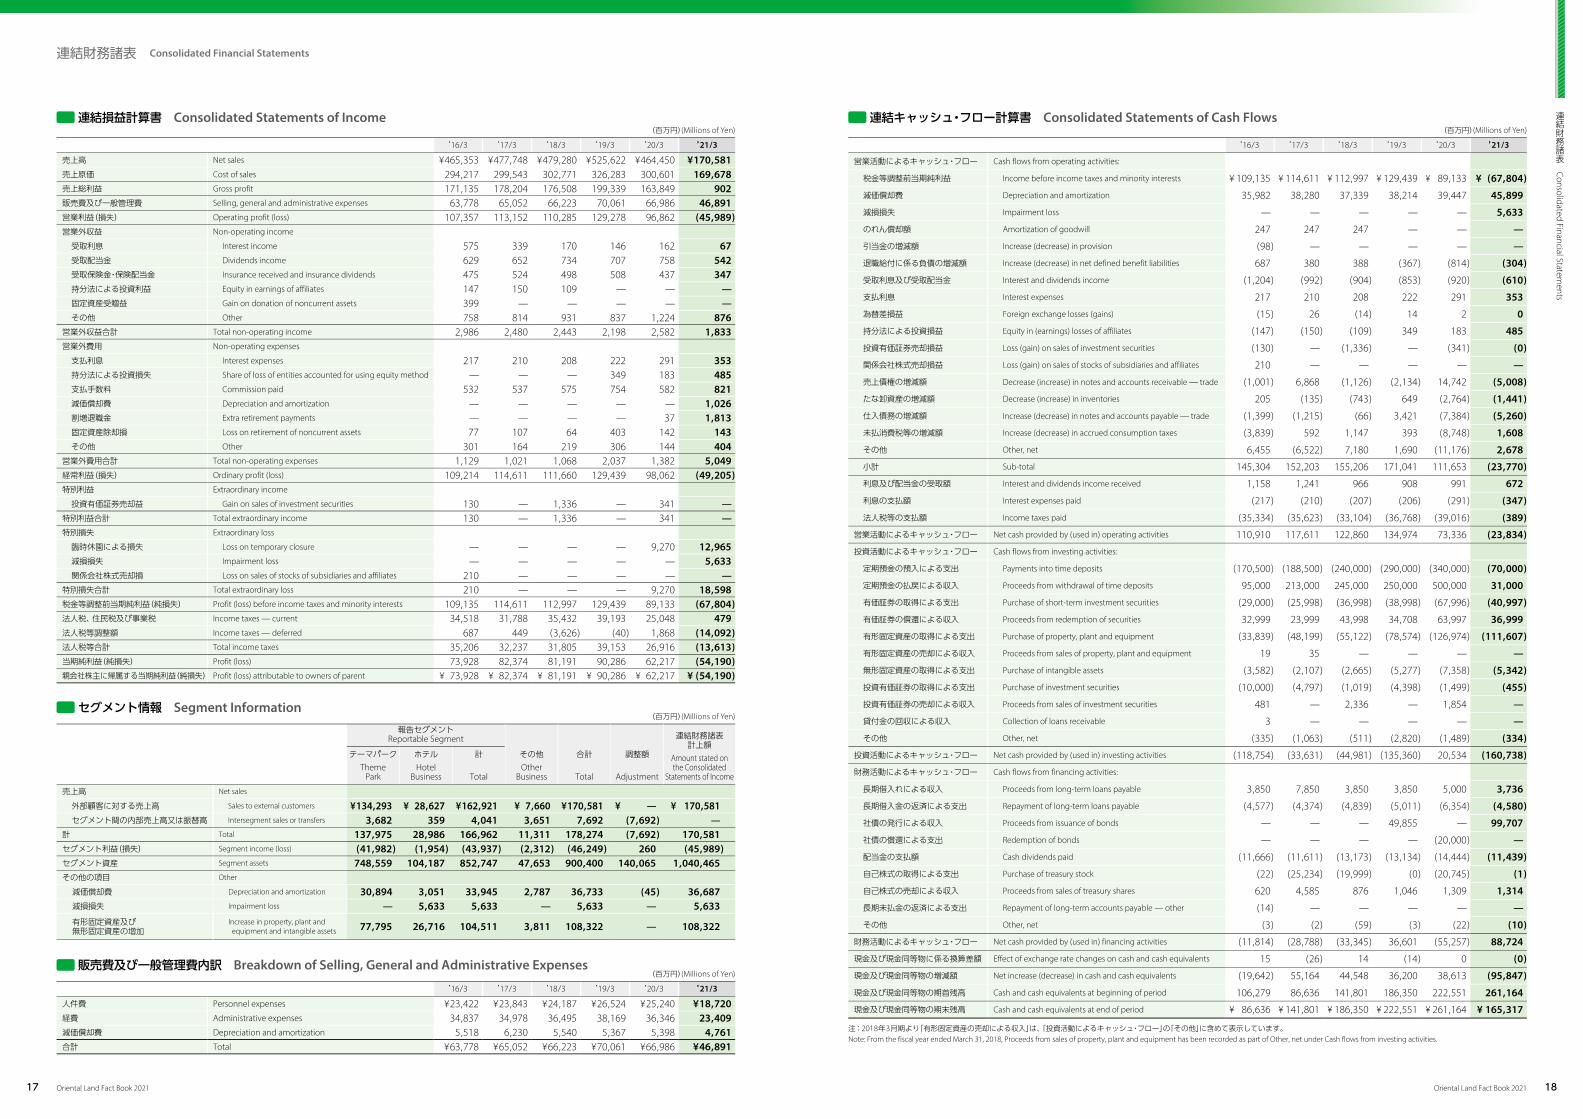
投資有価証券売却益 Gain on sales of investment securities 130 ̶ 1,336 ̶ 341 ̶特別利益合計 Total extraordinary income 130 ̶ 1,336 ̶ 341 ̶特別損失 Extraordinary loss
臨時休園による損失 Loss on temporary closure ̶ ̶ ̶ ̶ 9,270 12,965減損損失 Impairment loss ̶ ̶ ̶ ̶ ̶ 5,633関係会社株式売却損 Loss on sales of stocks of subsidiaries and affiliates 210 ̶ ̶ ̶ ̶ ̶
特別損失合計 Total extraordinary loss 210 ̶ ̶ ̶ 9,270 18,598税金等調整前当期純利益(純損失) Profit (loss) before income taxes and minority interests 109,135 114,611 112,997 129,439 89,133 (67,804)法人税、住民税及び事業税 Income taxes — current 34,518 31,788 35,432 39,193 25,048 479法人税等調整額 Income taxes — deferred 687 449 (3,626) (40) 1,868 (14,092)法人税等合計 Total income taxes 35,206 32,237 31,805 39,153 26,916 (13,613)当期純利益(純損失) Profit (loss) 73,928 82,374 81,191 90,286 62,217 (54,190)親会社株主に帰属する当期純利益(純損失) Profit (loss) attributable to owners of parent ¥ 73,928 ¥ 82,374 ¥ 81,191 ¥ 90,286 ¥ 62,217 ¥ (54,190)
販売費及び一般管理費内訳 Breakdown of Selling, General and Administrative Expenses (百万円)(Millions of Yen)
持分法による投資損益 Equity in (earnings) losses of affiliates (147) (150) (109) 349 183 485
投資有価証券売却損益 Loss (gain) on sales of investment securities (130) ̶ (1,336) ̶ (341) (0)
関係会社株式売却損益 Loss (gain) on sales of stocks of subsidiaries and affiliates 210 ̶ ̶ ̶ ̶ ̶売上債権の増減額 Decrease (increase) in notes and accounts receivable ̶ trade (1,001) 6,868 (1,126) (2,134) 14,742 (5,008)
自己株式の売却による収入 Proceeds from sales of treasury shares 620 4,585 876 1,046 1,309 1,314
長期未払金の返済による支出 Repayment of long-term accounts payable — other (14) ̶ ̶ ̶ ̶ ̶その他 Other, net (3) (2) (59) (3) (22) (10)
財務活動によるキャッシュ・フロー Net cash provided by (used in) financing activities (11,814) (28,788) (33,345) 36,601 (55,257) 88,724
現金及び現金同等物に係る換算差額 Effect of exchange rate changes on cash and cash equivalents 15 (26) 14 (14) 0 (0)
現金及び現金同等物の増減額 Net increase (decrease) in cash and cash equivalents (19,642) 55,164 44,548 36,200 38,613 (95,847)
現金及び現金同等物の期首残高 Cash and cash equivalents at beginning of period 106,279 86,636 141,801 186,350 222,551 261,164現金及び現金同等物の期末残高 Cash and cash equivalents at end of period ¥ 86,636 ¥ 141,801 ¥ 186,350 ¥ 222,551 ¥ 261,164 ¥ 165,317
注: 2018年3月期より「有形固定資産の売却による収入」は、「投資活動によるキャッシュ・フロー」の「その他」に含めて表示しています。Note: From the fiscal year ended March 31, 2018, Proceeds from sales of property, plant and equipment has been recorded as part of Other, net under Cash flows from investing activities.
連結財務諸表 Consolidated Financial Statements
連結財務諸表 Consolidated Financial Statem
ents
Oriental Land Fact Book 2021 Oriental Land Fact Book 202119 20
(For the Years Ended March 31/As of March 31)(3月31日に終了する各年度、または3月31日現在)
単体財務諸表 Nonconsolidated Financial Statements
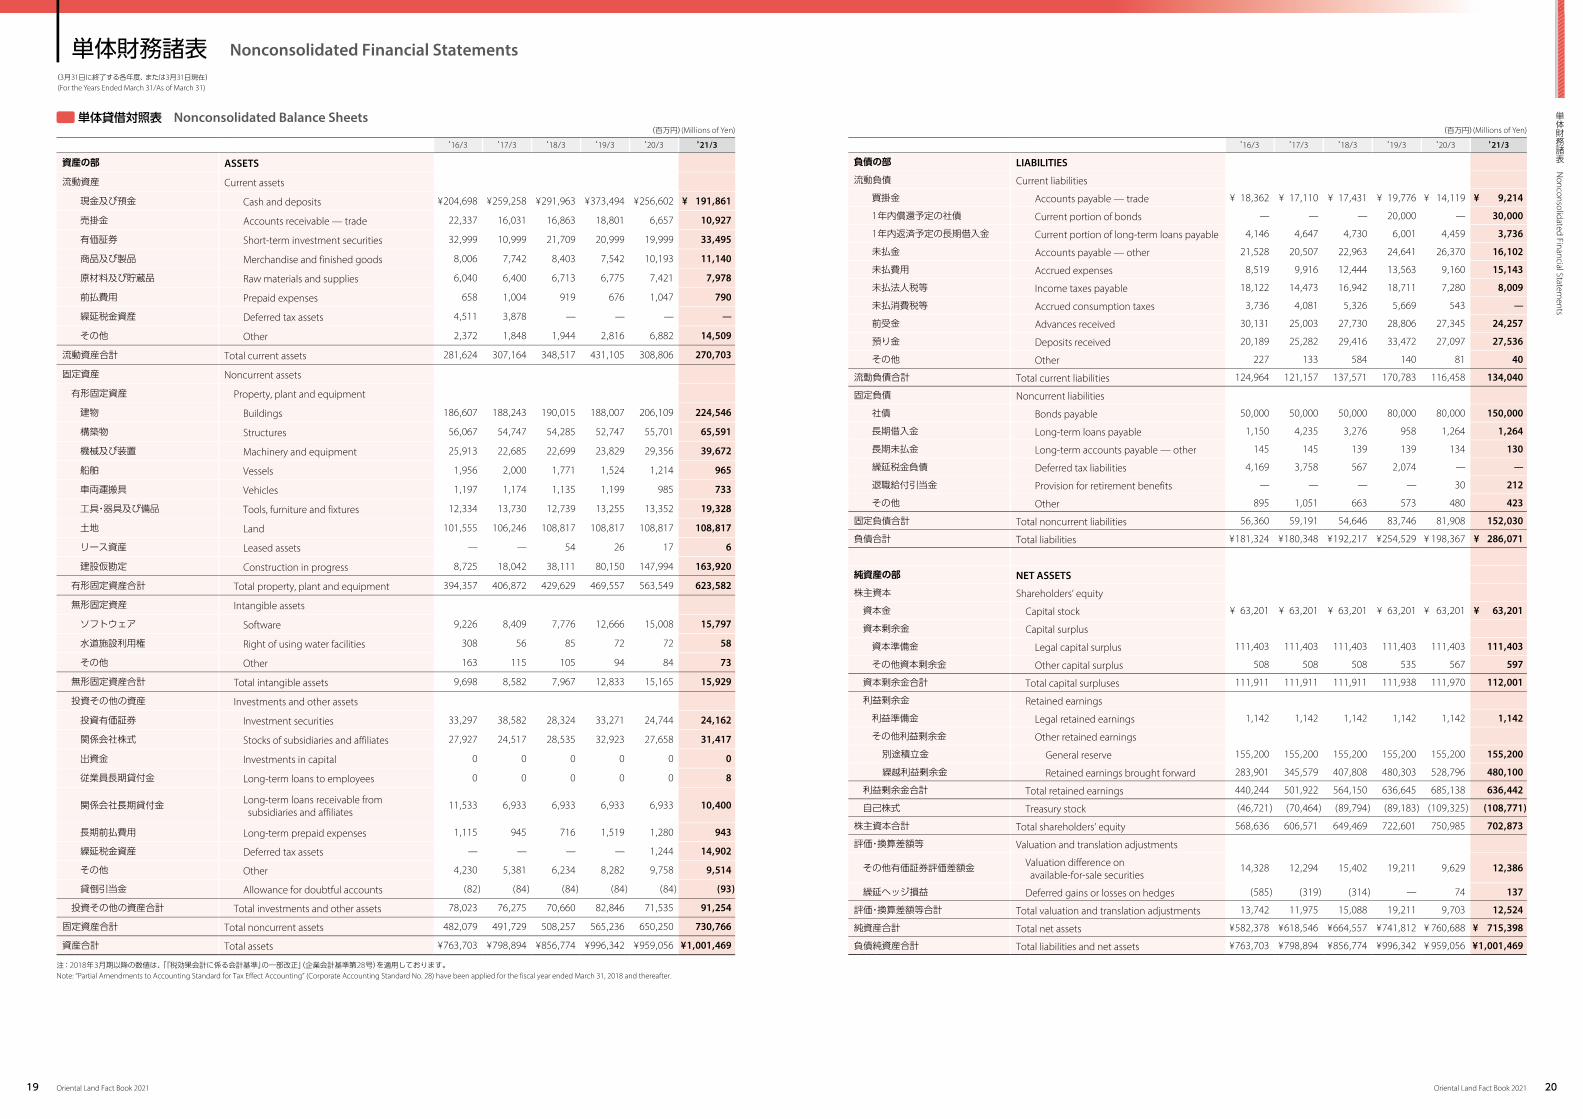
単体貸借対照表 Nonconsolidated Balance Sheets (百万円)(Millions of Yen)
投資その他の資産合計 Total investments and other assets 78,023 76,275 70,660 82,846 71,535 91,254
固定資産合計 Total noncurrent assets 482,079 491,729 508,257 565,236 650,250 730,766
資産合計 Total assets ¥763,703 ¥798,894 ¥856,774 ¥996,342 ¥959,056 ¥1,001,469
注: 2018年3月期以降の数値は、「『税効果会計に係る会計基準』の一部改正」(企業会計基準第28号)を適用しております。Note: “Partial Amendments to Accounting Standard for Tax Effect Accounting” (Corporate Accounting Standard No. 28) have been applied for the fiscal year ended March 31, 2018 and thereafter.
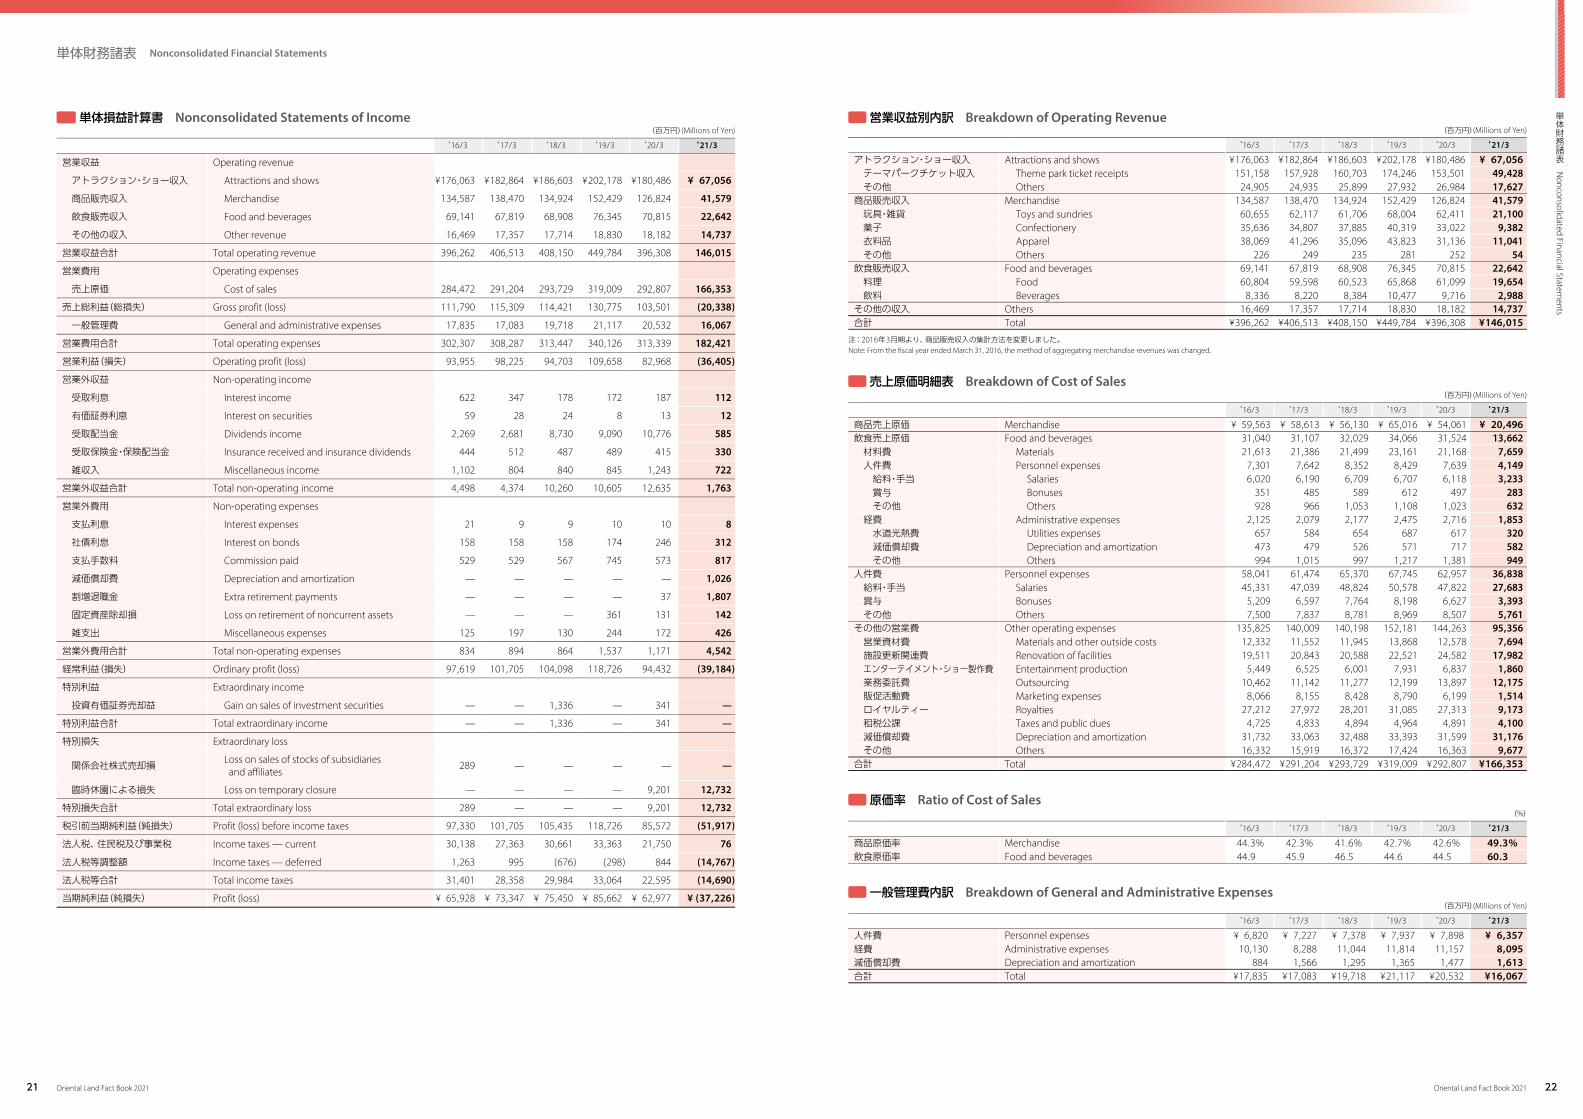
その他の営業費 Other operating expenses 135,825 140,009 140,198 152,181 144,263 95,356営業資材費 Materials and other outside costs 12,332 11,552 11,945 13,868 12,578 7,694施設更新関連費 Renovation of facilities 19,511 20,843 20,588 22,521 24,582 17,982エンターテイメント・ショー製作費 Entertainment production 5,449 6,525 6,001 7,931 6,837 1,860業務委託費 Outsourcing 10,462 11,142 11,277 12,199 13,897 12,175販促活動費 Marketing expenses 8,066 8,155 8,428 8,790 6,199 1,514ロイヤルティー Royalties 27,212 27,972 28,201 31,085 27,313 9,173租税公課 Taxes and public dues 4,725 4,833 4,894 4,964 4,891 4,100減価償却費 Depreciation and amortization 31,732 33,063 32,488 33,393 31,599 31,176その他 Others 16,332 15,919 16,372 17,424 16,363 9,677
合計 Total ¥284,472 ¥291,204 ¥293,729 ¥319,009 ¥292,807 ¥166,353
単体財務諸表 Nonconsolidated Financial Statements
単体財務諸表 N
onconsolidated Financial Statements
Oriental Land Fact Book 2021 Oriental Land Fact Book 202123 24
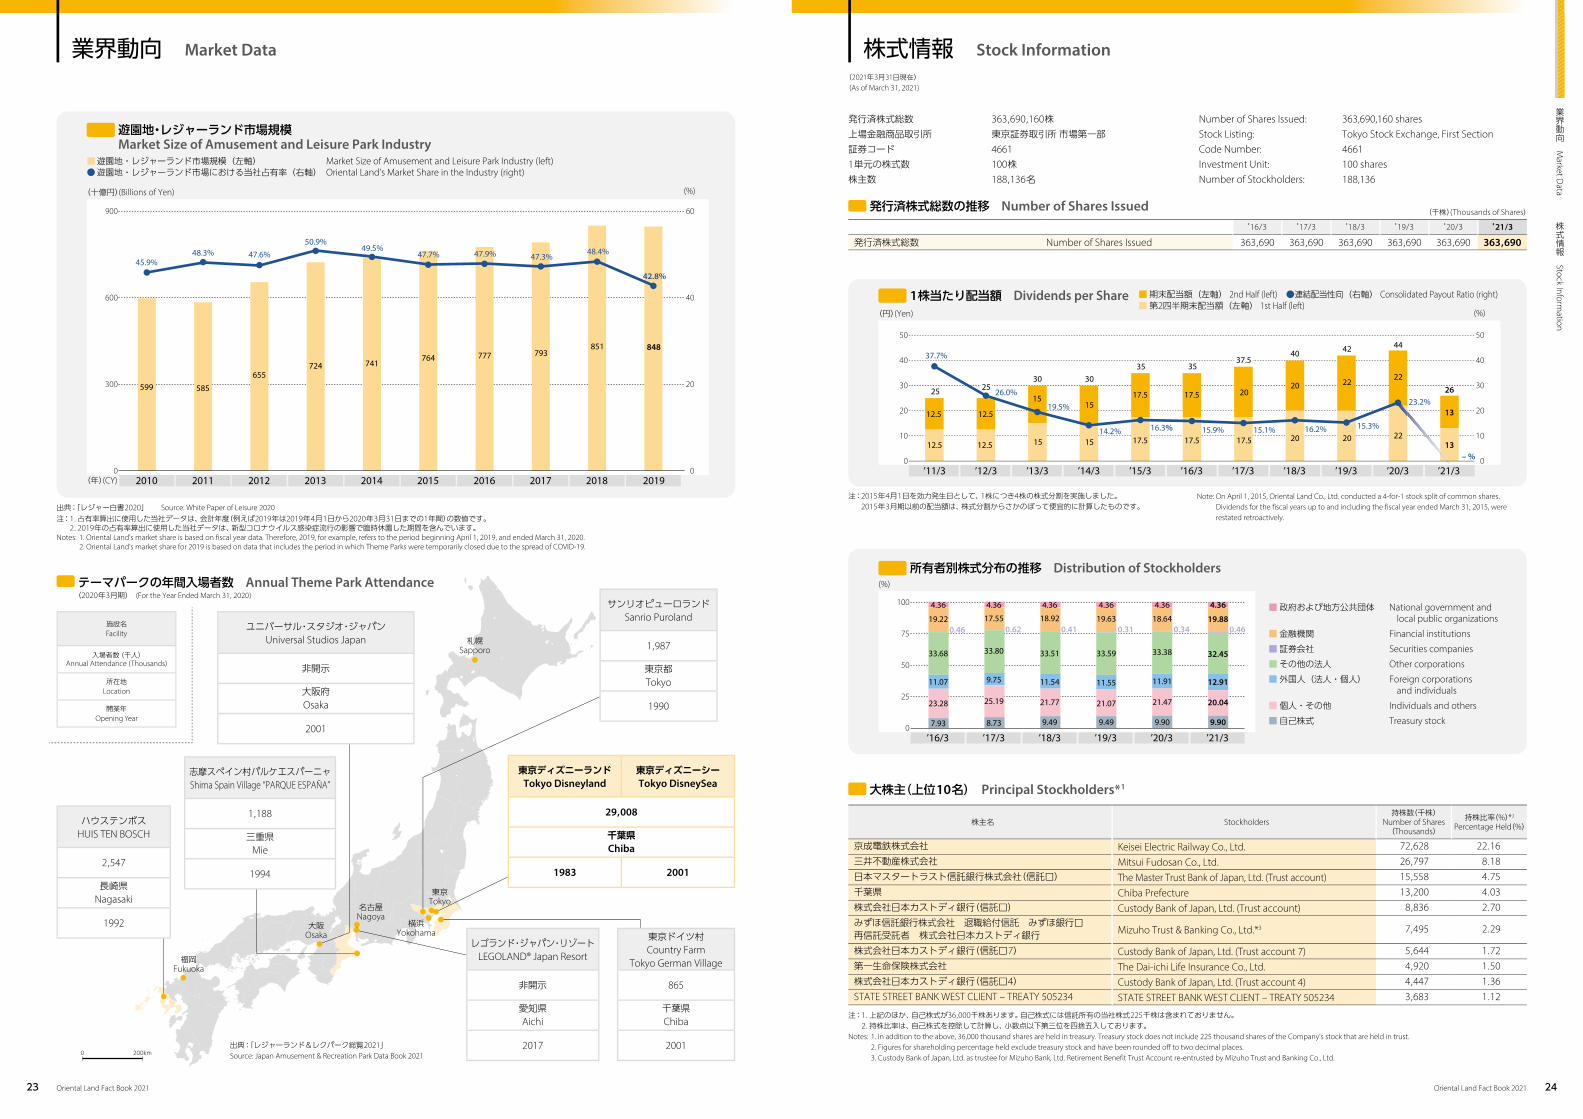
(2020年3月期) (For the Year Ended March 31, 2020)テーマパークの年間入場者数 Annual Theme Park Attendance
(As of March 31, 2021)(2021年3月31日現在)
株式情報 Stock Information業界動向 Market Data
株主名 Stockholders持株数(千株)
Number of Shares (Thousands)
持株比率(%)*2
Percentage Held(%)
京成電鉄株式会社 Keisei Electric Railway Co., Ltd. 72,628 22.16三井不動産株式会社 Mitsui Fudosan Co., Ltd. 26,797 8.18日本マスタートラスト信託銀行株式会社(信託口) The Master Trust Bank of Japan, Ltd. (Trust account) 15,558 4.75千葉県 Chiba Prefecture 13,200 4.03株式会社日本カストディ銀行(信託口) Custody Bank of Japan, Ltd. (Trust account) 8,836 2.70みずほ信託銀行株式会社 退職給付信託 みずほ銀行口再信託受託者 株式会社日本カストディ銀行 Mizuho Trust & Banking Co., Ltd.*3 7,495 2.29
株式会社日本カストディ銀行(信託口7) Custody Bank of Japan, Ltd. (Trust account 7) 5,644 1.72第一生命保険株式会社 The Dai-ichi Life Insurance Co., Ltd. 4,920 1.50株式会社日本カストディ銀行(信託口4) Custody Bank of Japan, Ltd. (Trust account 4) 4,447 1.36STATE STREET BANK WEST CLIENT – TREATY 505234 STATE STREET BANK WEST CLIENT – TREATY 505234 3,683 1.12
注: 1. 上記のほか、自己株式が36,000千株あります。自己株式には信託所有の当社株式225千株は含まれておりません。 2. 持株比率は、自己株式を控除して計算し、小数点以下第三位を四捨五入しております。Notes: 1. In addition to the above, 36,000 thousand shares are held in treasury. Treasury stock does not include 225 thousand shares of the Company’s stock that are held in trust. 2. Figures for shareholding percentage held exclude treasury stock and have been rounded off to two decimal places. 3. Custody Bank of Japan, Ltd. as trustee for Mizuho Bank, Ltd. Retirement Benefit Trust Account re-entrusted by Mizuho Trust and Banking Co., Ltd.
大株主(上位10名) Principal Stockholders*1
(千株)(Thousands of Shares)
’16/3 ’17/3 ’18/3 ’19/3 ’20/3 ’21/3
発行済株式総数 Number of Shares Issued 363,690 363,690 363,690 363,690 363,690 363,690
Number of Shares Issued: 363,690,160 sharesStock Listing: Tokyo Stock Exchange, First SectionCode Number: 4661Investment Unit: 100 sharesNumber of Stockholders: 188,136
(%)
100
50
75
25
0’16/37.93
19.22
33.68
11.07
23.28
4.36
0.46
’17/3 ’18/3 ’19/38.73
17.55
33.80
9.75
25.19
4.36
0.62
9.49
18.92
33.51
11.54
21.77
4.36
0.41
9.49
19.63
33.59
11.55
21.07
4.36
0.31
9.90
18.64
33.38
11.91
21.47
4.36
0.34
’20/3
9.90
19.88
32.45
12.91
20.04
4.36
0.46
’21/3
■ 政府および地方公共団体 National government and local public organizations
■ 金融機関 Financial institutions
■ 証券会社 Securities companies
■ その他の法人 Other corporations
■ 外国人(法人・個人) Foreign corporations and individuals
■ 個人・その他 Individuals and others
■ 自己株式 Treasury stock
■ 遊園地・レジャーランド市場規模(左軸) Market Size of Amusement and Leisure Park Industry (left)● 遊園地・レジャーランド市場における当社占有率(右軸) Oriental Land’s Market Share in the Industry (right)
(十億円)(Billions of Yen) (%)
2010 2011 2012 2013 2014 2015 2016 2017 2018 2019
900
600
300
0
60
40
20
0
724 741655
50.9%49.5%
764
47.7%
777 793
47.9% 47.3%
851 848
48.4%
42.8%
47.6%48.3%
585
45.9%
599
遊園地・レジャーランド市場規模 Market Size of Amusement and Leisure Park Industry
Note: On April 1, 2015, Oriental Land Co., Ltd. conducted a 4-for-1 stock split of common shares. Dividends for the fiscal years up to and including the fiscal year ended March 31, 2015, were restated retroactively.
出典:「レジャー白書2020」 Source: White Paper of Leisure 2020注: 1. 占有率算出に使用した当社データは、会計年度(例えば2019年は2019年4月1日から2020年3月31日までの1年間)の数値です。 2. 2019年の占有率算出に使用した当社データは、新型コロナウイルス感染症流行の影響で臨時休園した期間を含んでいます。Notes: 1. Oriental Land’s market share is based on fiscal year data. Therefore, 2019, for example, refers to the period beginning April 1, 2019, and ended March 31, 2020. 2. Oriental Land’s market share for 2019 is based on data that includes the period in which Theme Parks were temporarily closed due to the spread of COVID-19.
0 200km
札幌Sapporo
福岡Fukuoka
東京Tokyo
横浜Yokohama
名古屋Nagoya
大阪Osaka
志摩スペイン村パルケエスパーニャShima Spain Village “PARQUE ESPAÑA”
1,188
三重県Mie
1994
出典:「レジャーランド&レクパーク総覧2021」Source: Japan Amusement & Recreation Park Data Book 2021
Notes: 1. Oriental Land’s fiscal year ends on March 31. For the purposes of this report, for example, ’21/3 is used to indicate data for the period beginning April 1, 2020, and ended March 31, 2021, or as of March 31, 2021.
2. The financial figures in this report are based on Japanese Accounting Standards and accompanying laws, and may vary from those presented in the annual report.
3. Figures pertaining to information on Tokyo Disney Resort have been rounded. Financial figures have been truncated.