Fact finding mission or Facts, Findings, Missions as it looks from a viewpoint of a Hungarian Banker from Bucharest Budapest International Business Center Conference 2013 Panel discussion - Financial Services Budapest March 22, 2013 György Gáldi - Deputy CEO, Member of Management Board OTP Bank Romania S.A.
Transcript
Fact finding mission or
Facts, Findings, Missionsas it looks from a viewpoint of a Hungarian Banker from Bucharest
Budapest International Business Center Conference 2013Panel discussion - Financial Services
BudapestMarch 22, 2013
György Gáldi - Deputy CEO, Member of Management Board OTP Bank Romania S.A.
Content of this unusual SLIDESHOW
Showing up Facts and Findings with respect to main figures/features of the new (i.e. joined during the last decade) EU member-states from Central and South Eastern Europe about:
– Banking sector
– FDI flow & stock developments
– Foreign trading developments
in order to determine the potential Missions to be fulfilled by banks acting as financial intermediaries.
WARNING!
FASTEN YOUR SEATBELTS! EXPECTED SPEED: 20-30 Sec/slides
2
Introduction
3
Eurozone, 17 member states (including Slovakia)
PolandRegion
Region includes:Czech Republic
SlovakiaHungaryRomaniaBulgaria
Source: Eurostat, OTP research
4
70
75
80
85
90
95
100
105
110
115
Region Poland Eurozone
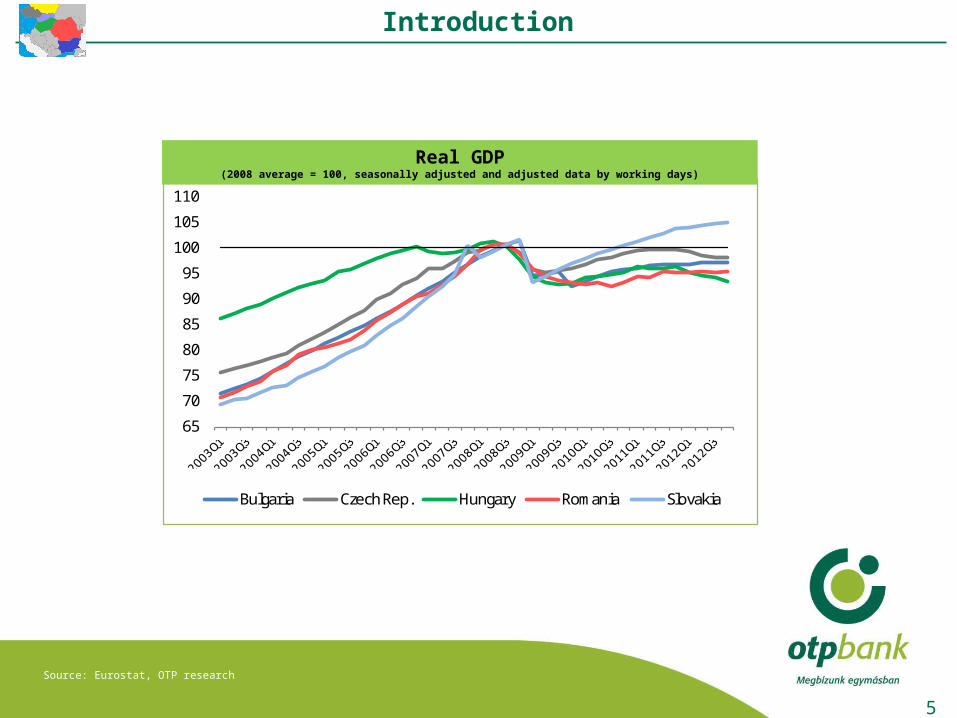
Real GDP(2008 average = 100, seasonally adjusted and adjusted data by working days)
Introduction
5
65
70
75
80
85
90
95
100
105
110
Bulgaria Czech Rep. Hungary Romania Slovakia
Real GDP(2008 average = 100, seasonally adjusted and adjusted data by working days)
Source: Eurostat, OTP research
Introduction
493 381
9,483
-
2,000
4,000
6,000
8,000
10,000
Region Poland Eurozone
GDP at current prices(bln EUR, 2012)
6
Source: Eurostat, OTP research
Introduction
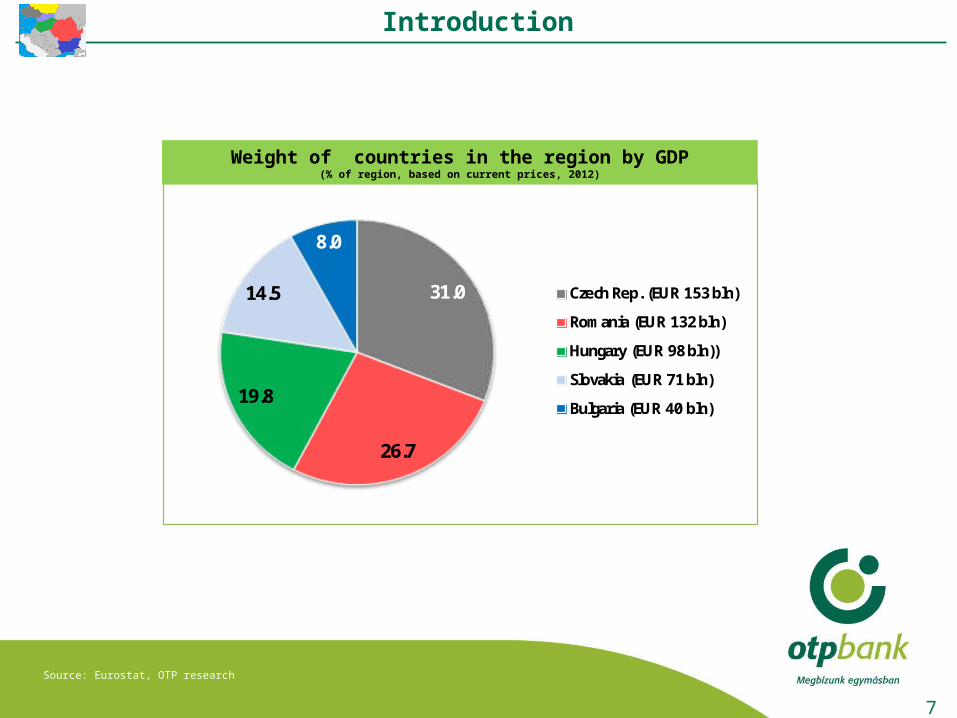
31.0
26.7
19.8
14.5
8.0
Czech Rep. (EUR 153 bln)
Romania (EUR 132 bln)
Hungary (EUR 98 bln))
Slovakia (EUR 71 bln)
Bulgaria (EUR 40 bln)
Weight of countries in the region by GDP(% of region, based on current prices, 2012)
7
Source: Eurostat, OTP research
Introduction
Banking sector
8
Source: ECB, OTP research
Banking sector - Assets
500 355
32,699
0
5,000
10,000
15,000
20,000
25,000
30,000
35,000
Region Poland Eurozone
Aggregated assets of the banking sectors(bln EUR, December 2012)
9
Source: ECB, OTP research
Banking sector - Assets
38.4
22.3
18.3
12.0
9.1
Czech Rep.
Hungary
Romania
Slovakia
Bulgaria
Weight of countries in the region by aggregated assets(% of region, December 2012)
10
Note: only private loans are includedSource: ECB, Eurostat, OTP research
Banking sector – Assets and Loans
11
125 114 11484 69
101 93
345
0
50
100
150
200
250
300
350
400
Czech Rep.
Bulgaria Hungary Slovakia Romania Region Poland Eurozone
Assets Loans
Aggregated assets and loans to GDP(%, 2012)
12
Banking sector – Loans
41
37
53
44
26
39
31
61
47 4643
33
4446
20
25
30
35
40
45
50
55
60
65
Bulgaria Czech Rep. Hungary Slovakia Romania Region Poland
2006 2012
Loans to GDP ratio compared to the Eurozone(Eurozone = 100)
Note: only private loans are includedSource: ECB, Eurostat, OTP research
13
Banking sector – Loans
55
65
75
85
95
105
115
125
135
145D
ec-0
6
Mar
-07
Jun-
07
Sep-
07
Dec
-07
Mar
-08
Jun-
08
Sep-
08
Dec
-08
Mar
-09
Jun-
09
Sep-
09
Dec
-09
Mar
-10
Jun-
10
Sep-
10
Dec
-10
Mar
-11
Jun-
11
Sep-
11
Dec
-11
Mar
-12
Jun-
12
Sep-
12
Dec
-12
Region Poland Eurozone
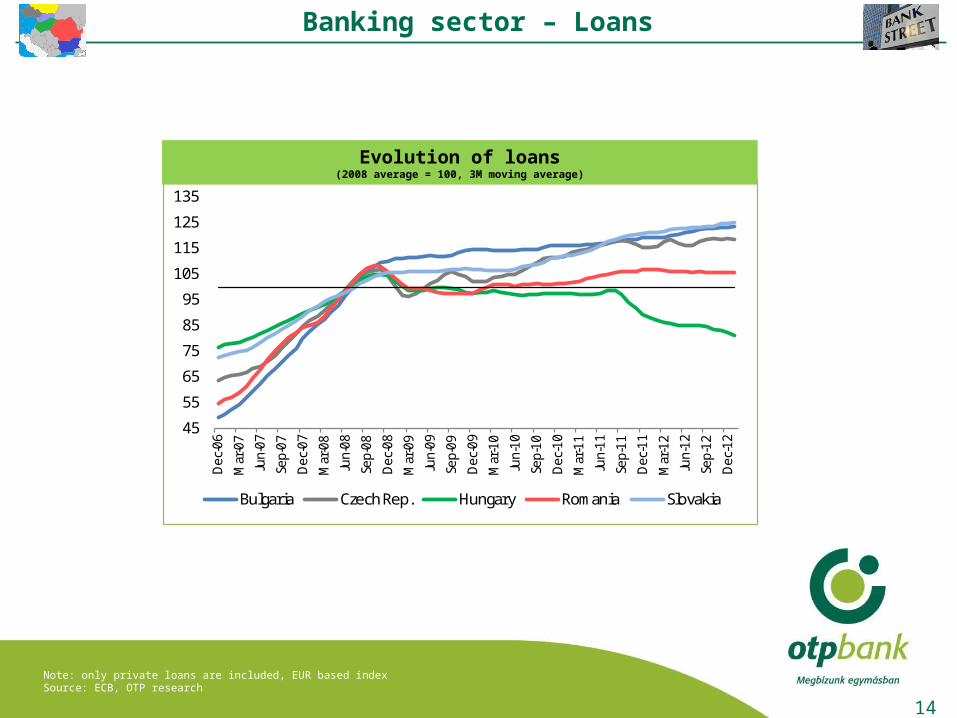
Evolution of loans(2008 average = 100, 3M moving average)
Note: only private loans are included, EUR based indexSource: ECB, OTP research
14
45
55
65
75
85
95
105
115
125
135D
ec-0
6
Mar
-07
Jun-
07
Sep-
07
Dec
-07
Mar
-08
Jun-
08
Sep-
08
Dec
-08
Mar
-09
Jun-
09
Sep-
09
Dec
-09
Mar
-10
Jun-
10
Sep-
10
Dec
-10
Mar
-11
Jun-
11
Sep-
11
Dec
-11
Mar
-12
Jun-
12
Sep-
12
Dec
-12
Bulgaria Czech Rep. Hungary Romania Slovakia
Evolution of loans(2008 average = 100, 3M moving average)
Banking sector – Loans
Note: only private loans are included, EUR based indexSource: ECB, OTP research
Banking sector – Deposits
15
64
55
68
51
32
53
44
6360
50
42
30
4846
20
30
40
50
60
70
80
Czech Rep. Bulgaria Slovakia Hungary Romania Region Poland
2006 2012
Deposits to GDP ratio compared to the Eurozone(Eurozone = 100)
Note: only private deposits are includedSource: ECB, Eurostat, OTP research
16
Banking sector – Deposits
70
80
90
100
110
120
130
140D
ec-0
6
Mar
-07
Jun-
07
Sep-
07
Dec
-07
Mar
-08
Jun-
08
Sep-
08
Dec
-08
Mar
-09
Jun-
09
Sep-
09
Dec
-09
Mar
-10
Jun-
10
Sep-
10
Dec
-10
Mar
-11
Jun-
11
Sep-
11
Dec
-11
Mar
-12
Jun-
12
Sep-
12
Dec
-12
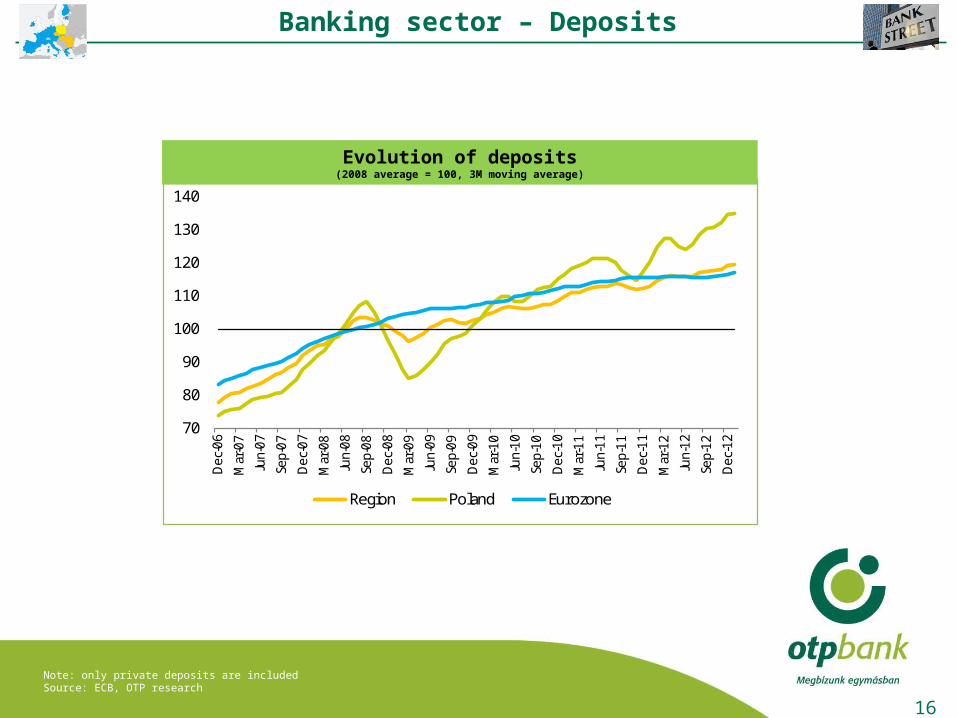
Region Poland Eurozone
Evolution of deposits(2008 average = 100, 3M moving average)
Note: only private deposits are includedSource: ECB, OTP research
Banking sector – Deposits
17
60
70
80
90
100
110
120
130
140
150D
ec-0
6
Mar
-07
Jun-
07
Sep-
07
Dec
-07
Mar
-08
Jun-
08
Sep-
08
Dec
-08
Mar
-09
Jun-
09
Sep-
09
Dec
-09
Mar
-10
Jun-
10
Sep-
10
Dec
-10
Mar
-11
Jun-
11
Sep-
11
Dec
-11
Mar
-12
Jun-
12
Sep-
12
Dec
-12
Bulgaria Czech Rep. Hungary Romania Slovakia
Evolution of deposits(2008 average = 100, 3M moving average)
Note: only private deposits are includedSource: ECB, OTP research
18
Banking sector – Loans to deposits
80
85
90
95
100
105
110
115
120
125D
ec-0
6
Mar
-07
Jun-
07
Sep-
07
Dec
-07
Mar
-08
Jun-
08
Sep-
08
Dec
-08
Mar
-09
Jun-
09
Sep-
09
Dec
-09
Mar
-10
Jun-
10
Sep-
10
Dec
-10
Mar
-11
Jun-
11
Sep-
11
Dec
-11
Mar
-12
Jun-
12
Sep-
12
Dec
-12
Region Poland Eurozone
Loans to deposits ratio(%, 3M moving average)
Note: only private loans and deposits are includedSource: ECB, OTP research
Banking sector – Loans to deposits
19
60708090
100110120130140150160
Dec
-06
Mar
-07
Jun-
07
Sep-
07
Dec
-07
Mar
-08
Jun-
08
Sep-
08
Dec
-08
Mar
-09
Jun-
09
Sep-
09
Dec
-09
Mar
-10
Jun-
10
Sep-
10
Dec
-10
Mar
-11
Jun-
11
Sep-
11
Dec
-11
Mar
-12
Jun-
12
Sep-
12
Dec
-12
Bulgaria Czech Rep. Hungary Romania Slovakia
Loans to deposits ratio(%, 3M moving average)
Note: only private loans and deposits are includedSource: ECB, OTP research
FDI stock and flow developments
20
Note: intra FDI flows are includedSource: Eurostat, OTP research
FDI stock and flow developments
21
9.518.0
25.9 29.2 29.4 28.2
9.5 11.0 12.7
4.3
10.4
8.3
15.6 17.2
10.1
9.8 10.513.6
0.0
5.0
10.0
15.0
20.0
25.0
30.0
35.0
40.0
45.0
50.0
2003 2004 2005 2006 2007 2008 2009 2010 2011
Region Poland
Inward FDI flows(bln EUR)
20 15 1221
31 24 2610 14
20 2236 15
26
1622
42 31
20 20
24
20
10
1515
15 29
21 29
20
3125
34
3720 14
20 14 8 13 9 11 12 12
0.0
10.0
20.0
30.0
40.0
50.0
60.0
70.0
80.0
90.0
100.0
2003 2004 2005 2006 2007 2008 2009 2010 2011
Bulgaria Czech Rep. Hungary Romania Slovakia
Shares of the inward FDI flows in the region(%)
FDI stock and flow developments
22
96 126 157201
239 260 277 290 29046
6377
95
121117
129161 152
0.0
50.0
100.0
150.0
200.0
250.0
300.0
350.0
400.0
450.0
500.0
2003 2004 2005 2006 2007 2008 2009 2010 2011
Region Poland
FDI stocks(bln EUR)
5 6 7 9 11 12 12 12 13
37 33 33 30 32 31 32 33 33
35 36 33 31 27 24 25 23 22
10 12 14 17 18 19 18 18 19
13 13 13 13 12 14 13 13 14
0.0
10.0
20.0
30.0
40.0
50.0
60.0
70.0
80.0
90.0
100.0
2003 2004 2005 2006 2007 2008 2009 2010 2011
Bulgaria Czech Rep. Hungary Romania Slovakia
Shares of the FDI stocks in the region(%)
Note: intra FDI stocks are includedSource: Eurostat, OTP research
FDI stock and flow developments
23
96
64 60 57
42
59
41
88
0
20
40
60
80
100
120
Bulgaria Hungary Czech Rep.
Slovakia Romania Region Poland Eurozone
Inward FDI stock to GDP(%, 2011)
Note: intra FDI stocks are included. For example in case of the Eurozone the FDI stock / GDP ratio would be only about 46% if the intra FDI stocks are excluded.Source: Eurostat, OTP research
FDI stock and flow developments
24
9.07.4 6.4
5.02.9
5.33.9
25.0
0
5
10
15
20
25
30
Czech Rep.
Slovakia Hungary Bulgaria Romania Region Poland Eurozone
Per capita inward FDI stock(1.000 EUR/capita, 2011)
Note: intra FDI stocks are included. In case of Romania the population took into consideration was 19,0 mln as of the last (2011) census and not the official number of approx. 21 mln.Source: Eurostat, Romanian National Institute of Statistics, OTP research
Source: Eurostat, National Bank of Romania, OTP research
FDI stock and flow developments
3,980
611
621
719
815
957
1,115
1,274
1,418
1,837
2,535
2,933
3,339
5,042
6,267
9,659
11,971
Others (7.2%)
16. Hungary (1.1%)
15. Turkey (1.1%)
14. United Kingdom (1.3%)
13. Czech Republic (1.5%)
12. Spain (1.7%)
11. Belgium (2%)
10. Luxembourg (2.3%)
9. United States (2.6%)
8. Switzerland (3.3%)
7. Cyprus (4.6%)
6. Greece (5.3%)
5. Italy (6.1%)
4. France (9.2%)
3. Germany (11.4%)
2. Austria (17.5%)
1. Netherlands (21.7%)
Top investors in Romania by inward FDI stock(% of total in brackets,mln EUR, 2011)
423
663739
870808
721
611
0
100
200
300
400
500
600
700
800
900
1,000
2005 2006 2007 2008 2009 2010 2011
Structure of inward FDI stock in Romania from Hungary(mln EUR, 2011)
TOTAL 611Services, from which: 341 - Wholesale and retail trade; repair of motor vehicles and motorcycles
186
- Financial and insurance activities 119Manufacturing, from which: 177 - Manufacture of petroleum, chemical, pharmaceutical, rubber and plastic products
111
Construction 45Mining and quarrying 27Water supply; sewerage, waste management and remediation activities
14
Others 7
Inward FDI stock in Romania from Hungary(mln EUR)
25
Note: at the calculation of rankings was took into consideration only the top 50 foreign investors by volume of share capital Source: ONRC, OTP research
FDI stock and flow developments
40,089
4,237
4,617
4,818
5,205
5,495
5,654
6,414
6,452
6,573
7,185
10,583
11,795
12,986
19,503
34,185
Others (21.6%)
15. Netherlands (2.3%)
14. UK (2.5%)
13. Spain (2.6%)
12. Cyprus (2.8%)
11. Greece (3%)
10. Syria (3%)
9. Israel (3.5%)
8. Austria (3.5%)
7. USA (3.5%)
6. France (3.9%)
5. China (5.7%)
4. Hungary (6.3%)
3. Turkey (7%)
2. Germany (10.5%)
1. Italy (18.4%)
Top investors in Romania by no. of companies(% of total in brackets, no., 2012)
26
4,3925,010
5,6316,535
7,985
9,40210,035
10,77711,262
11,795
4.5
5.0
5.5
6.0
6.5
7.0
0
2,000
4,000
6,000
8,000
10,000
12,000
14,000
2003 2004 2005 2006 2007 2008 2009 2010 2011 2012
No. % of total
Companies in Romania with Hungarian capital(no.)
Source: National Bank of Romania, OTP research
The structure of the FDI stock by development regions in bln EUR and percentage (2011)
BUCHAREST-ILFOV
34,0 (61,7%)
SOUTH-EAST 3,0 (5,4%)
NORTH - EAST 1,6 (2,9%)
NORTH - WEST 2,5 (4,5%)
CENTER4,2 (7,6%)
SOUTH-MUNTENIA 4,1 (7,4%)
SOUTH - WEST - OLTENIA 1,8 (3,3%)
WEST 4,0 (7,2%)
FDI stock and flow developments
27
Note: NCP estimations, Extra-Regions GDP - RON 0,7 bln (0,1%)Source: Romanian National Commission of Prognosis (NCP), OTP research
The structure of the GDP by development regions in bln RON and in percentage (2012)
BUCHAREST-ILFOV
147,1 (25,1%)
SOUTH-EAST 62,3 (10,6%)
NORTH - EAST 64,0 (10,9%)
NORTH - WEST 62,3 (10,6%)
CENTER67,9 (11,6%)
SOUTH-MUNTENIA 73,9 (12,6%)
SOUTH - WEST - OLTENIA
47,3 (8,1%)
WEST 59,6 (10,2%)
FDI stock and flow developments
28
Foreign trade developments
29
Foreign trade developments
30
123 149 170 206245 271
221274
321 33248
6072
88102
116
98
120
136 143
0.0
50.0
100.0
150.0
200.0
250.0
300.0
350.0
400.0
450.0
500.0
2003 2004 2005 2006 2007 2008 2009 2010 2011 2012
Region Poland
Export of goods(bln EUR)
5 5 5 6 6 6 5 6 6 6
35 37 37 37 37 37 37 37 37 37
31 30 30 29 28 27 27 26 25 24
13 13 13 13 12 12 13 14 14 14
16 15 15 16 17 18 18 18 18 19
0.0
10.0
20.0
30.0
40.0
50.0
60.0
70.0
80.0
90.0
100.0
2003 2004 2005 2006 2007 2008 2009 2010 2011 2012
Bulgaria Czech Rep. Hungary Romania Slovakia
Shares in the export of goods in the region(%)
Note: intra trades are includedSource: Eurostat, OTP research
31
8983 80
52
34
67
37 37
0
10
20
30
40
50
60
70
80
90
100
Slovakia Hungary Czech Rep.
Bulgaria Romania Region Poland Eurozone
Volume of export of goods to GDP(%, 2012)
Foreign trade developments
Note: intra trades are includedSource: Eurostat, OTP research
32
11.7 11.6
8.1
2.8 2.4
6.4
3.7
10.5
0.0
2.0
4.0
6.0
8.0
10.0
12.0
14.0
Slovakia Czech Rep.
Hungary Bulgaria Romania Region Poland Eurozone
Per capita export of goods(1.000 EUR/capita, 2012)
Foreign trade developments
Note: intra trades are included. In case of Romania the population took into consideration was 19,0 mln as of the last (2011) census and not the official number of approx. 21 mln.Source: Eurostat, Romanian National Institute of Statistics, OTP research
Source: Romanian National Institute of Statistics, Eurostat, OTP research
75
85
95
105
115
125
EU27 Bulgaria Czech Republic Hungary Romania Slovakia
Industrial production(series adjusted by number of working days and seasonality)
34
139 167 188 229273 303
227277
319 3256072
82101
121142
107
134151 153
0.0
100.0
200.0
300.0
400.0
500.0
2003 2004 2005 2006 2007 2008 2009 2010 2011 2012
Region Poland
Import of goods(bln EUR)
7 7 7 7 8 8 7 7 7 8
33 34 33 32 32 32 33 34 34 34
30 29 28 27 26 24 25 24 23 23
15 16 17 18 19 19 17 17 17 17
14 14 15 16 16 17 18 18 18 19
0.0
10.0
20.0
30.0
40.0
50.0
60.0
70.0
80.0
90.0
100.0
2003 2004 2005 2006 2007 2008 2009 2010 2011 2012
Bulgaria Czech Rep. Hungary Romania Slovakia
Shares in the import of goods in the region(%)
Foreign trade developments
Note: intra trades are includedSource: Eurostat, OTP research
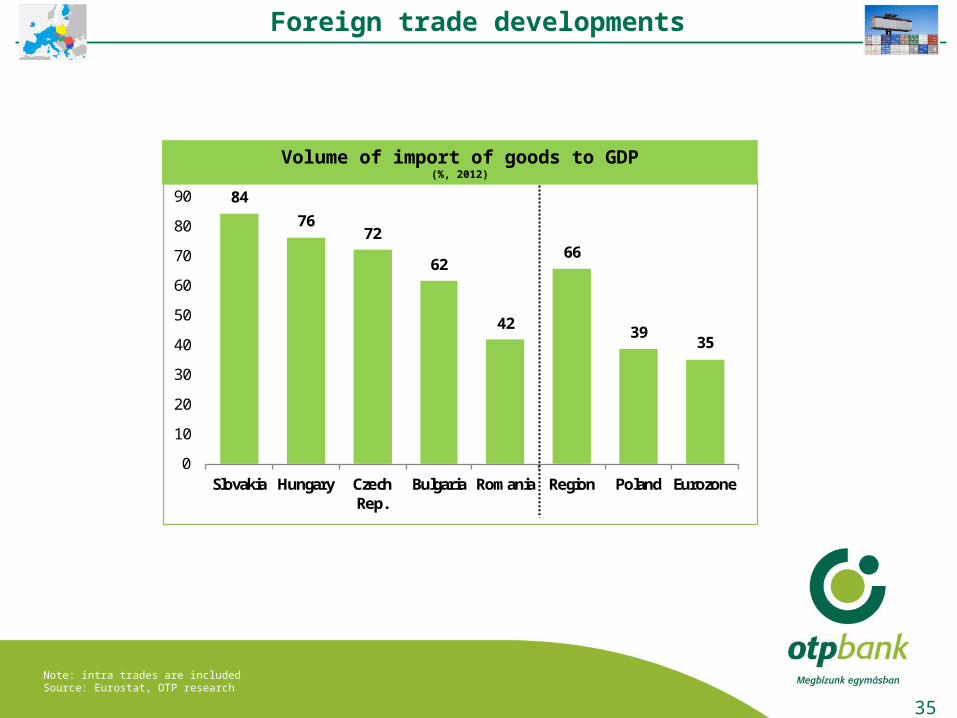
35
84
7672
62
42
66
3935
0
10
20
30
40
50
60
70
80
90
Slovakia Hungary Czech Rep.
Bulgaria Romania Region Poland Eurozone
Volume of import of goods to GDP(%, 2012)
Foreign trade developments
Note: intra trades are includedSource: Eurostat, OTP research
36
11.210.5
7.5
3.32.9
6.2
3.8
10.1
0.0
2.0
4.0
6.0
8.0
10.0
12.0
Slovakia Czech Rep.
Hungary Bulgaria Romania Region Poland Eurozone
Per capita import of goods(1.000 EUR/capita, 2012)
Foreign trade developments
Note: intra trades are included. In case of Romania the population took into consideration was 19,0 mln as of the last (2011) census and not the official number of approx. 21 mln.Source: Eurostat, Romanian National Institute of Statistics, OTP research
37
26,564
2,586
3,098
2,988
3,656
3,744
4,010
4,546
4,758
4,884
19,851
26,946
2,566
3,092
3,113
3,326
3,731
3,735
4,666
4,798
4,842
20,074
Other (32.9%)
10. Russia (3.2%)
9. Poland (3.8%)
8. Czech Rep. (3.7%)
7. UK (4.5%)
6. France (4.6%)
5. Italy (5.0%)
4. Austria (5.6%)
3. Slovakia (5.9%)
2. Romania (6.1%)
1. Germany (24.6%)
2012 2011
Export of goods(FOB, % of total in brackets, mln EUR)
Foreign trade developments - Hungary
Source: Eurostat, OTP research
17,344
2,351
2,501
2,665
3,113
3,303
3,377
3,953
4,871
6,189
6,379
17,546
17,561
2,086
2,539
2,661
3,071
3,288
3,469
4,097
5,173
5,493
6,447
18,303
Other (23.7%)
11. Romania (2.8%)
10. Czech Rep. (3.4%)
9. France (3.6%)
8. Netherlands (4.1%)
7. Italy (4.4%)
6. Poland (4.7%)
5. Slovakia (5.5%)
4. Austria (7.0%)
3. China (7.4%)
2. Russia (8.7%)
1. Germany (24.7%)
2012 2011
Import of goods(CIF, % of total in brackets, mln EUR)
38
15,649
1,075
1,101
1,404
1,448
1,636
2,567
2,787
3,379
5,799
8,423
16,355
1,088
1,109
1,283
1,623
1,735
2,377
2,454
3,151
5,446
8,376
Other (36.3%)
10. Poland (2.4%)
9. Spain (2.5%)
8. Netherlands (2.9%)
7. UK (3.6%)
6. Bulgaria (3.9%)
5. Hungary (5.3%)
4. Turkey (5.5%)
3. France (7.0%)
2. Italy (12.1%)
1. Gernamy (18.6%)
2012 2011
Export of goods(FOB, % of total in brackets, mln EUR)
18,305
1,758
2,528
2,278
2,197
2,173
2,093
3,173
4,782
6,250
9,404
17,799
1,920
2,086
2,273
2,284
2,334
2,387
3,102
4,881
5,994
9,514
Other (32.6%)
10. Netherlands (3.5%)
9. China (3.8%)
8. Kazakhstan (4.2%)
7. Austria (4.2%)
6. Poland (4.3%)
5. Russia (4.4%)
4. France (5.7%)
3. Hungary (8.9%)
2. Italy (11.0%)
1. Germany (17.4%)
2012 2011
Import of goods(CIF, % of total in brackets, mln EUR)