Edith Cowan University Edith Cowan University Research Online Research Online Theses : Honours Theses 2008 Factor structure of the life orientation test and life orientation test- Factor structure of the life orientation test and life orientation test- revised: The influence of item framing revised: The influence of item framing Jamie Moore Edith Cowan University Follow this and additional works at: https://ro.ecu.edu.au/theses_hons Part of the Quantitative Psychology Commons Recommended Citation Recommended Citation Moore, J. (2008). Factor structure of the life orientation test and life orientation test- revised: The influence of item framing. https://ro.ecu.edu.au/theses_hons/1112 This Thesis is posted at Research Online. https://ro.ecu.edu.au/theses_hons/1112
Transcript
Edith Cowan University Edith Cowan University
Research Online Research Online
Theses : Honours Theses
2008
Factor structure of the life orientation test and life orientation test- Factor structure of the life orientation test and life orientation test-
revised: The influence of item framing revised: The influence of item framing
Jamie Moore Edith Cowan University
Follow this and additional works at: https://ro.ecu.edu.au/theses_hons
Part of the Quantitative Psychology Commons
Recommended Citation Recommended Citation Moore, J. (2008). Factor structure of the life orientation test and life orientation test- revised: The influence of item framing. https://ro.ecu.edu.au/theses_hons/1112
This Thesis is posted at Research Online. https://ro.ecu.edu.au/theses_hons/1112
You may print or download ONE copy of this document for the purpose
of your own research or study.
The University does not authorize you to copy, communicate or
otherwise make available electronically to any other person any
copyright material contained on this site.
You are reminded of the following:
Copyright owners are entitled to take legal action against persons who infringe their copyright.
A reproduction of material that is protected by copyright may be a
copyright infringement. Where the reproduction of such material is
done without attribution of authorship, with false attribution of
authorship or the authorship is treated in a derogatory manner,
this may be a breach of the author’s moral rights contained in Part
IX of the Copyright Act 1968 (Cth).
Courts have the power to impose a wide range of civil and criminal
sanctions for infringement of copyright, infringement of moral
rights and other offences under the Copyright Act 1968 (Cth).
Higher penalties may apply, and higher damages may be awarded,
for offences and infringements involving the conversion of material
into digital or electronic form.
USE OF THESIS
The Use of Thesis statement is not included in this version of the thesis.
Life Orientation Test u
COPYRIGHT AND ACCESS DECLARATION
I certify that this thesis does not, to the best of my knowledge and belief:
(i) Incorporate without acknowledgement any material previously submitted for a degree or diploma in any institution or higher education;
(ii) Contain any material previously published or written by another person except where due reference is made in the text; or
(iii) Contain any defamatory material
Signed_
Dated
EDITH COWAN UNIVERSITY LIBRARY
Life Orientation Test m
Factor Structure of the Life Orientation Test and Life Orientation Test- Revised: The
Influence of Item Framing
Jamie Moore
A report submitted in Partial Fulfilment of the Requirements
for the Award of Bachelor of Arts (Psychology) Honours,
Faculty of Computinfh Health and Science,
Edith Cowan University.
Submitted (October, 2008)
I declare that this written assignment is my own work and does not include:
(i) material from published sources used without proper acknowledgement; or
(ii) material copied from the work of
Life Orientation Test iv
Declaration
I certify that this literature review and research project does not incorporate, without
acknowledgement, any material previously submitted for a degree or diploma in any
institution ofhigher education and that, to the best of my knowledge and belief, it does not
contain any material previously published or written by another person except where due
reference is made in the text.
Life Orientation Test v
Acknowledgements
I would like to take this opportunity. to thank all of those who assisted me in the completion
of this research. I would like to give special thanks to Dr Ricks Allan (Primary Supervisor)
for the excellent suggestions and criticisms she gave on several drafts of this Literature
Review and Research Report. Also I would like to extend special thanks Mr Craig Harms for
his invaluable assistant with the data analysis involved with the following Research Report.
Life Orientation Test VI
Table of Contents
Use of Thesis Statement
Copyright and Access Declaration n
Declaration IV
Acknowledgements v
Table of Contents VI
LITERATURE REVIEW 1
Abstract 2
Responses Sets 3 Acquiescence Response Set 4
Controlling the Effect of Acquiescence by Developing Balanced Scales 5
Problems Associated with Balanced Scales 7 Reliability and Validity in General 7 Factor Structure 9
Connotatively Consistent and Connotatively Inconsistent Items 12
Life Orientation Test and Life Orientation Test- Revised 16 Factor Structure of the Life Orientation Test 16 Factor Structure ofthe Life Orientation Test- Revised 17 Different Explanations for Two-Factor Structure 18
Overview of Balanced Scales and Future Research Possibilities 22
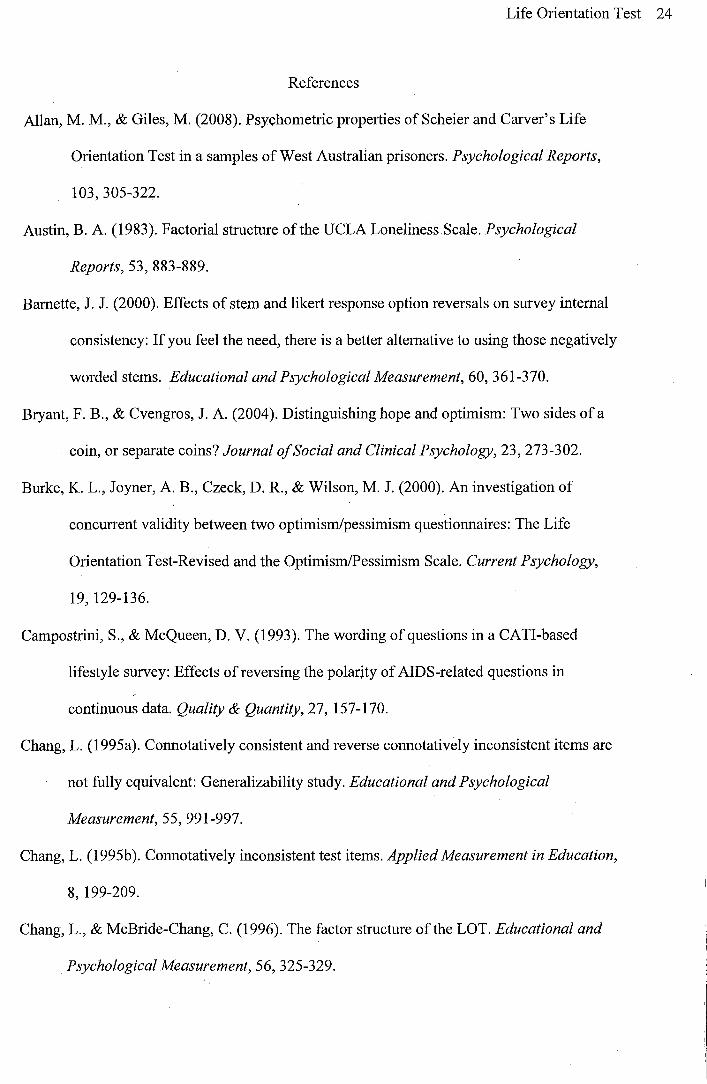
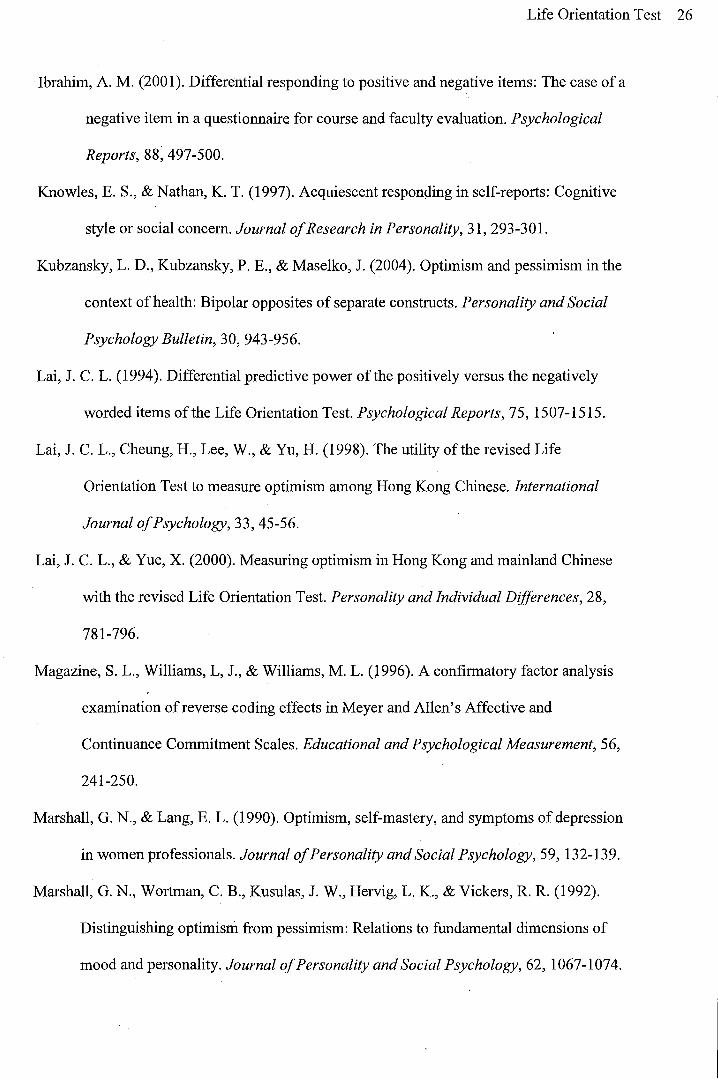
References 24
Guidelines for Contributions by Authors 30
PROJECT REPORT 32
Abstract 33
I
Introduction 34 Development of Balanced Scales 34
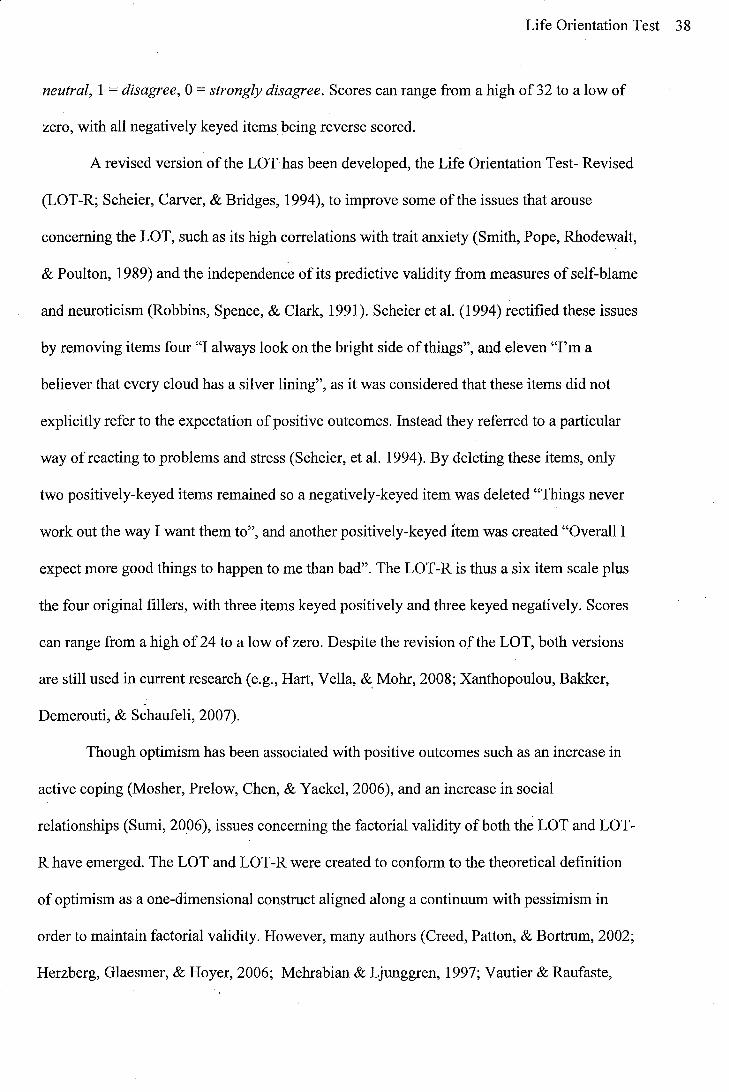
Issues Concerning Factor Structure 35 Life Orientation Test and Life Orientation Test.,. Revised 37
Factor Structure ofthe Life Orientation Test 39 Factor Structure of the Life Orientation Test- Revised 39
Competing Explanations for Two-Factor Structure 40 Item-Keying Direction 41
Difference in Item Content Current Research
Method
Results
Research Design Participants Materials Procedure Analysis
Positively Framed Version Negatively Framed Version Comparison of the Positive and Negative Versions Discriminant Validity
Discussion Reasons for Two-Factor Structure
Differences in Item Content Measurement Error
Latent Factor Correlations Problems with Negatively Framed Items Limitations of the Current Research Areas for Future Research Conclusions of the Current Research
References
Life Orientation Test vu
43 44
45 45 45 46 46 47
48 51 51 52 52
53 53 54 55 56 57 59 59 59
61
Appendices Appendix A (Framing and Content of Original and Revised Versions of the
Appendix B Appendix C AppendixD
LOT and LOT -R) 69 (Information Letter) . 70 (Negatively Framed Questionnaire) 71 (Positively Framed Questionnaire) 73
Guidelines for Contributions by Authors 75
Life Orientation Test 1
Using Balanced Scales to Control for Acquiescence: A Review of the Effects on Factor
Structure and Validity of such Scales
Jamie Moore
Life Orientation Test 2
Using Balanced Scales to Control for Acquiescence: A Review of the Effects on Factor
Structure and Validity of such Scales
Abstract
Historically psychological scales have used a mix of positively keyed and negatively keyed
items (balanced scales) to control for the effects of response sets. While it has been
established that the use of balanced scales does effectively control for response sets such as
acquiescence, issues relating to the psychometric properties of these scales emerge. The
following review investigated issues surrounding the reliability, validity and factor structure
of balanced scales by considering whether these issues were caused by positively and
negatively keyed items measuring different aspects of a construct or whether they emerged
simply due to measurement error. Both these positions are supported by research with various
balanced scales, though it is necessary for future research to consider the effect that negative
item framing, rather than negative item keying, has on the psychometric properties of
balanced scales.
Author: Jamie Moore Supervisors: Ricks Allan
and Craig Harms Submitted: October, 2008
Life Orientation Test 3
Using Balanced Scales to Control for Acquiescence: A Review ofthe Effects on Factor
Structure and Validity of such Scales
Psychological scales are used to determine an individual's position on a range of
psychological, emotional or personality constructs. Balanced scales, that is scales with half
the items worded in a positive direction and half in a negative direction, are pften used.
However, various issues have been identified concerning the reliability and construct validity
of balanced scales. The following review outlines the history of why the balanced scale
technique was developed to provide a context for understanding the problems it created. The
main focus of the review is the emerging issues of balanced scales in regards to their
reliability, validity in general and factorial structure specifically. These issues have been
researched in a number of balanced scales. The emphasis in this review is on the Rosenberg
Self Esteem Scale (Rosenberg, 1965), the Quantitative Attitude Questionnaire (Chang,
1995a), the Leader Behaviour Description Questionnaire (Schriesheim & Hill, 1981), the
Computer Anxiety Scale (Greenberger, Chen, Dmitrieva, & Farruggia, 2003), and the Life
Orientation Test (LOT; Scheier & Carver, 1985) and Life Orientation Test- Revised (LOT-R,
Scheier, Carver, & Bridges, 1994). The majority of the review is on the LOT and LOT-Rasa
number of studies have investigated what item properties influence its factor structure by
making changes to the meaning and framing of items.
Response Sets
When psychological measurement scales were first developed it was thought that responses
to items on the scale were exact, unbiased estimates of how respondents actually felt or
considered the statement or question (Smith, 1967). However, it began to emerge that
psychological tests were not pure measures of intended constructs and could not predict
human behaviour with high accuracy (Cloud & Vaughan, 1970). It was suggested that
response sets of respondents, such as acquiescence, were responsible for th~s observation.
Life Orientation Test 4
Response sets refer to a personal tendency to respond in a specified way within a testing or
interview situation that is independent of the content of the item or question presented
(Smith, 1967). The endorsement of a certain response to an item does therefore not reflect
the respondent's position on the construct but instead reflects their specific response set. The
response set of most interest in this review is acquiescence which reflects the tendency to
agree or disagree with an item irrespective of its content (Knowles & Nathan, 1997).
Acquiescence Response Set
Acquiescence has been referred to as yea-saying versus nay-saying, reflecting the tendency to
agree or disagree respectively (Smith, 1967). An example of yea-saying would be when a
respondent endorses the question "I am very happy", and later endorses its opposite "I am
very sad". Importantly if acquiescence is uncontrolled within a psychological scale responses
to items lose their meaning and the respondent's answers are uninterpretable (Knowles &
Nathan, 1997). Knowles and Nathan (1997) investigated whether acquiescentresponding was
a general characteristic of respondents that was stable over a questionnaire. T~ey had 65
college undergraduates complete the Jackson Personality Inventory, which consists of320
statements, divided into 15 personality subscales where respondents answer True or False as
a description of themselves. They observed acquiescent responding when a respondent
answered True or False many more times than expected, consistently across the 15 scales,
indicating a tendency to agree or disagree more than expected. Their results provided
evidence of a general acquiescence trait with a relatively equal amount of yea-sayers and nay
sayers. The generalisation of these results to other scales is limited though as all acquiescence
scores were based only on true-false choices, not a range of scale answers and extracted from
the same personality scale, administered at the same time. Therefore the study did not allow
for variations in time, scale, or format that may affect acquiescence responding. However, it
Life Orientation Test 5
still provided evidence that respondents do show a tendency to agree or disagree with items
irrespective of their content when responding to a measurement scale.
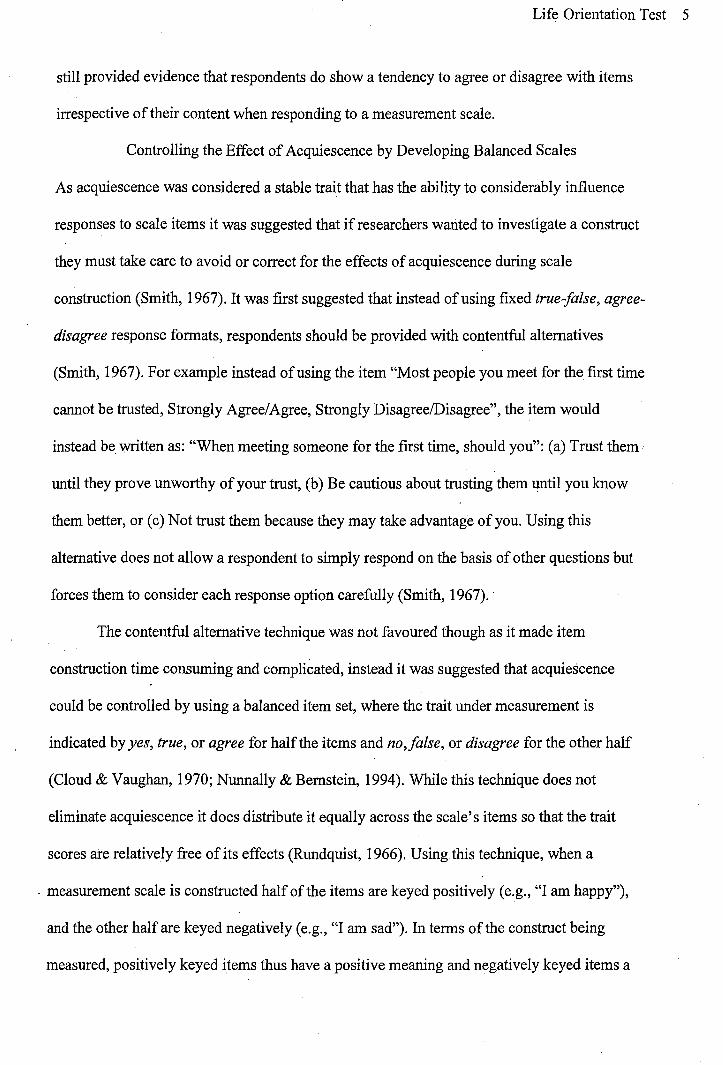
Controlling the Effect of Acquiescence by Developing Balanced Scales
As acquiescence was considered a stable trait that has the ability to considerably influence
responses to scale items it was suggested that if researchers wanted to investigate a construct
they must take care to avoid or correct for the effects of acquiescence during scale
construction (Smith, 1967). It was first suggested that instead ofusing fixed true-false, agree
disagree response formats, respondents should be provided with contentful alternatives
(Smith, 1967). For example instead of using the item "Most people you meet for the first time
cannot be trusted, Strongly Agree/ Agree, Strongly Disagree/Disagree", the item would
instead be written as: "When meeting someone for the first time, should you": (a) Trust them
until they prove unworthy of your trust, (b) Be cautious about trusting them until you know
them better, or (c) Not trust them because they may take advantage of you. Using this
alternative does· not allow a respondent to simply respond on the basis of other questions but
forces them to consider each response option carefully (Smith, 1967). ·
The contentful alternative technique was not favoured though as it made item
construction time consuming and complicated, instead it was suggested that acquiescence
could be controlled by using a balanced item set, where the trait under measurement is
indicated by yes, true, or agree for half the items and no,false, or disagree for the other half
(Cloud & Vaughan, 1970; Nunnally & Bernstein, 1994). While this technique does not
eliminate acquiescence it does distribute it equally across the scale's items so that the trait
scores are relatively free of its effects (Rundquist, 1966). Using this technique, when a
- measurement scale is constructed half of the items are keyed positively (e.g., "I am happy"),
and the other half are keyed negatively (e.g., "I am sad"). In terms of the construct being
measured, positively keyed items thus have a positive meaning and negatively keyed items a
Life Orientation Test 6
negative meaning. When interpreting respondents overall scores, negatively keyed items are
reversed scored so that endorsing strongly agree or yes on a positively keyed item is equal to
endorsing strongly disagree or no on a negatively keyed item. This technique is thought to
not only balance out the effect of acquiescence but also force respondents to consider the
content of each item carefully and respond accordingly, instead of just responding according
to their general feeling about what they perceive is the intended construct (Barnette, 2000).
Cloud and Vaughan (1970) investigated the efficacy of the balanced item technique in
controlling for acquiescence. In their study they aimed to measure acquiescence in an attitude
scale to see to what extent it was controlled by balanced keying. They had 496 college
undergraduates and high school students complete the Wilson and Patterson Conservatism
Scale, which consists. of 50· items of controversial issues responded to on a yes, no, don 't
know format, depending on a respondent's belief in the issue. There are an equal number of
. positively and negatively keyed items on the scale, from which a score of conservatism
liberalism is produced. They constructed a formula that measured response style, dependent
on expected responses to items based on keying direction, to determine yea-saying versus
nay-saying. They found that the strategy of balancing item-keying was successful in
eliminating the distorting influence of acquiescent responding. The correlation of
conservatism-liberalism and response style was very low, leading them to recommend
balanced keying as a standard element of test construction.
The technique of using both positively and negatively keyed items to control response
bias was accepted under the assumptions that response biases were threats to scale validity,
that negatively keyed items could be used without serious consequences and most
importantly that there were no major psychometric differences between positively and
negatively keyed items (Schriesheim & Eisenbach, 1995). As a result of these findings and
assumptions many psychological measurement scales have adopted the balanced item
Life Orientation Test 7
technique including the Minnesota Multiphasic Personality Inventory (MMPI; Hathaway &
McKinley, 1940), the RSES (Rosenberg, 1965), the UCLA Loneliness Scale (Russell, 1978),
the Meyer and Allen Affective and Continuance Scale (Meyer & Allen, 1984), and the LOT
(Scheier & Carver, 1985), to name a few.
Problems Associated with Balanced Scales
The last assumption regarding balanced scales suggests that negatively keyed items measure
the same intended construct as their positively keyed counterparts (Woods, 2006). However,
this assumption has consistently not been met, leading some to highlight that the
recommendation of using both positively and negatively keyed items has received mixed
empirical support (Woods, 2006).
Reliability and Validity in.General
Schriesheim and Hill (1981) hypothesised that negatively keyed items may in fact elicit
response bias or measure unintended aspects of the construct under investigation. By
investigating the effects of item keying on the accuracy, and therefore the validity, of results
obtained on standard questionnaires, they suggested that the inclusion of negatively keyed
items could result in less accurate responses. They had 150 undergraduates read a fictitious
account of a supervisor's behaviour, and then rate the behaviour on the Leader Behaviour
bescription Questionnaire (LBDQ). Participants read an account of a supervisor who always
or never elicited desirable managerial behaviours, then rated this behaviour on one of three
fonns ofthe LBDQ. The Initiating Structure and Consideration subscales of the LBDQ were
used to create three 20-item questionnaires that rated leadership behaviour using either all
positively keyed, all negatively keyed, or mixed items. Participant's responses were analysed
to detennine how accurate they Were in describing the supervisor's actual behaviour. Results
indicated that the positively keyed questionnaire yielded significantly greater accuracy than
the mixed or negatively keyed questionnaire. They reasoned that negatively keyed items
Life Orientation Test 8
caused inaccuracy in responding, which actually slightly increased when they were mixed
with positive items. These findings therefore challenged the assumption that item reversals
are not without consequences (Schriesheim & Eisenbach, 1995).
Holden, Fekken, and Jackson (1985) criticised Schriesheim and Hill by highlighting
that they did not distinguish between negative item framing and negative item keying,
therefore it was unknown what aspect of the items caused inaccuracy. They defined items
that were reverse-scored as negatively keyed and distinguished between three types of
negative framing including clear negatives (i.e., use of word not or never), negative prefixes
(i.e., such as im- or un-), and negative qualifiers (i.e., seldom or rarely). Schriesheim,
Eisenbach, and Hill (1991) took this methodology on board and examined the effects of item
keying and item framing on measurement scale validity. In their study they compared four
different types of items: regular items that had a positive meaning and positive framing (e.g.,
"I am happy"), polar opposites items that had a negative meaning but positive framing (e.g.,
"I am sad"), negated polar opposites items that had a positive meaning but negative framing
(e.g., "I am not sad"), and negated regular items that had a negative meaning and negative
framing (e.g., "I am not happy"). These four types of items were an improvement on the
comparisons made by Schreisheim and Hill (1981) as they successfully distinguished
between item framing and item keying. Using a similar procedure to Schriesheim and Hill
(1981), 250 undergraduates rated one oftwo supervisors on one of four versions of the
Initiating Structure and Consideration subscales of the LBDQ. Each version had four regular
items, then another four items that were either regular, polar opposite, negated regular, or
negated polar opposite items. Results indicated that the two types of positively framed items
(regular and polar opposite), had the highest internal consistency reliability. Furthermore both
forms of reverse scored items (polar opposite and negated regular), had lower internal
consistency reliability than regular items. They also found that items that were negatively
Life Orientation Test 9
framed (negated opposite and negated regular), had lower internal consistency than positively
framed items, irrespective ofwhetherthey were positively or negatively keyed. It was
suggested' that negatively framed items may be inappropriately understood by respondents.
They went onto suggest that including both negatively keyed and negatively framed items
can significantly decrease the reliability of a measurement scale. These studies by
Schriesheim and Hill (1981), and Schriesheim, Eisenbach, and Hill (1991) cast doubt on the
assumption that positively and negatively worded item stems measure the same aspect of a
construct and further indicate that negatively keyed and negatively framed items are often
unreliable.
Factor Structure
Beyond the effects on accuracy and scale reliability it is suggested that the use of negative
items can also have effects on the factor structure of a measurement scale. Schmitt and
Schults (1985) suggested that wording changes in an effort to create a balanced scale may
cause significant changes in the intended factor structure of a scale due to questionable item
validities. This is often the case when factor analysis reports a two-dimensional scale
structure, when a one-dimensional structure is favoured. They looked at how careless
respondents coul~ affect the factor structure of a balanced scale. They defined careless
respondents as those who have either a positive or negative view of the intended construct as
they understand it and proceed to respond to all items in a similar manner that reflects this
view, even though items may have been negatively keyed. In this case reverse-scoring these
items becomes inappropriate and the respondent's scores become a systematic source of
variance not a random one (Schmitt & Stults, 1985). Woods (2006) followed thi~ line of
argument by creating an artifiCial balanced item scale with an intended one factor structure.
Woods suggested that when a scale undergoes factor analysis, negative items would form a
separl:!.te method factor that is independent of the construct under investigation. His artificial
Life Orientation Test 10
scale was made up of 10 negatively keyed and 13 positively keyed items that were created on
the basis of a one-dimensional logistic, with possible responses being 1 and 0. A simulation
study was carried out where 0, 5, 10, 20 or 30% of respondents were simulated as careless
responders on the artificial scale across sample sizes of250, 500 and 1000. He then used
confirmatory factor analysis (CFA) to test the fit ofthe intended one-factor structure and a
possible two-factor structure across conditions. When 0% of respondents were simulated as
careless the intended one-factor model was a perfect fit to the data across all sample sizes.
However with even 10% of careless respondents the fit of the one-factor model became
unacceptable and the two-factor model comprised of positively keyed items on one factor and
negatively keyed items on the other factor provided a better fit to the data. With 20% and
30% of"careless" respondents this two-factor fit was excellent across all three sample sizes,
while the intended one-factor fit was poor. They concluded that when negatively keyed items
are used, even 10% of careless respondents can artificially affect CF A results and make the
obtained factor structure of the scale questionable. In this study though the response options
were limited, therefore it is easy to imagine alternative types of responding showing less
artificial effects. However the study does support the idea that a small amount of careless
responding can form a separate method factor comprised entirely of negatively keyed items.
Whether this obtained factor structure is actually of concern to how the scale measures the
intended construct, or simply method variance, must be considered (Schmitt & Stults, 1985).
If the obtained factor structure is a result of method variance, this is a problem because it
implies that the way items measure the intended construct elicits some form of syste~atic
response bias.
Other ways individuals respond to items that vary in direction can also result in
artifactual factor structures comprised of item keying direction. Campostrini and McQueen
(1993) conducted a study using 90 items from a lifestyle and health survey. They analysed
Life Orientation Test 11
responses from 15,221 interviews in which items were presented positively keyed, negatively
keyed and then positively keyed again over an 8-month period. For example the item "it is
highly unlikely that AIDS will spread in the general population", was also presented as "it is
highly likely that AIDS will spread into the general population". They found that
respondent's responses to the two forms of the item were not equal; in that simply reverse
scoring the negative item did not correspond to the same response on the positively keyed
item. Respondents tended to endorse a negative item rather than reject a positive item. They
also suggested that those who were less educated possibly did not perceive the subtle
differences in the semantics of the positive versus the negative items when responding.
Spector, Van Katwyk, Brannick, and Chen (1997) then suggested if individuals respond
differently to oppositely keyed items, then item correlations with the overall scale score
become unequal, leading to one subset having a higher or lower correlation than the other. If
this occurs a two factor structure will emerge when the scale is factor analysed, even if the
items assess a single construct (Spector et al., 1997). Ibrahim (2001) refers to these emerging
negative factors as method artifacts that affect the obtained dimensionality of scales in a
systematic instead of a random way. In his study only one item out of 23 was negatively
keyed and it still loaded separately on its own factor-when exploratory factor analysis was
performed. Ford, MacCullum, and Trait (1986) have suggested though that exploratory factor
analysis is not as powerful as CF A as it takes advantage of chance variance in a sample,
resulting in factors being extracted when none actually exist, therefore it is possible this
occurred in Ibrahim's study.
From the studies that investigated the effect of item keying on the factor structure of
scales, it is clear that item keying can have dramatic consequences for the factor structure,
thus violating the assumption that negatively keyed items can be used without serious
consequences. It seems that by using negatively keyed items to create a balanced scale to
Life Orientation Test 12
guard against response sets, specifically acquiescence, these items actually create further item
wording effects that result in uninte.p.ded factor structures being obtained (Barnette, 2000).
Whether this occurs due to negative items being more difficult to.interpret (Cordery &
Sumi, K. (2006). Correlations between optimism and social relationships. Psychological
Reports, 99, 938-940.
Thompson, B. (2004). Exploratory and confirmatory factor analysis: Understanding
concepts and applications. Washington DC: American Psychological Association.
Tromp, D. B., & Brouha, X. D. R. (2005). Patient factors associated with delay in primary
care among patients with head and neck car~inoma: A case-series analysis. Family
Practice, 22, 554-559.
Vautier, S., & Raufaste, E. (2006). Configura! instability of data from the Life Orientation
Test-Revised. Personality and Individual Differences, 40, 1511-1518.
Wang, W. C., & Cunningham, E. G. (2005). Comparison of alternative estimation
methods in confirmatory factor analyses of the general health questionnaire.
Psychological Reports, 97, 3-10.
Life Orientation Test 68
Wegner, D. T., & Fabrigar, L. R. (2000). Analysis and design for non-experimental
data: Addressing casual and 11on-casual hypotheses. In H. T. Reis & C.M. Judd (Eds.),
Handbook of research methods in social and personality psychology (pp. 412-450).
New York: Cambridge University Press.
Whiteley, B. E. (2002). Principles of research in behavioural science. (7th ed.). New York,
NY: McGraw Hill.
Xanthopoulou, D., Bakker, A. B., Demerouti, E., & Schaufeli, W. B. (2007). The role of
personel resources in the job demands-resources model. International Journal of
Stress Management, 14, 121-141.
Life Orientation Test 69
Appendix A
Framing and Content of Original and Revised Versions ofthe LOT and LOT-R
Original LOT Positively Framed Version Negatively Framed Version Framing/Content Framing/Content Framing/Content
In uncertain times? I usually expect the In uncertain times, I usually expect Even in uncertain times, I don't
best. +/+ the best. +/+ expect the worst. -/+
I always look on the bright side of I always look on the bright side of I never look on the dark side of
things.+/+ things. +/+ things. -/+
I'm always optimistic about my future. I'm always optimistic about my I'm never pessimistic about my
+I+ future. +/+ future. -/+
I'm a believer in the idea that "every I'm a believer in the idea that "every Used original +/+
cloud has a silver lining". +I+ cloud has a silver lining". +/+
If something can go wrong for me, it It somehow seems that if something If something can go wrong for me,
will. -/- can go right for me, it won't.+/- it will. -/-
I hardly ever expect things to go my I almost always expect that things I hardly ever expect things to go my
way. -/- won't go my way. +/- way. -/-
Things never work out the way I want Things always work out the way I Things never work out the way I
them to. -1- don't want them to. +/- want them to. -1-
I rarely count on good things I often count on bad_things happening I rarely count on good things
happening to me. -7- to me. +/- happening to me. -1-
Overall, I expect more good things to Overall, I expect more good things to Overall, I don't expect more bad
happen to me than bad. +/+ happen to me than bad. +/+ things to happen to me than good.
-I+
Note: The-/+ symbols refer to the Items frammg and keymg duectwn.
Life Orientation Test 70
Appendix B
Dear Participant,
My name is Jamie Moore and I am currently undertaking. a research project as part of the requirements of completing Honours in Psychology at Edith Cowan University. My research involves analysing certain properties of the Life Orientation Test, a brief self-report measure of how people perceive their environment and their experiences.
If you choose to participate in this study, you will be required to answer a few demographic questions and to complete a 13-item questionnaire. This should take less than 10 minutes of your time.
Your participation is entirely voluntary and completely anonymous. As you will not be required to provide any identifying information, completion of the questionnaire will indicate your consent. Participation or refusal to participate will not have any bearing on your current or future academic outcomes or receipt of university services. You can withdraw at any time without consequences by submitting an uncompleted or partially completed questionnaire.
The Ethics Committee of the ECU Faculty of Computing, Health and Science has approved this project, and there are no lmown risks associated with this project. If you would like to speak to someone independent of the research please contact Dr Justine Dandy of the School of Psychology and Social Science on 6304 5105 or via email atj,[email protected].
Your assistance is greatly appreciated.
Thank you
Jamie Moore Principal Researcher: Edith Cowan University Email: [email protected]
Supervisor: Dr Ricks Allan School ofPsychology, ECU Ph; 6304 5048 Email: [email protected]
Appendix C
Negatively Framed Version
Please provide the following demographic information
1. Age in years
2. Gender (please circle)
Male Female
3. Born in Australia
Yes No
4. Cultural affiliation (please circle)
Caucasian Indigenous Asian Other
Life Orientation Test 71
For each of the following statements, state your feelings 'strongly agree', 'agree', 'neutral, 'disagree', or 'strongly disagree', by circling the corresponding number. There are no right or wrong answers, but try to be as accurate and honest as possible, without letting your answer to one-question influence answers to the others.
I'm a believer in the idea that every cloud has a silver lining.
Strongly Agree 4
Agree 3
Neutral 2
Disagree 1
I rarely count on good things happening to me.
Strongly Agree 4
Agree 3
Neutral 2
Disagree 1
Life Orientation Test 72
Strongly Disagree 0
Strongly Disagree 0
Strongly Disagree 0
Strongly Disagree 0
Strongly Disagree 0
Strongly Disagree 0
Overall, I don't expect more bad things to happen to me than good.
Strongly Agree 4
Agree 3
Neutral 2
Disagree 1
Strongly Disagree 0
(Adapted from Scheier & Carver, 1985; Scheier, Carver, & Bridges, 1994, and Kubzansky, et al, 2004).
AppendixD
Positively Framed Version
Please provide the following demographic information
1. Age in years
2. Gender (please circle)
Male Female
3. Born in Australia
Yes No
4. Cultural affiliation (please circle)
Caucasian Indigenous Asian Other
Life Orientation Test 73
For each of the following statements, state your feelings 'strongly agree', 'agree', 'neutral, 'disagree', or 'strongly disagree', by circling the corresponding number. There are no right or wrong answers, but try to be as accurate and honest as possible, without letting your answer to one-question influence answers to the others.
In uncertain times, I usually expect the best.
Strongly Agree 4
Agree 3
It's easy for me to relax
Strongly Agree 4
Agree 3
Neutral 2
Neutral 2
Disagree 1
Disagree 1
It seems ihat if something can go right for me it won't.
Strongly Agree 4
Agree 3
Neutral 2
I always look on the bright side of things.
Strongly Agree 4
Agree 3
Neutral 2
I am always optimistic about my future.
Strongly Agree Agree Neutral 4 3 2
I enjoy friends a lot.
Strongly Agree Agree Neutral 4 3 2
Disagree 1
Disagree 1
Disagree 1
Disagree 1
Strongly Disagree 0
Strongly Disagree 0
Strongly Disagree 0
Strongly Disagree 0
Strongly Disagree 0
Strongly Disagree 0
It's important for me to keep busy.
Strongly Agree 4
Agree 3
·Neutral 2
Disagree 1
I almost always expect that things won't go my way.
Strongly Agree 4
Agree 3
Neutral 2
Disagree 1
Things always work out the way I don't want them to.
Strongly Agree Agree Neutral Disagree 4 3 2 1
I don't get upset too easily.
Strongly Agree Agree Neutral Disagree 4 3 2 1
I'm a believer in the idea that every cloud has a silver lining.
Strongly Agree 4
Agree 3
Neutral 2
I often count on bad things happening to me.
Strongly Agree 4
Agree 3
Neutral 2
Disagree 1
Disa·gree 1
Overall, I expect more good things to happen to me than bad.
Strongly Agree 4
Agree 3
Neutral 2
Disagree 1
Life Orientation Test 7 4
Strongly Disagree 0
Strongly Disagree 0
Strongly Disagree 0
Strongly Disagree 0
Strongly Disagree 0
Strongly Disagree 0
Strongly Disagree 0
(Adapted from Scheier & Carver, 1985; Scheier, Carver, & Bridges, 1994, and Kubzansky, et al, 2004).
I
I
I
I
I
I
I
I
I
I
I
I
I
I
I
I
Guidelines for Contributions by Authors
Educational and Psychological Measurement
Executive Editor: X. Fan
Aim and Scope
Life Orientation Test 75
Educational and Psychological Measurement discusses problems in the measurement of
individual differences (including SEM, IRT, and "reliability generalization .. studies), research
on the development and use of tests and measurements (validity studies), testing programs
(computer studies) being used for a variety of programs, and new and improved methods or
items for treating test data. The journal also publishes statistics articles dealing with issues
relevant to construct validity, broadly conceived.
Some of the significant topics covered include:
• Ways of thinking about describing score reliability
• Appropriate use of statistical significance scores and effect size measures
• Refusal to use stepwise methods either to select variables or to infer order of variable
importance
• Suggested practices in conducting and reporting exploratory and confirmatory factor
analyses
Manuscript Style
Type double-spaced using generous margins on all sides. The entire manuscript, including
quotations, references, figure-caption list, and tables, should be double-spaced. Manuscript
length, except under unusual circumstances, should generally be about 4000-9000 words.
Empirical articles should include standard sections, such as Introduction, Methods, Results,
and Discussion. Number all pages consecutively with Arabic numerals, with the title page
being page 1. In order to facilitate masked (previously termed 11double-blind") review, leave
all identifying infonnation off the manuscript, including the title page and the electronic file
Life Orientation Test 76
name. Upon initial submission, the title page should include only the title of the article.
An additional title page should be provided as a separate submission item and should include
the title of the article, author's name, and author's affiliation. Academic affiliations of all
authors should be included. The affiliation should comprise the department, institution
(usually university or company), city, and state (or nation) and should be typed as a footnote
to the author's name. This title page should also include the complete mailing address,
telephone number, fax number, and e-mail address of the one author designated to review
proofs. An abstract is to be provided, preferably no longer than 200 words.
References
List references alphabetically at the end of the paper and refer to them in the text by name
and year in parentheses. The style and punctuation of the references should conform to strict
APA style. In general, the journal follows the recommendations of the 2001 Publication
Manual of the American Psychological Association (5th ed.), arid it is suggested that
contributors refer to this publication. For articles in a periodical, references in the citation list
should include (in this order): last names and initials of all authors (for up to and including
six authors), year published (in parentheses), title of article (roman type), name of publication
(italics), volume number (italics), and inclusive pages (roman type).


![The ABC of success in Life [Orientation]](https://static.documents.pub/doc/80x56/5681329a550346895d9934b5/the-abc-of-success-in-life-orientation.jpg)


