Page 1
1
Factors influencing the compressive strength of fly ash 1
based geopolymers 2
Marios Soutsos1, Alan P. Boyle
2, Raffaele Vinai
1, Anastasis Hadjierakleous
2, and Stephanie J. Barnett
3 3
1 School of Planning, Architecture and Civil Engineering, Queen’s University Belfast, BT9 5AG, UK 4
2 School of Environmental Sciences, University of Liverpool, L69 3GP, UK 5
3 School of Civil Engineering and Surveying, University of Portsmouth, PO1 2UP, UK 6
Abstract 7
Several factors affecting the reactivity of fly ash (FA) as a precursor for geopolymer concrete have been 8
investigated. These include physical and chemical properties of various FA sources, inclusion of ground 9
granulated blast furnace slag (ggbs), chemical activator dosages and curing temperature. Alkali-activated FA 10
was found to require elevated curing temperatures and high alkali concentrations. A mixture of sodium 11
hydroxide and sodium silicate was used and this was shown to result in high strengths, as high as 70 MPa at 28 12
days. The presence of silicates in solution was found to be an important parameter affecting strength. Detailed 13
physical and chemical characterisation was carried out on thirteen FA sources from the UK. The most 14
important factor affecting the reactivity was found to be the particle size of FA. The loss on ignition (LOI) and 15
the amorphous content are also important parameters that need to be considered for the selection of FA for 16
use in geopolymer concrete. The partial replacement of FA with ggbs was found to be beneficial in not only 17
avoiding the need for elevated curing temperatures but also in improving compressive strengths. 18
Microstructural characterisation with scanning electron microscope (SEM) coupled with energy dispersive X-19
ray spectroscopy (EDS) was performed on FA/ggbs pastes. The reaction product of FA and ggbs in these binary 20
systems was calcium aluminium silicate hydrate gel (C-A-S-H) with inclusion of Na in the structure. 21
Keywords: geopolymer, alkali activated material, fly ash, slag, structural characterisation, mechanical 22
properties, alkali dosages optimisation 23
1 Introduction 24
The term “geopolymer” was introduced by Davidovits in the 1970s referring to alkali-activated metakaolin [1]. 25
It has since been used for a range of synthetic low-calcium aluminosilicate polymeric materials, as a sub-range 26
of a more general definition which is alkali-activated binders (AAB). Although the initial studies were focused 27
Page 2
2
on geological materials such as metakaolin activated with siliceous solutions [2-6], the potential of using other 28
synthetic reactive aluminosilicate materials activated with a range of concentrated alkaline solutions became 29
apparent [1,7-8]. 30
AABs have been studied for the last 40 years [9] and have applications in ceramics, hazardous waste 31
containment, fire-resistant construction materials and refractories [10, 11]. One of the most interesting 32
applications is their use as a cement-free binder that can replace Portland cement-based pastes in 33
construction materials such as concrete and mortar products [12]. 34
Geopolymers can provide a desirable alternative to Portland cement (PC) binders, not only for the 35
environmental benefits arising from the avoidance of CO2 emissions associated with PC production, but also in 36
terms of their performance and durability, where such properties are not only equivalent, but often better 37
than those achieved with PC. The nature of the reactions occurring in geopolymerisation can be summarized in 38
three basic steps [13]: 39
1. Dissolution of the aluminosilicate solids: aluminosilicates in the pozzolanic solid are dissolved by 40
alkaline hydrolysis in the high pH solution of the concentrated alkaline activator. This forms a solution 41
of silicate, aluminate and aluminosilicate species. 42
2. Gel Formation: species released by dissolution are held in the aqueous phase, which may also contain 43
silicate present from the activating solution. This supersaturated aluminosilicate solution forms a gel 44
as oligomers form long chains and networks. This stage releases complexing water, which resides in 45
pores. 46
3. Polycondensation: the gel species continue to rearrange and reorganize, forming an increasingly 47
larger network. This results in the three-dimensional aluminosilicate network of the geopolymer 48
binder. 49
These processes often occur contemporaneously throughout the mixture, rather than in a linear time series. 50
The dense inorganic polymer that forms the geopolymer binder thus provides physicochemical features that 51
may be superior to Portland cement systems, i.e.: 52
The interconnected framework gives geopolymers high compressive strengths [13, 14]. 53
Page 3
3
Due to the microstructure of the reaction products, geopolymer and AAB can show good to very good 54
resistance to chemical degradation (sulphate attack, acid attack, seawater attack) [9]. 55
The geopolymer matrix shows high thermal and fire resistance up to 1000-1200 °C [14]. 56
Geopolymers may exhibit rapid setting without long term deterioration of strength [13]. 57
Of particular interest is the selection of precursor aluminosilicate materials that arise from waste-streams or as 58
by-product pozzolans, which are readily available from existing industries [15]. These include fly ash (FA) and 59
ground granulated blast furnace slag (ggbs). Although ggbs has a relatively high demand from an existing 60
market-base, and an associated relatively high value, perhaps equivalent to that of Portland cement, waste-61
stream pozzolans such as FA are not fully recycled into value added products, and excesses are stockpiled or 62
landfilled. 63
Reaction mechanisms responsible for the creation of an amorphous gel from fly ash are complex and still not 64
fully understood [9]. A wide variability in chemical dosages can be found in the scientific literature related to 65
the activation of FA systems [16], indicating that optimum proportions of alkali species (hydroxides and 66
silicates) in the activating solution, as well as quantity of alkali per binder mass, still need to be investigated to 67
improve our understanding of the reaction mechanisms. Curing parameters such as curing temperature and 68
stand time, i.e. the time elapsed before the start of high temperature curing, play an important role in the full 69
development of the reaction products. Information available in technical literature is relatively limited, and 70
thus a systematic investigation is still needed for determining optimum curing conditions. 71
Fly ashes are not a “standard product” as their physical and chemical properties vary considerably not only 72
from source to source but also over time from the same power station [9]. The Department of Energy and 73
Climate Change in its digest of UK energy statistics [17] quoted 14 power stations operational at the end of 74
May 2014 that were using coal or coal mixed (gas/oil) fuel, representing 26% of total electricity generated. 75
Heath et al. [18] reported that FA production in UK is estimated at about 6∙106 t per annum, half of which is 76
sent to landfill, whereas about 114∙106 t of FA is available in stockpiles. The potential availability for FA-based 77
geopolymer concrete production is therefore significant in the UK, although the suitability of such available 78
ashes has never been investigated in a comprehensive manner. 79
Page 4
4
FA-based geopolymers need an external energy source in the form of thermal curing for the reaction to take 80
place. This can be a drawback for the upscaling of the process to the industrial level. On the other hand, Ca-81
rich slags such as ggbs react at room temperature since their reaction, i.e. the hydration of Ca species and the 82
creation of a calcium-aluminium-silicate-hydrate (C-A-S-H) gel, is different from low-calcium precursors. 83
Moreover, the reaction develops at a very rapid pace, often resulting in a very short initial setting time. The 84
blend of FA/ggbs for achieving a system reacting at room temperature without rapid setting would suit most 85
concrete applications. Relatively few publications are available in the literature [19-23] and thus further 86
investigations are needed to provide a better insight into the properties and performance of such binary 87
systems. 88
The work described here aimed to study (a) the effect of curing procedure and activator dosages on the 89
strength development of FA-based mortar, (b) the influence of physical and chemical properties of 13 FA 90
sources obtained from 8 UK power stations, (c) the effect of partial substitution with ggbs on the compressive 91
strength development and microstructure of the reacted mortar. 92
2 Materials and Methods 93
The chemical composition of 13 FA sources from the UK were assessed by X-ray fluorescence (XRF) at the 94
University of Leicester and these are shown in Table 1. Loss on Ignition (LOI) was determined on powders 95
previously dried overnight at 105°C. Samples were ignited for 90 minutes @ 950°C in air ventilated electric 96
muffle furnace and the mass loss was then calculated. Mineralogical characterisation was carried out by X-ray 97
diffraction (XRD) using a PANalytical X'Pert PRO X-ray diffractometer, equipped with programmable anti 98
scatter slits, rotating sample stage and the X’Celerator Real Time Multiple Strip X’lerator Detector. The incident 99
X-rays were from a Copper Kα X-ray source, running at 40 kV and 40 mA and obtained spectra are shown in 100
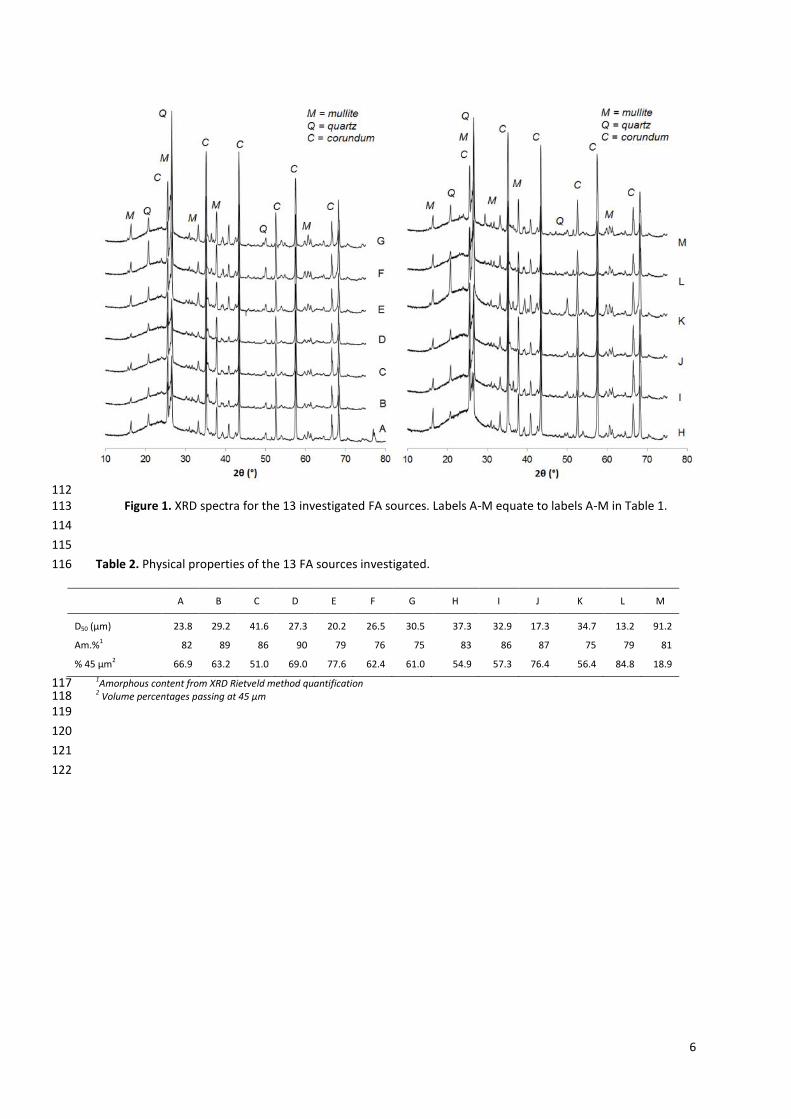
Figure 1. Quartz (SiO2) and mullite (3Al2O3∙2SiO2) were the main crystalline components identified. The 101
amorphous content (visible as the broad hump in the background of the XRD pattern centred at 20 – 30° 2θ) 102
was quantified by adding an internal standard (corundum) and performing a Rietveld method-based analysis 103
(results are shown in Table 2). Laser diffraction grain size distribution was used to assess the particle size 104
distribution of all the investigated sources of FA. Results are shown in Figure 2, where the 13 FA samples are 105
divided in three classes according to their D50 value (shown in Table 2): low (D50 < 25µm), medium (26 < D50 < 106
Page 5
5
30.5µm), and high (D50 > 30.5µm). FA A was the only one used to study the effect of curing procedure and 107
activator dosages. 108
Table 1. Elemental composition (from XRF) of the 13 FA sources investigated and of the ggbs utilised. Results 109
quoted as component oxide (and LOI) weight percent. 110
Oxide FA sources
ggbs A B C D E F G H I J K L M
SiO2 51.52 48.90 44.58 49.28 48.48 56.40 51.32 43.38 51.33 51.05 51.23 49.90 51.76 35.82
TiO2 0.97 0.95 0.91 0.95 1.08 0.92 1.03 0.84 0.97 1.02 0.80 1.02 0.89 0.00
Al2O3 23.58 23.51 21.94 23.43 24.86 22.14 24.85 23.63 24.12 25.06 18.37 27.12 24.51 13.00
Fe2O3 7.11 12.36 10.59 10.61 9.49 6.63 7.24 6.56 8.51 8.60 4.55 7.38 8.58 0.53
Mn3O4 0.07 0.15 0.13 0.10 0.12 0.07 0.09 0.13 0.11 0.09 0.06 0.08 0.15 0.51
MgO 1.75 1.97 1.93 1.73 2.22 1.59 1.56 1.36 1.92 1.79 1.36 1.45 1.92 8.00
CaO 3.86 3.41 3.61 2.68 4.53 2.97 2.88 2.83 2.75 2.37 2.55 2.25 3.78 40.62
Na2O 0.74 0.93 0.83 1.55 0.98 0.97 0.57 0.79 0.80 0.98 0.45 0.67 0.49 0.00
K2O 2.42 3.26 2.61 3.57 2.60 1.91 1.63 1.39 3.61 3.47 1.60 3.23 2.87 0.00
P2O5 0.37 0.41 0.38 0.32 0.45 0.58 0.75 0.72 0.25 0.33 0.61 0.33 0.25 0.00
SO3 0.84 0.49 0.59 0.47 0.63 0.47 0.41 0.28 0.49 0.32 0.39 0.18 0.32 0.05
V2O5 0.09 0.06 0.06 0.07 0.07 0.05 0.06 0.03 0.06 0.07 0.03 0.06 0.05 0.00
Cr2O3 0.02 0.02 0.02 0.02 0.03 0.02 0.03 0.01 0.02 0.03 0.01 0.02 0.02 0.00
SrO 0.10 0.08 0.08 0.07 0.15 0.12 0.13 0.15 0.06 0.07 0.15 0.07 0.05 0.00
ZrO2 0.00 0.07 0.06 0.07 0.07 0.07 0.07 0.11 0.06 0.07 0.07 0.06 0.06 0.00
BaO 0.14 0.14 0.14 0.14 0.20 0.20 0.18 0.26 0.15 0.16 0.22 0.21 0.18 0.00
NiO 0.02 0.02 0.02 0.02 0.02 0.02 0.02 0.01 0.01 0.02 0.01 0.02 0.01 0.00
CuO 0.02 0.02 0.02 0.02 0.02 0.01 0.02 0.00 0.01 0.02 0.00 0.02 0.01 0.00
ZnO 0.04 0.04 0.03 0.04 0.06 0.04 0.06 0.02 0.04 0.04 0.01 0.06 0.01 0.00
PbO 0.03 0.04 0.03 0.05 0.04 0.05 0.06 0.02 0.04 0.04 0.02 0.05 0.02 0.00
LOI 4.92 3.60 11.17 5.01 4.07 4.61 6.99 17.40 4.62 4.53 17.28 5.20 4.28 0.66
Total 98.61 100.43 99.73 100.20 100.17 99.84 99.95 99.92 99.93 100.13 99.77 99.38 100.21 99.19
111
Page 6
6
112 Figure 1. XRD spectra for the 13 investigated FA sources. Labels A-M equate to labels A-M in Table 1. 113
114
115
Table 2. Physical properties of the 13 FA sources investigated. 116
A B C D E F G H I J K L M
D50 (µm) 23.8 29.2 41.6 27.3 20.2 26.5 30.5 37.3 32.9 17.3 34.7 13.2 91.2
Am.%1 82 89 86 90 79 76 75 83 86 87 75 79 81
% 45 µm2 66.9 63.2 51.0 69.0 77.6 62.4 61.0 54.9 57.3 76.4 56.4 84.8 18.9
1Amorphous content from XRD Rietveld method quantification 117 2 Volume percentages passing at 45 µm 118
119
120
121
122
Page 7
7
123 Figure 2. Grain size distribution curves for the 13 investigated FA sources. Labels A-M equate to those in Fig. 1 124
and Table 1. 125
126
Ground granulated blast furnace slag was supplied by Hanson Ltd. The chemical composition was obtained by 127
XRF analysis and detected oxides are shown in Table 1. 128
Commercially available alkalis were used. Laboratory grade sodium hydroxide (NaOH) in solid form was 129
dissolved in water at the required dosage, whereas sodium silicate was supplied as a solution with the 130
following composition: 12.8% Na2O, 25.5% SiO2 and 61.7% H2O. The alkali dosage (M+) was defined as the 131
percentage mass ratio of total sodium oxide (Na2O) in the activating solution to the binder. The alkali modulus 132
(AM) was defined as the mass ratio of sodium oxide to silica in the activating solution. M+ was from 7.5% to 133
15%, whereas AM was from 0.5 to ∞ for the first series of experiments. The 0.5 corresponds to an all sodium 134
silicate solution and ∞ corresponds to an all sodium hydroxide solution. A range of dosages were used to find 135
which values gave the maximum strength. These values were then used in subsequent experiments 136
Page 8
8
investigating the influence of physical and chemical properties of different FA sources. For the assessment of 137
the effect of partial substitution with ggbs on the compressive strength development and microstructure of 138
the reacted mortar, AM was fixed at 1.25, whilst the M+ was varied from 3% to 10%. 139
The water/solids ratio was defined as the ratio between total mass of water (i.e. added water mass + water 140
mass in the alkali solutions) and the total solid mass (i.e. mass of binder + mass of alkali solids). This ratio was 141
kept constant at 0.37, except when the mixture was found to be of very low consistency after mixing. In such 142
cases, additional water was added until a workable mixture was obtained. This was generally only necessary 143
for 100% ggbs binder. 144
Well-graded, rounded quartz sand sized 0/5 mm was used for preparation of mortars. The adopted 145
sand/binder mass ratio was equal to 2.75. A 5 l planetary mixer was used. Binder and sand were placed in the 146
mixer bowl and mixed for one minute. The alkali solution was then added and the material was mixed for a 147
further 9 minutes. A flow table test was then performed according to BS EN 12350-5 [24]. Mixing was 148
continued for a further 5 minutes, giving a total mixing time of 15 minutes. The mortar was then transferred to 149
50 mm cube moulds and compacted on a vibrating table for 60 seconds. Moulds were then sealed by wrapping 150
in polyethylene film. 151
In the first series of mixes, four sets of curing conditions were used: (a) 1 hour at 20°C followed by curing at 152
50°C; (b) 24 hours at 20°C followed by curing at 50°C; (c) 1 hour at 20°C followed by curing at 70°C; (d) 24 153
hours at 20°C followed by curing at 70°C. One cube from each curing regime was tested in compression after 1, 154
3 and 7 days curing, with two cubes from each curing regime tested at 28 days. Stand time and oven curing 155
time were included for the computation of the total curing time. Some of the mixes were replicated to confirm 156
the reliability of the results. A 300 kN capacity compression testing machine was used for all testing with a 157
loading rate of 0.8 kN/s. 158
In the second series of mixes, two sets of curing conditions were used: (a) 1 hour at 20°C followed by curing at 159
50°C and (b) 1 hour at 20°C followed by curing at 70°C. Same procedure as in the first series of mixes was used 160
for determining the compressive strength. 161
Page 9
9
In the third series of mixes, two sets of curing conditions were used: (a) 1 hour at 20°C followed by curing at 162
70°C and (b) curing at 20°C (ambient/room temperature). Two replica cubes from each curing regime were 163
tested in compression at 1, 7 and 28 days. 164
X-ray diffraction on raw materials and reacted pastes was carried out with Panalytical X’Pert Pro MPD 165
Diffractometer with X’Celerator detector scanned the range of 4-70°2θ, using Cu K-α radiation. Zincite was 166
used as internal standard. HighScore Plus software was used to obtain semi-quantitative mineral weight 167
percentages. 168
Images for microstructural analysis were acquired with either a Philips XL30 Scanning Electron Microscope 169
equipped with an Oxford Instruments INCA energy dispersive X-ray spectroscopy (EDS) system or a Hitachi 170
TM300 SEM equipped with a Bruker Quantax 70 EDS systems. The EDS systems allow the collection of 171
chemical information for spots and areas in the samples. The samples comprised broken pieces (~5.0 x 5.0 x 172
2.5 mm) of hardened paste mounted onto aluminium stubs using epoxy adhesive, orienting the fractured 173
surface in a convenient position towards the SEM beam also bearing in mind the location of the EDS detector. 174
Samples were coated with a thin gold-palladium layer to provide a conductive pathway to prevent surface 175
electrical charging. 176
3 Results and discussion 177
3.1 Effect of curing procedure and activator dosages on strength development 178
Twenty-four combinations of M+ and AM were investigated for each of the four curing regimes, for a total 179
number of 96 different series of mixes. The effects of stand time (i.e. the time elapsed between the mixing and 180
the start of the curing in oven, during which the process of dissolution and gelation of aluminosilicates species 181
takes place), curing temperature, and activator dosage were investigated by determining the compressive 182
strength development. Obtained compressive strengths are shown in Table 3. 183
184
185
Page 10
10
Table 3. Compressive strengths for mortars produced varying stand time, curing temperature, chemical 186
dosages. Results are expressed in MPa. 187
AM Curing time
(days)
1 h stand time
50° curing 24 h stand
time 50° curing
1 h stand time
70° curing 24 h stand
time 70° curing
M+ M+ M+ M+
7.5 10 12.5 15 7.5 10 12.5 15 7.5 10 12.5 15 7.5 10 12.5 15
0.5
1 5.4 9.7 10.1
3
20.2
14.0 11.3
13.0 14.8
13.6 14.7 7 17.3 28.3
17.9 24.2
11.7 13.9
13.7 16.4
28
23.6
17.5 18.2
13.0 14.4
12.7 15.8
21.0 16.0 20.4 13.3 14.6 14.5 18.2
1
1
8.5 7.5 7.7 3.9
25.4 32.3 36.6 36.4
3.5
40.7
3.9
41.3
3
15.7 17.4 27.5 26.9 14.6 15.8 22.4 19.4 40.9 47.4 49.5 53.5 38.1 38.3 45.0 56.1
27.6
18.9
57.5
55.6
7 19.1 15.7 24.4 33.8 20.7 13.6 24.5 39.0 43.6 44.8 51.9 52.0 42.5 44.1 47.1 54.3
32.2
39.3
51.2
57.7
28
23.9 12.4 24.0 28.2 24.0 13.3 23.4 28.7 41.5 46.0 51.6 50.8 44.3 41.0 49.9 49.4
22.8 16.9 24.4 27.6 22.9 16.5 23.9 29.8 43.1 45.8 48.6 51.3 44.1 43.9 48.3 52.2
27.7
30.0
54.9
53.9
28.3 28.0 51.0 52.4
1.2
5
1 6.6 7.7 5.9 2.6
23.0 32.4 39.3 40.6
1.6
30.4
3
17.0 16.3 25.7 21.4 13.4 15.1 23.1 14.1 37.8 49.3 63.9 63.4 37.6 42.1 57.8 44.6
20.4
13.3
55.7
59.2
7
21.8 18.2 24.4 24.6 22.1 15.8 24.5 25.1 37.1 48.6 63.0 53.3 43.6 50.4 69.5 46.9
24.9
29.4
48.8
51.2
28
23.5 19.6 23.4 22.9 23.2 18.6 23.1 24.4 38.3 49.4 59.5 55.5 42.3 46.7 64.4 48.1
24.8 17.7 24.5 23.8 24.6 17.3 22.4 24.1 38.5 51.7 62.2 57.5 42.7 48.4 67.1 44.1
22.2
24.8
54.7
66.1
23.4 54.7 56.2
1.5
1 4.2 4.9 4.8 2.2
18.3 26.8 38.9 39.1 3 15.7 17.3 21.7 17.8 13.7 14.5 17.3 12.4 30.1 37.6 64.5 63.0 25.1 43.5 51.9 41.4
7 20.5 20.5 29.5 23.1 22.7 17.5 24.0 23.0 29.5 39.9 58.2 57.1 26.9 44.3 60.8 45.1
28 23.9 22.7 21.9 23.5 24.3 19.6 24.8 25.5 27.7 44.6 61.3 57.2 37.4 46.3 61.6 49.9
23.1 22.9 22.4 22.1 18.9 24.5 21.5 28.3 42.2 62.0 59.4 30.3 42.3 61.7 49.1
2
1 2.3 3.1 3.5 1.7
11.4 21.6 34.7 29.9
3 8.9 15.4 23.4 19.2 8.9 12.0 13.9 10.3 17.3 27.3 57.0 28.3 18.9 32.3 59.8 44.3
10.0
7
13.7 24.5 24.1 22.9 14.1 24.1 27.2 37.5 15.7 32.6 57.5 24.2 20.0 35.6 55.9 55.2
14.1
34.1 14.4
29.8 17.9
37.4 19.6
43.0
28
15.4 24.8 23.3 24.5 16.2 27.6 23.6 36.2 17.9 35.8 57.9 24.3 19.2 37.1 58.3 53.6
14.2 27.4 25.1 23.4 14.3 26.3 23.6 32.8 18.2 33.1 54.7 27.5 19.7 39.0 58.2 50.6
37.0
42.5
38.9
46.9
27.1 35.3 37.5 46.1
∞
1
1.0 0.0
6.4 14.3 16.5 9.9 3 7.8 12.6 7.5 3.1 4.5 3.9 19.8 1.5 10.3 23.1 24.8 22.5 11.9 22.8 37.5 35.5
7 9.8 14.5 19.6 21.4 9.1 18.1 21.8 25.7 11.6 22.6 28.1 25.7 12.9 23.1 27.8 26.4
28 10.7 17.0 19.4 18.1 10.7 16.9 19.3 24.9 13.4 24.8 31.9 26.0 14.2 27.0 33.2 35.8
10.8 17.7 17.4 15.9 10.6 17.8 20.5 25.7 13.5 24.2 31.9 26.1 14.0 24.4 36.4 38.1
188
3.1.1 Effect of stand time at 20 °C 189
In order to assess the effect of the time for dissolution and gelation at room temperature on ultimate strength, 190
half the samples in each mix were left to stand for 1 hour prior to oven curing and half for 24 hours. Figure 3 191
shows the results for the 28-day tests for the all mixes cured at 70 °C. It was observed that compressive 192
Page 11
11
strength increased from day 1 to day 7, and then the strength gain narrowed, with 7-day and 28-day strengths 193
being often similar. For this reason, it was considered appropriate to compare 28-day strengths of 1h and 24h 194
stand time samples, as the difference in curing time in the oven (27 vs. 28 days) can be considered negligible. 195
In general, the difference in strength at 28 days between those initially left to stand for 1 hour and those left 196
for 24 hours is small, with the compressive strengths for most mixes being within 6 MPa of each other. The 197
highest alkali dosage (M+ 15%) gave mixed results, with higher strength for 1 h stand time for high silicate 198
solution dosages (AM = 1.25 and 1.5) and the opposite for low silicate dosages (AM = 2 and ∞). This might be 199
explained by the fact that reactive silicates trigger the nucleation of gel and therefore, when a significant 200
amount is present (lower AM), the gel formation can start immediately and it is enhanced by the high 201
temperature. On the contrary, when the addition of silicates is low (higher AM), the system needs first to 202
achieve the dissolution of Si and Al from the precursor material by the alkali solution at room temperature, 203
whereas the thermal treatment starts the solidification of the gel without allowing enough time for the liquid 204
to complete the dissolution process. Although the difference between no stand time and some stand time can 205
make a difference on strengths by increasing the time for early dissolution and gelation, there appears to be 206
no benefit in leaving mixes for longer than 1 hour between mixing and oven curing. This may be of importance 207
when considering transferring the technology to industry. 208
209
Page 12
12
210 Figure 3. Compressive strengths at 28 days for 1 h and 24 h of stand time of 100% FA mortars (70°C curing 211
temperature) for a range of alkali modulus (AM) and alkali dosage (M+). Error bars represent the range of 212
obtained values. 213
214
3.1.2 Effect of curing temperature 215
Figure 4 shows the effect of curing temperature on the 28-day strengths of all mixes. It can be seen that in all 216
cases, with the exception of those with the lowest AM (0.5), 70°C curing temperatures give significantly 217
increased strengths compared to those cured at 50°C for the same time. The same trend was observed 218
irrespective of the “stand time” duration. Mixes with low alkali modulus were extremely viscous and also 219
tended to expand upon thermal curing, forming a muffin like top. Lower curing temperature leads to 220
mitigation of such expansion and this is reflected in the increased strengths. 221
The observed effect of curing temperature on the mechanical strength is well documented in the literature. 222
Investigations on reactivity of FA under thermal curing are reported to having been carried out for 223
temperatures in the range 30 °C to 85 °C [25]. Another study [26] found that increasing the curing temperature 224
from 45 °C to 65 °C resulted in a 5-fold rise of mechanical strength, whereas a 10-fold rise was observed 225
between 65 °C and 85 °C. Reaction kinetics resulting from different curing temperature were investigated with 226
Page 13
13
isothermal calorimetric tests on different materials (Portland cement, activated slag and fly ash, and selected 227
fly ash– slag blends) at 25 °C, 35 °C, and 40° C, observing the development of the polymerisation [27]. 228
229 Figure 4. Compressive strengths at 28 days of 100% FA mortars for 50°C and 70°C curing temperatures (1 h 230
stand time) for a range of alkali modulus (AM) and alkali dosage (M+). Error bars represent the range of 231
obtained values. 232
233
3.1.3 Effect of Alkali Dosage 234
The alkali dosage is a proxy for the alkali concentration, and describes the mass ratio of sodium oxide (Na2O) in 235
the activating solution to FA, where the water to total reactive solids ratio is fixed. An increase in alkali dosage 236
(M+) resulted in an increase of the strength up to an M+ of 12.5%. Beyond this ‘optimum’ value, the strengths 237
decreased, which is attributed to saturation of the gel with alkali ions resulting in less free water to be 238
available for speciation of silica and alumina oligomers from the dissolution of FA. 239
3.1.4 Effect of Alkali Modulus 240
The alkali modulus (AM) is the mass ratio of sodium oxide to silica in the activating solution and it is a proxy for 241
the amount of added silica in the activator solution. An optimum range of values for the alkali modulus was 242
identified, above and below which strengths decrease. With increasing alkali dosage, that ‘sweet spot’ 243
Page 14
14
broadens out towards higher alkali modulus. Again, results for M+ = 15% do not follow these trends. In 244
general, alkali moduli between 1 and 1.25 give the highest strengths across the alkali dosages investigated. 245
The drop-off in strength with increasing modulus is likely to be due to the reduced amount of available silica 246
that can participate in the ‘reorganisation-gelation-polymerisation’ steps of the geopolymer formation and 247
thus the development of a denser and more complete and long polymer chain. The reduction in strengths at 248
low modulus (AM=0.5: all sodium silicate) can be attributed to the reduction of the pH in the system when 249
only sodium silicate solution is used. The expansion of the cubes upon thermal curing could also have 250
contributed. 251
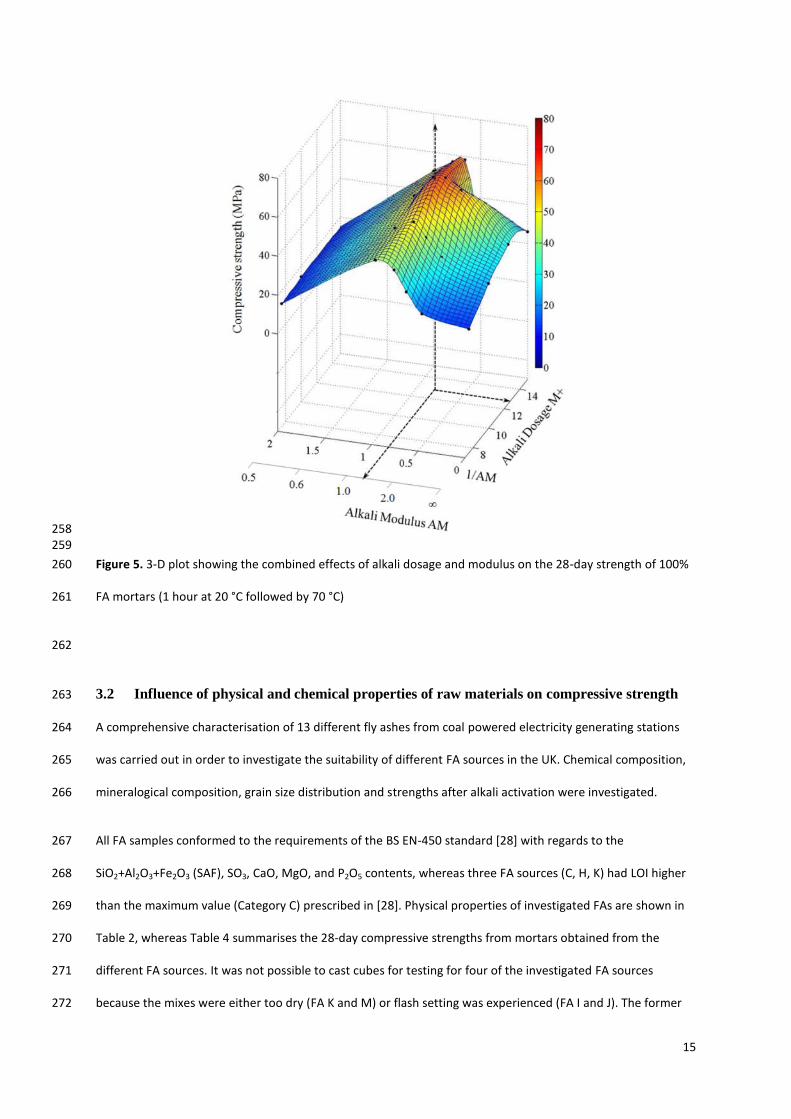
Figure 5 shows a 3-D plot identifying the combined effect of alkali dosage and modulus on compressive 252
strength for curing temperature of 70°C and “stand time” of 1 hour. These curing conditions were selected 253
because (a) 70 °C curing temperature gave the highest compressive strengths; (b) as previously discussed, no 254
significant benefit was observed in leaving mixes for stand time longer than 1 hour. 255
The ‘sweet spot’ of the optimum alkali modulus and dosage combinations has a strength maximum of 70 MPa 256
at around an alkali dosage of 12.5% and alkali modulus of 1.25. 257
Page 15
15
258 259
Figure 5. 3-D plot showing the combined effects of alkali dosage and modulus on the 28-day strength of 100% 260
FA mortars (1 hour at 20 °C followed by 70 °C) 261
262
3.2 Influence of physical and chemical properties of raw materials on compressive strength 263
A comprehensive characterisation of 13 different fly ashes from coal powered electricity generating stations 264
was carried out in order to investigate the suitability of different FA sources in the UK. Chemical composition, 265
mineralogical composition, grain size distribution and strengths after alkali activation were investigated. 266
All FA samples conformed to the requirements of the BS EN-450 standard [28] with regards to the 267
SiO2+Al2O3+Fe2O3 (SAF), SO3, CaO, MgO, and P2O5 contents, whereas three FA sources (C, H, K) had LOI higher 268
than the maximum value (Category C) prescribed in [28]. Physical properties of investigated FAs are shown in 269
Table 2, whereas Table 4 summarises the 28-day compressive strengths from mortars obtained from the 270
different FA sources. It was not possible to cast cubes for testing for four of the investigated FA sources 271
because the mixes were either too dry (FA K and M) or flash setting was experienced (FA I and J). The former 272
Page 16
16
appears to be due to the coarse nature of the FA coupled with a high LOI. The latter may have been suitable 273
for use in concretes if the alkali activator dosage was reduced. This has not however been investigated further. 274
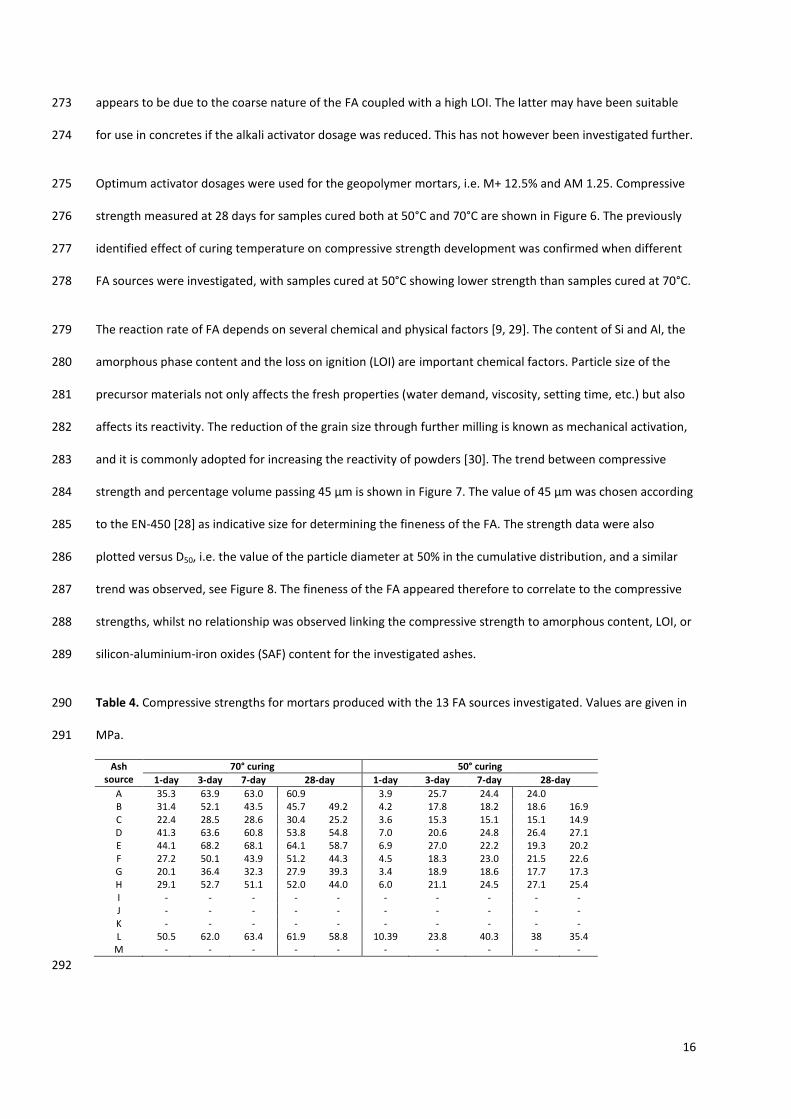
Optimum activator dosages were used for the geopolymer mortars, i.e. M+ 12.5% and AM 1.25. Compressive 275
strength measured at 28 days for samples cured both at 50°C and 70°C are shown in Figure 6. The previously 276
identified effect of curing temperature on compressive strength development was confirmed when different 277
FA sources were investigated, with samples cured at 50°C showing lower strength than samples cured at 70°C. 278
The reaction rate of FA depends on several chemical and physical factors [9, 29]. The content of Si and Al, the 279
amorphous phase content and the loss on ignition (LOI) are important chemical factors. Particle size of the 280
precursor materials not only affects the fresh properties (water demand, viscosity, setting time, etc.) but also 281
affects its reactivity. The reduction of the grain size through further milling is known as mechanical activation, 282
and it is commonly adopted for increasing the reactivity of powders [30]. The trend between compressive 283
strength and percentage volume passing 45 µm is shown in Figure 7. The value of 45 µm was chosen according 284
to the EN-450 [28] as indicative size for determining the fineness of the FA. The strength data were also 285
plotted versus D50, i.e. the value of the particle diameter at 50% in the cumulative distribution, and a similar 286
trend was observed, see Figure 8. The fineness of the FA appeared therefore to correlate to the compressive 287
strengths, whilst no relationship was observed linking the compressive strength to amorphous content, LOI, or 288
silicon-aluminium-iron oxides (SAF) content for the investigated ashes. 289
Table 4. Compressive strengths for mortars produced with the 13 FA sources investigated. Values are given in 290
MPa. 291
Ash source
70° curing 50° curing
1-day 3-day 7-day 28-day 1-day 3-day 7-day 28-day
A 35.3 63.9 63.0 60.9
3.9 25.7 24.4 24.0
B 31.4 52.1 43.5 45.7 49.2 4.2 17.8 18.2 18.6 16.9 C 22.4 28.5 28.6 30.4 25.2 3.6 15.3 15.1 15.1 14.9 D 41.3 63.6 60.8 53.8 54.8 7.0 20.6 24.8 26.4 27.1 E 44.1 68.2 68.1 64.1 58.7 6.9 27.0 22.2 19.3 20.2 F 27.2 50.1 43.9 51.2 44.3 4.5 18.3 23.0 21.5 22.6 G 20.1 36.4 32.3 27.9 39.3 3.4 18.9 18.6 17.7 17.3 H 29.1 52.7 51.1 52.0 44.0 6.0 21.1 24.5 27.1 25.4 I - - - - - - - - - - J - - - - - - - - - - K - - - - - - - - - - L 50.5 62.0 63.4 61.9 58.8 10.39 23.8 40.3 38 35.4 M - - - - - - - - - -
292
Page 17
17
293 Figure 6. 28-day compressive strength of 9 FA sources at different curing temperatures. Letters A-L equate to 294
same in Table 1 and Figs. 1-2. Error bars represent the range of obtained values. 295
296
297
298 Figure 7. 28-day compressive strength of 9 FA sources cured at 70 °C vs. % volume passing 45 µm sieve. Error 299
bars represent the range of obtained values. 300
Page 18
18
301 Figure 8. 28-day compressive strength of 9 FA sources cured at 70 °C vs. D50. Error bars represent the range of 302
obtained values. 303
304
It may therefore be concluded that one of the most important factors to consider for achieving high 305
compressive strengths is the grain size of the FA. It must, however, be emphasised that ten out of thirteen of 306
the tested FA samples are suitable for use in concretes to partially replace Portland cement and thus conform 307
to EN-450. Attempts to examine fuel ash from lagoons were not successful. It may be that the chemical 308
composition of lagoon ash has been altered over time and it is thus considerably different from all the sources 309
investigated in this programme of work. 310
3.3 Effect of partial replacement of FA with ggbs 311
Mortar mixtures containing only FA did not develop any significant strength at room temperature. However, 312
the addition of ggbs at any level gave significant strength enhancements even at room temperature. Figure 9 313
shows the strength of FA/ggbs based mortars with M+ 7.5% and AM 1.25. There is an almost linear 314
relationship between the amount of ggbs in the binder and the strength at 1, 7 and 28 days where cubes were 315
cured at room temperature (20°C). This seems to suggest that FA did not contribute much to the strength. 316
There was a significant increase in the strength from ~20MPa to ~50MPa with the addition of only 20% ggbs 317
when cured for 1 day at 70 °C. Higher levels of ggbs cured for 1 day resulted in smaller incremental increases 318
up to ~60MPa at 100% ggbs. 319
Page 19
19
320 Figure 9. Effect of ggbs substitution rate on the strength of sodium silicate/sodium hydroxide-activated binders 321
with M+ 7.5% and AM 1.25. (a) 1 day; (b) 7 days; (c) 28 days. Error bars represent the range of obtained values. 322
323
Continued curing at 70°C for 7 and 28 days resulted in strength reductions for mixes with greater than 20% 324
ggbs. This is believed to be due to self-desiccation and resulting drying shrinkage, which is an effect that has 325
previously been observed in alkali-activated slags [7]. In accordance with this effect, the highest strength was 326
achieved for specimens cured at room temperature and not for oven-cured samples. Compressive strength of 327
80 MPa was obtained at 28 days for the mortar containing 80% slag and cured at room temperature. 328
Subsequent investigations focussed on the effect of alkali dosage on the strength development of FA/ggbs 329
blends. The AM was kept constant while the M+ was varied from 3% to 10% for varying levels of FA 330
replacement with ggbs. Figure 10 shows the 3-D plot of the 28-day compressive strength of specimens cured 331
at room temperature. M+ 10% mixes could not be easily cast for ggbs contents higher than 20% due to quick 332
setting. It can be observed that the increase in ggbs content led to an incremental increase in the compressive 333
strength. 334
335
Page 20
20
336 Figure 10. 3-D plot showing the combined effects of FA/ggbs ratio and M+ variation on the 28-day compressive 337
strength of sodium silicate/sodium hydroxide-activated binders cured at room temperature 338
339
3.4 X-Ray Diffraction results for raw materials and reacted pastes 340
In order to investigate the nature and composition of the reaction products, raw material and reacted pastes 341
were analysed with X-ray diffraction (XRD) technique. FA A was used for the synthesis of pastes. The raw 342
materials were activated with the following dosages: M+ 7.5%, AM = 1.25 and w/s ratio 0.37. 100% FA, 100% 343
ggbs and a 50/50 FA/ggbs paste were produced. After 28 days oven curing at 70 ˚C, pastes were crushed using 344
distilled water in a McCrone Mill for 5 min and dried at 50°C for 14 hours. An internal standard (zincite, ZnO) 345
was included at 10% in weight for semi-quantitative analysis of the material composition. Diffractograms for 346
unreacted FA showed approximately 75% of amorphous content, due to the inclusion of the internal standard. 347
After depuration from the 10% zincite, the main crystalline phases were quartz (SiO2, 3.9% in weight), mullite 348
(2Al2O3∙SiO2, 10.6% in weight), and minor contents of calcite (CaCO3, 1.4% in weight) and maghemite (Fe2O3, 349
0.8% in weight), whereas the amorphous content was around 83%, in line with the value shown in table 2. 350
Ggbs sample with internal standard showed an amorphous content of about 88%, which resulted in about 98% 351
Page 21
21
after depuration from the 10% crystalline ZnO, with about 1.7% in weight of crystalline CaCO3 and traces of 352
quartz. 353
Figure 11 shows the compared diffractograms for 100% FA (A), 100% ggbs (B) and 50/50 FA/ggbs (C). 354
Page 22
22
355 Figure 11. XRD diffractograms of raw materials and reacted pastes. (a) 100% FA (b) 100% ggbs (c) 50/50 356
FA/ggbs 357
358
Page 23
23
No new crystalline phase was obtained from the activation of FA. Quartz and mullite, as expected, did not 359
participate to the reaction, as their mass contents remained almost unchanged. On the contrary, the activation 360
of ggbs resulted in a decrease in amorphous content from 98% to 87% (corrected values) and in an increase in 361
calcite content from 1.7% to 9.4%, with peaks for calcite clearly higher in the activated ggbs paste 362
diffractogram. It is likely that the calcite in activated ggbs sample is a combination of high and low crystallinity 363
forms, as apparent by the broad base to the 29.4°2θ peak. 364
The 50/50 FA/ggbs paste produced results half way between 100% ggbs and 100% FA pastes. Quartz and 365
content did not change, whereas crystalline calcite content increased from 1.5 wt% of the starting material to 366
6.0 wt% of the paste, with the amorphous phase decreasing from 90.7% to 88 wt%. 367
3.5 Microstructure and chemistry of the pastes 368
The different mechanical behaviour of FA and FA/ggbs mixes discussed above would be expected to correlate 369
in some way with microstructure or reaction products found in the pastes. To test this, SEM analysis was 370
carried out on the three pastes, i.e. 100% ggbs, 100% FA and 50/50 FA/ggbs, cured at 70˚ C for 28 days. 371
3.5.1 100% ggbs paste 372
The basic microstructure of 100% ggbs paste is shown in Figure 12(a) and (b). The paste is made up of 373
unreacted particles of ggbs in a smooth and homogenous looking gel. The paste is traversed by 374
interconnecting curved fractures that locally break up the paste into ~10-20 µm size conchoidal particles. The 375
fractures have morphologies characteristic of desiccation, particularly evident in Figure 12(b). EDS-based 376
chemical analysis of unreacted ggbs and the surrounding gel from the points indicated in Figure 12(a) are 377
summarised in Table 5 and on the ternary diagram in Figure 13. The vertices of the ternary diagram have been 378
chosen to encompass the main chemical compositions of the gels developed in all three pastes. The Na, Ca and 379
Al values in Table 5 have been ‘normalised’ to Si content in each case in order to alleviate the inherent semi-380
quantitative nature of EDS chemical analysis on rough surfaces. It is worth noting in Figure 13 that the 381
unreacted 100% ggbs particles and the 100% ggbs gel form separate clusters that lie on a line that intersects 382
the Na/Si corner of the plot, where the alkali activator plots (see dashed line in Figure 13). The 100% ggbs gel 383
thus lies about half way along a potential mixing line between the original ggbs composition and the activator 384
Page 24
24
composition, suggesting more or less equal contribution of ggbs and activator in the reaction to produce the 385
gel. 386
387 Figure 12. SEM back-scattered electron (A-G) and secondary electron (H) images of geopolymer paste broken 388
surfaces. Numbered spots on A, C, D, E and F are locations of EDS chemical analyses. A & B: paste made with 389
100% ggbs. C&D: paste made with 100% FA. E-H: paste made with 50% ggbs and 50% FA. 390
391
392
393
Page 25
25
394
Table 5. EDS analysis of 100% ggbs paste. Spot numbers refer to Figure 14(a). Analyses with Oxford 395 Instruments INCA. 396
Spot O Na Mg Al Si K Ca Ti Mn Fe Al/Si Ca/Si Na/Si Description
1 53.42 20.99 2.00 3.22 9.96 0.15 9.95 0.13 0.17
0.323 0.999 2.107 C-(N)-A-S-H gel
2 50.95 16.29 3.13 4.03 11.07 0.31 13.69 0.27 0.23
0.405 1.237 1.472 C-(N)-A-S-H gel
3 46.93 20.21 1.07 3.00 11.38 0.42 16.63 0.23
0.301 1.461 1.776 C-(N)-A-S-H gel
4 49.80 19.25 1.38 3.18 11.25 0.27 14.20 0.23 0.28 0.16 0.319 1.262 1.711 C-(N)-A-S-H gel
5 43.54 5.30 3.60 5.80 15.09 0.41 25.23 0.28 0.60
0.582 1.672 0.351 Unreacted ggbs particle
6 43.57 7.08 3.65 4.94 13.72 0.53 24.72 0.60 1.05
0.496 1.802 0.516 Unreacted ggbs particle
7 36.59 3.71 3.14 5.22 15.97 0.61 33.99 0.56 0.56
0.524 2.128 0.232 Unreacted ggbs particle
397
Table 6(a). EDS analysis of 100% FA paste. Spot numbers refer to Figure 14(c). Analyses with Oxford 398 Instruments INCA. 399
Spot O Na Mg Al Si K Ca Ti Mn Fe Al/Si Ca/Si Na/Si Description
1 47.27 2.78 0.76 15.02 26.5 3.58 0.94 0.78
2.36 1.508 0.035 0.105 Unreacted FA particle
2 54.2 8.53 0.54 11.15 19.08 1.51 2.08 0.28
2.62 1.119 0.109 0.447 N-A-S-H gel
3 49.77 10.24 0.58 8.96 22.88 2.18 2.7 0.51
2.17 0.900 0.118 0.448 N-A-S-H gel
400
Table 6(b). EDS analysis of 100% FA paste. Spot numbers refer to Figure 14(d). Analyses with Oxford 401 Instruments INCA. 402
Spot O Na Mg Al Si K Ca Ti Mn Fe Al/Si Ca/Si Na/Si Description
1 53.09 1.21 0.89 14.18 23.50 2.89 1.34 0.44
2.37 1.424 0.057 0.051 Unreacted FA particle
2 47.03 14.67 0.53 9.57 20.68 1.94 1.72 0.42 0.23 3.20 0.961 0.083 0.709 N-A-S crystal
3 48.34 18.89 0.49 7.77 17.44 1.93 1.63 0.53
3.03 0.780 0.093 1.083 N-A-S crystal
4 51.39 7.02 0.76 11.05 21.23 1.93 2.11 1.18
3.29 1.109 0.099 0.331 N-A-S-H gel
403
Table 7(a). EDS analysis of 50/50 FA/ggbs paste (1st
sample). Spot numbers refer to Figure 14(e). Analyses with 404 Oxford Instruments INCA. 405
Spot O Na Mg Al Si K Ca Ti Mn Fe Si/Al Ca/Si Na/Si Description
1 38.00 0.27 4.86 6.98 18.58 0.51 29.44 0.63 0.46 0.26 0.701 1.584 0.015 Unreacted ggbs particle
2 29.37 0.37 4.41 7.49 19.39 0.51 37.24 0.61 0.39 0.23 0.752 1.921 0.019 Unreacted ggbs particle
3 45.51 1.25 1.17 18.27 24.38 2.19 1.22 0.64
5.39 1.834 0.050 0.051 Unreacted FA particle
4 40.95 0.47 4.53 6.95 17.02 0.47 28.54 0.40 0.32 0.37 0.698 1.677 0.027 Unreacted ggbs particle
5 49.12 8.41 1.21 7.04 20.92 1.28 10.44 0.39
1.06 0.707 0.499 0.402 C-(N)-A-S-H gel
6 48.95 5.10 2.83 6.42 17.77 1.03 16.37 0.31 0.38 0.87 0.645 0.921 0.287 C-(N)-A-S-H gel
7 40.81 5.41 2.20 6.96 21.86 1.55 19.17 0.44 0.49 1.12 0.699 0.877 0.247 C-(N)-A-S-H gel
8 39.53 6.31 1.93 8.45 23.71 1.55 15.8 0.39 0.5 1.84 0.848 0.666 0.266 C-(N)-A-S-H gel
406
407
408
Page 26
26
Table 7(b). EDS analysis of 50%/50% FA/ggbs paste (2nd
sample). Spot numbers refer to Figure 14(f). Analyses 409 with Bruker Quantax 70. 410
Spot O Na Mg Al Si K Ca Ti Mn Fe Si/Al Ca/Si Na/Si Description
1 44.01 1.20 4.42 6.33 17.39 0.52 24.98 0.46 0.55 0.13 0.636 1.436 0.069 Unreacted ggbs particle
2 44.37 3.06 1.19 16.12 26.12 3.51 2.16 0.37
3.10 1.618 0.083 0.117 Unreacted FA particle
3 51.08 7.82 1.08 6.88 18.22 1.85 12.79 0.27
0.691 0.702 0.429 C-(N)-A-S-H gel
4 49.55 7.53 0.86 7.16 18.21 2.14 12.67 0.57 0.41 0.89 0.719 0.696 0.414 C-(N)-A-S-H gel
5 46.36 8.01 1.54 7.12 20.92 0.96 13.64 0.24
1.20 0.715 0.652 0.383 C-(N)-A-S-H gel
6 49.03 8.32 1.78 7.18 20.29 2.05 10.17 0.29 0.25 0.65 0.721 0.501 0.410 C-(N)-A-S-H gel
7 51.84 7.97 1.54 5.95 17.14 1.54 12.17
0.89 0.97 0.597 0.710 0.465 C-(N)-A-S-H gel
411
3.5.2 100% FA paste 412
The basic microstructure of 100% FA paste is shown in Figure 12(c) and (d). The paste is made up of unreacted 413
particles of FA in a rough and sugary looking granular gel. There are commonly gaps between the gel and the 414
unreacted FA suggesting weak bonding of gel to unreacted particles. Some long fractures are present, but 415
these have a morphology suggesting they formed during breakage of the sample rather than by desiccation. 416
EDS-based chemical analysis of unreacted FA and the surrounding gel from the points indicated in Figure 12(c) 417
and (d) are summarised in Table 6(a) and (b) as well as on the ternary diagram in Figure 13. It is clear that the 418
FA cenospheres are relatively enriched in Al and depleted in Ca and Na relative to Si content. On the other 419
hand, the rough sugary gel is relatively enriched in Na and slightly enriched in Ca relative to the unreacted FA. 420
In this case, the unreacted FA and the gel do not lie directly on a potential mixing line between the unreacted 421
FA and the Na/Si corner of Figure 13. While this may be due to analytical errors resulting from EDS-analysis of 422
rough surfaces, it is also possible that reactions responsible for gel formation preferentially fractionated 423
available Ca in the FA into the gel. 424
3.5.3 50% FA and 50% ggbs paste 425
The basic microstructure of 50% FA and 50% ggbs paste is shown in Figure 12(e) and (f). The paste is made up 426
of unreacted particles of FA and ggbs in a smooth isotropic looking gel. The microstructure for 50/50 FA/ggbs 427
shows unreacted or partially reacted FA cenospheres and ggbs grains surrounded by an amorphous matrix 428
which was smooth and homogeneous in some places whilst rough and more heterogeneous in others. There 429
are relatively few fractures, which do not look like desiccation fractures. The contact between gel and 430
unreacted ggbs is typically sharp, whereas there is often a gap between the gel and unreacted FA cenospheres; 431
the large cenosphere in the centre of Figure 12(h) is an exception. EDS-based chemical analysis of unreacted 432
Page 27
27
FA/ggbs and the surrounding gel from the points indicated in Figure 12(e) and (f) are summarised in Table 7(a) 433
and (b) as well as on the ternary diagram in Figure 13. The unreacted ggbs and FA have compositions similar to 434
those in the 100%ggbs and 100%FA pastes, respectively (Figure 13). The gel has a composition that lies within 435
a triangle formed by the unreacted FA and ggbs and the alkali-activator composition indicating all three 436
reactants were involved in the reaction to produce the gel. The position of the gel composition relative to the 437
reactants indicates ggbs was the main contributor to the gel and the alkali activator the least. 438
439 Figure 13. Triangular plot of Ca, Al, Na compositions normalised to Si content for FA and GGBS particles, 440
various gels, and some Na-Si crystals formed in one sample. Calculated compositions for the pastes are plotted 441
as six pointed stars. Added NaOH and sodium silicate solution would plot on the Na/Si corner. See text for 442
further explanation and discussion. 443
444
The three microstructures are quite different. The 100% FA gel looks granular and potentially porous with a 445
commonly poor adhesion to unreacted FA particles. In contrast the 100% ggbs gel is homogeneous and looks 446
denser, but is cut by interconnecting desiccation cracks. Both microstructures look inherently weak. The 447
50%FA-50%ggbs gel microstructure is homogeneous and dense looking and lacks the desiccation cracks found 448
in the 100% ggbs gel. The addition of aluminium from the FA has resulted in a non-granular gel that does not 449
shrink, and is perhaps stronger. 450
Page 28
28
Overall, the main product from a FA-based system is a sodium-alumina-silicate-hydrate geopolymeric gel (N-A-451
S-H) with very low Ca/Si ratio, though perhaps a little higher than would be expected from the compositions of 452
FA and the alkali activator. The gel composition is similar to the calculated bulk composition of the gel 453
ingredients (Figure 13). 454
In contrast, the high calcium 100% ggbs system produces a calcium-alumina-silicate-hydrate gel (C-A-S-H) with 455
low Al/Si ratio of 0.3-0.4 and a Ca/Si of 1 to 1.5, as has been reported by several researchers [31-33] for alkali 456
activated slag systems. The reaction products are similar to the C-S-H gel in Portland cement systems, where 457
higher Ca/Si ratios are obtained in the range 1.2 to 2.3 [34], and are presumably various forms of calcium 458
silicate hydrates and calcium aluminium hydrates. The gel composition is much more Na-rich than the 459
calculated bulk composition of the gel ingredients and even the unreacted ggbs particles contain significant Na 460
(Figure 13). Re-examination of the same surface about 9 months later revealed a coating of sodium carbonate 461
crystals in rosette forms (Figure 14) indicating an excess of Na in the gel reaction. These rosettes were not 462
visible shortly after the 100% ggbs paste was made (see Figure 12(a) and (b)). This raises the possibility that 463
the higher than expected Na measurements from the surfaces in Figure 12 (a) and (b) reflect initial sub-464
microscopic formation of sodium carbonate crystals at the sample surface as efflorescence due to evaporation 465
of excess sodium-bearing solute, which as it progressed led to formation of the larger rosette crystals. Thus, 466
we suggest that the 100% ggbs gel at the broken sample surface has progressively incorporated Na from the 467
alkali activator. 468
The 50% FA 50% ggbs system produces a C-A-S-H gel with Na/Si in the range 0.25-0.5, Ca/Si at 0.5-0.9 and Si/Al 469
at 0.6-0.85, compositions similar to the calculated bulk composition of the gel ingredients (Figure 13). The gel 470
microstructure looks dense and is uncracked. It has been reported in [35] that alkalis (Na in this case) can be 471
incorporated into a C-A-S-H gel structure in order to balance the charge of tetrahedral Al, therefore it could 472
also be written C-(N)-A-S-H. As suggested in the literature [36], the calcium silicate hydrate gel fills the pores 473
and voids left by the water escaping the “pure” geopolymeric gel (N-A-S-H), resulting in a more compact and 474
dense structure that is responsible for the increase in mechanical strength compared to the 100% pfa paste. 475
The coexistence of N-A-S-H and C-A-S-H gels has been reported in the literature [33, 36-37]. 476
Page 29
29
477 Figure 14. Back-scattered electron images of 100% ggbs paste surface ~9 months after images in Figure 12. A 478
shows distribution of sodium carbonate crystals (dark areas) grown on the paste surface (light area). B shows a 479
detail of the rosette structure formed by the sodium carbonate crystals and the characteristic desiccation 480
cracks in the gel. 481
482
4 Conclusions 483
Geopolymer and alkali activated binders can offer a possible alternative to Portland cement concrete. 484
Notwithstanding all the research work that has been carried out all over the world, an easy way of selection of 485
raw material and their proportioning to obtain desired properties has remained a trial and error procedure. 486
The following factors affecting the mechanical properties were therefore investigated in order to provide 487
guidance for the selection of raw materials and their proportioning to produce geopolymer concretes of the 488
required properties: (a) the effect of curing procedure and activator dosages on the strength of FA-based 489
mortar; (b) the influence of physical and chemical properties of different FA sources; (c) the effect of partial FA 490
replacement with ggbs. 491
The conclusions from this work are: 492
1. Curing temperature has a very significant effect on strength of FA based geopolymers: specimens 493
cured at 70°C were considerably stronger than specimens cured at 50°C. Stand time was found to be 494
less important and as such an 1 hour stand time before oven curing was considered sufficient. 495
2. The dosage of activators is very important for not only achieving the required early age properties but 496
also for the effect on compressive strength. A ‘sweet spot’ of the optimum alkali modulus and dosage 497
combinations, i.e. alkali dosage of 12.5% and alkali modulus of 1.25, gave compressive strength of ~70 498
MPa. 499
Page 30
30
3. Physical and chemical properties of potential FA sources should be investigated before selecting the 500
most suitable one. Average grain size was found to be one of the important factors affecting the 501
potential compressive strength. Coarse FA coupled with low amorphous content and high LOI needs 502
to be avoided. 503
4. Partial FA replacement with ggbs leads to increases in the compressive strength. Strengths of 80 MPa 504
with only M+ 7.5% and AM 1.25 were obtained. The other benefit from such blends is that curing at 505
room temperature only is sufficient and no elevated curing temperatures are needed. 506
5. SEM investigation on pastes of 100% FA, 100% ggbs and 50/50 FA/ggbs assisted in determining the 507
microstructure, reaction products and their chemical composition. The 100% FA and 100% ggbs mixes 508
produce distinctly different microstructures, i.e. dominated by coarse granularity and desiccation 509
cracking respectively. The 50/50 FA/ggbs mix develops a homogeneous, dense gel with little 510
microcracking and good bonding to unreacted ggbs and FA particles. The 50/50 FA/ggbs 511
microstructure looks like it should be stronger and it has been proved to be so when 70˚ C oven curing 512
conditions are applied. 513
6. A calcium alumina silicate hydrate gel with inclusions of Na+ cations in the structure was found in the 514
samples containing ggbs. This was denser than the sodium alumina silicate hydrate gel (N-A-S-H) 515
found for 100% FA samples and this could explain the improved compressive strengths. 516
5 Acknowledgements 517
This research was carried out at the University of Liverpool in the framework of the Carbon Trust Applied 518
Research Grant 0911-0252 “Ultra High Performance Fibre Reinforced Cementless Precast Concrete Products”. 519
The work was then continued at Queen’s University of Belfast with the financial support of the SUSCON 520
project, which has received funding from the European Union Seventh Framework Programme (FP7/2007-521
2013) under Grant Agreement No. 285463 (Call FP7-2011-NMP ENV-ENERGY-ICT-EeB). 522
6 References 523
[1] Davidovits, J. (2008) Geopolymer chemistry and applications. Institut Geopolymere. 524
Page 31
31
[2] Davidovits, J. (1989). Geopolymers and geopolymeric materials. Journal of thermal analysis, 35(2), 525
429-441. 526
[3] Davidovits, J. (1991). Geopolymers. Journal of thermal analysis, 37(8), 1633-1656. 527
[4] Davidovits, J. (1993). Geopolymer cements to minimise carbon-dioxide greenhouse-warming. Ceram. 528
Trans., 37, 165-182. 529
[5] Barbosa, V. F., MacKenzie, K. J., & Thaumaturgo, C. (2000). Synthesis and characterisation of materials 530
based on inorganic polymers of alumina and silica: sodium polysialate polymers. International Journal 531
of Inorganic Materials, 2(4), 309-317. 532
[6] Kriven, W. M., Bell, J. L., & Gordon, M. (2003). Microstructure and Microchemistry of Fully‐Reacted 533
Geopolymers and Geopolymer Matrix Composites. Advances in Ceramic Matrix Composites IX, 534
Volume 153, 227-250. 535
[7] Shi, C., Roy, D., & Krivenko, P. (2006). Alkali-activated cements and concretes. CRC press. 536
[8] Van Jaarsveld, J. G. S., & Van Deventer, J. S. J. (1999). Effect of the alkali metal activator on the 537
properties of fly ash-based geopolymers. Industrial & Engineering Chemistry Research, 38(10), 3932-538
3941. 539
[9] Provis, J. L, van Deventer, J. S. (2014). Alkali Activated Materials. J. L. Provis (Ed.). Springer. 540
[10] Jimenez, A. M. F., Lachowski, E. E., Palomo, A., & Macphee, D. E. (2004). Microstructural 541
characterisation of alkali-activated PFA matrices for waste immobilisation. Cement and Concrete 542
Composites, 26(8), 1001-1006. 543
[11] Kong, D. L., & Sanjayan, J. G. (2010). Effect of elevated temperatures on geopolymer paste, mortar 544
and concrete. Cement and Concrete Research, 40(2), 334-339. 545
[12] Wallah, S. E., & Rangan, B. V. (2006). Low-calcium fly ash-based geopolymer concrete: long-term 546
properties. Res. Report-GC2, Curtin University, Australia. pp, 76-80. 547
[13] Duxson, P., Fernández-Jiménez, A., Provis, J. L., Lukey, G. C., Palomo, A., & Van Deventer, J. S. J. 548
(2007). Geopolymer technology: the current state of the art. Journal of Materials Science, 42(9), 2917-549
2933. 550
[14] Andini, S., Cioffi, R., Colangelo, F., Grieco, T., Montagnaro, F., & Santoro, L. (2008). Coal fly ash as raw 551
material for the manufacture of geopolymer-based products. Waste management, 28(2), 416-423. 552
Page 32
32
[15] Duxson, P., Provis, J. L., Lukey, G. C., & Van Deventer, J. S. (2007). The role of inorganic polymer 553
technology in the development of ‘green concrete’. Cement and Concrete Research, 37(12), 1590-554
1597. 555
[16] Soutsos, M.N., Vinai, R., & Rafeet, A. (2015). Effect of alkali dosage and modulus on strength 556
development and microstructure of alkali-activated binders. 14th
International Congress on the 557
Chemistry of Cement (ICCC 2015), 13-16 October 2015, Beijing, China 558
[17] Department of Energy & Climate Change, Electricity: chapter 5, Digest of United Kingdom energy 559
statistics (DUKES). https://www.gov.uk/government/statistics/electricity-chapter-5-digest-of-united-560
kingdom-energy-statistics-dukes. Accessed on 17 June 2015. 561
[18] Heath, A., Paine, K., Goodhew, S., Ramage, M., & Lawrence, M. (2013). The potential for using 562
geopolymer concrete in the UK. Proceedings of the Institution of Civil Engineers: Construction 563
Materials, 166(4), 195-203. 564
[19] Puertas, F., & Fernández-Jiménez, A. (2003). Mineralogical and microstructural characterisation of 565
alkali-activated fly ash/slag pastes. Cement and Concrete composites, 25(3), 287-292. 566
[20] Puertas, ., Mart ne -Ram re , S., Alonso, S., a ue , T. (2000). Alkali-activated fly ash/slag 567
cements: strength behaviour and hydration products. Cement and Concrete Research, 30(10), 1625-568
1632. 569
[21] Puligilla, S., & Mondal, P. (2013). Role of slag in microstructural development and hardening of fly ash-570
slag geopolymer. Cement and Concrete Research, 43, 70-80. 571
[22] Ismail, I., Bernal, S. A., Provis, J. L., San Nicolas, R., Hamdan, S., & van Deventer, J. S. (2014). 572
Modification of phase evolution in alkali-activated blast furnace slag by the incorporation of fly ash. 573
Cement and Concrete Composites, 45, 125-135. 574
[23] Kumar, S., Kumar, R., & Mehrotra, S. P. (2010). Influence of granulated blast furnace slag on the 575
reaction, structure and properties of fly ash based geopolymer. Journal of Materials Science, 45(3), 576
607-615. 577
[24] British Standards Institution, Testing fresh concrete - Part 5: Flow table test, BS EN 12350-5:2000. 578
[25] Kovalchuk, G., Fernández-Jiménez, A., & Palomo, A. (2007). Alkali-activated fly ash: effect of thermal 579
curing conditions on mechanical and microstructural development–Part II. Fuel, 86(3), 315-322. 580
Page 33
33
[26] Palomo, A., Alonso, S., ernande ‐Jiméne , A., Sobrados, I., San , J. (2004). Alkaline activation of fly 581
ashes: NMR study of the reaction products. Journal of the American Ceramic Society, 87(6), 1141-582
1145. 583
[27] Chithiraputhiran, S., & Neithalath, N. (2013). Isothermal reaction kinetics and temperature 584
dependence of alkali activation of slag, fly ash and their blends. Construction and Building Materials, 585
45, 233-242. 586
[28] British Standards Institution, Fly ash for concrete. Definitions, specifications and conformity criteria, 587
BS EN 450-1:2005 + A1:2007. 588
[29] Fernández-Jiménez, A., & Palomo, A. (2003). Characterisation of fly ashes. Potential reactivity as 589
alkaline cements☆. Fuel, 82(18), 2259-2265. 590
[30] Kumar, R., Kumar, S., & Mehrotra, S. P. (2007). Towards sustainable solutions for fly ash through 591
mechanical activation. Resources, Conservation and Recycling, 52(2), 157-179. 592
[31] Escalante‐García, J. I., Fuentes, A. F., Gorokhovsky, A., Fraire‐Luna, P. E., & Mendoza‐Suarez, G. (2003). 593
Hydration Products and Reactivity of Blast‐Furnace Slag Activated by Various Alkalis. Journal of the 594
American Ceramic Society, 86(12), 2148-2153. 595
[32] Richardson, I. G., Brough, A. R., Groves, G. W., & Dobson, C. M. (1994). The characterization of 596
hardened alkali-activated blast-furnace slag pastes and the nature of the calcium silicate hydrate 597
(CSH) phase. Cement and Concrete Research, 24(5), 813-829. 598
[33] Ismail, I. (2013). Durability as a function of microstructure of alkali-activated slag/fly ash binders, PhD 599
thesis, University of Melbourne. 600
[34] Richardson, I. G. (1999). The nature of CSH in hardened cements. cement and concrete research, 601
29(8), 1131-1147. 602
[35] Provis, J. L. (2014). Geopolymers and other alkali activated materials: why, how, and what? Materials 603
and structures, 47(1-2), 11-25. 604
[36] Yip, C. K., Lukey, G. C., & Van Deventer, J. S. J. (2005). The coexistence of geopolymeric gel and 605
calcium silicate hydrate at the early stage of alkaline activation. Cement and Concrete Research, 35(9), 606
1688-1697. 607
Page 34
34
[37] Garcia-Lodeiro, I., Palomo, A., Fernández-Jiménez, A., & Macphee, D. E. (2011). Compatibility studies 608
between NASH and CASH gels. Study in the ternary diagram Na2O–CaO–Al2O3–SiO2–H2O. Cement and 609
Concrete Research, 41(9), 923-931. 610


![EXPERIMENTAL STUDY OF FLY ASH- BASED GEOPOLYMER CONCRETE… · Alakaline Solution/Fly ash=0.35 Liquid/Fly Ash = 0.44 Compressive Strenght [MPa] Mixing Time Compressive Strenght [MPa]](https://static.documents.pub/doc/80x56/5fc8c63fff9292783f3b190d/experimental-study-of-fly-ash-based-geopolymer-concrete-alakaline-solutionfly.jpg)


