towards full-scale industrialisation and inclusive growth the dti Customer Contact Centre: 0861 843 384 the dti Website: www.thedti.gov.za FACTS AND FIGURES ON SKILLS IN MANUFACTURING Information Brief No. 4 December 2016
Transcript
Facts and Figures on Skills in Manufacturing │ 1
towards full-scale industrialisation and inclusive growththe dti Customer Contact Centre: 0861 843 384
Artisan training and development has been identified as a critical area to address the
challenges of economic growth and redress, and provide an avenue to address the growing
youth unemployment challenge in South Africa (NSDS III).
The focus of this information brief is to provide an overview of employment trends for
artisans and technicians in manufacturing in South Africa for 2002-2015. Employment trends
among the technical workforce are analysed by sub-sector and demographic indicators,
including highest education completed, population group, age group and gender. This brief
summarises longer, technical reports on artisans and technicians in manufacturing.1 The
data source is the September Labour Force Survey (LFS) 2002-2015 of Statistics South
Africa.
Manufacturing is a key determinant of future growth and competitiveness in the provision of
a skilled technical workforce. Manufacturing has been growing very slowly, although there
has been some green shoots, illustrated by the increased growth in the last quarter of 2015
(1,9% quarter-on-quarter). While the economy has still not turned the corner following the
global recession of 2009, to date it has managed to avoid a recession. The contribution of
manufacturing to this state of affairs is very important.
Technicians and artisans constitute the core of the technical workforce, ensuring innovation
1 Longer technical reports on artisans and technicians may be made available on request from [email protected]
6
and efficiency of the production process through the optimal use, design and maintenance
of materials, equipment, capital and personnel.
Intermediate-level artisans remain crucial to the future because multi-technical systems
need maintenance, servicing and repairs (Prof. Hoosen Rasool, 2016).
Highlights
• Artisans represent the largest proportion (76%) of the technical occupations, shrinking at 0,1% per annum.
• Engineers and technologists represent the smallest proportion (2%), shrinking at 3,8% per annum.
• Technicians represent 22%, shrinking at 0,8% per annum.
• Most artisans are in the basic metals sector. The food, beverages and tobacco sub-sector is the top employer of technicians. The textile, food, and wood and cork sub-sectors are the second, third and fourth top employers of artisans respectively.
• The share of white technicians declined from 47% to 29%, while black Africans now constitute 44% of all technicians.
• Women constitute just above one-third of employed technicians, but only 24% of artisans, declining from 35% in 2002.
• In 2015, only 16% of engineering students at universities of technology graduated.
• Most artisans are unqualified (57,7%), with nearly one-third having Grade 12.
• Most technicians (57%) are under-qualified, with either Grade 12 (41%) or less than Grade 12 (16%).
• Black engineers and technicians have the lowest share of registration with professional bodies.
Facts and Figures on Skills in Manufacturing │ 7
Employment of Artisans and Technicians in Manufacturing
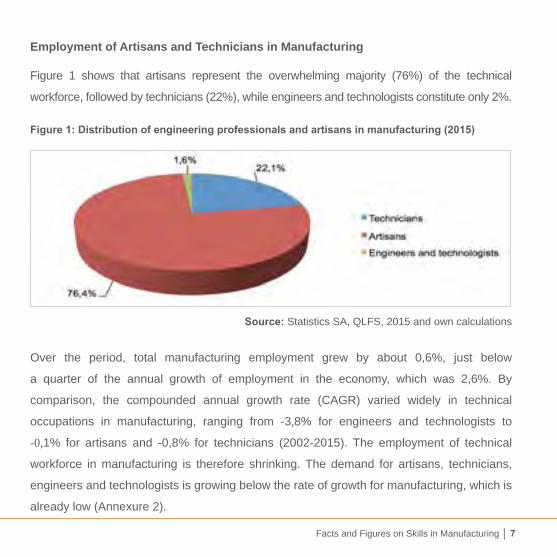
Figure 1 shows that artisans represent the overwhelming majority (76%) of the technical
workforce, followed by technicians (22%), while engineers and technologists constitute only 2%.
Figure 1: Distribution of engineering professionals and artisans in manufacturing (2015)
Source: Statistics SA, QLFS, 2015 and own calculations
Over the period, total manufacturing employment grew by about 0,6%, just below
a quarter of the annual growth of employment in the economy, which was 2,6%. By
comparison, the compounded annual growth rate (CAGR) varied widely in technical
occupations in manufacturing, ranging from -3,8% for engineers and technologists to
-0,1% for artisans and -0,8% for technicians (2002-2015). The employment of technical
workforce in manufacturing is therefore shrinking. The demand for artisans, technicians,
engineers and technologists is growing below the rate of growth for manufacturing, which is
already low (Annexure 2).
8
Demographic Profile of Artisans and Technicians
The artisan system continues to bear the historical scars of race and gender discrimination.
Employment of artisans and technicians continues to be male-dominated. In fact, the results
suggest there has been a significant reversal of gains in the employment of women artisans,
with Figure 2 showing a decline of 11,8%, from 35,4% to 23,6%. The results indicate that
there has been a secular decline of women artisans. The number of women technicians
increased slightly, from 34,0% in 2002 to 38,5% in 2015 (an increase of 4,5% in the share of
female technicians). It is clear that there are systemic constraints in the employment of women
artisans and technicians. The reasons for the continued marginalisation of women, despite
improvements in the enrolment and graduation of women engineers for instance, are not clear.
Further, changes to the nature of work, through the use of information and communications
technology (ICT), implies that artisan work is no longer that of so-called “grease monkeys”
or strictly manual2 (HSRC/merSETA, 2013). Legislation has been passed to push for greater
employment of women in the workplace, however, the majority of women in South Africa are
still not gaining in terms of job placements in the economy. According to the CEO of ATI, it
appears that South Africa is lagging when compared to its peers (Fin24, March 2016).
Specialists believe this has to do with wrong perceptions, typically people believe
engineering is about building bridges and making better engines for cars (Skillsportal,
April 2016).
2 Wildschut et al (2013), Studying artisans in the manufacturing, engineering and related services sector. Client report prepared for the merSETA/HSRC Artisan Identity and Status project: The unfolding South African story. HSRC: Pretoria.
Facts and Figures on Skills in Manufacturing │ 9
Figure 2: Employment of artisans and technicians by gender (%) 2002 and 2015
Source: Statistics SA, LFS, 2002 to 2015 and own calculations
Figure 3 shows that the decline of white artisans and technicians and the increase of African
artisans and technicians have continued apace. Du Toit and Roodt (2008) show that the
employment of black African technicians increased from 28,6% (1996-1999) to 41,4%
(2000-2005)3, a trend that continued.
Figure 3 shows that in 2002 about 46,9% of employed technicians were white, dropping to 31,8% in 2008 and 29,4% in 2015. Employment of coloured technicians increased from 12,0% in 2002 to 15,9% in 2015. Black African artisans outnumbered those from other racial categories, as depicted in Figure 3, with their employment increasing from 68,5% to 73,0% over the same period.
3 Renette du Toit and Joan Roodt (2008), Engineering Professionals: Crucial key to development and growth in South Africa, HSRC).
10
Facts and Figures on Skills in Manufacturing │ 11
The share of white artisans declined from 14,5% in 2002 to 12,7% in 2015. Over this
period there was a secular increase in the share of African artisans. In fact, the share of
African artisans (albeit male) is reflective of the share of Africans in the economically active
population. This picture contradicts the public perception that the average artisan is white
and male (usually more than 50 years of age). The results show that there has been a
substantive turnaround in the demographic profile of the employed artisan population, which
more closely mirrors the economically active population.
Figure 3: Artisans and technicians by population group (% share) (2002 and 2015)
Source: Statistics SA, LFS, 2002 to 2015 and own calculations
12
The age profile presented in Figure 4 suggests that there is a balanced mix of youth and
experienced artisans, with 37% in the age group 15 to 34 years, 32% between the ages of
35 and 44, and 31% who are 45 to 64 years of age. However, the decline in the number of
artisans from 168 000 to 127 000 (-2,1% per annum) in their prime productive years (25 to
34 years) is worrying. The number of employed artisans in the age groups 45 to 54 and 55
to 64 increased by 1,3% and 1,9% per annum respectively over the period.
Availability of experience may be suggested by the relatively high share of artisans older
than 35 years. Further, the relative growth in the number of artisans older than 45 years
bodes well for the sector, as more experienced artisans remain in the system. This may
positively affect the transfer of skills from older to younger artisans and the availability of
experienced mentors in manufacturing. The increase in the number of entry-level artisans
aged 15 to 24 suggests an increase in the skills pipeline. This may suggest that efforts
to increase the number of apprentices through the Human Resource Development (HRD)
Council and those of the Skills Education Training Authorities (SETAs) are translating into
improved employment of young artisans.
Facts and Figures on Skills in Manufacturing │ 13
Figure 4: Employment of artisans by age group (‘000) (2002 and 2015)
Source: Statistics SA, LFS, 2002 to 2015
There appears to be a more balanced mix of youth and experience among technicians
compared to artisans, with 40,1% in the age group 15 to 34 years, 29,9% 35 to 44, and 30,1%
45 to 64. However, the decline in the number of technicians in all age groups is worrying,
as shown in Figure 5. The decline in the number of entry-level technicians aged 15 to 24
suggests a slowdown of entry into the skills pipeline. The number of employed technicians
in the age group 55 to 64 decreased by -2,9% per annum over the period, as artisans of
pensionable age exit the system. Alternatively, they may also enter into business ventures,
as research shows that owners of manufacturing enterprises generally have a technical
qualification. Availability of experienced technicians older than 35 years may positively affect
the transfer of skills from older to younger technicians.
14
Figure 5: Employment of technicians by age group (‘000) (2002 and 2015)
Source: Statistics SA, LFS, 2002 to 2015
Employment of Artisans and Technicians by Sub-Sector
In 2002, most technicians were employed in the petroleum sector, albeit by a small margin
(Figure 6). By 2015, however, there was a significant decrease in employment in the
petroleum and basic metals sub-sectors, resulting in the food, beverages and tobacco sub-
sector shifting to the top. The basic metals sub-sector has previously been a critical player
and employer in the economy, but experienced a decline due to challenges faced in the
iron and domestic steel industry that arose primarily from global economic factors such as
the oversupply of steel. Local steelmakers are struggling to make ends meet in the current
environment of reduced domestic demand, mainly because of a significant increase in
Facts and Figures on Skills in Manufacturing │ 15
Chinese imports and poor international selling prices (Financial Mail, July 2015). There have
been a number of interventions, including the imposition of trade tariffs to protect producers
of steel as well as an agreement of a developmental price for steel. The latter may improve
the relative competitiveness of downstream steel producers. The Department of Trade and
Industry (the dti) approved a 10% hike in tariffs on 10 primary steel products in 2015, to
preserve South Africa’s steel-producing capacity against cheap Chinese imports (Financial
Mail, September 2016).
Employment trends over the period per sub-sector differed significantly. There was a 2,6%
increase of technician employment in food and beverages per annum, and a significant
decrease in the basic metals (-2,4%) sub-sector, a reflection of factors explored earlier on.
The clothing, textiles and leather sub-sector remains a significant employer of technicians,
although there was a slight decline over the period as indicated in Figure 6.
16
Figure 6: Number of technicians by sub-sectors (‘000) (2002, 2015)
Source: Statistics SA, QLFS (2002-2015)
By 2015, most artisans were employed in the basic metals sub-sector, followed by the food,
beverages and tobacco sub-sector, which experienced an increase of 19%, as shown in
Figure 7.
Artisan employment increased in the wood, petroleum, and food and beverages sectors.
This could be due to economic activity in the manufacturing industry, which reflected positive
growth of 6,2% in the third quarter of 2015 because of higher production in the following
divisions: petroleum, chemical products, rubber and plastic products; wood and wood
products, paper, publishing and printing; and food and beverages (Statistics SA, September
Facts and Figures on Skills in Manufacturing │ 17
2015, GDP). The ideal ratio for engineers, technologists and technicians has been debated
for decades. The Engineering Council of South Africa (ECSA) and Engineering Association
of South Africa (EASA) have proposed a ratio of one engineer to one technologist to
four technicians to 16 artisans for the South African context (ECSA & EASA, 1995). This
ratio might have been the cause for increased artisans and decreased technicians in the
petroleum sector in the period 2002 and 2015.
Figure 7: Trends in the number of artisans by sector ‘000 (2002, 2015)
Source: Statistics SA, QLFS (2002-2015)
18
Employment of Technicians and Artisans by Education
One of the key constraints to economic growth is the mismatch between the demand and
supply of skills. The extent to which workers are appropriately qualified in line with the
requirements of the job is a key indicator of the skills mismatch. Historically, most artisans
had less than Grade 12 (at least Grade 9) and a post-school qualification, NTC 1-3, attained
at a TVET college. However, given the oversupply of Grade 12s, recently trained artisans
have a minimum of Grade 12, plus a TVET engineering qualification.
Figure 8 shows that the majority of artisans are unqualified, with most (57,7%) having
less than Grade 12 (with no additional qualification), 30% having Grade 12 and only 4%
the required qualification with less than Grade 12. Interestingly, 7,1% had a post-matric
qualification. The latter may be the result of the more recent phenomenon of Grade 12
being the entry requirement. While those who are unqualified probably have significant
experience, it is clear that not enough effort is being made to provide a form of certification
through Recognition of Prior Learning (RPL).
In terms of technicians, there is greater dissonance between the baseline qualification
required (National Diploma from a University of Technology) and the actual qualifications
attained among employed technicians. This is worrying. As a result, only 35,7% of technicians
in the manufacturing sector had post-matric qualifications, implying that the majority was
under-qualified. About 7,4% had a post-school qualification with less than Grade 12. The
findings suggest that 56,9% of employed technicians have either a Grade 12 (40,7%) or less
Facts and Figures on Skills in Manufacturing │ 19
(16,2%). These results echo similar findings for the period 1996 to 2005 (Du Toit and Roodt,
2008). The authors argued that the lack of experiential training in the workplace, as required
by the National Diploma qualification, may be a contributory factor to the degree of under-
qualification. According to the CEO of the Artisan Training Institute (ATI), artisan training
has seen a sharp decline over the last 24 months as a result of contractions in the mining,
engineering and agricultural sectors due to companies experiencing cash flow and budget
constraints (Fin24, March 2016).
This apparent mismatch represents both a challenge and an opportunity in manufacturing.
Firstly, technicians may underperform because they do not possess the requisite technical
and theoretical knowledge. As assistants to professional engineers they perform an
essential function in ensuring the efficiency of the production process. On the other hand,
their practical knowledge may compensate (to some extent) for the lack of theoretical and
technical knowledge, and needs to be met with efforts for certification through RPL and
formal skills upgrading as well as increased work placements for diploma students.
20
Facts and Figures on Skills in Manufacturing │ 21
Figure 8: Highest education completed among artisans and technicians (%) (Q3:2015)
Source: Statistics SA, QLFS (2015)
Registration of Professional Engineering Technicians with ECSA4
The database of registered engineering professionals increased from 26 566 on 31 March
2014 to 27 342 on 31 March 2015, which represents an increase of 2,9% over the reporting
period. The continued growth trajectory in registration numbers can be a result of many
factors, including awareness campaigns on the benefits of registration presented to industry
and higher education institutions by ECSA (ECSA, 2015).
4 The Engineering Council of South Africa (ECSA) is a statutory body established in terms of the Engineering Profession Act, 2000 (Act No. 46 of 2000).
22
Figure 9 provides an analysis of registration annual growth trends for technician
professionals. Whites represented the overwhelming share of all professional engineering
technicians registered in 2009 and 2014, with 61,0% and 45,6% respectively, but growth
in registration was the slowest compared to black African engineering technicians. Black
African technicians constituted 44,6% of registration in 2014. Remarkably, the year-on-
year increase in new registration in various categories from 2010 to 2014 is indicative of
Government and industry becoming more committed to good quality service provision in the
country (ECSA, 2015).
The dip in registration in 2010, particularly for whites, may be ascribed to the large number
of cancellations due to non-payment of annual fees as well as the combined effects of the
end of World Cup-related engineering projects and the global recession.
Facts and Figures on Skills in Manufacturing │ 23
Figure 9: Trends in the registration of professional engineering technicians with ECSA (2009 to 2014)
Source: ECSA, 2015
Supply of Artisans and Technicians
The supply of artisans and technicians in this paper will be analysed using the following two
data sources:
• Artisans trade test results: The number of people enrolled and those who passed the
artisan trade test as released by Indlela, based on SETA data; and
• HEMIS data: This dataset has the number of engineering (including technicians)
enrolments and graduations from Universities of Technology. Engineering technicians
generally hold a National Diploma (NDip) from a University of Technology.
24
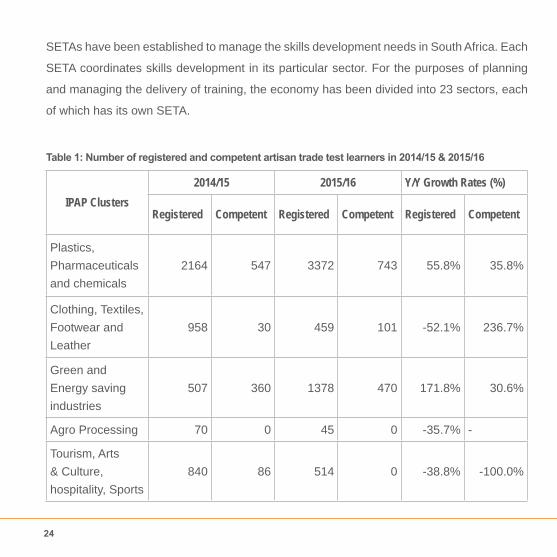
SETAs have been established to manage the skills development needs in South Africa. Each
SETA coordinates skills development in its particular sector. For the purposes of planning
and managing the delivery of training, the economy has been divided into 23 sectors, each
of which has its own SETA.
Table 1: Number of registered and competent artisan trade test learners in 2014/15 & 2015/16