30
FACULTY RETREAT MAY 22, 2012
| Date post: | 28-Dec-2015 |
| Category: |
Documents |
| Upload: | hilary-owen |
| View: | 214 times |
| Download: | 0 times |

FACULTY RETREATMAY 22, 2012
HISTORY
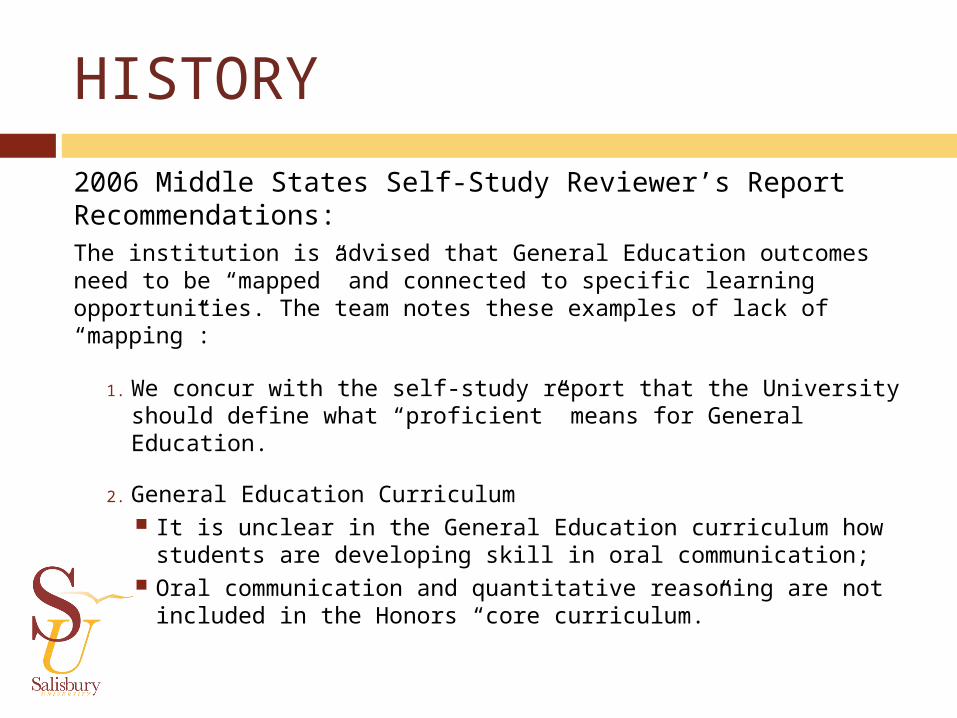
2006 Middle States Self-Study Reviewer’s Report Recommendations:The institution is advised that General Education outcomes need to be “mapped” and connected to specific learning opportunities. The team notes these examples of lack of “mapping”:
1. We concur with the self-study report that the University should define what “proficient” means for General Education.
2. General Education Curriculum It is unclear in the General Education curriculum how
students are developing skill in oral communication; Oral communication and quantitative reasoning are not
included in the Honors “core curriculum.”

RECOMMENDATIONS CONTINUED3. It does not appear that the Technology Fluency Policy adheres to
MSCHE guidelines for Information Literacy (SU Academic Program Reviews 2001-2006).
4. The 2000 SU General Education learning outcomes include outcomes related to the SU strategic emphasis on diversity and globalization. However, the SU Self-Study 2006 (p. 71) reports that only 18% of existing General Education courses purport to address this learning outcome. The majority of students graduate without experiencing courses with these learning emphases.
5. Substantial differences in General Education between transfer and “native” SU students need to be critically examined to ensure that the SU degree is comparable for all students (SU Self-Study 2006, p. 95).

HISTORY
2006-2009- Course-based assessment of critical thinking, writing, and information literacy
Fall 2007-UAAC made a permanent Faculty Senate committee
Summer2009 –Alignment of Student Learning Goals with the Gen. Ed. Curriculum & outcomes (Recs. 1, 2, & 4)
Winter 2010 - Faculty Development Day
Spring 2010 -Faculty Senate approval and recommendation to develop an ad hoc Gen. Ed. assessment sub-committee
HISTORY
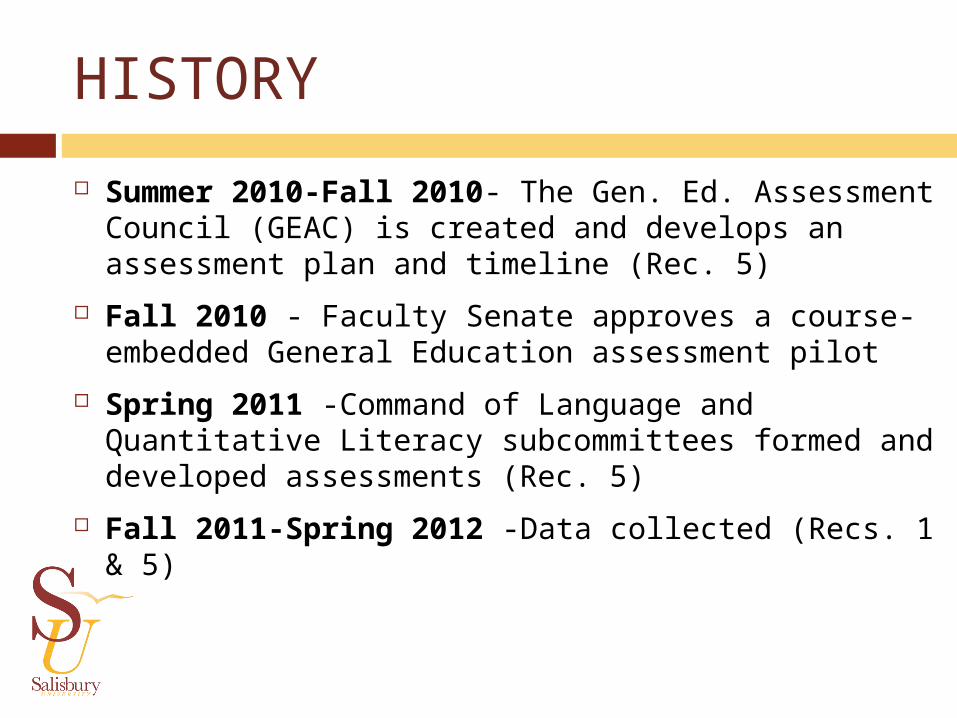
Summer 2010-Fall 2010- The Gen. Ed. Assessment Council (GEAC) is created and develops an assessment plan and timeline (Rec. 5)
Fall 2010 - Faculty Senate approves a course-embedded General Education assessment pilot
Spring 2011 -Command of Language and Quantitative Literacy subcommittees formed and developed assessments (Rec. 5)
Fall 2011-Spring 2012 -Data collected (Recs. 1 & 5)

PERIODIC REVIEW REPORT
Submitted June 2011
1. We concur with the self-study report that the University should define what “proficient” means for General Education.
2. General Education Curriculum It is unclear in the General Education curriculum how students are developing skill in oral
communication; Oral communication and quantitative reasoning are not included in the Honors “core
curriculum.”
3. It does not appear that the Technology Fluency Policy adheres to MSCHE guidelines for Information Literacy (SU Academic Program Reviews 2001-2006).
4. The 2000 SU General Education learning outcomes include outcomes related to the SU strategic emphasis on diversity and globalization. However, the SU Self-Study 2006 (p. 71) reports that only 18% of existing General Education courses purport to address this learning outcome. The majority of students graduate without experiencing courses with these learning emphases.
5. Substantial differences in General Education between transfer and “native” SU students need to be critically examined to ensure that the SU degree is comparable for all students (SU Self-Study 2006, p. 95).
MSCHE Reviewers:As a result of these efforts, the first four specific
components of the visiting team’s recommendation have been addressed. The reviewers commend the
University for addressing these aspects of the recommendation thoroughly and effectively.
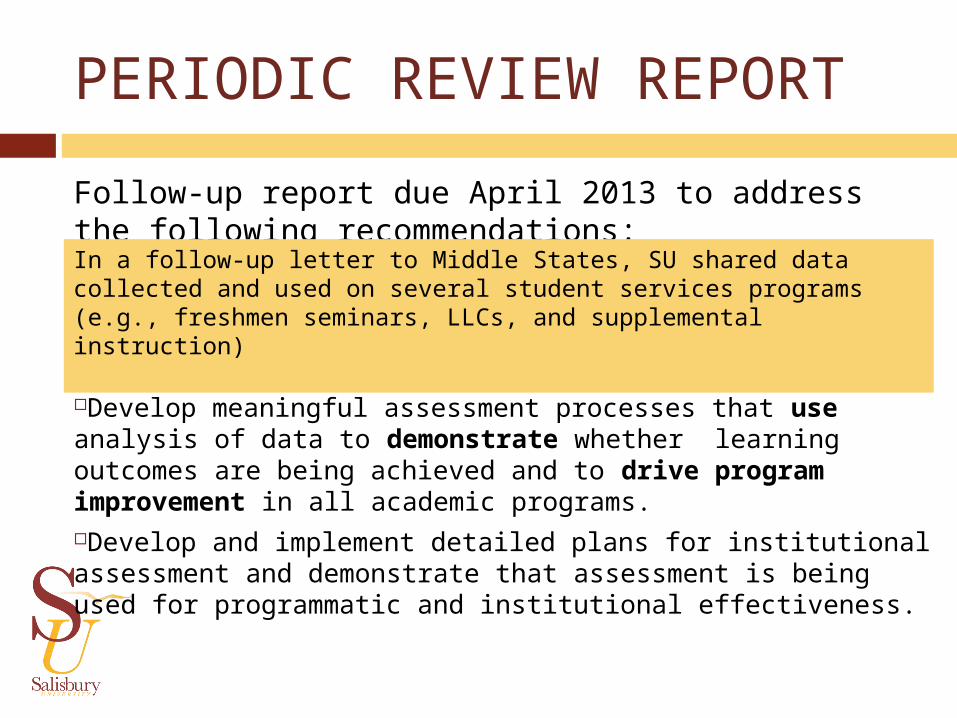
PERIODIC REVIEW REPORTFollow-up report due April 2013 to address the following recommendations: Develop programmatic assessment activities for student support service programs, perform meaningful assessment and analysis based on these activities, and use the results to guide program improvement.Develop meaningful assessment processes that use analysis of data to demonstrate whether learning outcomes are being achieved and to drive program improvement in all academic programs. Develop and implement detailed plans for institutional assessment and demonstrate that assessment is being used for programmatic and institutional effectiveness.
In a follow-up letter to Middle States, SU shared data collected and used on several student services programs (e.g., freshmen seminars, LLCs, and supplemental instruction)

TODAY
Discuss the assessment methodology
How do we define proficiency and what outcomes should be our priorities?
What strategies can we use to improve student engagement and learning?
What are meaningful ways that we can use these results to improve the Gen. Ed. program?

FALL 2011 GENERAL EDUCATION ASSESSMENT RESULTS

READING & WRITING ASSESSMENT
OUTCOMES GENERAL EDUCATION GROUPS
Reading Outcomes
Engage in active reading strategies to interpret and summarize content of written works
IA, IB, IIA, IIB, IIIA, IIIB, IVA, V
Solve a problem by analyzing the question being asked and identifying the relevant information.
IVA, IVB, IVC
Writing Outcomes
Synthesize and apply information and ideas in discipline-specific forms of writing
IA, IIA, IIB, IIIA, IVA, IVB, IVC
Use appropriate evidence, organizational patterns, and styles for specific writing tasks
IA, IIA, IIB
Construct thesis-driven arguments that marshal appropriate evidence and counter-arguments
IA, IB, IIA, IIB, IIIB,
Select, evaluate, and cite reputable and appropriate sources.
IA, IB, IIA, IIB, IIIA, IIIB,

Course General Education Group
Assignment Description
ENGL 103 IA Argumentative Researched Paper (5-7 references; 8-10 pages)
ENGL 253 (spring only) IB Researched Paper ( 5-8 pages)
HIST 102 (spring only) IIA or B HIST 201 IIB HIST 202 IIB CMAT 101 IIIA Journal Article Evaluation
(1 reference, 2-3 pages) CADR 200 IIIB Conflict Essay (3
references, 3-10 pages) PHYS 121 IVA or B Exam Question requiring
written explanation for selected response
PHEC 106 V Nutrition and activity analysis and reflection
READING & WRITING ASSESSMENT

SAMPLE
932 students submitted their writing assignments (43% of the UG enrolled students)
199 included in the sample
SU Native SU Transfer
Population
Sample Population
Sample
Minority 20% 17% 22% 12%
Female 60% 74% 49% 63%
N 4938 102 2677 97

SAMPLE All Enrolled at SU Enrolled in Selected GE Course Sampled for Assessment
N % of All
GPA N GPA % of All N GPA % of All
% of GE
Course
SU Native Students
Freshman 1681 34% 2.82 980 2.89 58% 26 2.99 2% 3%
Sophomore 1242 25% 2.94 361 3.02 29% 25 3.1 2% 7%
Junior* 1107 22% 3.04 143 3.1 13% 25 3.3 2% 17%
Senior 908 18% 3.12 81 3.11 9% 26 3.25 3% 32%
Transfer Students
Freshman 167 6% 2.39 85 2.48 51% 24 2.73 14% 28%
Sophomore* 725 27% 2.48 279 2.57 38% 24 2.85 3% 9%
Junior 937 35% 2.8 168 2.77 18% 26 2.78 3% 15%
Senior 848 32% 2.99 75 2.9 9% 23 3.11 3% 31%

RELIABILITY
Criteria
Inter-Rater Reliability
Reading Engage in active reading strategies to interpret and summarize content of written works (READING)
.13-.75
Solve a problem by analyzing the question being asked and identifying the relevant information (PROBLEM)
.56
Writing Construct thesis-driven arguments that marshal appropriate evidence (EVIDENCE)
.25-.42
Construct thesis-driven arguments that marshal appropriate evidence and counter-arguments (COUNTER-ARGUMENTS)
.31-.39
Synthesize and apply information and ideas in discipline-specific forms of writing (SYNTHESIZE)
.44-.58
Select, evaluate, and cite reputable and appropriate sources (SOURCES)
.27-.72
Use sources purposefully to support arguments (SUPPORT)
.32-.54
Demonstrate control of syntax and mechanics (SYNTAX)
.36-.45
Utilize appropriate conventions for discipline-specific forms of writing (CONVENTIONS)
.27-.47

70% MET OR EXCEEDED:
Synthesize and apply information and ideas in discipline-specific forms of writing (92%)
Engage in active reading strategies to interpret and summarize content of written works (89%)
Solve a problem by analyzing the question being asked and identifying the relevant information (86%)
Use appropriate organizational patterns (82%) and styles (84%) for specific writing tasks
Use appropriate evidence for specific writing tasks (73%)

RESULTS
More than 60% of SU students sampled met or exceeded expectations for the following outcome: Select, evaluate, and cite reputable and appropriate
sources (66%)
More than 50% of SU students sampled met or exceeded expectations for the following outcome: Construct thesis-driven arguments that marshal
appropriate evidence (58%)

RESULTS
Less than 15% of SU students sampled met or exceeded expectations for the following outcome: Construct thesis-driven arguments that
marshal appropriate counter-arguments (13%)

RESULTS
No statistically significant differences between SU native and transfer students
No significant differences in performance based on academic rank

SUMMARY & DISCUSSIONFuture Assessments: Did the data accurately measure students’ reading and
writing ability? How can results be used to improve the assessment
process, student learning, and/or teaching? What proficiency level should we expect for SU students?
Which outcomes should be a priority?

QUANTITATIVE LITERACY
Quantitative Literacy Outcomes OUTCOMES GENERAL EDUCATION GROUPS
3.1 Collect measurement data in a scientific manner.
IVA
3.2 Accurately analyze and interpret data. IVA, IVB, IVC, V
3.3 Use quantitative methods to solve problems.
IVA, IVB, IVC, V
3.4 Evaluate and draw inferences from mathematical models.
IVA, IVB, IVC

ASSIGNMENTS
Outcomes BIOL 101 Assignments(s)
GEOG 104 Assignments(s)
PHEC 106 Assignments(s)
Collect measurement data in a scientific manner.
Absorption of light measurement and graph values (Lab Quiz/Exam)
Calculating rock density/buoyancy measurements (Lab Quiz)
N/A
Accurately analyze and interpret data.
Absorption of light measurement and graph values (Lab Quiz/Exam)
Flood frequency analysis (Lab Quiz)
3-day diet and activity log comparing intake to RDA (Lab Assignment)
Use quantitative methods to solve problems.
Absorption of light measurement and graph values (Lab Quiz/Exam)
Calculating relative humidity and the dew point (Lab Quiz)
Calculating max heart rate (Lab Assignment)
Evaluate and draw inferences from mathematical models.
Evaluating angles of the sun (Lab Assignment)
N/A

SAMPLE
629 students (8% of UG enrolled students)
SU Native SU Transfer
Population
Sample Population
Sample
Minority 20% 20% 22% 21%
Female 60% 61% 49% 59%
N 4938 412 2677 217

GPA COMPARISON
All Enrolled at SU Participated in Assessment
N % of All
GPA N GPA % of Sample
% of All
SU Native Students
Freshman 1681 34% 2.82 171 2.89 42% 10% Sophomore 1242 25% 2.94 147 2.90 36% 12% Junior 1107 22% 3.04 66 3.00 16% 6% Senior 908 18% 3.12 28 3.03 7% 3%
Transfer Students
Freshman 167 6% 2.39 21 2.42 10% 13%
Sophomore 725 27% 2.48 101 2.55 47% 14%
Junior 937 35% 2.80 66 2.84 30% 7%
Senior 848 32% 2.99 29 3.00 13% 3%

RELIABILITY
Outcomes Reliability Revised Scale Reliability
Collect measurement data in a scientific manner .26-.68 .26-.68
Accurately analyze and interpret data -.11-.66 .66
Use quantitative methods to solve problems . 22-.45 .22-.45
Evaluate and draw inferences from mathematical models
-.17 -

VALIDITY
Outcomes Correlations Revised Scale Correlations
Collect measurement data in a scientific manner .16-.51 .16-.51
Accurately analyze and interpret data -.05-.49 .49
Use quantitative methods to solve problems .12-.30 .12-.30
Evaluate and draw inferences from mathematical models
.-.08 -

RESULTS
Outcomes N Average SD % Scoring at least 100%
% Scoring at least 50%
Collect measurement data in a scientific manner (2 courses)
185 .81 .31 69% 93%
Accurately analyze and interpret data (1 course)
211 .86 .30 81% 92%
Use quantitative methods to solve problems (3 courses)
575 .62 .38 44% 81%

SU NATIVE VS. TRANSFERS
SU Native Transfer
Outcomes N Average SD N Average SD
Collect measurement data in a scientific manner*
294 .84 .29 150 .75 .34
Accurately analyze and interpret data 142 .88 .27 66 .83 .33
Use quantitative methods to solve problems*
378 .67 .36 195 .53 .39
*Note. p < .05

SUMMARY
How well did the assessment method work? Did the data accurately measure students’
quantitative ability? How can results be used to improve the
assessment process, student learning, and/or teaching?
What proficiency level should we expect for SU students? Which outcomes should be a priority?

11:45-12:45
HOW CAN THE ASSESSMENT METHODOLOGY BE IMPROVED?

12:45-2:00HOW DO WE DEFINE PROFICIENCY AND IDENTIFY OUR PRIORITIES FOR THE OUTCOMES ASSESSED THIS ACADEMIC YEAR?
WHAT STRATEGIES CAN WE USE TO IMPROVE STUDENT LEARNING AND ACHIEVEMENT OF THIS OUTCOME? HOW CAN WE GET STUDENTS MORE ENGAGED IN THE CLASSROOM AND IMPROVE THEIR LEARNING AND DEVELOPMENT? FOR OUR PRIORITIZED OUTCOMES, WHAT ARE SOME MEANINGFUL WAYS WE CAN USE THE ASSESSMENT RESULTS TO IMPROVE SU’S GENERAL EDUCATION ASSESSMENT PROGRAM.


