54 TRANSPORTATION RESEARCH RECORD 1330 Failure of Cohesionless Model Slopes Reinforced with Flexible and Extensible Inclusions Dov LESHCHINSKY AND GREG LAMBERT The objectives of the reported work were (a) to identify the failure urfaces developing in geosynthetically reinforced steep slopes and (b) to compare rh e ob erved critical results with those pre- dicted by a limit equilibrium analysi . Failure ·urfaces were in- duced through all reinforcing trips (i.e., int ernal failure) by the backfill self-weight in 60-, 75-, a nd 90-degree s mall - cale slopes. The backfill material consi ted of an assembly of steel pin which exhibited a constant internal angle of friction of 37.4 degrees under stresses in the models. Its performance corresponded to plane strain conditions, and its uniform geometry enabled one to construct slopes repeatedly with ease and to nearly perfect spec- ifications. Tiie reinforcement mater ial used was aluminun• foil having a tensile modulus and elongation at failure that are ty r;i cal of values specified for geosynthetics in design. All slip surfares initiated at the lowest reinforcement layer and rapidly propagated upward. For 90-degree slopes, the slip surface appeared to be nearly planar, whereas for flatter slopes, it was curved. The test results were compared with prediction by a rigorous limit equi- librium analy is that u es a log spiral failure urface. The analysis indicates that this surface degenerate to a plane for 90-degree slopes. When the reinforcement's tensile force is assumed to be orthogonal to the radius vector defining it rather than to remain horizontal a installed, the predictions of the analysis correspond better to the test results in te r ms of both trace of slip surface and collapse height. Generally, it appears that the limit equilibrium analysis reasonably predicts the critical conditions for cohesion- less slopes reinforced with extensible inclusions. Geosynthetically reinforced steep slopes are increasingly being constructed because of their cost-effectivem:ss. In the design of reinforced slopes, the required tensile resistance and the layout of the geosynthetic sheets must be specified. This is typically done by using a limit equilibrium analysis that has been modified to deal with the reinforcement effects. How- ever, because there are rarely fully documented failures due to the internal collapse of a geosynthetically reinforced earth structure, the predictive potential of this analysis has not yet been extensively assessed. If the predictive capacity of a limit equilibrium analysis is to be properly evaluated, it should be compared with a case in which the state of global collapse is just about to occur (i.e., a slope in which all failure-resisting strengths are fully mobilized having a safety factor of 1). Specifically, the predicted location of the slip surface and the reinforcement's required tensile resistance should be com- pared at the verge of failure. D. Leshchinsky, Department of Civil Engineering, University of Del- aware , 130 Du Pont Hall , Newark, Del. 19716. G. Lambert, U. S. Army Corps of Engineers , Custom House , Second and Chestnut Streets, Philadelphia , Pa. 19106 . This paper attempts to provide much-needed experimental for reinforced steep slopes founded on a firm foundation at the onset of failure. It also compares the predictions of a typical, but rigorous, limit equilibrium analysis with these experimental results, considering two extreme values for the inclination of tensile resistance. For reasons detailed in the paper, however, aluminum foil, rather than geosynthetics, is used. This reinforcement behaves as an extensible material, thus exhibiting structural response comparable with that of geosynthetically reinforced slopes without the overcompli- cations of factors such as creep that may introduce an element of speculation when the results are interpreted for comparison with limit equilibrium analysis predictions. TEST PROCEDURE Testing Facilities Model Frame The frame supporting the model was assembled of steel chan- nel 125 mm wide (Figure 1). The base and height of the frame measured 1 m each. An additional steel channel 125 mm wide supported the slope facing during construction. This support was hinged at the top of the frame and could rotate outward by the use of a screw jack. The entire frame was placed in a special steel fixture so that the facing and its support could be inclined at any angle. When the frame was rotated in the fixture, a section of steel channel was positioned at the base to ensnre a horizontal foundation (i.e., base) in the model, as would be expected in the case of an embankment over a firm foundation. Steel pins were used as the backfill material, so no side panels were necessary for support . Subsequently, end effects typical to soil backfill were avoided. Facing The slope facing was made of smooth Plexiglas panels, as shown in the inset in Figure 1. Two triangular wedges were glued to the outer side of each panel. These wedges rested against the steel channel support during construction (see Figure 1), producing a terraced slope with a desired average inclination. When a 90-degree slope was constructed, no wedge supports were used. The need to use a "stepped" slope face
Transcript
54 TRANSPORTATION RESEARCH RECORD 1330
Failure of Cohesionless Model Slopes Reinforced with Flexible and Extensible Inclusions
Dov LESHCHINSKY AND GREG LAMBERT
The objectives of the reported work were (a) to identify the failure urfaces developing in geosynthetically reinforced steep slopes
and (b) to compare rhe ob erved critical results with those predicted by a limit equilibrium analysi . Failure ·urfaces were induced through all reinforcing trips (i.e., internal failure) by the backfill self-weight in 60-, 75-, and 90-degree small- cale slopes. The backfill material consi ted of an assembly of steel pin which exhibited a constant internal angle of friction of 37.4 degrees under stresses in the models. Its performance corresponded to plane strain conditions, and its uniform geometry enabled one to construct slopes repeatedly with ease and to nearly perfect specifications. Tiie reinforcement material used was aluminun• foil having a tensile modulus and elongation at failure that are tyr;ical of values specified for geosynthetics in design . All slip surfares initiated at the lowest reinforcement layer and rapidly propagated upward. For 90-degree slopes, the slip surface appeared to be nearly planar, whereas for flatter slopes , it was curved. The test results were compared with prediction by a rigorous limit equilibrium analy is that u es a log spiral failure urface. The analysis indicates that this surface degenerate to a plane for 90-degree slopes. When the reinforcement's tensile force is assumed to be orthogonal to the radius vector defining it rather than to remain horizontal a installed, the predictions of the analysis correspond better to the test results in terms of both trace of slip surface and collapse height. Generally, it appears that the limit equilibrium analysis reasonably predicts the critical conditions for cohesionless slopes reinforced with extensible inclusions.
Geosynthetically reinforced steep slopes are increasingly being constructed because of their cost-effectivem:ss. In the design of reinforced slopes, the required tensile resistance and the layout of the geosynthetic sheets must be specified. This is typically done by using a limit equilibrium analysis that has been modified to deal with the reinforcement effects. However, because there are rarely fully documented failures due to the internal collapse of a geosynthetically reinforced earth structure, the predictive potential of this analysis has not yet been extensively assessed. If the predictive capacity of a limit equilibrium analysis is to be properly evaluated, it should be compared with a case in which the state of global collapse is just about to occur (i.e., a slope in which all failure-resisting strengths are fully mobilized having a safety factor of 1). Specifically, the predicted location of the slip surface and the reinforcement's required tensile resistance should be compared at the verge of failure.
D. Leshchinsky, Department of Civil Engineering, University of Delaware , 130 Du Pont Hall, Newark, Del. 19716. G. Lambert, U. S. Army Corps of Engineers, Custom House , Second and Chestnut Streets, Philadelphia , Pa. 19106.
This paper attempts to provide much-needed experimental dat~ for reinforced steep slopes founded on a firm foundation at the onset of failure. It also compares the predictions of a typical, but rigorous, limit equilibrium analysis with these experimental results, considering two extreme values for the inclination of tensile resistance. For reasons detailed in the paper, however, aluminum foil, rather than geosynthetics, is used. This reinforcement behaves as an extensible material, thus exhibiting structural response comparable with that of geosynthetically reinforced slopes without the overcomplications of factors such as creep that may introduce an element of speculation when the results are interpreted for comparison with limit equilibrium analysis predictions.
TEST PROCEDURE
Testing Facilities
Model Frame
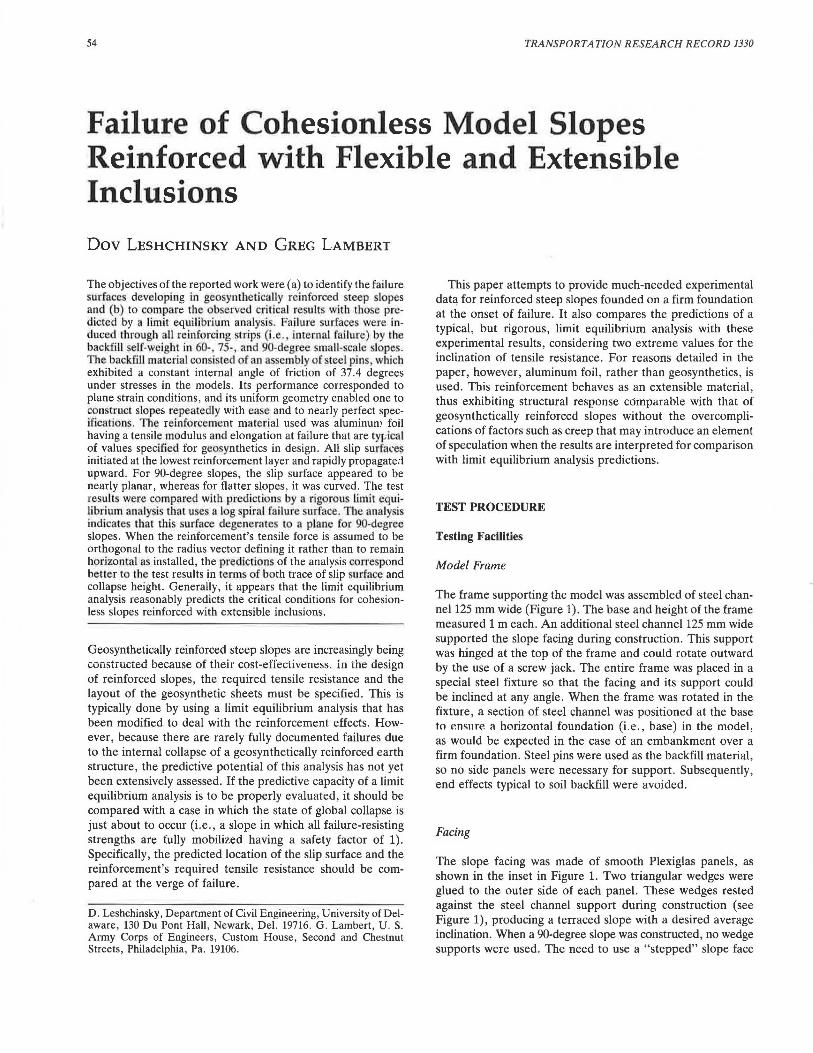
The frame supporting the model was assembled of steel channel 125 mm wide (Figure 1). The base and height of the frame measured 1 m each. An additional steel channel 125 mm wide supported the slope facing during construction. This support was hinged at the top of the frame and could rotate outward by the use of a screw jack. The entire frame was placed in a special steel fixture so that the facing and its support could be inclined at any angle. When the frame was rotated in the fixture, a section of steel channel was positioned at the base to ensnre a horizontal foundation (i.e., base) in the model, as would be expected in the case of an embankment over a firm foundation. Steel pins were used as the backfill material, so no side panels were necessary for support . Subsequently, end effects typical to soil backfill were avoided.
Facing
The slope facing was made of smooth Plexiglas panels, as shown in the inset in Figure 1. Two triangular wedges were glued to the outer side of each panel. These wedges rested against the steel channel support during construction (see Figure 1), producing a terraced slope with a desired average inclination. When a 90-degree slope was constructed, no wedge supports were used. The need to use a "stepped" slope face
Leshchinsky and Lambert
SUPPORT OF I FACING DURING CONSTRUCT! '"''----'
FIGURE 1 Model setup.
rather than a smooth one was recognized when the backfill material could not be placed in a uniform density immediately behind the facings when nonvertical slopes were constructed.
Materials
Flexible Inclusions
Ideally, geosynthetics would have been used directly in the experiments. However, reduction of data to verify analysis corresponding to a limit state requires the consideration of such complicated factors as creep and effects of overburden pressure on geosynthetics response. Furthermore, inducing failure in small-scale models requires the use of geosynthetics that have unrealistically low strength and stiffness factors that may complicate the interpretation of results. To avoid such uncertainties, an aluminum foil was used as a reasonable substitute for geosynthetics. Manufactured by Reynolds Metal Company, it was made of Alloy 8111 and had a thickness of 23.9 ± 5 percent µm, an ultimate tensile strength per unit width of 2.06 ± 8 percent kN/m, and an elongation at failure of 5.5 to 6.25 percent. This elongation classifies the foil as extensible reinforcement (1), having the same order as a typ-
55
I E
9
ical permissible value in design when geosynthetics are used (i.e., to develop such strain in the reinforcement that the soil will most likely reach failure with a complete slip surface extending between crest and toe). In fact, using Young's modulus of aluminum (70 x 106 to 75 x 106 kPa), the thickness of the foil, and the widths of strips relative to the net breadth of the tested slopes (102 mm), one can calculate the equivalent tensile modulus of the foil in the elastic range (i.e., similar to the wide-width modulus defined in ASTM D 4595: the tensile force at a given strain divided by the specimen's width) to be about 200 to 800 kN/m, depending on the width of the strip in each test (see results with Figures 2-10 and Table 1 for widths used). This range of tensile modulus pertains to an equivalent material, such as geosynthetic sheets, that has continuous width rather than to strips narrower than the backfill breadth of 102 mm. This range falls well within typical values for geosynthetics used for reinforcement. Hence, in terms of stiffness, the aluminum foil in its elastic range can generally be considered as a reasonable model for geosynthetics.
A sharp knife was used to cut the aluminum foil strips, and metal templates were used to ensure a consistent and precise width and therefore attain an exact prescribed tensile strength. Special care was taken to avoid any small tears and creases
y (cm)
60
40
20
0-t----J
•
•
-20+-----.-----~---~---~
-20 0 20 .co 60
x [cm)
FIGURE 2 Data points defining slip surface for 90-degree slope: failure height = 49. 7 cm; five reinforcement strips.
80
. 60 .
40 y
(cm)
20
o-+----~
-20+----~----.-----..-----1
-20 0 20 40
x (cm)
FIGURE 3 Data points defining slip surface for 90-degree slope: failure height = 74.0 cm; seven reinforcement strips.
80
60
y 40 (cm)
20 -
0-+-----'
-20+----~---~---~----I
-20 0 20 60
x (cm)
FIGURE 4 Data points defining slip surface for 90-degree slope: failure height = 86.S cm; eight reinforcement strips.
80....-----------------.
60
y 40
(cm)
20
o----
•
-20-+----....-----.-----...----.. -20 0 20 .co 60
11 (cm)
FIGURE S Data points defining slip surface for 75-degree slope: failure height = 50.0 cm; five reinforcement strips.
Leshchinsky and Lambert
60
• y 40
(cm) •
20
0-+----...
-20-t----...... --------....... ---... -20 0 20
•(cm)
40 60
FIGURE 6 Data points defining slip surface for 75-degree slope: failure height = 57.7 cm; six reinforcement strips.
80-r----------------......
60
y 40
(cm)
20
o·----.J
•
•
•
•
-20~.--~--.----..--~~.-------1
-20 0 20
•(cm]
40 60
FIGURE 7 Data points defining slip surface for 75-degree slope: failure height = 75.5 cm; seven reinforcement strips.
that might locally decrease the strength and cause premature and unexplained (i.e., inconsistent) failure.
Backfill
Steel pins 3.18 mm in diameter and 102 mm long were used as backfill in all experiments. The assembly of steel pins is
60
40 • y
(cm]
• 20
0 -1-----'
-20-1-----.-----,-----,-----l -20 0 20
•[cm]
40 60
FIGURE 8 Data points defining slip surface for 60-degree slope: failure height = 47 .0 cm; four reinforcement strips.
FIGURE 9 Data points defining slip surface for 60-degree slope: failure height = 61.0 cm; five reinforcement strips.
57
known as the Schneebeli model (2) . The shear behavior of this assembly resembles that of a dense cohesionless soil under plane strain conditions. The peak angle of internal friction, as determined from direct shear tests under normal stresses up to 40 kPa, was <!> = 37.4 degrees. It should be noted that the direct shear data points defined a nearly perfect straightline envelope passing through the origin. This is unlike cohesionless soils, which typically exhibit much higher <!> under
58
60 •
•
40 y •
[cm)
20
0-+-----
-20-+--- --.----....-----.-----i -JO 0 20 40 60
x [cm)
FIGURE 10 Data points defining slip surface for 60-degree slope: failure height = 59.8 cm; six reinforcement strips.
low normal stress. Consequently, interpretation of results obtained from tests on small-scale models using steel pins in the context of limit equilibrium (i.e., at failure where <I> is a prime input) is simple compared with cohesionless small-scale soil models, if one is to extrapolate results to realistic structures.
A preliminary verification of the suitability of the steel-pin assembly to model soil in studying failure mechanisms was conducted. Two unreinforced walls were constructed to failure, using the frame shown in Figure 1, to determine whether the resulting failure surfaces corresponded to those predicted by Rankine's theory (i.e., 45 degrees + cp/2). To comply closely with Rankine's assumptions, the vertical wall facing was greased and then covered by a layer of latex membrane to minimize interface friction. Once the backfill was placed to a desired height, the hinged support constituting the wall facing was rotated outward using the screw jack shown in Figure 1 until a clearly visible slip surface developed. The coordinates of points on the trace of the slip surface were measured relative to a fixed axis system defined by the testing frame shown in Figure 1. Figure 11 presents the results, showing a nearly perfect agreement with Rankine's surface. Because the validity of Rankine's surface for unreinforced walls
TRANSPORTATION RESEARCH RECORD 1330
• H1 •58,8 cm
O H1 •63.5 cm
-0.2+--r--r--~-~-r-----l
-0.2 0 0 ,2 0.4 0.6 0.8 LO •/Ht
FIGURE 11 Failure surface developed in unreinforced wall.
is well established, it was believed that although the steel-pin assembly represents an idealized material, it can be used as an adequate substitute for cohesionless soils in the investigation of slip surfaces, especially in conjunction with a simple limit state analysis.
Attaining a uniform and consistent bulk density throughout each model required minimal effort because of the uniformity of the pins. The bulk density of the steel-pin assembly was 'Y = 63 kN/m 3 in all tests. This 'Y is three or four times the density of a typical backfill soil. Thus, a slope constructed to a height of 1 musing the steel pins would effectively simulate pressures existing in a 3- to 4-m prototype soil slope.
It should be pointed out that limit equilibrium analyses used in designing reinforced slopes are two-dimensional. Subsequently, experimental verification of these analyses requires essentially plane strain conditions in the tested models if one is to draw safe conclusions about the analyses. Using this steelpin assembly ensures the existence of plane strain conditions because no sidewalls were necessary to support this backfill. Such ideal conditions are difficult to attain when soil is used in small-scale and narrow models because of the end effects of the model box sidewalls containing the soil.
Construction of Model
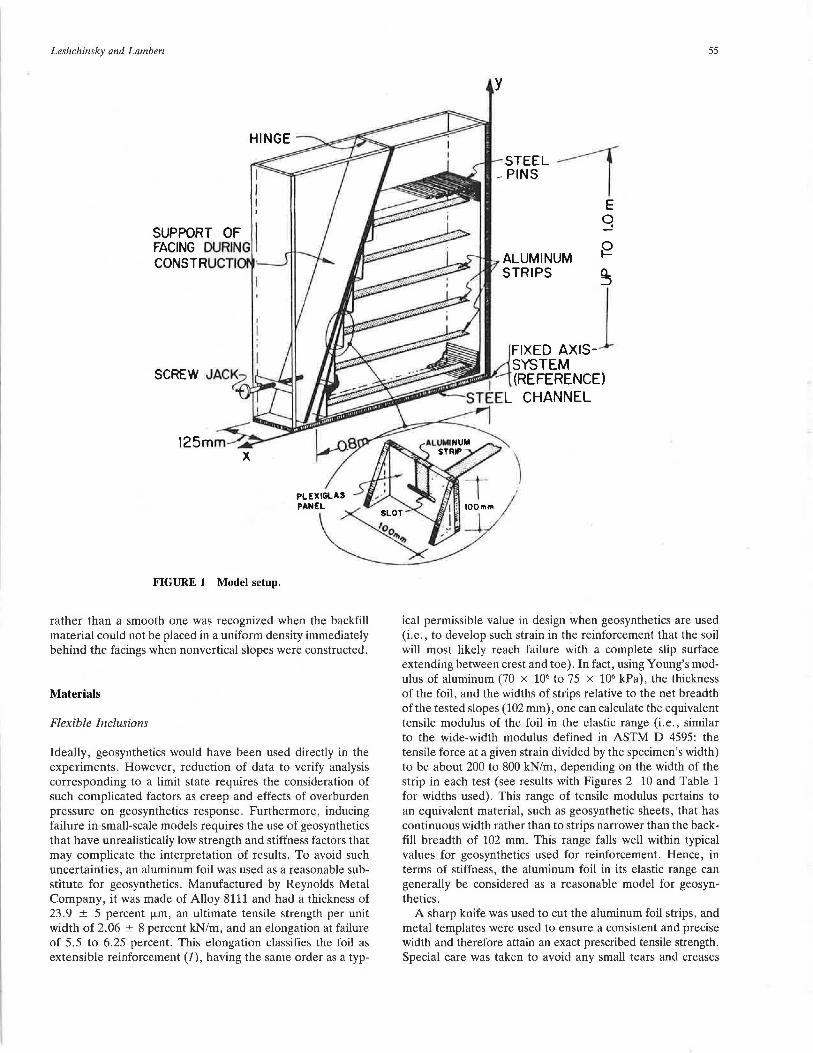
The first facing panel was wedged against the support shown in Figure l. Steel pins were then placed in thin layers up to the elevation of the first aluminum strip. The strip was placed down on the pins' leveled surface to the end of the frame structure. Additional steel pins were placed gently on the aluminum strip up to the same level as the top of the panel (i.e., step). To release the facing support without jerking the system, the screw jack was turned, thus allowing the reinforced layer to carry the load and deformations to develop fully. Next, the facing support was adjusted so that it just touched the top of the panel, and construction of the second layer proceeded similarly to the first step. The same procedure was repeated for each additional layer, as Figure 12 shows for the third and fourth layers.
After attaining the height at which the factor of safety was presumably slightly larger than 1, the facing support (now supporting only the top panel) was moved slightly outward
Leshchinsky and Lambert
FIGURE 12 Construction sequence: top, completion of third layer; middle, release of facing support; bottom, construction of fourth layer.
to allow the structure to be completely self-supporting. More steel pins were then laid carefully and evenly in thin layers on top until failure. Failure occurred with the breakage of the lower aluminum strips after some visibly significant deformations developed at the lower zone. The clearly defined trace of failure surface and the final height of the backfill were recorded. Because the facing support was only a few millimeters from the slope face at the instant of failure, the collapsed structure leaned against this support. Subsequently, it prevented any significant postfailure propagation of slip surface. This postfailure stabilization "froze" the slip surface that had developed at the onset of failure. Thus, the failure of interest in design and in the framework of limit equilibrium could be traced. It should be pointed out that if failure had been allowed to propagate, the trivial case of a slope at its angle of repose would have been attained.
RESULTS
Three tests were performed for each slope inclined at 60, 75, and 90 degrees to establish a consistent characteristic behavior representing a variety of numbers of reinforcing strips and therefore a variety of tensile strengths. Because of intentional excessive embedment length of reinforcement, failure was always due to reinforcement breakage rather than to pullout. In all tests the lowest aluminum strip broke first, instigating
59
a sudden collapse of the structure. The failure surface initiated at the location of breakage of the lowest strip and immediately propagated upward to form a surface extending between the crest and the toe.
It should be pointed out that the tensile force distribution along each reinforcing strip was not measured, although such information would have been useful. This measurement was not done because it was believed that (a) loads mobilized in the strips before failure are too small, especially in upper layers, to be measured accurately using inexpensiv;e techniques; (b) common and inexpensive load-measuring devices (typically a calibrated strain gage) may locally alter the strip properties, including stiffness and strength, potentially affecting the model performance; and (c) wiring required to monitor the sensors may introduce additional reinforcement, also affecting the small-scale structure performance.
To facilitate the presentation of results, the following notation is introduced:
w = width of each aluminum strip (mm); t = [(ultimate tensile strength of aluminum foil = 2.06
kN/m) x w/(breadth of tested slope = 102 mm)] = tensile strength per unit width of an equivalent reinforcing sheet that is continuously wide (as typically specified for geosynthetics; e.g., ASTM D 4595), equivalent to the strength of the aluminum strip used in the test, which had a width of w;
y 1 = elevation of lowest strip, measured relative to the toe; d = spacing between two adjacent strips; n = number of equally spaced strips; and
H1 = measured failure height of slope.
Figures 2-10 represent the results obtained for the 90-, 75-, and 60-degree slopes. In all figures, the strip elevations, the slope facing, and the crest elevation at the actual failure height are illustrated. In all figures, d is 10.0 cm; the rest of the information pertinent to the reinforcement is given in Table 1. Points defining the trace of the slip surface, recorded immediately after collapse, are superimposed on the figures.
It should be pointed out that attempts to conduct tests on 45-degree slopes ( <!> = 37.4 degrees) were unsuccessful mainly because the required w (or, alternatively, t), considering the maximum feasible height of slope possible to attain with the testing frame (i.e., less than 1 m for 45-degree inclination), was too narrow to be cut accurately and provide reliable results.
COMPARISON OF ANALYSIS WITH TEST RESULTS
An objective of this work was to compare the results of the experimental work with the predictions of a rigorous limit equilibrium analysis. It was convenient and instructive to use the analysis of Leshchinsky and Boedeker (3). Considering the measured (i.e., the nonspeculative) data, the comparison is limited to the location of slip surface and the height of the slope at failure.
Leshchinsky and Boedeker used a log spiral failure mechanism to obtain the minimum factor of safety for the reinforced structure while satisfying all three global limiting equi-
60
librium equations. In their analysis (termed "internal stability"), it was implicitly assumed that the critical slip surface is passing through all sheets on the basis of the tieback analogy. Furthermore, it was explicitly assumed that at the verge of failure the distribution of tensile resistance mobilized is linear with depth, proportional to the overburden pressure, with a maximum value at the toe elevation and, if no surcharge is applied, zero at the crest. Although their formulation was presented in a framework of pullout mode of failure, the final layout of the reinforcement, considering external stability and practical constraints that lead to specification of sheets of equal length, is such that breakage of lower layers due to excessive embedment occurs at failure, as was imposed on the models tested here. Leshchinsky and Boedeker considered two possible extreme inclinations of the reinforcement's tensile resistance force at the slip surface: horizontal (i.e., as installed) and orthogonal to the radius vector of the log spiral (i.e., the most efficient contribution). Figures 13-16 show typical distributions of tensile resistance for the critical cases of horizontal and orthogonal reinforcement force inclinations. Leshchinsky and Perry (4) provide a physical explanation of how the reinforcement can reorient itself in the orthogonal direction, as well as show explicitly the simple governing equations obtained for vertical slopes in which case the log spiral degenerates to a plane. Leshchinsky and his colleagues have concluded that for cohesionless soils, the required tensile resistance for the horizontal case is slightly larger than for the orthogonal one (typically less than 10 percent difference). However, the required embedment length for the orthogonal case is longer; somewhat deeper slip surfaces are predicted. Subsequently, the information provided by the experimental work reported here should be useful for studying the extent of slip surfaces as well as critical heights of steep slopes. Note that critical slope height is directly related to the available tensile strength
of the reinforcement when the factor of safety is unity. To provide an accurate comparison of results, Lambert (5) modified the original formulation to deal with a stepped slope face, simulating the models tested.
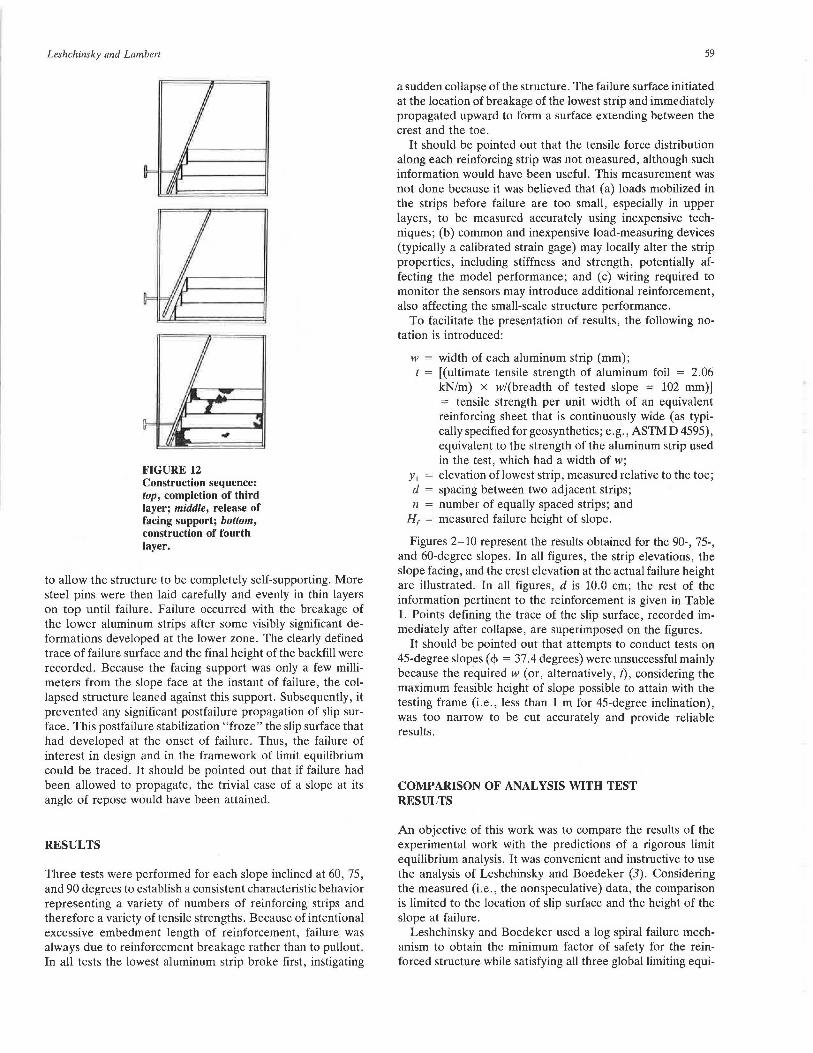
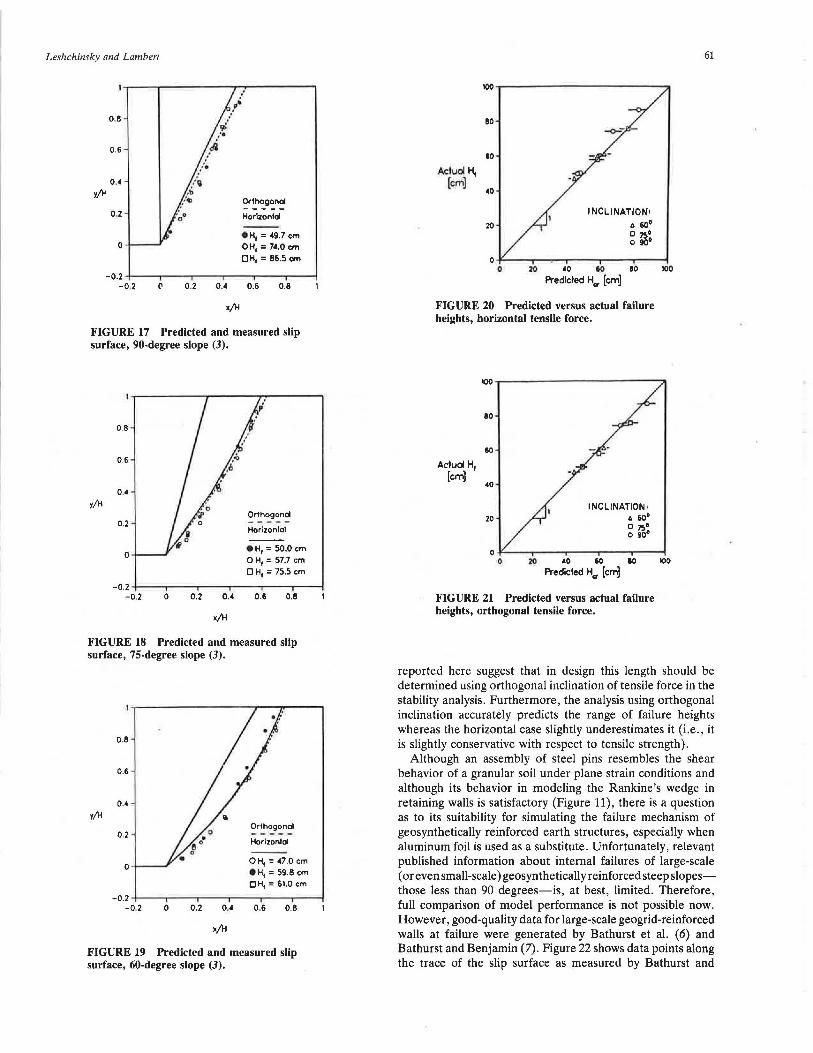
Figure 17 shows the trace of the predicted slip surface for the 90-degree slope and for the assumed horizontal and orthogonal inclinations of the reinforcement tensile resistance. Superimposed on this figure are the experimental data points shown also in Figures 2-4. To condense the results presentation, the axes are normalized, that is, x/H and y/H are intioduced. In each respective test, the measured H1 was used instead of Hin the normalization. In the analytically predicted surface, Her was used instead of H where Her represents the predicted collapse height. Similarly to Figure 17, Figures 18 and 19 represent the predicted versus the measured surfaces for the 75- and 60-degree slopes, respectively.
Figure 20 shows the actual failure heights versus the predicted ones for the horizontal case; Figure 21 shows them for the orthogonal case. Note in these figures that if a data point lies on a 45-degree line passing through the origin, the prediction is perfect. However, if this point lies above the line, the predicted failure height is lower than actual (i.e., conservative prediction). Conversely, if it is below, the predicted failure height is higher than actual. Also note that the predicted height is signified by a range of values accounting for potential manufacturing variability in tensile strength of the aluminum foil (i.e., ± 8 percent). Table 2 summarizes the results of the actual and predicted failure heights for all models tested and provides pertinent information about each test.
From this comparison, it appears that the predicted slip surfaces for the orthogonal case are closer to the observed ones, especially when steeper slopes are considered. Because in practice the reinforcement embedment length is determined by the location of potential slip surfaces, the results
Leshchinsky and Lam/>ert
0.8
0.6
0.4
yj\-4
0.2
0
Orthogonal
Horizontal
•H, = 49.7 cm 0 H1 = 74.0 cm 0 H1 = 86.5 cm
-0.2 -----------------< -0.2 0.2 0.4 0.6 0.8
FIGURE 17 Predicted and measured slip surface, 90-degree slope (3).
FIGURE 20 Predicted versus actual failure heights, horizontal tensile force.
Actual H1 [cm)
eo
60
40
20
I NC LI NATION' 6 &0° 0 750 0 90°
0-f'----.---...---.---.-----1 0 20 40 60 10
Predicted H.,. (cm]
FIGURE 21 Predicted versus actual failure heights, orthogonal tensile force.
IOO
61
reported here suggest that in design this length should be determined using orthogonal inclination of tensile force in the stability analysis. Furthermore, the analysis using orthogonal inclination accurately predicts the range of failure heights whereas the horizontal case slightly underestimates it (i.e., it is slightly conservative with respect to tensile strength).
Although an assembly of steel pins resembles the shear behavior of a granular soil under plane strain conditions and although its behavior in modeling the Rankine's wedge in retaining walls is satisfactory (Figure 11), there is a question as to its suitability for simulating the failure mechanism of geosynthetically reinforced earth structures, especially when aluminum foil is used as a substitute. Unfortunately, relevant published information about internal failures of large-scale (or even small-scale) geosynthetically reinforced steep slopesthose less than 90 degrees-is, at best, limited. Therefore, full comparison of model performance is not possible now. However, good-quality data for large-scale geogrid-reinforced walls at failure were generated by Bathurst et al. (6) and Bathurst and Benjamin (7). Figure 22 shows data points along the trace of the slip surface as measured by Bathurst and
62 TkANSPORTATION RESEARCH RECORD 1330
TABLE 2 SUMMARY OF ACTUAL AND PREDICTED FAILURE HEIGHTS
Reinforcement 1'1 Sheet Total Spacing Failure Predicted Failure Height H"
(•)First number in parentheses corresponds to (t - 8%).
Second number in parentheses corresponds to ( t + 8% ).
Benjamin (7). When comparing these points with the results obtained in this work (Figure 17), one sees a similar trend: the actual slip surface is better described by the orthogonal case. Because <l> in Figure 17 (37.4 degrees) and Figure 22 (53 degrees) was different, a direct comparison of measured data points, in a normalized style similar to Figure 17, is not possible. However, this consistency in trend of failure surface exhibited when referenced to the same analysis is encouraging and, it is hoped, increases the confidence in this work's observations as applied to geosynthetically reinforced steep slopes.
It should be pointed out that although Bathurst and Benjamin report the strain distribution developing in the geogrid sheets at the verge of failure, the authors do not have sufficient information to convert these data to the corresponding tensile force distribution (e.g., reported strains include a significant component of creep and the strains intensity signifies highly
2.5
2
l.5 Y (m)
0.5
q•SO kPa ,-----,.~--.-~~--,..~~~..-+~
Orthogonol
Horizontal (Rankine)
• c=O, <j>=53°
o-i,,.,,...,,,_.,.i-~~~~---.~~-,-~~-1
-0.5 0.5 15
~ (m)
FIGURE 22 Predicted versus actual full-scale test results, slip surfaces (3 ,7).
nonlinear behavior for which their reported secant modulus is not applicable). Subsequently, full comparison is not possible. However, a comparison of similar nature has been conducted by Leshchinsky and Perry ( 4) with Bathurst et al. ( 6) showing closer agreement between the orthogonal case and experimental results with regard to tensile force distribution (or, alternatively, collapse height).
CONCLUSIONS
The results of an experimental study on the failure surfaces developing in reinforced cohesionless slopes are presented. An assembly of steel pins was used as a two-dimensional model for granular soil. The internal angle of friction of this ass.'!mbly is nearly constant and independent of confining pressures, thus simplifying interpretation of results and making it suitable for small-scale models, especially if the performance is to be compared with the predictions of a limit equilibrium analysis in which this angle is a prime input . Aluminum foil was used as reinforcement. This foil is extensible and can be considered as a reasonable substitute for geosynthetics in the small-scale models. For 90-degree slopes, the slip surface exhibits a similar trend to the one obtained from a full-scale test on a wall reinforced with a geogrid. This is a positive indication about the relevance of the tested models. The observed slip surfaces were curved for nonvertical slopes and nearly planar for the 90-degree slope.
The test results were compared with predictions by a typical limit equilibrium analysis. It was observed that when the reinforcement tensile force is assumed to be orthogonal to the radius defining it, rather than being assumed to remain horizontal as installed, the analysis's predictions correspond better to the test results in terms of both trace of slip surface and collapse height (or required tensile strength of reinforcement). Generally, it appears that limit equilibrium analysis predicts fairly well the critical conditions for cohesionless slopes reinforced with extensible inclusions.
Leshchinsky and Lambert
REFERENCES
1. R. A. Jewell. Strength and Deformation in Reinforced Soil Design. Proc., 4th International Conference on Geotexti/es, Geomembranes and Related Products, the Hague, the Netherlands, May 1990.
2. G. Schneebeli. A Mechanical Analogy for the Study of the Stability of Two-Dimensional Earth Structures. Proc., 4th International Conference on Soil Mechanics and Foundation Engineering, Vol. 2, London, England, pp. 228-232.
3. D. Leshchinsky and R. H. Boedeker. Geosynthetic Reinforced Soil Structures. Journal of the Geotechnical Engineering Division, ASCE, Vol. 115, No. 10, 1989, pp. 1,459-1,478.
4. D. Leshchinsky and E. B. Perry. On the Design of GeosyntheticReinforced Walls. Geotextiles and Geomembranes, Vol. 8, No. 4, 1989, pp. 311-323.
63
5. G. Lambert. Cohesionless Slopes Reinforced with Flexible Inclusions. M.S. thesis. Department of Civil Engineering, University of Delaware, Newark, May 1990.
6. R. J. Bathurst, D. J. Benjamin, and P. M. Jarrett. Laboratory Study of Geogrid Reinforced Soil Walls. In Geosynthetics for Soil Improvement, Geotechnical Special Publication 18 (R. D. Holtz, ed.), ASCE, 1988, pp. 178-192.
7. R. J. Bathurst and D. J. Benjamin. Failure of a Geogrid Reinforced Soil Wall. In Transportation Research Record 1288, TRB, National Research Council, Washington, D.C., 1990.
Publication of this paper sponsored by Committee on Geosynthetics.