FAO’s global livestock life-cycle analysis: current state of play and forthcoming initiatives Partnership Technical Seminar 4/7/12 Michael MacLeod, Pierre Gerber, Carolyn Opio, Alessandra Falcucci, Giuseppe Tempio and Henning Steinfeld
Transcript
FAO’s global livestock life-cycle
analysis: current state of play and forthcoming initiatives
Partnership Technical Seminar
4/7/12
Michael MacLeod, Pierre Gerber, Carolyn Opio, Alessandra
Falcucci, Giuseppe Tempio and Henning Steinfeld
Overview
• Background – why and how we undertake life-cycle analysis of livestock GHG
• Illustration of the potential of LCA
• Conclusions
The big picture
“Satisfying the growing demand for animal food products while at the same time sustaining the productive assets of the natural resource base – soil, water, air, biodiversity – and coping with climate change and vulnerability”
Pingali and McCullough (2010, p9)
-Fundamental changes in production make this a significant challenge-
Pingali, P. and McCullough, E. (2010) Drivers of change in global agricultural livestock systems. In Livestock in a Changing Landscape
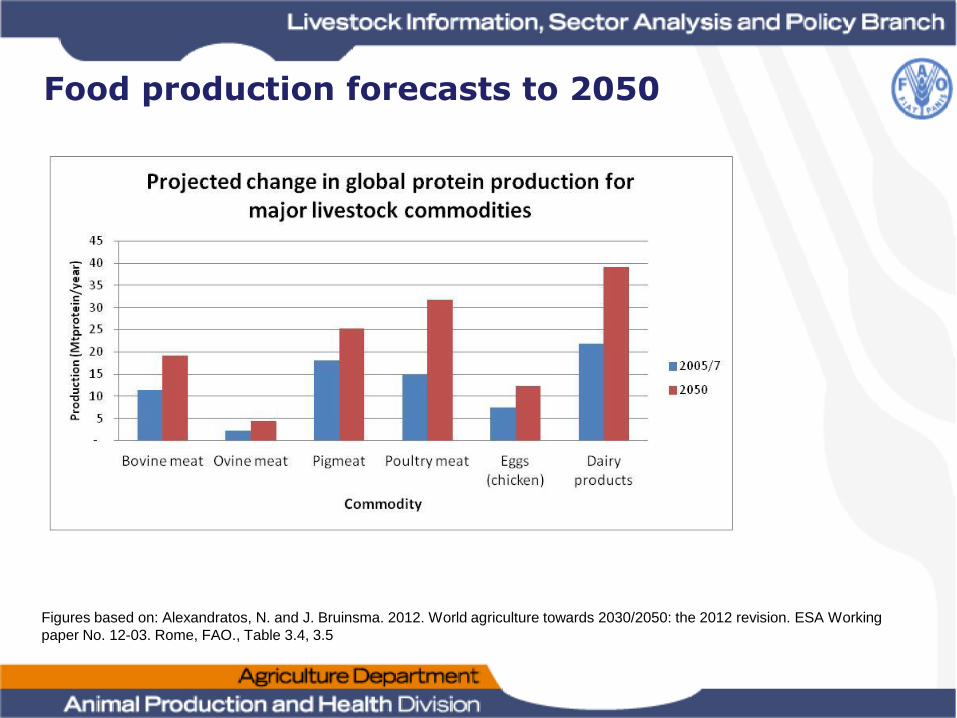
Food production forecasts to 2050
Figures based on: Alexandratos, N. and J. Bruinsma. 2012. World agriculture towards 2030/2050: the 2012 revision. ESA Working
paper No. 12-03. Rome, FAO., Table 3.4, 3.5
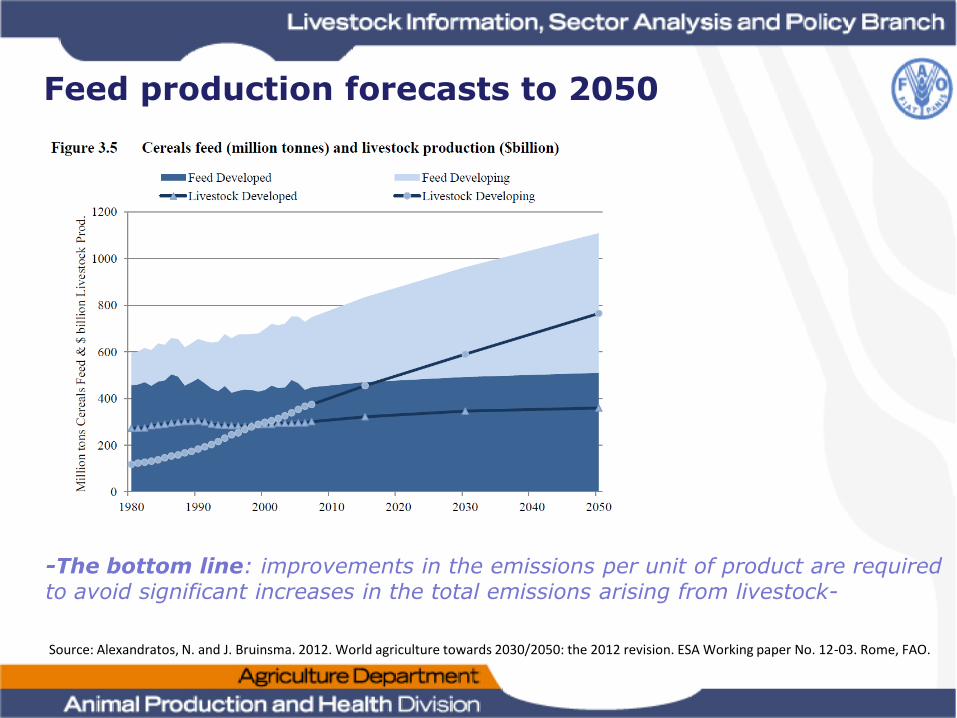
-The bottom line: improvements in the emissions per unit of product are required to avoid significant increases in the total emissions arising from livestock-
Feed production forecasts to 2050
Source: Alexandratos, N. and J. Bruinsma. 2012. World agriculture towards 2030/2050: the 2012 revision. ESA Working paper No. 12-03. Rome, FAO.
Improving the greenhouse gas emissions efficiency of livestock production raise many questions, such as:
• What are the ranges of emissions intensity and what influences variation?
• What is the relative importance of different stages in the supply chain?
• Where are the hotspots and points of intervention?
• What happens to the emissions intensity when you change X, Y or Z...and what might the unintended consequences be?
• To what extent is it possible to measure and predict for complex biophysical systems – and how can we communicate uncertainty?
FAO’s livestock LCA
• Specific objective: Produce estimates of global GHG emissions and emissions intensity for the following livestock sectors:
• Dairy and beef cattle
• Small ruminants
• Buffalo
• Pigs
• Poultry
• Scope – cradle to retail point.
• Scope – main emissions categories included (soil carbon fluxes not arising from LUC to be included in V2.0)
• Predominant production systems.
• Main world regions and agro-ecological zones (AEZs).
• GIS-based model.
Current status of global livestock LCA
• V1.0 analysis of cattle, sheep, goats, pigs and chickens completed
• Two global LCA reports will be published this autumn: (1) beef and small ruminants, (2) pigs and chickens
• Buffalo analysis to be completed this summer, after mission to India
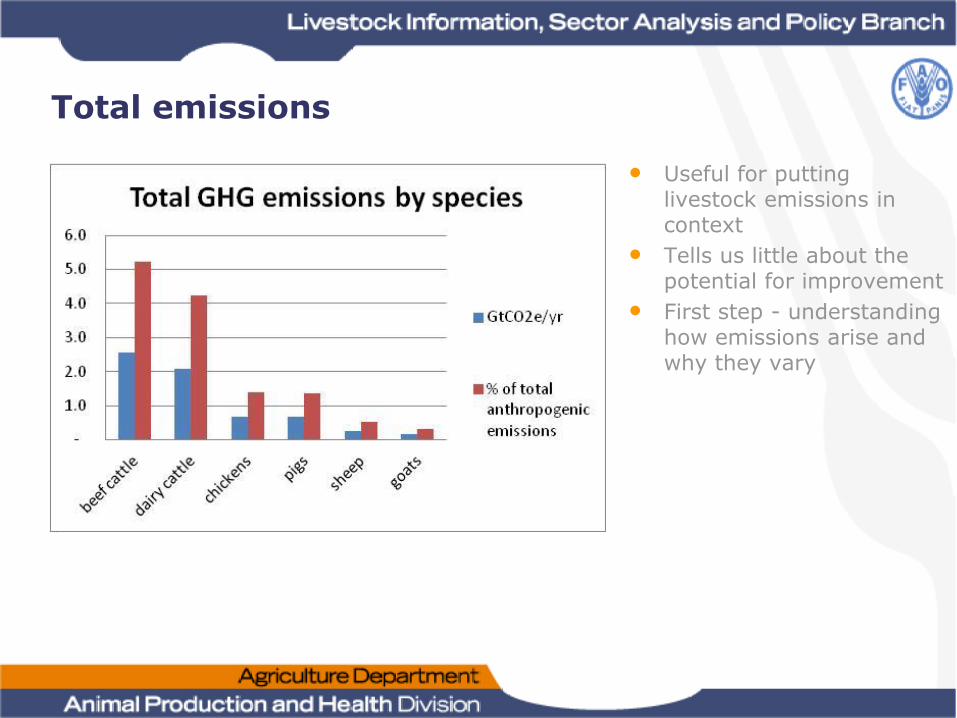
Total emissions
• Useful for putting livestock emissions in context
• Tells us little about the potential for improvement
• First step - understanding how emissions arise and why they vary
Comparison of pigs and small ruminants
• Different emissions profiles arising from differences in:
• Physiology
• Digestive systems
• Nutritional requirements
• Production systems
• Rations
• Feed conversion ratios
• Manure management
• Location
• Physical conditions
• Mode of feed production
Production systems: they exist because they
work, in a given context, e.g. are profitable, or
resilient. Conditions vary, so production
systems vary – 15 or so beef systems in UK,
so will get ranges of performance.
Contribution of each emission category for global pigs
and small ruminants
Global pig production
• Population: 900m head
• Production: 110bn kgCW per year
• Landless, so limited spatial link to feed production
• Over 70% of global herd in 3 areas (by head): • China (47%),
• EU (18%),
• USA (7%)
• LCA model classifies them into 3 systems: • Industrial
• Intermediate
• Backyard
Variation in emissions intensity by system
• Emissions from feed production (green) and manure management (brown) dominate in all 3 systems
• Backyard – highest on-farm emissions, but lowest overall EI - why?
• Low FCR, low digestibility of the ration>high VS and N excretion
• Feed CO2e low due to: no LUC, post-farm, direct or embedded energy, and greater use of swill and waste crops
• Why is intermediate higher than industrial?
• Lower FCR
• Lower digestibility ration
• Lot of rice
Distribution of EI within systems
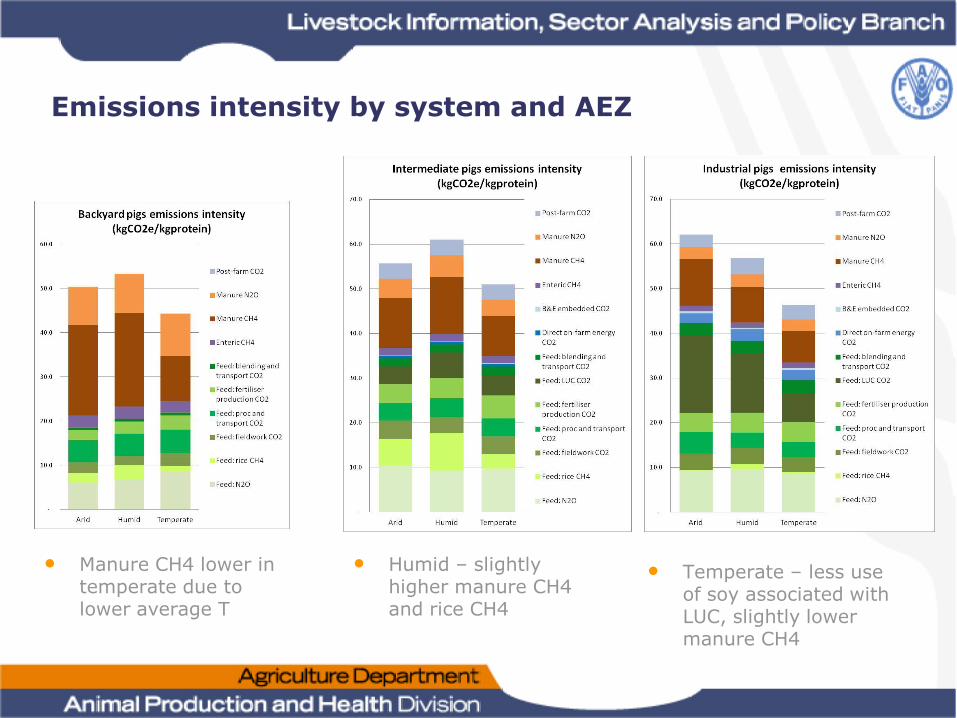
Emissions intensity by system and AEZ
• Manure CH4 lower in temperate due to lower average T
• Humid – slightly higher manure CH4 and rice CH4
• Temperate – less use of soy associated with LUC, slightly lower manure CH4
Emissions intensity by system and region
• For example, we can disaggregate by system and region...
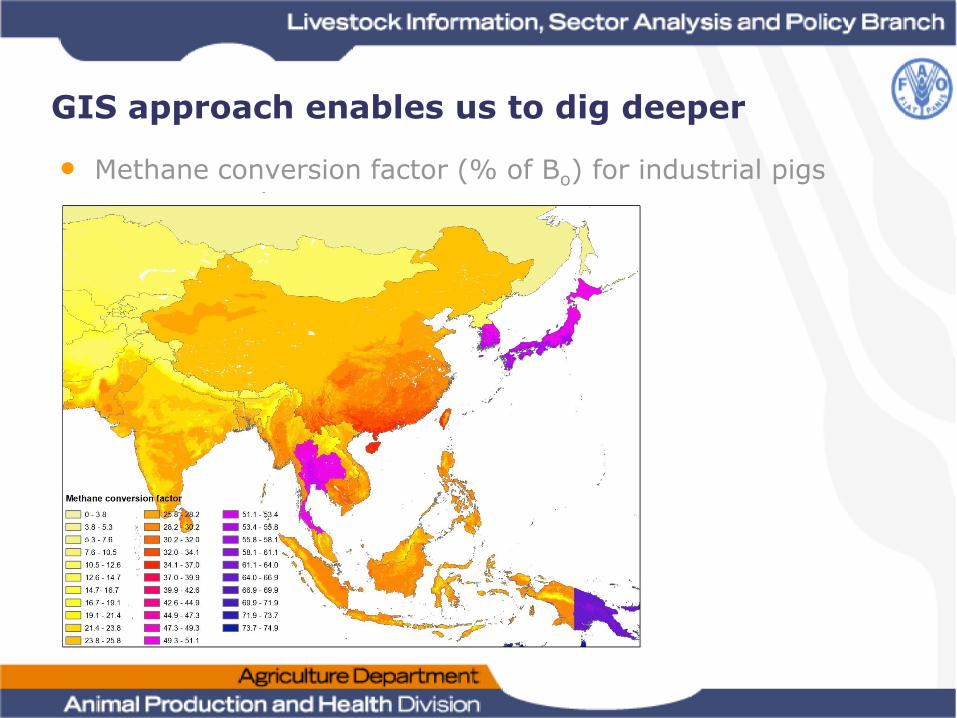
GIS approach enables us to dig deeper
• Methane conversion factor (% of Bo) for industrial pigs management
Challenges and opportunities
• Trade-off between scope and resolution>targeted data gathering for key parameters/locations
• Characterizing uncertainty
• Quantifying soil C fluxes
• Improving our understanding of manure management and recycling
-The work of the Partnership will help us to meet these challenges-