Fatty acid composition of diet, cord blood and breast milk in Chinese mothers with different dietary habits Yongmei Peng, MD, MPH Qing Wang, MD Tingting Zhou , MD Peining Liu, MD Children's Hospital, Fudan University, Shanghai Women and Children Health Care Centre of Changzhou Karolinska Hospital, Karolinska Institute, Sweden Sahlgrenska Academy, Göteborg University, Sweden R Zetterström, MD B Strandvik, MD
Transcript
Fatty acid composition of diet, cord blood and breast milk in
Chinese mothers with different dietary habits
Yongmei Peng, MD, MPH Qing Wang, MD
Tingting Zhou , MD
Peining Liu, MD
Children's Hospital, Fudan University, Shanghai Women and Children Health Care Centre of Changzhou
Karolinska Hospital, Karolinska Institute, SwedenSahlgrenska Academy, Göteborg University, Sweden
R Zetterström, MD B Strandvik, MD
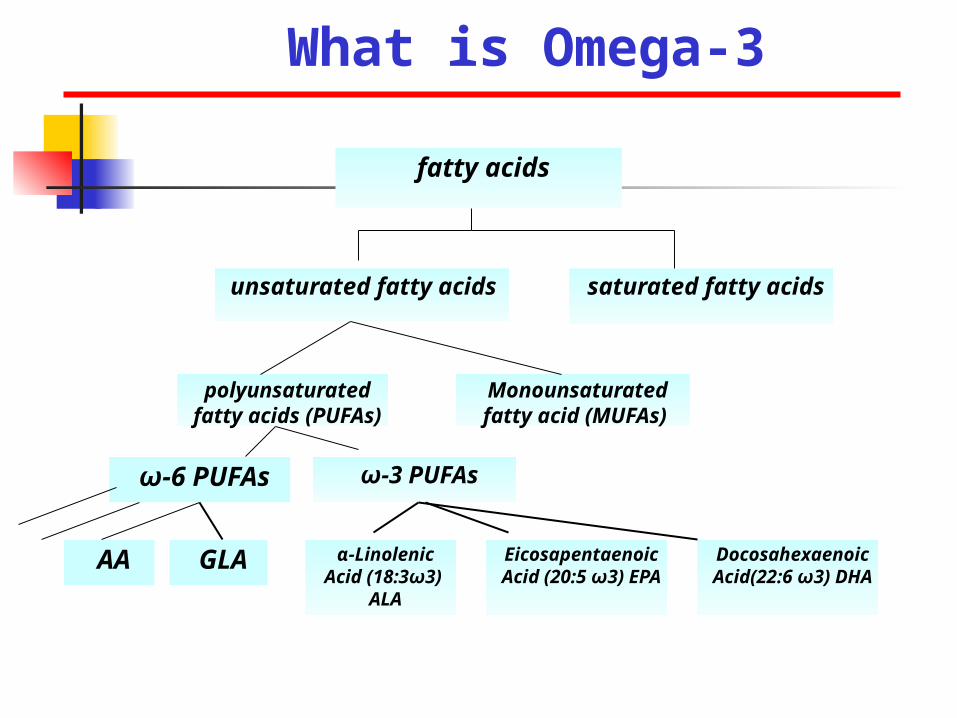
saturated fatty acids
polyunsaturated fatty acids (PUFAs)
unsaturated fatty acids
Monounsaturated fatty acid (MUFAs)
fatty acids
AA
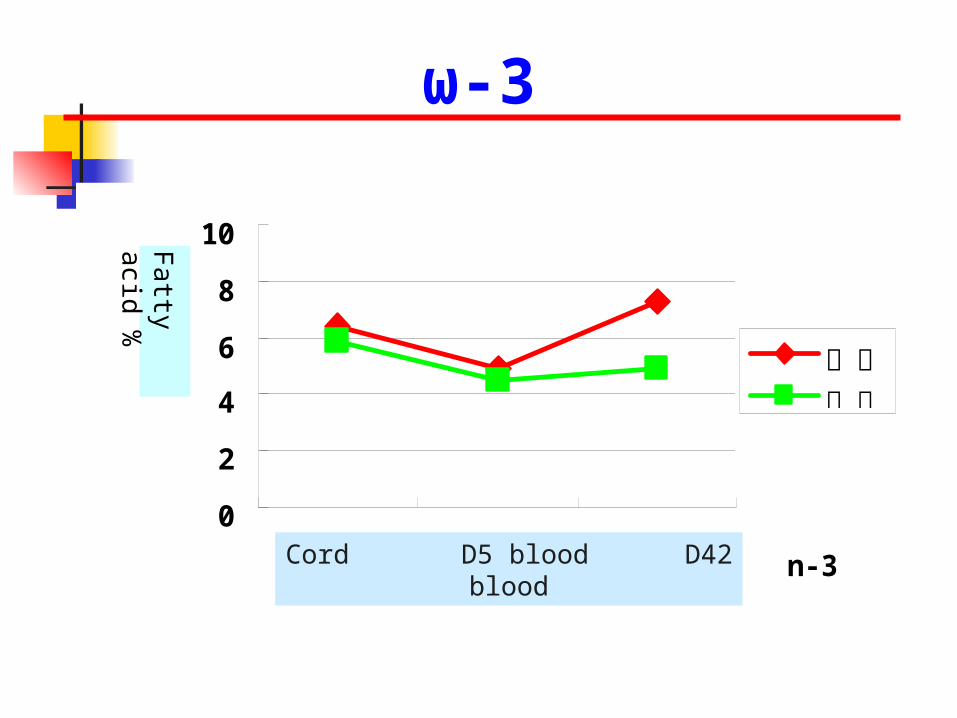
ω-3 PUFAs
GLA α-Linolenic Acid (18:3ω3)
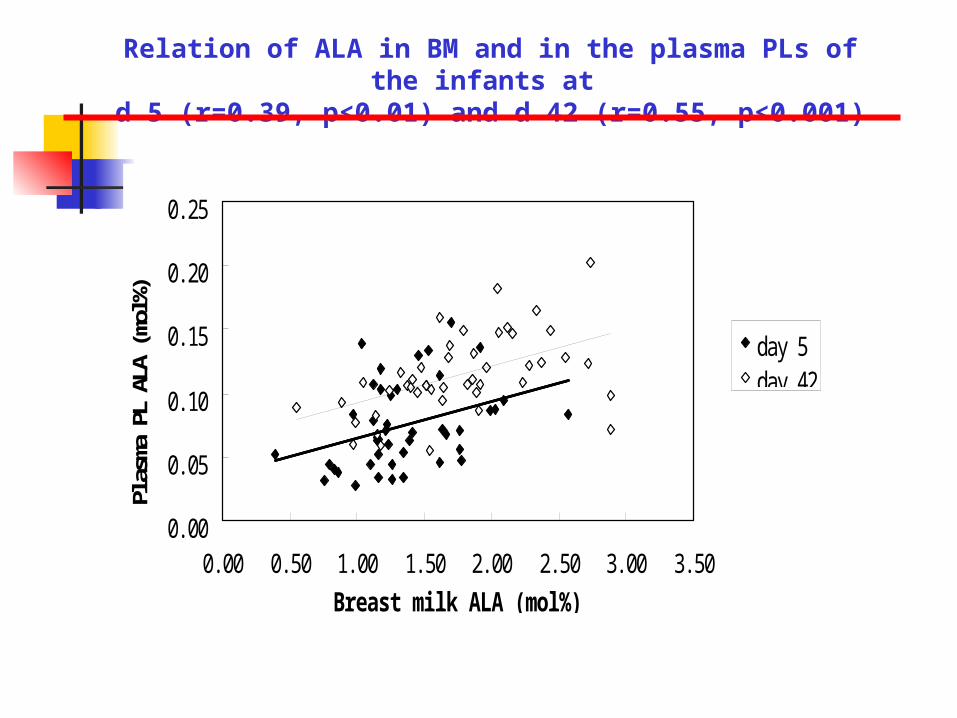
ALA
Eicosapentaenoic Acid (20:5 ω3)
EPA
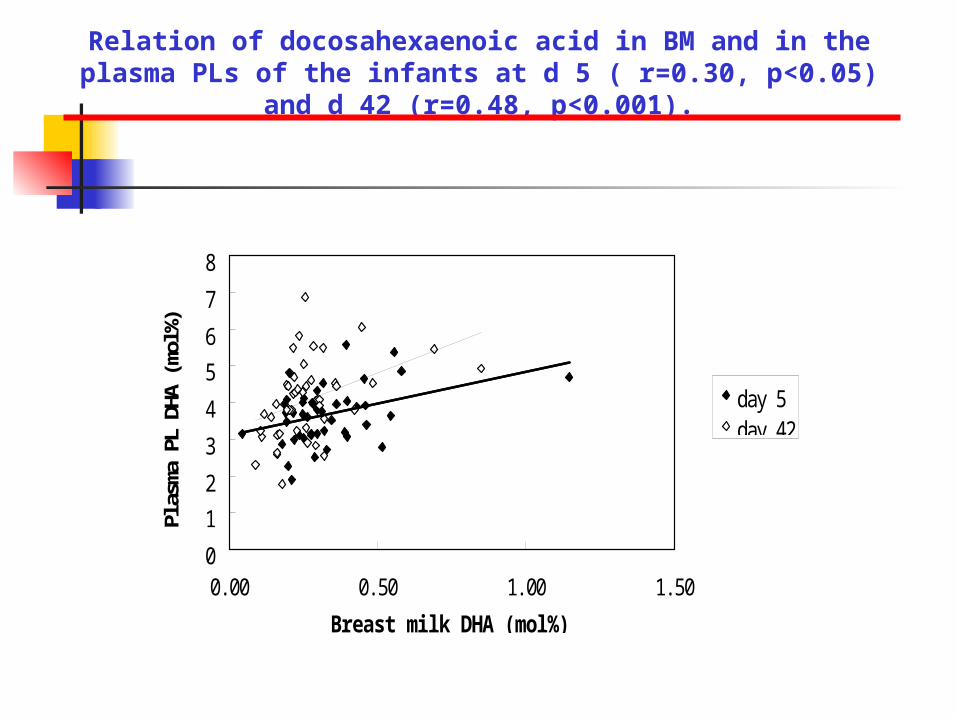
Docosahexaenoic Acid(22:6 ω3) DHA
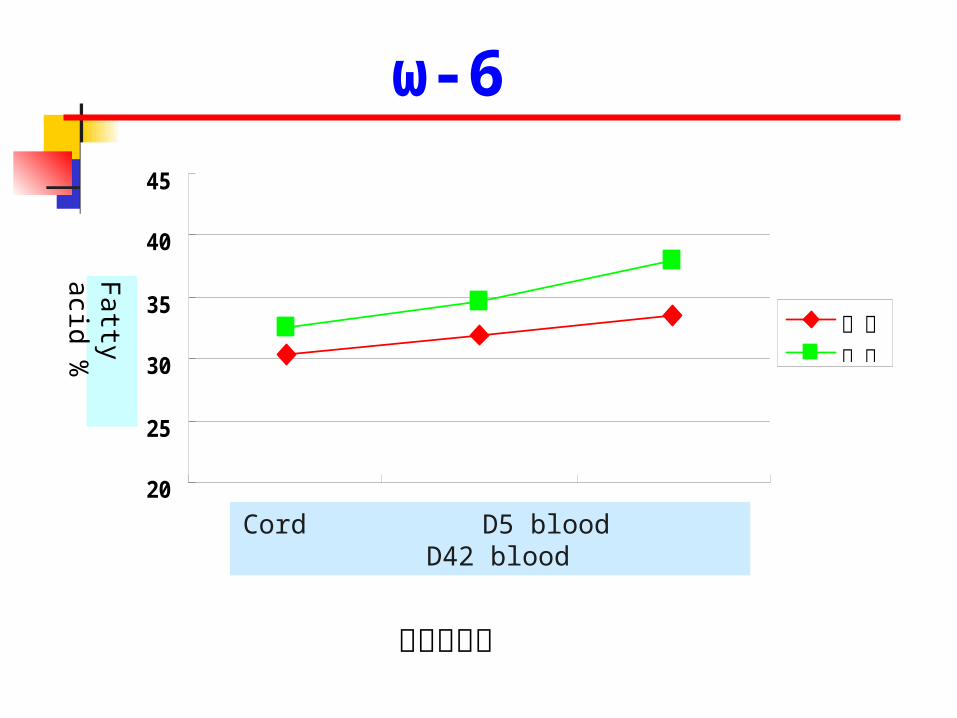
ω-6 PUFAs
What is Omega-3
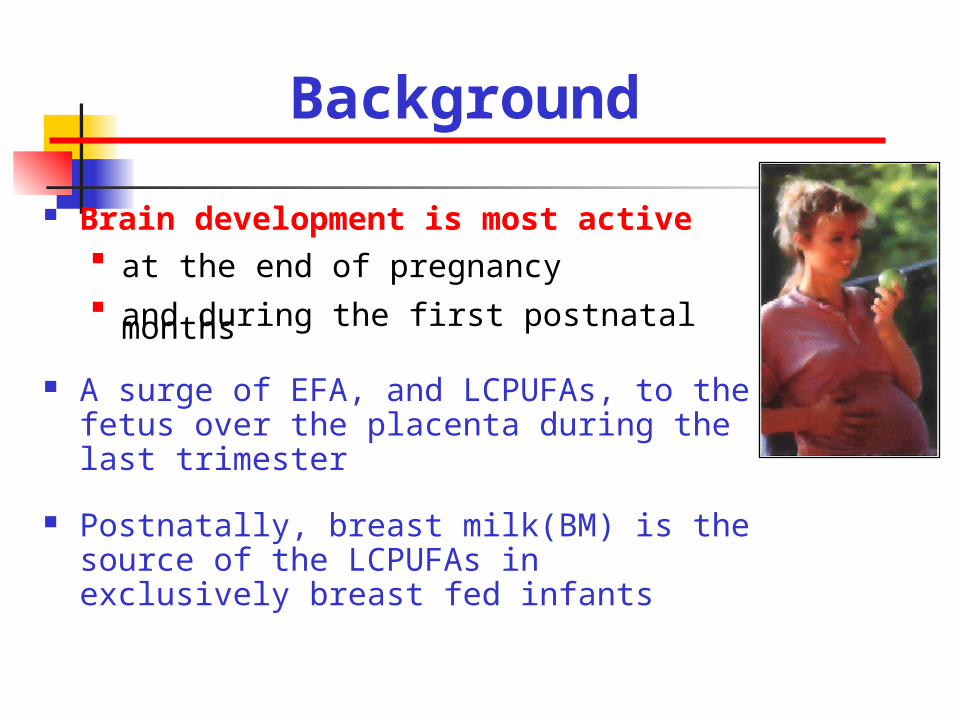
Background
Brain development is most active at the end of pregnancy and during the first postnatal months
A surge of EFA, and LCPUFAs, to the fetus over the placenta during the last trimester
Postnatally, breast milk(BM) is the source of the LCPUFAs in exclusively breast fed infants
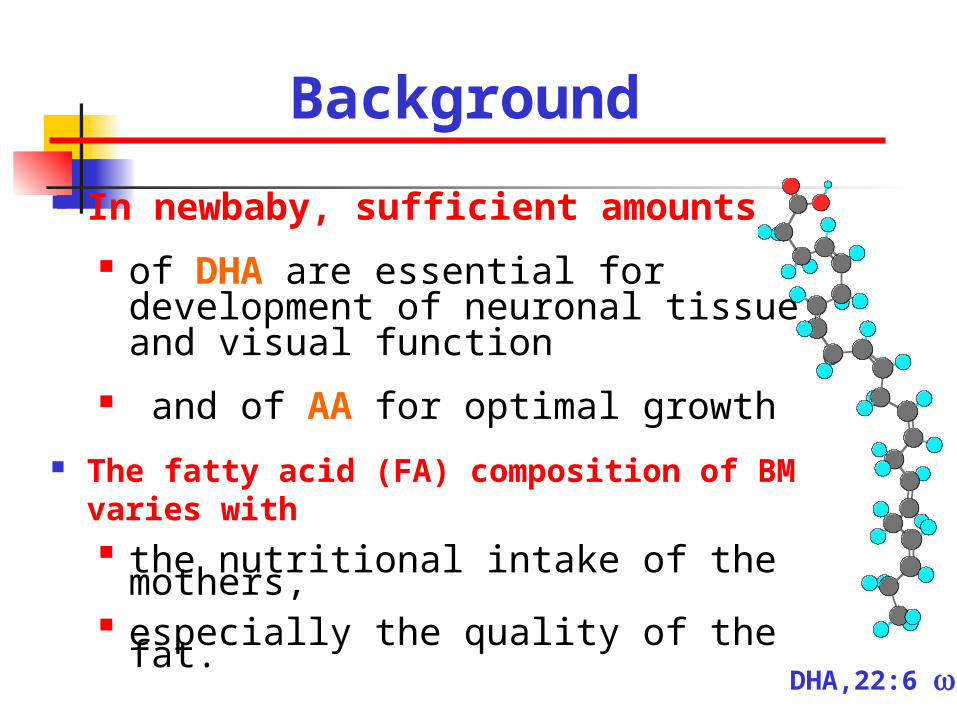
Background
In newbaby, sufficient amounts of DHA are essential for development of
neuronal tissue and visual function
and of AA for optimal growth
The fatty acid (FA) composition of BM varies with
the nutritional intake of the mothers, especially the quality of the fat.
DHA,22:6 3
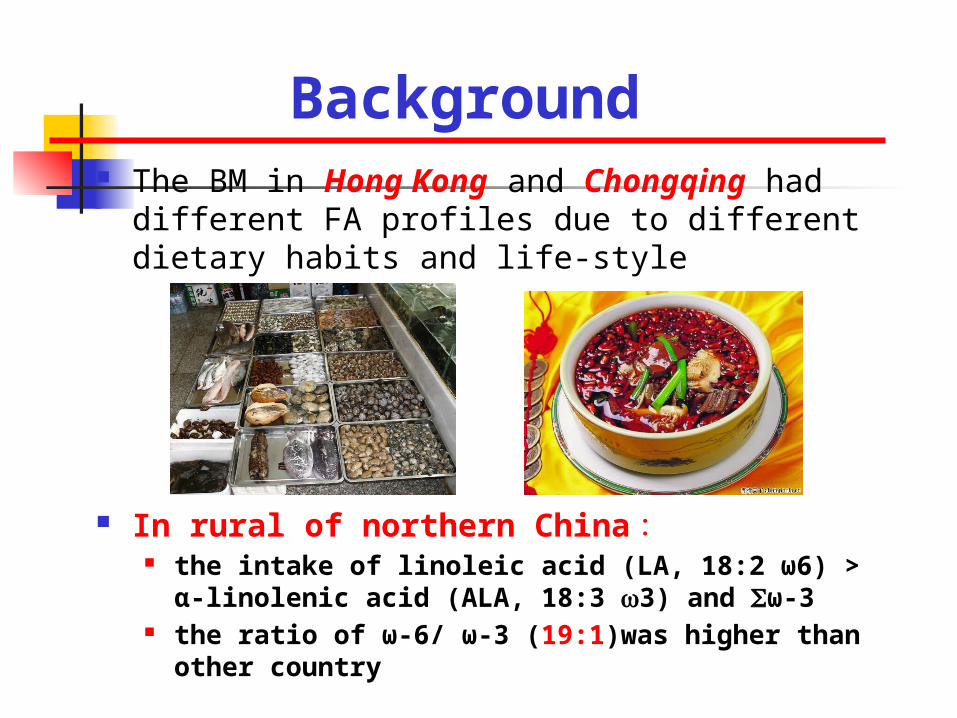
Background The BM in Hong Kong and Chongqing had
different FA profiles due to different dietary habits and life-style
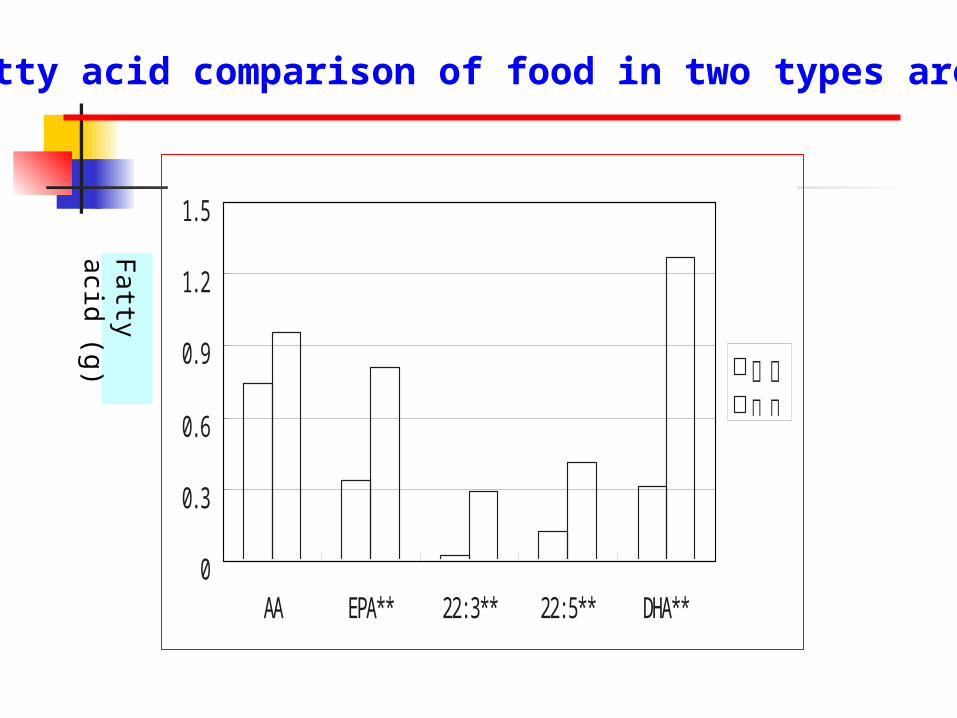
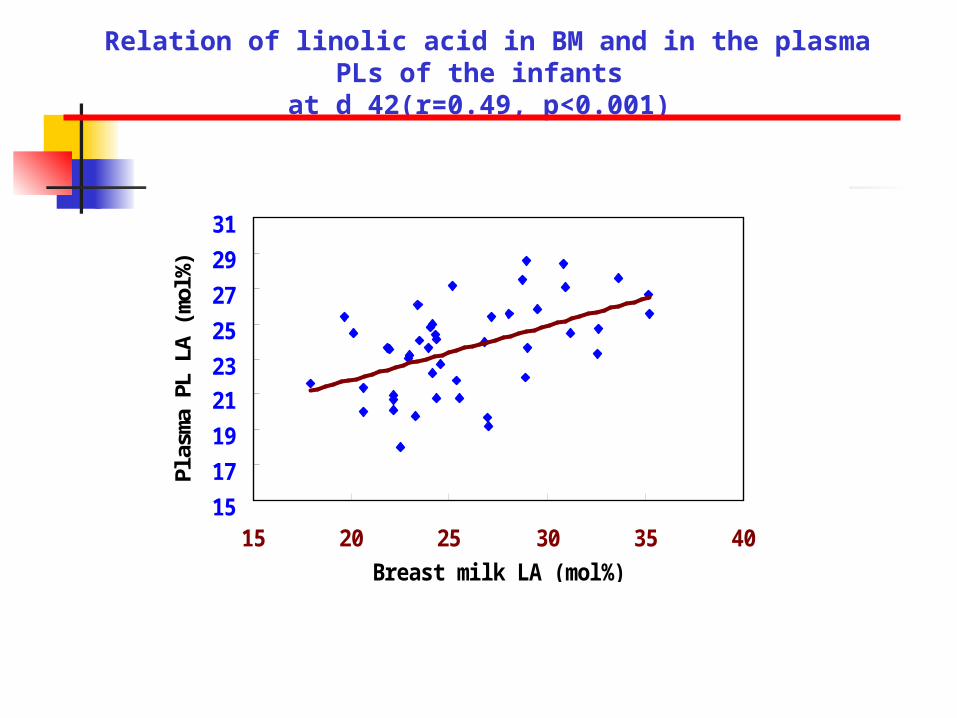
In rural of northern China : the intake of linoleic acid (LA, 18:2 ω6) > α-linolenic acid
(ALA, 18:3 3) and ω-3 the ratio of ω-6/ ω-3 (19:1)was higher than other country
Background
Human and animal studies show that maternal dietary FA intakes may influence the FA profiles of
cord blood and fetal tissuesAmusquivar E, Biol Neonate. 2003;83(2):136-45.
De Vriese SR, PLEFA. 2002 ;67(6):389-96.
During the first postnatal weeks neonates do not seem to synthesize sufficient amounts of LC-
PUFAs from their precursors (LA and ALA)
Can not to satisfy their high needs
Salem NJ, Proc Natl Acad Sci U S A. 1996;93(1):49-54.
Objectives
To help untangle the influence of two different dietary patterns on
maternal fatty acid intake the composition of umbilical cord blood transitional breast milk
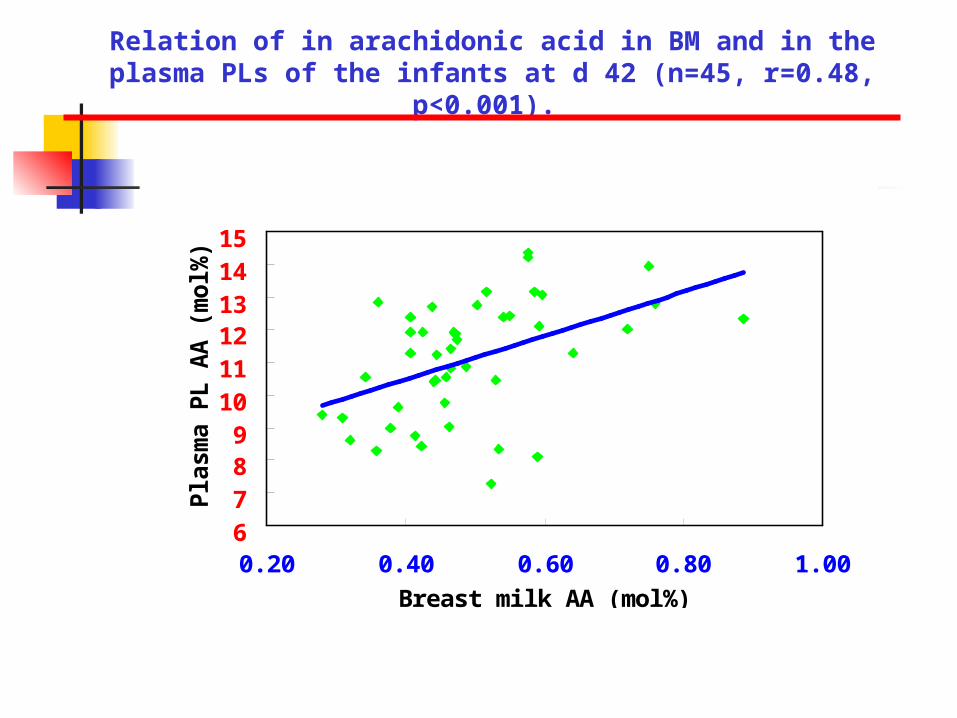
To analyze the related factors on the composition of LC-PUFAs in
the BM and the paired infants’ plasma PLs
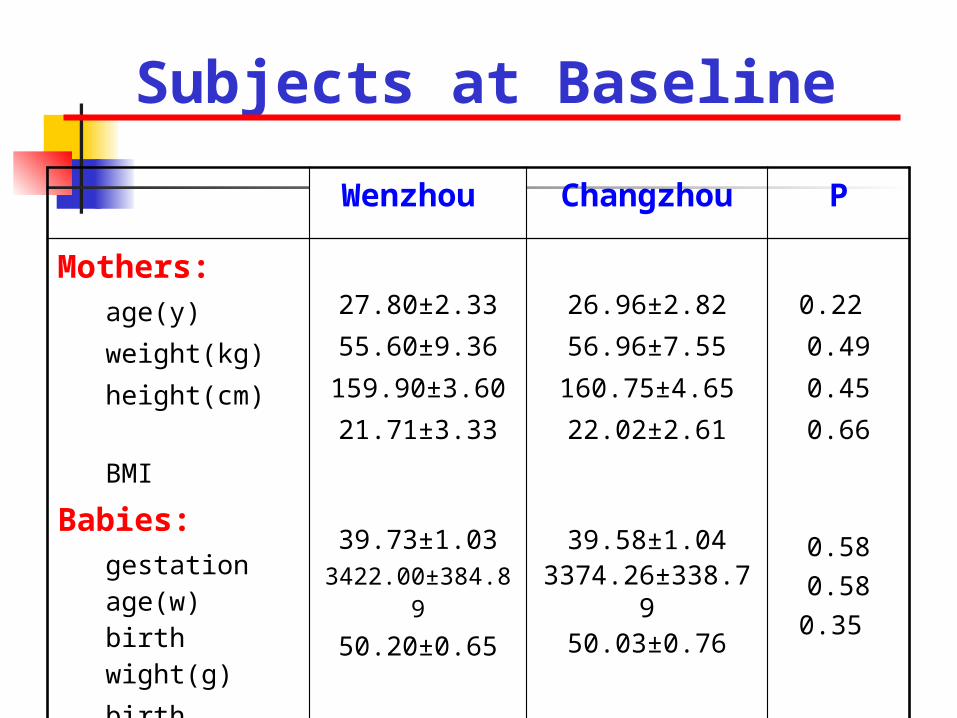
Subjects
mother-term infant pairs
7-day forward dietary record during the last trimester
recruited subjects before delivery
Follow-up to 42days
Day 5, day 42 breast milk Day 0 、 5 、 42 infant’s blood
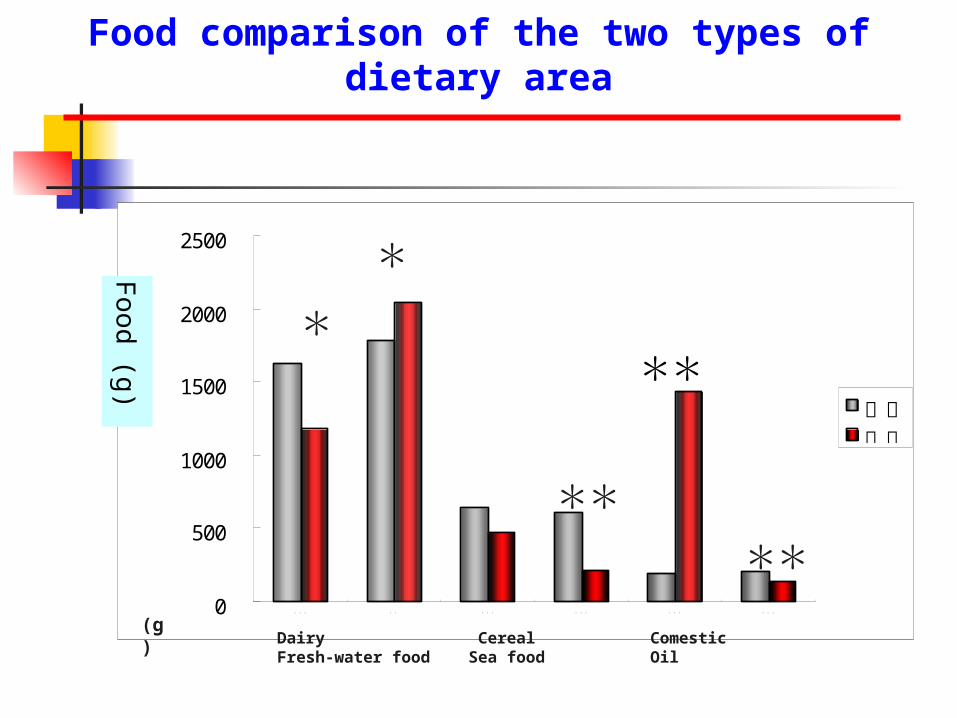
Ocean area (Wenzhou) Traditional chinese food area (Changzhou)
Data Collection
Breast milk was manually expressed into a
plastic vial
Cord blood was obtained after the umbilical cord had
been cut
Blood samples ( infants) were obtained at day 5
and day 42 by venipuncture
Fatty acid analysis
Extract The lipids were extracted with chloroform-methanol
Fractionate The phospholipids(PLs) from plasma were
fractionated on a single SEP-PAK aminopropyl cartridge
Separate by capillary gas-liquid chromatography
Statistical Analysis
Mann-Whitney´s U test was used to calculate
the differences of FA between dietary, cord blood and breast milk samples.
Spearman correlation test was used for analyses of
associations between dietary intake and FA composition