www.furuno.co.jp FEA-2x07 Series ECDIS Operator’s Guide About this Guide The purpose of this Operator's Guide is to provide basic information for this equipment. For more detailed information, see the operator's manual. The following information is presented in this manual: • Description of ECDIS control units • Information available on the ECDIS screen • Setting up for departure • How to create a route, user chart and pilot data • Some essential information about charts and datums • Alarms • How to update charts (Applicable to program version no. 05.52)
Transcript
www.furuno.co.jp
FEA-2x07 Series ECDISOperator’s Guide
About this GuideThe purpose of this Operator's Guide is to provide basic information for this equipment. Formore detailed information, see the operator's manual. The following information is presentedin this manual:
• Description of ECDIS control units• Information available on the ECDIS screen• Setting up for departure• How to create a route, user chart and pilot data• Some essential information about charts and datums• Alarms• How to update charts
(Applicable to program version no. 05.52)
2
CONTENTS
Control Panel ........................................ 3
Set up Before Departure ...................... 7Update chart material ............................. 7Display and approve date for
S57 charts and manual updates ......... 7Create or update user chart.................... 7Create or update pilot data ..................... 7Set chart alarm calculation ..................... 8Create or update route ........................... 8
Check your route againstchart alarms.........................................9
Reset distance and trip counters .......... 13Verify datum ......................................... 13
Route, User Chart and Pilot Data...... 14Creating a route.................................... 14Creating a user chart ............................ 15Creating a pilot data ............................. 16
Own Ship and ARPA Targets ............17Own ship and ARPA targets..................17
Position of own ship onchart display area ..............................17
Chart motion.........................................17Own ship symbol ..................................18ARPA target symbol .............................18Vectors of own ship and
ARPA targets.....................................19Own ship past track..............................20ARPA target past track.........................20AIS targets............................................20
Charts, Datums and Alarms ..............21Charts....................................................21
Chart types ...........................................21Browsing around your charts................21Presentation of ARCS material ............22Presentation of S57 charts ...................22Display Base ........................................22Control of visible chart features............23Control of visible navigation features ...24
Chart datum...........................................24Chart datum of S57 ..............................24Chart datum of ARCS...........................24
ECDIS datum ........................................24Alarms ...................................................25
Alarms generated by navigationcalculation..........................................25
Alarms generated by chartcalculation..........................................25
Alarms generated by steeringcalculation..........................................25
Description of the alarm prioritysystem ...............................................25
OverviewTwo control units are available: Control Head RCU-018 and TB Control Unit RCU-015. Each car-ries a mouse, power switch and at least two hot keys. The RCU-018 is additionally equipped with a keyboard. All functions of the ECDIS may be accessed with the mouse. To use the mouse, roll the trackball to choose item desired, push the left or right mouse button as applicable then push the scrollwheel.
Control head RCU-018
TB control unit RCU-015
1MARK
2/ABCP BRILL
3/DEFMODE
4/GHIOFF CNT
5/JKLSCROLL
6/MNORECORD
7/PQRSPLAN
8/TUVMONITOR
9/WXYZNEXT
CANCELSENSOR
0/|_|
CU/TM RSHIFTHELP
OFF ON OFF ON
MOB
EVENT
TARGETDATA
MENU
+
RANGE
-
F1
ALARMACK
SYSTEMFAILURE
F2
STDDSP
RADAR
EBL VRM
A/C RAIN A/C SEA GAIN
4
Description of controls on Control Head RCU-018
Key Description
Power Turns the system on/off. (This control does not switch the display on/off.)
VRM wheel Adjusts active VRM.
VRM ON Activates and displays VRM1 if no VRM is displayed or VRM2 is active.Activates and displays VRM 2 if VRM1 is active.
VRM OFF Inactivates and erases VRM1 if both VRMs are displayed. Inactivates and erases VRM 2 if VRM1 is active.
EBL wheel Adjusts active EBL.
EBL ON Activates and displays EBL1 if no EBL is displayed or EBL2 is active.Activates and displays EBL2 if EBL1 is active.
EBL OFF Inactivates and erases EBL1 if both EBLs are displayed. Inactivates and erases EBL2 if EBL1 is active.
F1 Activates user-defined function or menu.
F2 Activates user-defined function or menu.
ALARM ACK Alarm acknowledgement for alarms generated by chart, navigation or steer-ing calculation.
SYSTEM FAILURE The red lamp behind the key lights and the buzzer sounds when system fail-ure is found. Hit the ALARM ACK key to silence the buzzer. The key remains lit until the reason for the problem is removed.System failure: ARCS drawing problem, S57 drawing problem, Human inter-face, INS communication, Voyage recording, and Access server.
RADAR Displays Radar Overlay dialog box, which provides functions for adjustment of the radar picture.
STD DSP Activates standard display presentation on the ECDIS.
1/MARK Displays the Nav. Marks dialog box, which mainly provides for activation/deactivation of various markers.
Update chart materialUpdate your ARCS and S57 chart material before departure. See the chapter on Vector Chart Ma-terial and Raster Chart Material in the operator's manual for the procedure.
Display and approve date for S57 charts and manual updatesYou should set Display and Approve date for S57 charts as current date.
There may be features which are date-dependent or periodical in S57 charts, therefore if you have not set the Display and Approve dates as current date, there is possibility that you may get the wrong presentation or some features may completely be absent. For how to set Display Until and Approve Until dates, see paragraph 8.12.3 "Setting "display until" date" and paragraph 8.12.4 "Setting "approve until” date".
Create or update user chartIf necessary, create a new user chart or modify an existing one. For how to create a user chart, see Chapter 15 "User Chart Control" in the Operators Manual and "Creating a User Chart" in this manual.
Create or update pilot dataIf necessary, create a new pilot data or modify an existing one. For how to create pilot data, see Chapter 16 "Pilot Data" in the Operator's Manual and "Creating Pilot Data" in this manual.
8
Set chart alarm calculationSet chart alarm areas suitable for your coming voyage. For more information, see Chapter 11 "Chart Alarms" in the Operator's Manual.
To open the Chart Alarms dialog box, place the cursor on the chart scale indication, push the right mouse button, open the Initial Settings menu then choose Chart Alarm parameters.
Create or update routeTo access the menu for route planning, click the Plan button for Route on the status bar.
If necessary, create a new route or modify an existing one. For how to create or update a route, see Chapter 13 “Route Planning" in the Operator's Manual and "Creating a route" in this manual.
9
Check your route against chart alarmsBefore you sail your route, you should always check your route again for chart alarms. This is im-portant because your S57 charts and manual updates may contain date-dependent information. You can check chart alarms on the Check page in the Plan Route dialog box.
Recalculate timetable and ETA valuesRecalculation can be done on the Parameters page in the Plan Route dialog box. Minimally, set ETD to departure time and perform desired optimization.
After checking chart alarms and setting ETD, cancel selection of the planned route in order to se-lect it as the route to be monitored. Use, on the Route Plan menu, Unselect or Exchange with Mon-itored (to select it directly as monitored route).
10
Check and prepare route to monitorSelect a route for the next voyage; double click the Monitor button for Route in the status bar then select recalculated route. For how to select a route to monitor, see paragraph 14.2 "Choosing Route to Monitor" in the Operator's Manual.
Select next waypointThe system selects next waypoint automatically, so check that it is the correct one. Note that way-point number 1 is not accepted. If you need to specify next waypoint, do so in the dialog box shown above.
Select final waypointThis selection is used ONLY in case the last waypoint should be different to that one defined last in your route. If you need to specify the last waypoint, do so in the dialog box shown above.
SPD
SPD profile
11
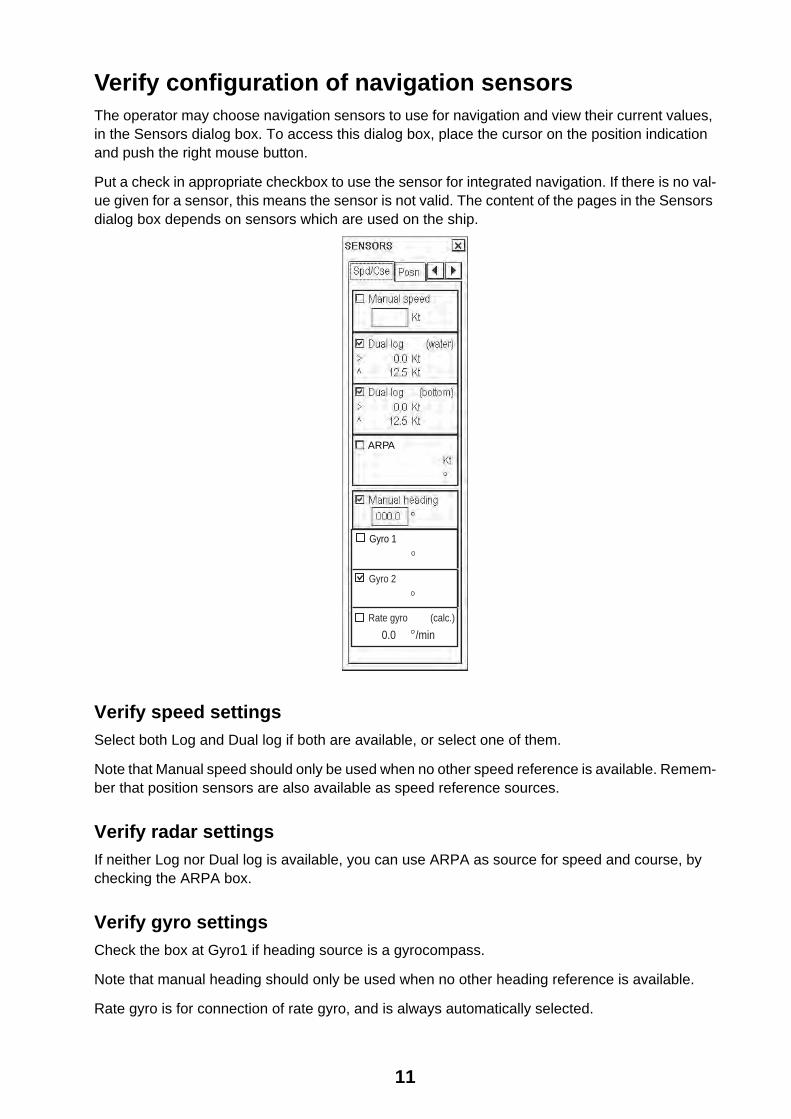
Verify configuration of navigation sensorsThe operator may choose navigation sensors to use for navigation and view their current values, in the Sensors dialog box. To access this dialog box, place the cursor on the position indication and push the right mouse button.
Put a check in appropriate checkbox to use the sensor for integrated navigation. If there is no val-ue given for a sensor, this means the sensor is not valid. The content of the pages in the Sensors dialog box depends on sensors which are used on the ship.
Verify speed settingsSelect both Log and Dual log if both are available, or select one of them.
Note that Manual speed should only be used when no other speed reference is available. Remem-ber that position sensors are also available as speed reference sources.
Verify radar settingsIf neither Log nor Dual log is available, you can use ARPA as source for speed and course, by checking the ARPA box.
Verify gyro settingsCheck the box at Gyro1 if heading source is a gyrocompass.
Note that manual heading should only be used when no other heading reference is available.
Rate gyro is for connection of rate gyro, and is always automatically selected.
ARPA
Gyro 2
Rate gyro (calc.)
0.0 /min
Gyro 1
12
Verify position sensors
You may verify position sensors on the Posn page in the Sensors dialog box. The data field of a position sensor contains a label (here FURUNO and MX200) which indicates the type of the sen-sor. Sensor status is indicated as Primary, Secondary or OFF. Position i shown in local datum with speed and course. A DGPS position sensor has the additional text Diff, if the differential signal is in use.
Position sensors have priority, which is indicated using Primary and Secondary. Only one sensor can be primary while the others can be secondary or off position. After a sensor is turned off, its status is changed to Secondary state. When a position sensor state is changed to primary and another sensor was primary, the sensor formerly primary becomes secondary.
"Primary" = IS THE SENSOR WHICH IS CONSIDERED TO BE MOST RELIABLE.
"Secondary" = IS OTHER SENSORS
Verify Kalman filterThe Kalman filter is an automatic process that calculates the most probable position based on data from all position sensors. The filter uses in its process all sensors that are not selected to OFF. For details about the Kalman filter, see paragraph 19.7 "Filter Operation" in the Operator's Manual.
Verify chart alignmentChart alignment is used to move your vessel to the "Correct" position if position devices define an "incorrect" position. Normally switch off chart alignment in the start up procedure. For more infor-mation about alignment, see paragraph 19.8 "Position Alignment" in the Operator's Manual.
13
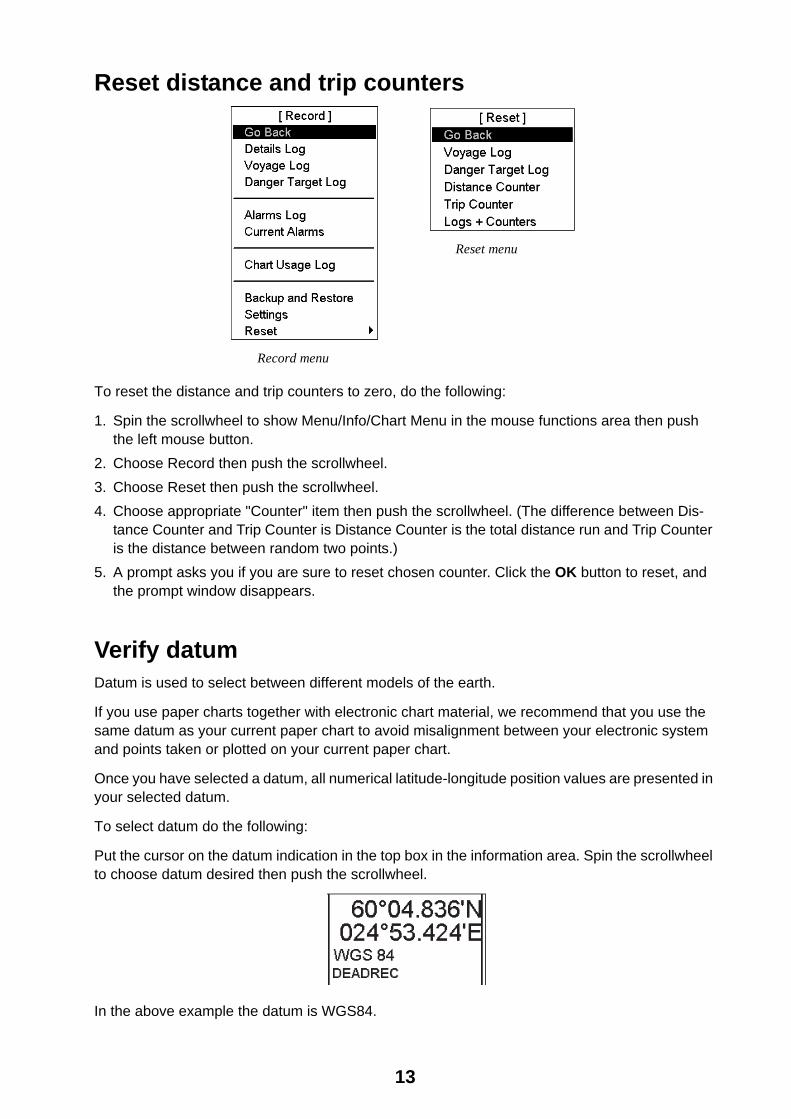
Reset distance and trip counters
To reset the distance and trip counters to zero, do the following:
1. Spin the scrollwheel to show Menu/Info/Chart Menu in the mouse functions area then push the left mouse button.
2. Choose Record then push the scrollwheel.3. Choose Reset then push the scrollwheel.4. Choose appropriate "Counter" item then push the scrollwheel. (The difference between Dis-
tance Counter and Trip Counter is Distance Counter is the total distance run and Trip Counter is the distance between random two points.)
5. A prompt asks you if you are sure to reset chosen counter. Click the OK button to reset, and the prompt window disappears.
Verify datumDatum is used to select between different models of the earth.
If you use paper charts together with electronic chart material, we recommend that you use the same datum as your current paper chart to avoid misalignment between your electronic system and points taken or plotted on your current paper chart.
Once you have selected a datum, all numerical latitude-longitude position values are presented in your selected datum.
To select datum do the following:
Put the cursor on the datum indication in the top box in the information area. Spin the scrollwheel to choose datum desired then push the scrollwheel.
In the above example the datum is WGS84.
Record menu
Reset menu
14
Route, User Chart and Pilot Data
Creating a route
To make a route for a voyage, do the following:
1. Place the cursor on Route in the status bar then click the Plan button to open the Plan Route dialog box with Route Plan menu. (If the menu does not appear, place the cursor on the trian-gle in the dialog box.) Choose Create from the menu and push the scrollwheel.
2. Enter a name for the route by spinning the scrollwheel to choose character desired and con-firming desired character by pushing the scrollwheel. Repeat to complete the name then click the OK button.
3. Check Enable changes in the Plan Route dialog box. Choose position of a waypoint by plac-ing the cursor on the location desired on the electronic chart display then pushing the left mouse button. After entering a waypoint, edit Name, Steering mode, Radius, Channel limit and Speed (Min, Max) as appropriate in the Plan Route dialog box. (Place the cursor on an item, spin the scrollwheel to change value then push the scrollwheel.) Do this for all waypoints on the route.
4. Use the Alarms page to define safety contour and other specified conditions for checking the route. Choose item from a list then click the Indication (to get a visual indication), Alarm (to get the audible alarm) or Ignore (to remove check item) button as appropriate.
5. Use the Check page to detect areas where the depth is less than the safety contour or where specified conditions exist. The ECDIS can examine the chart database against a planned route to make a list of alarms where a route crosses a safety contour or specified areas used in chart alarms. To create a list of alarms, click the Start button.
6. Use the Parameters page to enter Estimated Time of Departure (ETD) and Estimated Time of Arrival (ETA), if you are using Timetable optimizing. Choose desired optimizing mode from the Optimize window.
To print a waypoint report, place the cursor on the triangle to show the Plan Route menu, choose Report from the menu then push the scrollwheel. Click the Print Text button.
1.
2.
3.
4.
5.
6.
OK
Write name of the new Route Plan
15
Creating a user chart
To make a user chart, do the following:
1. Place the cursor on UChart in the status bar then click the Plan button. The Plan User Chart dialog box appears in the information area.
2. Place the cursor on the triangle in the dialog box, choose Create from the menu then push the scrollwheel. Enter a name for the user chart; spin the scrollwheel to choose character and push it to confirm character. Repeat to complete the name then click the OK button to finish.
3. Click the Line tab then check Enable changes. Use the scrollwheel to enter a name for the line in the Name field. Spin the scrollwheel in the Element type box to choose line type then push the scrollwheel. To start a new line from a new position, check "New start position". Check "Danger Line" if you want to use the line in chart alarm calculation. Use the cursor to specify the position for the line point then push the left mouse button.
4. Click the Symbol tab then check Enable changes. Click the Add button then Define Style (Symbol or Label), Name and Symbol character in case of symbol. "Display on radar" is auto-matically chosen; uncheck it if you do not want the symbol or label to appear on the radar. Check "Danger Symb" to use the symbol in chart alarm calculation. Use the cursor to choose position for symbol or label then push the left mouse button.
5. Click the Area tab then check Enable changes. To make a new area, click the Add button in the Area field. Define Name for area, define also if you want it to appear on the radar display (On Radar) and use it in chart alarms calculation (Danger Area). Use the cursor to choose position for points then push the left mouse button.
6. Click the Tidal tab then check Enable changes. To mark a tidal on the screen, use the mouse to locate the cursor then push the left mouse button. Define Name, Type, Orientation, Strength and Time for Tidal. The Tidal symbol is displayed only on the ECDIS display.
7. Click the Point tab then check Enable changes. Use cursor and left mouse button to define the location of points.
1. 2.
3. 4. 5. 6. 7.
Write name of the new User Chart
16
Creating a pilot data
To create a new pilot data, do the following:
1. Place the cursor on PilotData in the status bar then click the Plan button to show the Plan Pilot Data dialog box. If you have not already chosen pilot data, the plan Pilot Data menu also appears. If the menu is not displayed, click the triangle mark in the dialog box. Choose Create from the menu then push the scrollwheel.
2. Enter a name for the user chart, spinning the scrollwheel to choose character and pushing the scrollwheel to confirm. Repeat to complete the name then click the OK button to finish.
3. In the Edit Record page of the Plan Pilot Data dialog box, check "Enable changes". Roll the trackball to place the cursor on the location desired for pilot data then push the left mouse but-ton. In the Range box, enter the range from own vessel at which to activate the pilot data. To show a text message on the screen, enter desired message in the Description window; spin the scrollwheel to choose character and push the scrollwheel to confirm.
3.1.
2.
17
Own Ship and ARPA Targets
Own ship and ARPA targets
Position of own ship on chart display areaThe functions below are accessed with the mouse.
TM Reset: Puts the vessel at the position of automatic TM Reset margin. (Note that this function may also be accessed from the keyboard with the CU/TM R key.)
ShipOffcenter: Puts the vessel at the position of the cursor.
Ship Center: Puts the vessel at the screen center.
Chart motionYou can use either true motion or relative motion. In true motion your own ship moves until it reaches the true motion reset boundary. Then it will jump back to an opposite position on screen based on vessel's course. In relative motion own ship stays in a fixed position while the chart un-der it moves on screen.
If you use true motion and access ShipOffcenter, your ship will go to cursor position on screen and continue true motion movement from that position. When it reaches the true motion reset bound-ary it will automatically jump to true motion reset position.
If you use relative motion and access TM Reset, your ship immediately jumps to the true motion reset position and that position is used to fix position on the screen.
With relative motion, you can select a new fixed position for own ship by choosing the location with the cursor and accessing the ShipOffcenter function with the mouse.
To select desired display mode, place the cursor at the location circled below, spin the scroll-wheel to choose desired mode then push the scrollwheel to confirm.
NorthUp TM ECDIS only Route 00 UChart
18
Own ship symbolThe vessel position is indicated by a circle, the center of the circle corresponding to the conning position.
With a large scale, the vessel is indicated as a true scale symbol, when the size of the symbol is larger than 6 mm.
• Vessel heading (Gyro) is shown by a solid line over the chart.• Vessel ground speed (SOG) and ground course (COG) are shown by a vector which starts at
the conning position.
ARPA target symbolThe ARPA target symbol is shown below.
• A dangerous ARPA target is displayed as a blinking target symbol, in colors of green and red alternately. The ECDIS has its own definition for dangerous target limits (CPA, TCPA).
• A lost ARPA target is displayed as a blinking target symbol, in colors of green and dark yellow alternately.
Own ship symbol on small chart scale Own ship symbol on large chart scale
19
Vectors of own ship and ARPA targetsTarget vectors can be displayed relative to own ship's heading (RelVect) or with reference to the North (TrueVect). Both presentation modes can be used with relative motion (RM) or true motion (TM) of own ship display mode.
Vector time (or the length of vectors) and presentation mode can be set at the location shown in the figure below. Place the cursor on the time figure of True(Rel) Vect, spin the scrollwheel to choose setting then push the scrollwheel.
Presentation of true vector (TrueVect) Presentation of relative vector (RelVect)
Vector mode
2071 ARPA radarsource change
TrueVect(G) 12 minPastPosnTrue 2 minCPA Off
20
Own ship past track1. Open the Chart Display dialog box with the mouse.2. Click an arrow tab in the dialog box to open the Tracking page.3. In the Past Tracks window, the first panel below this title refers to own ship. Use the cursor
and select button to activate desired settings.Off Tracking information is switched off.
Std Tracking information is switched on.
Other Tracking information is switched on until the Standard Display feature is activat-ed, with the mouse or the STD DSP key on the keyboard.
Length Adjust the length of track history.
Labels Specify the interval between dots on the history track.
ARPA targets past trackOpen the Targets page following steps 1-3 above. Set up the ARPA target related items as fol-lows:
ARPA targets Tracking information of ARPA target is displayed.
Off Tracking information is switched off.
Std Tracking information is switched on.
Other Tracking information is switched on until the Standard Display feature is activat-ed, with the mouse or the STD DSP key on the keyboard.
Length Adjust the length of track history.
Labels Specify the interval between dots on the history track.
AIS targetsAIS targets Tracking information of AIS target is displayed.
Off Tracking information is switched off.
Std Tracking information is switched on.
Other Tracking information is switched on until the Standard Display feature is activat-ed, with the mouse or the STD DSP key on the keyboard.
Max.(count) Set the maximum number of AIS targets to display within the range selected.
Max.(range) Set the maximum range for which to show AIS targets.
Filter Sort AIS targets by Range, CPA, or TCPA.
21
Charts, Datums and Alarms
ChartsChart typesThe user can select between two different chart types: ARCS raster chart or S57 (ENC) vector chart.
To select desired chart material, do the following:
1. Spin the scrollwheel to show Menu/Info/Chart Menu in the mouse functions area and right-click to show the Chart menu.
2. Choose Activate ARCS chart or Activate S57 chart, whichever is shown, then push the scroll-wheel.
3. In the sub menu, Sync Scale is used to open a different of chart with the same scale, and Ignore Scale is used to open a different type of chart with the scale previously used.
Browsing around your chartsYou may view S57 charts using different positions and different scales. The basic tools for brows-ing charts are Range -, Range+, Set Chart Center, ShipOffcenter and TM Reset.
Set Chart Center allows you to look ahead from a place other than own ship's current position. Choose Set Chart Center from the Main menu to display the dialog box shown below. Use the scrollwheel to set the latitude and longitude position for chart center then click the Set Center but-ton.
Note: The chart can also be centered (with less precise positioning) by placing the cursor at de-sired location, displaying Set Chart Center/Info/Activate Scroll in the dialog box and pushing the left mouse button.)
To turn off automatic true motion reset, display and click TM Reset (in the guidance area). When true motion reset is off, the indication "Ship off screen" appears in the information area.
To restore own ship's position to the screen center, display TM Reset/Info/ShipCenter in the mouse functions area then push the right mouse button.
Range - and Range+ change the chart scale. If true motion reset is active, ZOOM IN and ZOOM OUT keep the relative position of your ship with respect to the display. If true motion reset is on, ZOOM IN and ZOOM OUT keep the relative position pointed by the cursor with respect to the dis-play.
The system automatically chooses next larger or smaller scale. If a chart with larger compilation scale available at your current viewing position, the message "Larger Scale Data Exists" appears.
22
Presentation of ARCS materialARCS charts are facsimile copies of BA paper charts, and as such share a common numbering system and the raster images are identical to the paper ones.
Presentation of S57 chartsYou can familiarize yourself with the symbols used on S57 charts by browsing the IHO ECDIS Demo Chart 1, which is included in this ECDIS. Note that it behaves as any S57 chart and it follows your selections.
To open the IHO ECDIS Chart 1 on display, do the following:
1. Spin the scrollwheel to show Menu/Info/Chart Menu in the mouse functions area then push the right mouse button.
2. Roll the wheel to choose ECDIS Chart 1 from the menu then push the scrollwheel. The menu shown right appears.
3. Spin the scrollwheel to choose desired item then push the scrollwheel.
Display BaseA subset of chart features is called a Display Base. As required by IMO, these features cannot be made invisible under any user selection. The Display Base consist of the following chart features:
• Coastline (high water)• Own ship's safety contour, which is selected by the user.• Indication of isolated underwater dangers of depths less than the safety contour, which lie
within the safe waters defined by the safety contour.• Indication of isolated dangers, which lie within the safe water defined by the safety contour
such as bridges, overhead wires, etc., and including buoys and beacons whether or not these are being used as aids to navigation.
• Traffic routine systems• Scale, range, orientation and display mode• Units of depth and height
Obstructions,Seabeds, Pipelines
Lights, services,radar, small craft
Mariner'ssymbols
Color differentiationdiagram
23
Control of visible chart featuresVisibility of chart features which are not included in the Display Base can be controlled on the Standard, Other 1 and Other 2 pages in the Chart Display dialog box. You can turn chart features on or off from these pages.
The Standard page includes chart features which IMO has defined to be displayed as the Stan-dard Display. (These options will be displayed when the Standard Display feature is accessed, with the mouse or with the STD DSP key on the keyboard.
The Other 1 and Other 2 pages contain additional chart features. This information is turned off when the standard display is activated.
*ALL-ON *ALL-ON *ALL-ON
24
Control of visible navigation featuresVisibility control of the navigation features is divided into three pages:
• The Route page controls planned and monitored routes.• The Tracking page controls past tracks and some other features.• The Mariner page controls pilot data, user charts and chart alarms.To access these pages, choose Chart Display in the mouse functions area. Click the arrow tab in the dialog box (or NEXT key on the keyboard) to choose page desired.
"Std" and "Oth" turn on chosen item. When the standard display is activated, items selected to Oth are turned off.
Chart datumChart datum of S57The datum used in S57 charts is always WGS-84.
Chart datum of ARCSThe difference between ARCS chart local datum and WGS84 datum is known as WGS84 Shift. For most of the ARCS charts this is known and the system can do the conversion automatically. For some ARCS charts, however, this is unknown and the user must define the shift. For some ARCS charts this is partially known and the user defines the shift for the unknown areas of partially known ARCS charts. For details see section 9.2.1 "Difference between ARCS chart local datum and positions in WGS-84 datum" in the Operator's Manual.
See also ARCS Navigator User Guide. The chapter "Use with GPS" discusses datum.
ECDIS datumIf you use paper charts together with electronic chart material, it is recommended that you use the same datum as your current paper chart to avoid misalignment between your electronic system and points taken or plotted on your current paper chart. This selection of the datum does not change anything inside the ECDIS for navigation calculation processes or for electronic sea chart display processes. However, it changes the numerical values of positions displayed on the ECDIS screen into the user-selected datum.
Associa
*ALL-ON *ALL-ON *ALL-ON
25
AlarmsThere are three kinds of alarms generated by ECDIS or Trackpilot processors. To see a list of the alarms, see the chapter on alarms in the Operator's Manual.
Alarms generated by navigation calculationNavigation calculation generates the following alarms:
• Error detected in any sensor• Radar communication error• Software alarms, etc.
Alarms generated by chart calculationChart calculation generates the following alarms:
• New pilot data notebook page available• Chart alarms based on S57 charts• Chart alarms based on user chart's dangerous symbols, lines and areas
Alarms generated by steering calculationNote that all steering-related functions are available only if the ECDIS processor is also connected to the Trackpilot processor. Some of the alarms such as Outside Channel limit are also available without the optional Trackpilot processor. Without the Trackpilot processor, all alarms generated by steering calculation appear in the same alarm queue as alarms generated by navigation calcu-lation.
Description of the alarm priority systemThe permanently visible alarm is the top most urgent alarm at any moment. Alarms have priority from 1 to 10 to control urgency. Priority 1 is the highest. The list of alarms in the Operator’s Manual shows these priorities for each alarm with following syntax: "/1" at the end first line means priority = 1, "/1/8" at the end of first line means that priority is = 1, if unacknowledged and priority = 8, if acknowledged but the state of alarm still exists. An unacknowledged alarm is shown in black text (or white depending on color scheme) on a red background and an acknowledged alarm which still exists is shown in orange text on a white background.
You may view the alarms in the Alarm Queue. Place the cursor on the alarm text then push the right mouse button. See the example below.
How to read the Alarm Queue (first row as an ex-ample):
• First digit "2" indicates alarm priority.• Second four digits "5100" indicate alarm number.• Text indicates reason of alarm "Safety contour".The first example shows how alarm 2001 changes its priority from 1 to 8 after it is acknowledged. Then, alarm 5100 becomes the most urgent out of the re-maining alarms.
The second example shows how the priority of alarm 5100 is changed to 10 after it is acknowl-edged. Then, alarm 5103 becomes the most urgent alarm out of the remaining alarms.
26
Updating Charts
ARCS chartsThe chart updates are delivered separately in an update CD-ROM. To update ARCS format raster chart in the system, you have three choices, update by permit, update by active group or update manually. The procedure below shows how to update by permit.
For detailed information, see paragraph 9.4.9 "Updating ARCS charts" in the Operator's Manual.
1. Spin the scrollwheel to display Menu/Info/Chart Menu in the mouse functions area then push the right mouse button.
2. Choose Update Charts from the menu and By Permits from the sub menu.
3. Insert Update CD-ROM in the drive then click the Load button. The system will automatically update charts for which you have a permit.
Go BackBy PermitsBy GroupManual
Reset Set
27
S57 chartsDate dependencyIf you currently use a chart which has Display Until and/or Approved Until dates (set in the Set Chart viewing dates in the Chart menu) that are more than 1 week from the current system date, a permanent warning appears on your chart display.
To remove this warning, set "Approve Until" and/or "Display until" as the current system date. For how to set theses dates, see paragraph 8.12.3 "Setting "display until date" and paragraph 8.12.4 "Setting "approve until" date in the Operator's Manual.
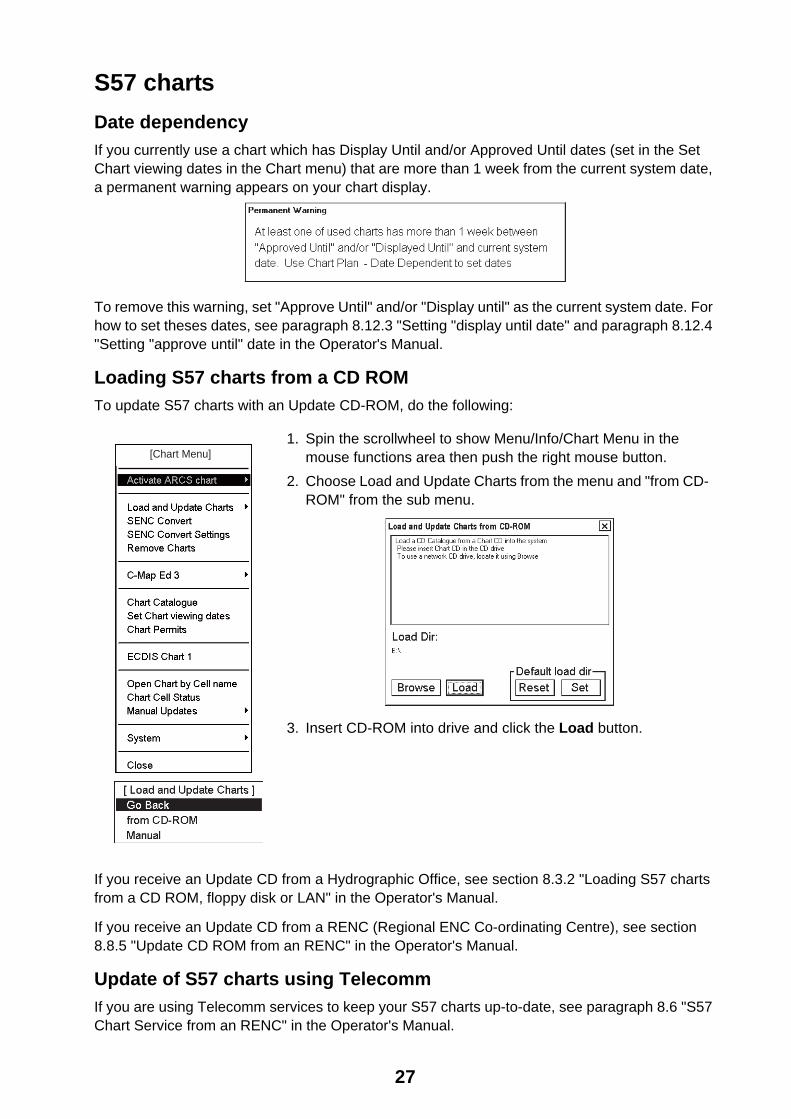
Loading S57 charts from a CD ROMTo update S57 charts with an Update CD-ROM, do the following:
If you receive an Update CD from a Hydrographic Office, see section 8.3.2 "Loading S57 charts from a CD ROM, floppy disk or LAN" in the Operator's Manual.
If you receive an Update CD from a RENC (Regional ENC Co-ordinating Centre), see section 8.8.5 "Update CD ROM from an RENC" in the Operator's Manual.
Update of S57 charts using TelecommIf you are using Telecomm services to keep your S57 charts up-to-date, see paragraph 8.6 "S57 Chart Service from an RENC" in the Operator's Manual.
1. Spin the scrollwheel to show Menu/Info/Chart Menu in the mouse functions area then push the right mouse button.
2. Choose Load and Update Charts from the menu and "from CD- ROM" from the sub menu.
3. Insert CD-ROM into drive and click the Load button.
[Chart Menu]
The paper used in this manualis elemental chlorine free.


![FURUNO ECDIS TYPE SPECIFIC TRAINING COURSE …Z:\FEBO\INSTC - N-drev\INSTC CERTIFIED + STCW\TST FEA\TST FEA 06.50 [Out of house]\05 Trainee's Manual \FEA FETSTC Trainee's Course Manual](https://static.documents.pub/doc/80x56/5ed7104b62136e72fb7bc484/furuno-ecdis-type-specific-training-course-zfeboinstc-n-drevinstc-certified.jpg)


