Feasibility and Impacts of Domestic Content Requirements for U.S. Oil and Gas Pipelines May 16, 2017 Submitted to: American Petroleum Institute, Interstate Natural Gas Association of America, Association of Oil Pipe Lines, American Gas Association, & GPA Midstream Association Submitted by: ICF 9300 Lee Highway Fairfax VA
Transcript
Feasibility and Impacts of Domestic Content Requirements for U.S. Oil and Gas Pipelines
May 16, 2017
Submitted to:
American Petroleum Institute, Interstate Natural Gas Association of America, Association of Oil Pipe Lines, American Gas Association, & GPA Midstream Association
Submitted by: ICF 9300 Lee Highway Fairfax VA
Domestic Content Requirements for Pipelines
2
May 16, 2017
Table of Contents 1. Executive Summary ........................................................................................................................ 8
3.1 Domestic Line Pipe Manufacturers and Production Capacity ......................................... 36
3.2 Domestic High Strength Steel Plate and Plate Coil Manufacturers and Their Production Capacity ...................................................................................................................................... 42
3.3 Recent Demand for Line Pipe by Diameter Size Class .................................................. 47
3.4 Recent Demand for OCTG .............................................................................................. 52
3.5 History of International Trade of Line Pipe and OCTG ................................................... 53
3.6 History of International Trade of High Strength Cut-to-length Plate and Plate Coil Imports ........................................................................................................................................ 64
3.7 Imports and Domestic Production of Alloying Agents ..................................................... 69
3.8 Expected Future Demand for Steel Line Pipe and Comparison to Domestic Capacity .. 70
3.9 Limitations of Domestic Line Pipe Manufacturers Given Current Buyer Requirements . 73
3.10 Investment that would be Needed for Domestic Steel Manufacturers to meet Current Buyer Requirements ................................................................................................................... 77
3.11 Considerations Related to Line Pipe Distributors ............................................................ 78
3.12 Considerations Related to Line Pipe Procurement Practices ......................................... 78
3.13 Competition in Line Pipe Markets with and without Imports ........................................... 79
3.14 Competition in High Strength Cut-to-length Plate and Plate Coil Markets with and without Imports ........................................................................................................................... 87
3.15 Markets for Fittings Used for Gathering, Pipeline and Gas Distribution ......................... 90
3.16 Markets for Oil and Valves and Regulators Used for Gathering, Pipeline and Gas Distribution .................................................................................................................................. 93
3.17 Broader Context of U.S. Imports and Exports of All Steel Products ............................... 98
3.18 Illustration of Potential Cost Impacts for New Oil and Gas Pipelines ........................... 102
Exhibit 3-41: International Trade in Industrial Valves .................................................... 97
Exhibit 3-42: ASM U.S. International Trade Data Valve Comparison ............................ 98
Exhibit 3-43 Overall Steel Trade with Countries Exporting Line Pipe and Related
Materials to U.S. .......................................................................................................... 100
Exhibit 3-44: Illustration of Impact on Total Costs for New Pipelines (based on long-run
price increase of 25% for line pipe, fittings, and valves) .............................................. 104
Exhibit 3-45: Details of Costs Related to Line Pipe Materials and Transportation (these
are components in “Line Pipe” row in prior table) ........................................................ 105
Exhibit 3-46: Historic Swings in Line Pipe Prices 2010 to 2016 .................................. 106
Exhibit 3-47: Illustration of Transition Time (period when scarcity pricing leads to prices
above cost of production) ............................................................................................ 107
Domestic Content Requirements for Pipelines
6
May 16, 2017
Definitions & Acronyms
BOF Basic oxygen furnace (used to make steel)
CTL Cut to length. Used to refer to steel plate (usually thick plate) that is
sold in flat plates as opposed to rolled coils.
DSAW Double submerged arc weld
EAF Electric arc furnace (used to make steel from largely recycled
materials)
ERW Electric resistance weld
FTC Federal Trade Commission
Heavy wall Line pipe with walls over 0.75 inches thick
HHI Herfindahl-Hirschman Index
HRC Hot rolled coil (refers to both plate coil and sheet coil)
HSAW Helical (spiral) submerged arc weld
HTS Harmonized Tariff System (a system to categorize
imported/exported products used by the U.S. and many other
countries)
JCO or JCOE Method of forming line pipe into shape of "J" then "C" then "O"
followed by Expansion
LSAW Longitudinal submerged arc weld
OD Outside diameter
psi Pounds per square inch
SAW Submerged arc weld
SAWH Helical (spiral) submerged arc weld
SAWL Longitudinal submerged arc weld
Domestic Content Requirements for Pipelines
7
May 16, 2017
UOE Method of forming line pipe into shape of "U" then "O" followed by
Expansion
X70 Specification used for line pipe indicating a specified minimum yield
strength of 70,000 psi
Domestic Content Requirements for Pipelines
8
May 16, 2017
1. Executive Summary
1.1 Background
This report was prepared by ICF at the request of the American Petroleum Institute,
Interstate Natural Gas Association of America, Association of Oil Pipe Lines, American
Gas Association, and GPA Midstream Association to provide information to the
Department of Commerce and other interested parties on the feasibility and economic
impacts of policies and other actions that might be implemented by the Federal
government to require that the repair and construction of oil and gas pipelines
exclusively use materials and equipment produced in the U.S. Specifically, line pipe,
fittings, and valves for all kinds of oil, gas and other pipelines would have to be
manufactured in the U.S. using steel and other materials that are made in the U.S. The
purpose of the information provided here is to help inform the Department of Commerce
and other parts of the Administration on the practical considerations they may wish to
address as they consider next steps.
1.2 ICF’s Scope of Work and Methodology
ICF was asked to look at the recent historical markets for line pipe, fittings, and valves
and to determine how much of these markets were supplied by domestic versus foreign
suppliers. ICF was also asked to determine how much domestic suppliers relied on
imported intermediate goods (that is, parts and materials used to make the final
products) for their production of line pipe, fittings and valves. ICF also looked at the
production capacity of the domestic industry and how that capacity compared to the
expected near-term level of demand for line pipe, fittings, and valves. In this comparison
ICF was asked to identify any “choke points” or “constraints” where U.S. producers
lacked the capability or volume capacity to meet the expected demands. ICF was also
asked to estimate the possible price increases that the products and materials covered
by these proposed policies might experience and how much such price increases would
affect the overall cost of new oil and gas pipelines.
To address these issues, ICF collected and analyzed data from multiple sources
including international trade data maintained by the Federal Government, commercial
publications that track the markets for line pipe and other tubular goods, government
and commercial data bases on the steel industry, and data provided through a written
survey and individual interviews by members of the sponsoring associations including
pipeline operators, integrated steel mills/pipe mills manufacturers, line pipe and pipeline
equipment distributors, and equipment manufacturers in the U.S.
Domestic Content Requirements for Pipelines
9
May 16, 2017
1.3 Summary of Key Findings
The overarching finding in this report is that U.S. pipeline construction and repair
activity relies heavily on imported finished goods and imported parts and
intermediate materials used for domestic manufacturing of line pipe, fittings, and
valves. In recent years approximately 77% of the steel used in line pipe was imported in
the form of finished line pipe (53%), cut-to-length plate and plate coil (19%) used to
make line pipe in the U.S. or as steel slabs (5%) used to make cut-to-length plate and
plate coil that then was made into line pipe. (See Exhibit 1-1) In that same time
approximately 40% of the parts used to make high-pressure valves in the U.S. came
from overseas. Also approximately 42% of the market value for finished steel pipeline
fittings came from imports as did a substantial fraction of the steel cylinders and other
semi-finished steel products used to make pipeline fittings in the U.S.
Exhibit 1-1: Contribution of Imported Finished and Intermediate Steel Products Used to Construct Pipelines
Product Value of Market
2015-2016 ($billion)
Market Share of Imported Finished
Products
Contribution of Imported Intermediate Goods
Line Pipe $3.40 to $5.82 billion 53%
~52% of domestic line pipe is made from foreign cut-to-length
plate and plate coil (or from domestic plate that is made from
foreign slabs)
Valves $1.29 to $1.73 billion 16% ~40% of parts are imported
Fittings $0.27 to $0.46 billion 42% use of imported steel is significant
Line pipe and other materials used to build new pipelines and to expand and repair
existing pipelines must comply with established, transparent standards and
specifications established by API, ASTM, ASME and other industry groups and
government agencies. The standards require high-level technical knowhow and very
sophisticated manufacturing processes and equipment. There is limited ability to
substitute other materials and products to construct and repair pipelines and so the
breaking of the extensive existing international supply chains for line pipe, fitting and
valves will be very disruptive to pipeline operators until those supply chains can be
rebuilt in a new form that would comply with domestic content requirements.
Because of this lack of substitutes, heavy reliance on imported goods and materials, the
long lead time required for many items, and the fact that several of these items are not
made in the U.S currently, an immediate implementation of stringent domestic content
requirement for line pipe, fittings, and valves would mean that most oil and gas
pipeline construction projects would be delayed or stalled.
Domestic Content Requirements for Pipelines
10
May 16, 2017
The economic impact of such an action would be the loss of American jobs as some
75% of current pipeline construction expenditures are U.S. value added, meaning
these expenditures end up in the pockets of American workers and business owners.
(The line pipe, valves and fittings themselves now represent only about 11% of the total
cost of a new large diameter pipeline project.) Other adverse economic impacts would
be the economic costs of delayed or cancelled pipeline projects (measured as lost
profits for shut-in oil and gas production and higher costs to consumers) and potentially
service disruptions if repairs and replacements of existing line pipe are unable to be
made as needed.
Findings Related to Line Pipe
The nominal production capacity of U.S. line pipe manufacturers exceeds
anticipated near-term demand levels of 3.1 to 3.4 million metric tons per year
including exports. The limiting factor for domestic line pipe production does not
stem from the total production capacity but rather from constraints related to
specific kinds of line pipe required by U.S. pipeline owners and current gaps in
production and testing capabilities of domestic line pipe manufactures and their
supply of cut-to-length plate and plate coil made from U.S. melt.
The existence of such constraints has been acknowledged by the American Line
Pipe Producers Association in comments to the Department of Commerce
related to what it calls “niche” markets that domestic producer cannot now serve.
While such constraints are indeed related to a small portion or “a niche” of the
thousands of different steel products made in the U.S., those constrained
products do represent a very large and critical portion of the materials used to
construct modern pipelines.
The constraints on domestic line pipe manufacturers’ ability to immediately meet
all U.S. line pipe demand include:
Lack of current capacity to make pipe of certain dimensions, most
importantly large diameter pipe with thick walls,
Lack of capacity to meet certain quality specifications (low tolerances for
variations in chemical composition and physical dimensions and the ability
to perform and pass certain quality control tests), and
Difficulty in making or obtaining certain kinds of domestically melted hot
rolled plate coil or cut-to-length plate from which the line pipe is made.
Given sufficient investments by the steel industry, these kinds of constraints can
be eliminated over time. However, the willingness of the steel industry to make
the needed investments may be influenced by concerns related to:
Domestic Content Requirements for Pipelines
11
May 16, 2017
The relatively small part of the steel market (approximately 3%) made up
of line pipe consumption.1
The cyclical nature of the oil and gas production and pipeline industries
which means that steel production from any new manufacturing capacity
will vary substantially from year to year, making timely cost recovery less
certain.
The inherent uncertainty regarding the long-term legal and political viability
of any proposed domestic content requirements, which adds another risk
to anticipated returns on new steel manufacturing investments.
Given these concerns, domestic manufacturers of line pipe, cut-to-length plate
and plate coils may delay needed investments and/or demand much higher
prices to pay back those investments quickly.
In addition to creating these supply constraints among certain types and quality
of line pipe, limiting the importation of line pipe, the cut-to-length plates and plate
coils from which line pipe is made and the slabs from which cut-to-length plates
and plate coils are rolled would substantially reduce supply volumes available to
the market. (See Exhibit 1-2.) Import restrictions also increase industrial
concentration (as measured by the Herfindahl-Hirschman Index or HHI) in
portions of the domestic markets for finished line pipe and the related
intermediate goods of high strength cut-to-length plates and plate coils.
Exhibit 1-2: How Import Restrictions Would Impact Market Competition
Market or Submarket Loss of Inframarginal Supplies Increase in Market Concentration Index (HHI)
Line Pipe 0-16" -74% +290
Line Pipe 16.1-24" -56% +88
Line Pipe >24" -30% +478
Cut-to-length Plate (used to make line pipe)
-51% to -64% +1,644 to +3,420
Plate Coils (used to make line pipe)
-34% to - 44% +695 to +1,174
Valves more than -15% not computed
Fittings more than -42% not computed
1 Line pipe supplied in the U.S. measured in million metric tons per year was 4.6 in 2015, 2.6 in 2016, and
is expected to average between 3.1 and 3.4 over the next five years. Apparent steel consumption in the U.S. in 2015 was approximately 110 million metric tons according to the USGS steel market report.
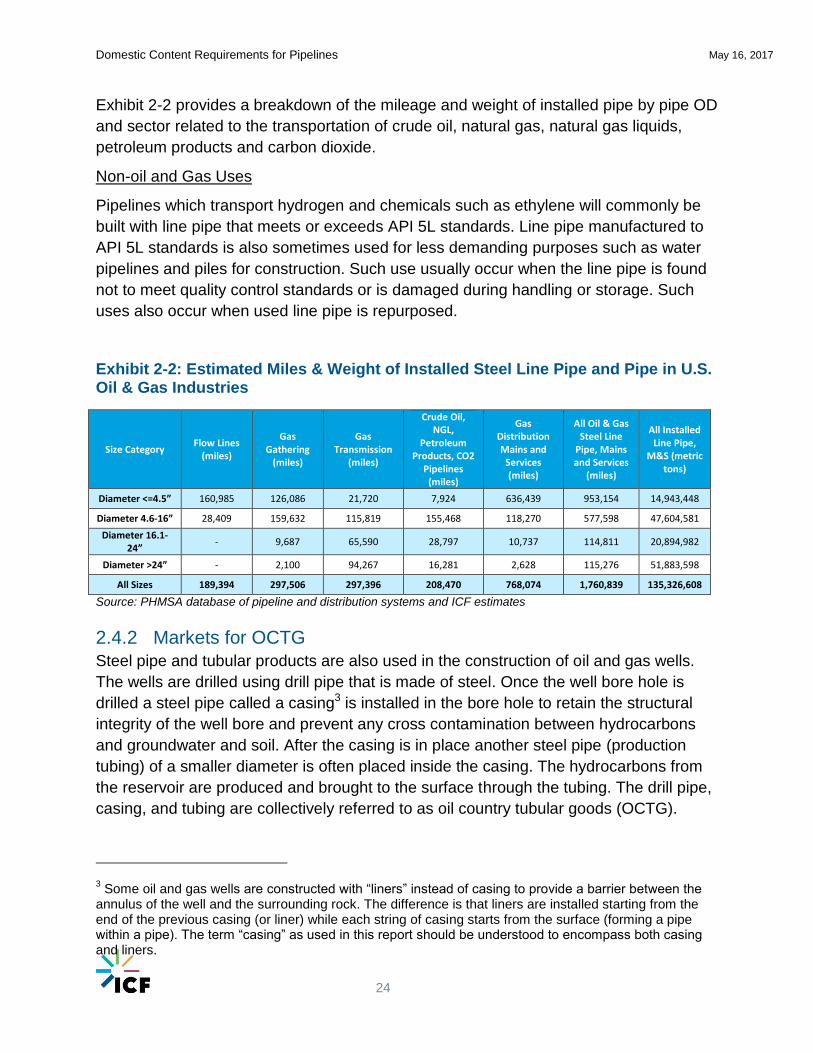
All Sizes 189,394 297,506 297,396 208,470 768,074 1,760,839 135,326,608
Source: PHMSA database of pipeline and distribution systems and ICF estimates
2.4.2 Markets for OCTG
Steel pipe and tubular products are also used in the construction of oil and gas wells.
The wells are drilled using drill pipe that is made of steel. Once the well bore hole is
drilled a steel pipe called a casing3 is installed in the bore hole to retain the structural
integrity of the well bore and prevent any cross contamination between hydrocarbons
and groundwater and soil. After the casing is in place another steel pipe (production
tubing) of a smaller diameter is often placed inside the casing. The hydrocarbons from
the reservoir are produced and brought to the surface through the tubing. The drill pipe,
casing, and tubing are collectively referred to as oil country tubular goods (OCTG).
3 Some oil and gas wells are constructed with “liners” instead of casing to provide a barrier between the
annulus of the well and the surrounding rock. The difference is that liners are installed starting from the end of the previous casing (or liner) while each string of casing starts from the surface (forming a pipe within a pipe). The term “casing” as used in this report should be understood to encompass both casing and liners.
Domestic Content Requirements for Pipelines
25
May 16, 2017
Because OCTG needs to withstand high pressures and a corrosive mix of
hydrocarbons, water, and carbon dioxide they are often made from alloy steels. In
instances where there is a significant amount of hydrogen sulfide the OCTG might be
made of stainless steel. OCTG steel pipe is most commonly made following the API
5CT and API 5CRA standards. An oil and gas well can be anywhere between 600 to
25,000 or more feet deep and hence uses a significant amount of steel for construction.
2.4.3 How Line Pipe and OCTG are Made
Line pipe and OCTG are primarily of two different types – seamless and welded.
Seamless pipe is often made using round cross section steel forms (called rounds) or
square billets that are rolled into a round shape. (See Exhibit 2-3.) These billets are
heated to a temperature where they are malleable. A mandrel with a pierce or a plug is
pushed through the center of the billet as it is being rolled to form a hollow in the center,
which results in the pipe shape. The pipe is then sent through several rolling mills to
stretch and straighten it. Finally, the pipe is heated again and cooled at a predetermined
rate so as to relieve the stresses created during the rolling process and obtain the
desirable steel grain structure, hardness and strength.
Exhibit 2-3: Seamless Line Pipe and OCTG Manufacturing
Welded pipe is classified into several categories based on how it is formed and the
type of welding technique used. There are five commonly used shaping techniques:
(See Exhibit 2-4.)
Form rollers: Smaller diameter line pipe of 24 inches and less is usually formed
by passing a continuous steel plate coil through sequential forming rollers that
gradually turn the flat plate into a cylindrical shape. The cylinder is then cut to
form individual pipe “joints” of 40 to 80 feet in length.
Domestic Content Requirements for Pipelines
26
May 16, 2017
U-O-E forming – In this shaping technique a flat plate or coil that is first bent into
a U shape using hydraulic presses that pushes down on the center of the plate or
coil along the length. This U shaped plate is then formed into an O shape by
using hydraulic pressure in a die that forces the two open end edges of the U
closer together. The two edges of the O are then welded together to form a pipe.
This pipe is then expanded (referring to the E in the U-O-E) using a mechanical
mandrel or hydraulic pressure. This step allows for the final shaping and sizing of
the pipe. The pipe is then heat treated to relieve stresses.
J-C-O forming – In this shaping technique a flat plate that is bent by a three
point bending process with a die on longitudinal side by first shaping into a J then
C and finally O. The two edges of the O are then welded together to form a pipe.
This pipe is then expanded using a mechanical mandrel or hydraulic pressure.
This step allows for the final shaping and sizing of the pipe.
Pyramid rolling – In this rolling technique three rollers are placed in a pyramidal
arrangement where one roller on the top center pushes down on the center of the
plate along the length as it is rolled by the two bottom rollers. Successive rolling
motions along the width with a vertical pressure at the center result in a hollow
pipe structure that is welded along the open edges. This pipe is then expanded
using a mechanical mandrel or hydraulic pressure. This step allows for the final
shaping and sizing of the pipe.
Spiral rolling – In this rolling technique a continuous coil (also known as skelp)
is bent into a pipe such that the edge along the length of the coil forms a helical
pattern along the length of the pipe. These helical edges are welded to produce
spiral pipe. This pipe is then expanded using a mechanical mandrel or hydraulic
pressure. This step allows for the final shaping and sizing of the pipe.
There are two commonly used welding techniques – electric resistance welding
(ERW) and submerged arc welding (SAW):
Electric resistance welding – In ERW an electrode may be used to generate an
electric arc (or high frequency electromagnetic energy can be used to induce
electricity flow) to locally heat the two metal edges that need to be joined such
that they melt and fuse together. An inert gas is often used to shield the arc as it
impinges on the metal to avoid contamination of the weld joint. Today ERW is
mostly done in the form of high frequency welding (HFW) without electrodes and
is used primarily to make longitudinal welds in form roller manufacturing of line
pipe of 24 inch diameters and below. This is also the type of welding
predominantly used in making welded OCTG.
Domestic Content Requirements for Pipelines
27
May 16, 2017
Exhibit 2-4: Welded Line Pipe Manufacturing Methods
Submerged arc welding – In SAW a consumable wire electrode is used to
generate an arc between the joint and the electrode. The wire melts and fuses
with the metal joint to provide a welded joint. A flux is deposited ahead of the
electrode along the joint to shield the arc and weld from contamination and in
some cases to deposit alloying metals into the weld. Some of the flux melts as
the weld progresses and is removed as slag and the remaining flux is recycled. A
SAW may be performed on both sides of the joint and is referred to as double
SAW or DSAW. The SAW process can be used on both longitudinal welds
(LSAW or SAWL) as in the case of U-O-E, J-C-O or pyramid processes or spiral/
helical welds (SSAW, HSAW or SAWH).
The width of the plate of coil needed for pipe making depends on the type of shaping
process being used. For U-O-E, J-C-O and pyramid rolling that perform a single
longitudinal weld the width can be calculated as the diameter multiplied by pi (since the
circumference is pi multiplied by the diameter). For the spiral pipe making process the
width can be calculated as diameter multiplied by a thumb rule factor of 2.0 to 2.2.
Exhibit 2-5 provides a listing of the various widths of plate or coil needed to make the
various diameters of pipe typically used in the oil and gas industry. This is an important
because many domestic cut-to-length plate and plate coil rollers have maximum width
limits that are narrower than what is needed for large diameter line pipe and this is one
reason (along with thickness limits, rolling ratio limits and quality concerns) that cause
U.S. line pipe manufactures to procure over half of their cut-to length plate and plate coil
needs from foreign sources.
Domestic Content Requirements for Pipelines
28
May 16, 2017
Exhibit 2-5: Cut-to-length Plate and Plate Coil Widths Required for Different Line Pipe Diameters
Line Pipe Diameter (inches)
Required Plate/Coil Width for Single Longitudinal
Weld (inches)
Required Coil Width Helical Weld (inches)
4.5 14.1 9.5
10 31.4 21.0
12 37.7 25.2
14 44.0 29.4
16 50.3 33.6
18 56.5 37.8
20 62.8 42.0
22 69.1 46.2
24 75.4 50.4
26 81.7 54.6
28 88.0 58.8
30 94.2 63.0
32 100.5 67.2
34 106.8 71.4
36 113.1 75.6
38 119.4 79.8
40 125.7 84.0
Pipeline Coatings
Steel pipelines are coated on their outside surfaces to prevent corrosion and protect the
line pipe from abrasion damage. Pipeline interiors are also sometimes coated for similar
purposes and to provide a smooth surface that offers less resistance to flowing fluids as
compare to bare steel. Imported line pipe is almost always brought into the country bare
to prevent damage to the coating during shipment and to facilitate inspection upon
receipt.
There are many different types of coating services, all of which begin by cleaning the
line pipe using sand or other blasted abrasives. The most common coating now applied
to oil and gas line pipe is fusion bonded epoxy (FBE) which uses a powdered coating
that is bonded to the line pipe with the application of heat. FBE can be enhanced by
application of an abrasion resistant overlay (ARO) which is one or more additional outer
layers of hard, mechanically strong coating or material. In the factory application of the
coating, the ends of line pipe joints are left bare for welding purposes. A separate field
coating process covers the joint ends after they are welded together.
Domestic Content Requirements for Pipelines
29
May 16, 2017
Since almost all coating is done domestically, there is no issue with any current
dependence on foreign coating services. Also, during ICF’s survey of association
remembers, no issues were raised with regard to imported coatings materials not being
available from U.S. suppliers.
2.4.4 How High Strength Steel Cut-to-length Plate and Plate Coils are
Made
High strength steel plates and coil are made primarily from steel slabs that are typically
produced through continuous casting of molten steel. To make plate or coil the steel
slabs are heated above the recrystallization temperature where they are malleable.
(See Exhibit 2-6) They are then run through a series of roughing and finishing rolling
mills where the thickness is reduced and the length and width is increased to the
desired dimensions. The surface finish is also controlled by removing oxides from the
surface through high pressure water jet impingement and controlled cooling of the steel
along the rolling process. The grain structure and uniform distribution of alloying
elements (molybdenum, manganese, etc.) are controlled through temperature
regulation throughout the rolling process. Slabs thickness can be reduced by one tenth
to one hundredth for making plates and coils. The reduction ratio also controls the grain
structure and thus steel strength as greater reduction ratios lead to stronger steels.
Process control on width reduction and width uniformity between rolling stages
influences the final quality of the product. Finally, testing equipment and methods used
online during rolling as well as post-manufacture determine the consistency in quality
within and across batches of products.
Exhibit 2-6: Steel Plate and Coil Manufacturing
2.4.5 How Steel is Made in the U.S.
There are two main types of steel making plants in the U.S. – integrated steel mills and
mini mills.
Domestic Content Requirements for Pipelines
30
May 16, 2017
Integrated Steel Mills
In an integrated steel, mill iron is converted into semi-finished or finished products. (See
Exhibit 2-7.) This includes the following activities;
Iron making – Iron ore, coke, and limestone are heated in a blast furnace where the
oxygen from the iron is remove and molten iron or pig iron is produced. This iron
contains more than 2% of carbon.
Steelmaking – In this step the carbon content of the iron is reduced below 2%. This is done by passing oxygen over molten iron in a basic oxygen furnace (BOF). Some amount of scrap steel (~30%) may also be added at the BOF stage. Steel is typically classified as low carbon (<0.3% carbon), medium carbon (0.3 – 0.45% carbon), high carbon (0.45 – 0.75% carbon), and very high carbon (0.75 – 1.5% carbon). Line pipe is usually made from low carbon steel and API 5L specification requires the carbon content to be 0.22 to 0.28% with tolerance bands depending on the manganese content. The molten steel is poured into molds (that is, “cast”) to form ingots (large blocks weighting several hundreds of kilograms), slabs (flat blocks with rectangular cross section), or other semi-finished shapes. (See Exhibit 2-8).
Exhibit 2-7: Integrated Steel Mill (showing only steps to initial semi-finished products)
Making of further semi-finished products – The slabs of steel are rolled into coils or plate
in rolling mills, as discussed previously.
Finished products – The coils and plates may be further processed to make finished
pipe and tube products, like line pipe and OCTG, and structural steels used in
construction and machine parts manufacturing.
Domestic Content Requirements for Pipelines
31
May 16, 2017
Exhibit 2-8: Semi-Finished Steel Products (indicating relative shapes and sizes)
Mini Mills
A steel mini mill produces steel products from recycled scrap metal. Unlike integrated
steel mills, which make new steel from iron ore in a blast furnace, mini mills melt and
refine scrap steel using electric arc furnaces (EAF) and turn that steel into semi-finished
and/ or finished steel products. (See Exhibit 2-9.) A mini mill consists of the EAF that
uses electricity to melt scrap steel and possibly direct reduced iron, or blast furnace
iron. Oxygen is impinged on the feed as it is being melted to remove the impurities,
including carbon. These impurities form slag that floats to the top of the molten steel.
The steel produced in EAF may then be sent to ladle furnaces to homogenize the steel
by bubbling inert gas (such as argon) and adjust the chemistry of the steel to remove
impurities such as sulfur and phosphorus as slag. In addition, the steel may be sent to a
vacuum degasser where hydrogen, nitrogen, and oxygen are extracted from the molten
metal under vacuum. The steel is then cast and follows the same pathway of semi-
finished and finished product manufacturing as what would be found at an integrated
steel mill.
Exhibit 2-9: Steel Mini-Mill (showing only steps to initial semi-finished products)
Domestic Content Requirements for Pipelines
32
May 16, 2017
2.5 Methodology for ICF Study
This section of the report discusses the sources of data and methodologies employed
by ICF in preparing this report.
2.5.1 Survey of Association Members
ICF conducted phone interviews with and distributed a written questionnaire to
association members that represented industries that would be impacted as a result of
the directive, including pipeline operators, integrated steel mills/pipe mills
manufacturers, line pipe and pipeline equipment distributors, and equipment
manufacturers. During these phone interviews, ICF inquired about companies’ suppliers
of line pipe, valves, fittings, cut-to-length plate and plate coil and the reasons for their
current suppliers from technical to pricing. ICF’s asked for the location of the product
manufacturer and the origin of the steel used to make the product. ICF also asked each
company to provide its view of the impact of domestic content policies on its current
supply chain along with any concerns it might have about availability, prices, lead times,
and other issues.
ICF also solicited information on historical pipeline purchases, valve purchases and
fittings purchases from pipeline operators that utilize steel pipelines within their
businesses for high-pressure natural gas, crude oil/liquids, and carbon dioxide. For
pipelines, ICF collected information on miles of pipe at each diameter, with the grade of
pipe, the manufacturer and where the steel originated. For valves, and fittings, ICF
collected information on the number of a particular type of valve/fitting and the
manufacturer. The data that was collected was used to help inform and check the
findings throughout this report.
2.5.2 Collection of Historical Consumption Data
ICF collected data on historical consumption of line pipe and OCTG from the Preston
Pipe Report4, the American Iron and Steel Institute annual reports, USGS steel and
minerals yearbooks5 and other sources.
2.5.3 Collection of International Trade Data
In order to analyze historic imports and exports, ICF leveraged international trade data
available through the United States Census Bureau6 for line pipe, OCTG, high strength
plate, and high strength coil. This trade data is reported as a list by Harmonized Tariff
Schedule (HTS) code. ICF reviewed this list and designated HTS codes according to
several characteristics such as material, diameter size, or welding type. The underlying
4 The Preston Pipe and Tube Report, http://www.prestonpipe.com/publications/preston-pipe-tube-report/
6 “USA Trade Online” – United States Census Bureau; https://usatrade.census.gov/
Domestic Content Requirements for Pipelines
33
May 16, 2017
trade data was then aggregated by category and year to give representative quantities
and values of imports and exports for each of the above sources. ICF also aggregated
import data by country for use in HHI calculations.
2.5.4 Collection of Data on Line Pipe, Cut-to-length Plate, and Plate Coil
Manufacturing Capacity
In order to characterize the current line-pipe market, ICF compiled a list of API 5L
certified companies from API’s monogram program7. From this listing, ICF conducted
company by company research into their specifications and operating capacity. ICF
cross-checked this research against the Pipeline & Gas Journal’s8 line pipe
specifications and the Simdex Metal Tube Manufacturer Worldwide Guide9. This data
was then separated into three classifications including pipe manufacturers that make
less than 16 inch OD pipe, 16 inch to 24 inch OD pipe and greater than 24 inch OD
pipe. For the companies where the capacity was not available from any of the sources
reviewed, the median capacity of manufacturers in each submarket whose capacity was
known was assigned to them.
The cut-to-length plate and plate coil company capability and capacity list was compiled
using the information provided by transmission line pipe operators on their source of
steel, data from James F. King’s “steelonthenet.com” database10, and information
collected from brochures and websites of plate and hot rolled coil (HRC11)
manufacturers in the U.S. The company websites also provided information on whether
their source of slabs or ingots to make cut-to-length plate or HRC was from U.S. melted
steel.
2.5.5 Estimation of Future Line Pipe and OCTG Demand
The estimates of future demand for line pipe and OCTG were developed from two ICF
forecasts prepared for API of future infrastructure investments expected in many
segment of the oil and gas industry.12 The report focused on the amount of
infrastructure needed for two different scenarios, a Base Case and a High Case, each
of which are plausible depictions of future market conditions. While the Base Case
represents a most likely scenario, the High Case is put forward to assess infrastructure
7 API Monogram Program: https://mycerts.api.org/Search/CompositeSearch
8 Pipeline & Gas Journal: https://s3.amazonaws.com/pgj-wp-media/wp-
content/uploads/sites/2/2015/12/12PGJ_15_LinePipe1.pdf 9 Simdex Metal Tube Manufactures Worldwide Guide: https://www.simdex.com/products/metal-tube-
manufacturers-worldwide-guide/ 10
James F. King’s database: http://www.steelonthenet.com/pdf/jfk_steel_brochure.pdf 11
The term hot rolled coil or HRC refers to both plate coils (thick steel) and sheet coils (thin steel) made in a hot rolling mill. 12
“U.S. Oil and Gas Infrastructure Investment Through 2035,” ICF, May 2017: http://www.api.org/news-policy-and-issues/energy-infrastructure/oil-gas-infrastructure-study-2017
Domestic Content Requirements for Pipelines
34
May 16, 2017
development in a more robust environment that is fostered by a larger hydrocarbon
resource base and more rapid advancements in E&P technology.
2.5.6 Calculation of Competition before and after Trade Restrictions
This report presents calculations regarding how import restrictions would affect
competition in the U.S. line pipe and related cut-to-length plate and plate coil markets.
Two measures that are presented: (1) how much “inframarginal” supply is removed
when line pipe imports are prohibited and (2) how industrial concentration would
increase.
The first measure is the portion of “inframarginal” line pipe supplies that would be
removed from the market by prohibiting imports. Economists use the term
“inframarginal” to refer to supplies that can enter the market at prices at or below the
prevailing market price. This can be thought of as the part of a supply curve that is at or
below the market clearing price. When import restrictions are implemented so that
inframarginal supplies are removed, the existing supply curve would be shifted to the
left and usually leads to higher market clearing prices.
The second measure of the effect of limiting imports to be presented here is a widely
used measure of industrial concentration called the Herfindahl-Hirschman Index or HHI.
The Herfindahl-Hirschman index (HHI) is calculated by summing across all companies
competing in a market, the square of each company’s market share. When used to look
at the effects of a merger or restriction on trade or production, the HHI measure can be
thought of be an indication of how the shape of the supply curve would change. In other
words, after the action in question occurs (e.g., a merger) there might be an increase in
market power among the companies remaining in the market that allows one or more of
them to increase profits by offering its product at non-competitive prices (that is, prices
above the marginal cost of production). This has the effect of changing the shape of the
supply curve to reduce the quantities available at low prices.
2.5.7 Estimation of the Economic Impacts for New Pipeline Projects
ICF developed two hypothetical examples of new pipeline projects: the first being a 36-
inch diameter 280 mile long natural gas pipeline and the second being an oil pipeline
with the same dimensions. One purpose of the examples was to illustrate how much of
the typical cost of building new oil and gas pipelines is represented by the line pipe,
fittings, and valves that might be covered by policies and actions being considered by
the Department of Commerce. The other purpose of the two pipeline cost examples is
to use them to compute how much the total cost of the pipelines would increase if the
domestic content restriction were to lead to price increase for line pipe, fittings, and
valves.
Domestic Content Requirements for Pipelines
35
May 16, 2017
The data for these cost examples came from various sources including financial filings
at the FERC by gas pipelines (FERC Form 213) and by oil pipelines (FERC Form 614).
Additional cost data came from project-level cost data filed with FERC, press releases
from project proponents stating capital costs, and commercial database on steel product
prices and pipeline project listings and summaries. Additional information on typical
design parameters and component costs came from the survey responses and
interviews with the sponsoring association members. Since actual pipeline projects
differ greatly in terms of design parameters (length, diameter, wall thickness, line pipe
materials and manufacturing method, pumps/compressors sizes and type), these two
cost examples should be seen as illustrative rather than being statistical averages.
13 Federal Energy Regulatory Commissions (FERC), Form 2/2A – Major and Non-major Natural Gas
Federal Energy Regulatory Commissions (FERC), Form 6/6-Q – Annual/Quarterly Report of Oil Pipeline Companies, https://www.ferc.gov/docs-filing/forms/form-6/viewer-instruct.asp
Domestic Content Requirements for Pipelines
36
May 16, 2017
3. Findings
3.1 Domestic Line Pipe Manufacturers and Production
Capacity
Line pipe manufacturing is part of the metal pipe and tube industry15 that is usually
described as having six market segments:
Mechanical: This is largest segment with over one-fourth of the domestic
production tonnage in the metal pipe and tube industry. The mechanical segment
encompasses the production of pipe and round and rectangular tubes used to
construct various objects such as tools, metal furniture, industrial machinery,
playground equipment, restaurant & kitchen equipment and utensils, home &
garden utensils, medical equipment, etc.
Structural: This is the second largest segment with slightly under one-fourth of
the tonnage produced in the U.S. The structural segment consists of rectangular
and round tubes and pipe used to construct bridges, buildings, posts, drilling rigs,
offshore oil & gas production platforms, etc.
Oil Country Tubular goods (OCTG): This is usually the third largest segment
with roughly one-fifth of the metal pipe and tube production by weight. It includes
tubular products such as of casing, tubing and drill pipe used to drill and
complete oil & gas wells.
Line pipe: The fourth largest segment with roughly one-sixth of the tonnage is
steel pipe of various diameters used to construct pipeline to convey crude oil,
Standard: This segment is made up of pipe generally used inside buildings for
conveying water, gas, steam or sewer flows. It is the fifth largest segment and
makes up roughly one-tenth of the tonnage produced.
Pressure: This is the smallest segment and makes up less than one percent of
the metal pipe and tube industry by tonnage. It includes pipes that can tolerate
high pressures and often corrosive fluids. These pressure pipe are used in
15 See Appendix C for listing of formal industry groupings that encompass the line pipe, fittings and valve
manufacturers discussed in this report. The metal pipe and tube industry in general and line pipe manufacturing specifically fall under two North American Industry Classification System (NAICS) codes: NAICS Code 331210 “Iron and Steel Pipe and Tube Manufacturing from Purchased Steel” and NAICS Code 331110 “Iron and Steel Mills and Ferroalloy Manufacturing.”
Domestic Content Requirements for Pipelines
37
May 16, 2017
boilers, hot water generators, fluid heaters, chemical process furnaces, power
plants, etc.
It is very common for companies in the metal pipe and tube industry to produce goods
in more than one of these six market segments – often in the same production plants.
The capacity of these plants is sometimes considered proprietary data as is the portion
of that production capacity that can be used to produce any given product. Another
complicating factor in compiling capacity estimates is that the production capacity itself
(typically measured in annual short or metric tons), is a function of what products are
produced and how many different products are scheduled in a given period of time.
Based on the company-specific research, ICF estimates the total capacity of companies
with active API 5L certification who are now producing API 5L pipe to be approximately
10.5 million metric tons across all sizes and grades of pipe. Any one facility will have the
capabilities to produce specific grades, sizes and wall thicknesses of pipe based on the
forming and welding equipment installed at the facility.
To increase profits, pipe mills try to maximize throughput and minimize downtime. They
often run large orders of one specification of pipe all at once and then run the next
specification of pipe all at once. Due to the downtime between production runs of
different kinds of pipe and tubular products and because certain pipe takes longer to
produce, it is difficult for companies to achieve their theoretical or nominal capacity.
However, this nominal capacity is still widely used as an index of individual company
and the entire domestic industries’ ability to produce. Also, since companies that have
API 5L certifications often also produce several steel pipe and tube products other than
line pipe, the capacity at the facility will have to be split across several products over
any given period of time and the actual available line pipe capacity will only be a portion
of the total nominal capacity.
For example, the highest monthly production of domestic line pipe in recent years has
been about 210,000 metric tons, which translates into a demonstrated annual line pipe
production rate of 2.5 million metric tons (assuming that high monthly production rate
could be sustained over a year). Adding a similar estimate for OCTG of 4.3 million
metric tons per year yields a demonstrated capacity to produce of 6.8 million metric tons
of line pipe plus OCTG. This compares to the 10.5 million metric tons per year nominal
production capacity shown in Exhibit 3-1. The difference (3.7 million metric tons per
year) is capacity devoted to other pipe and tube products, unavoidable downtime and
inefficiencies that prevent full capacity from ever being realized, and some amount of
capacity left unused due to insufficient demand.
For the purposes of this report we have displayed the total nominal capacity with the
understanding that all of this capacity would not solely make line pipe. We have also
highlighted companies that have typically produced OCTG products as their primary
products.
Domestic Content Requirements for Pipelines
38
May 16, 2017
In order to demonstrate the capabilities of the various U.S. companies, ICF has broken
the pipe mills into three categories or submarkets including pipeline manufacturers that
produce pipe less than 16 inches, 16.1-24 inches and greater than 24 inches. These are
displayed in Exhibit 3-1. In the exhibit, the capacities for companies that produce pipe
sizes for multiple specifications are included in more than one column. Because of this,
it would be incorrect to add up the capacities in the three submarkets as that sum would
be higher than the actual total U.S. capacity of 10.5 million metric tons.
In addition to the active API 5L producers, Exhibit 3-2 lists other U.S. companies that
have API 5L certifications, but do not appear to actively produce API 5L line pipe as a
significant product. It is possible that if domestic content requirements came into being
some of these producers could more actively compete in the API 5L market increasing
the overall available production capacity. Also it is possible that companies that make
line pipe meeting ASTM standards but not API 5L standards could enter the market for
API 5L line pipe as could companies making other kinds of pipe and tube products.
However, such shifts in production are likely to require substantial investments in basic
equipment needed to produce line pipe as well as the measurement, testing and quality
control equipment increasingly being demand by line pipe buyers. Such new entrants
would also have to factor in the time they would need to demonstrate competence in
making high quality line pipe so that they could be placed on pipeline operators’
approved manufacturers lists.
Domestic Content Requirements for Pipelines
Use or disclosure of data contained on this sheet is subject to the restrictions on the title page of this report. 39
May 16, 2017
Exhibit 3-1: U.S. Companies with API 5L Certification: Capacity to produce pipe and tubular goods (metric tons per year)
Total 8,789,214 7,006,192 3,503,216 6,725,186 10,546,283
1: Produce both line pipe and OCTG at facility 2. Primarily produce OCTG at facility 3: Primarily produce seamless OCTG at facility 4: Facility produces specialty pipe 5: Facility currently not in operation
Exhibit 3-2: Companies that have API 5L Certification but Produce No or Small Amounts of Line Pipe
Company
AmTex Machine Products, Inc.
Anvil International LLC dba Beck Manufacturing/Waynesboro Facility
Atlas Tube JMC Group
Capitol Manufacturing Company/Crowley Facility
Centric Pipe, LLC/Bossier City Facility
Hunting Energy Services, Inc./Rankin Road Facility
Itex Piping Products LLC
JMC Steel Group / Wheatland Tube - Energex Tube
JRV Technologies
LB Pipe and Coupling Products, LLC
Lincoln Manufacturing of Ohio, Inc.
Maruichi Leavitt Pipe and Tube
Tejas Tubular, Stephenville Works
Texas Couplings
Texas Pipe Works, Inc./Navasota Facility
shows companies that have large diameter pipe capabilities with the ability to make pipe
greater than 24 inches in diameter. Within the exhibit, there are two companies that
have a maximum diameter pipe of 26 inches and 28 inches. The minimum OD column
reflects that just three companies are focused on large pipe diameters greater than 24
inches.
Dividing the manufacturers into three categories of 16 inches or less, 16.1 to 24 inches
and greater than 24 inches is useful in determining the ability of companies to meet the
small, medium and large-diameter pipe demand, but does not fully represent the
industry capabilities for a given diameter of pipe. Due to this, ICF has broken the
capacity into two-inch segments where the entire capacity of a company was
aggregated if it produced pipe within that 2 inch diameter. The results of this are
displayed in Exhibit 3-3 which shows the theoretical maximum amount U.S. pipeline
manufacturers could produce of each size of pipe.
Obviously, if one pipe mill produces one size of pipe, it would reduce the maximum
capabilities of making a different size of pipe, but the graph represents the absolute
maximum for the various pipeline producers. This is particularly relevant for certain
pipeline diameters. As noted above, there are several pipeline manufacturers that
produce high pressure line pipe from 16 to 24 inch OD within the U.S., but certain
diameters are run through pipe mills less regularly, including 18 and 22 inch OD pipe.
Therefore, these diameters may have significant lead times of several months due to
pipe mills focusing on 16, 20, and 24 inch pipe. The same lead time issue is true for
large diameter pipe above 24 inch diameter (30, 36, 42, and 48 inches).
Wall thickness is another significant manufacturing constraint. Heavy wall above 0.75
inches is difficult to produce both from the physical and chemical properties of the steel
Domestic Content Requirements for Pipelines
42
May 16, 2017
and the manufacturing of the pipe. While steel and pipe manufacturers claim to have the
ability and capacity to manufacture heavy wall pipe above 0.75 inches, there are few
manufacturers that have demonstrated this capability.
Exhibit 3-3: Line Pipe Production Capacity by U.S. Companies by Diameter
3.2 Domestic High Strength Steel Plate and Plate Coil
Manufacturers and Their Production Capacity
ICF has identified six companies in the U.S. that make API 5L quality cut-to-length
(CTL) plate. These companies have total cut-to-length plate capacity of 6.7 million
metric tons per year, of which 73% is sourced from domestic steel melt. Exhibit 3-4
provides details on the companies with their capacities and plate making capabilities.
In addition to line pipe, cut-to-length plate is used in the construction or manufacturing
of many items such bridges, building, storage tanks, offshore production platforms,
ships, barges, armored tanks and other military vehicle, railcars, tractors, wind towers,
electricity transmission poles and various kinds of industrial equipment and machinery
(pressure vessels, furnaces, boilers, separators, etc.). Therefore, a substantial portion
of the capacity of these five companies (plus other cut-to-length plate manufacturers
who do not supply API 5L plate) is devoted to making plate for uses other than line pipe.
There are several ASTM specifications for steel plate used in construction and
manufacturing which can be very different than those required for API 5L line pipe. The
most common grades used in construction are A36 and A242 which have specified
minimum yield strengths of 36,000 psi and 42,000-50,000 psi respectively. Other
-
1,000,000
2,000,000
3,000,000
4,000,000
5,000,000
6,000,000
7,000,000
8,000,000
9,000,000
<=
2
2 to
<=
4
4 to
<=
6
6 to
<=
8
8 to
<=
10
10 t
o <
= 1
2
12 t
o <
= 1
4
14 t
o <
= 1
6
16 t
o <
= 1
8
18 t
o <
= 2
0
20 t
o <
= 2
2
22 t
o <
= 2
4
24 t
o <
= 2
6
26 t
o <
= 2
8
28 t
o <
= 3
0
30 t
o <
= 3
2
32 t
o <
= 3
4
34 t
o <
= 3
6
36 t
o <
= 3
8
38 t
o <
= 4
0
40 t
o <
= 4
2
42 t
o <
= 4
4
44 t
o <
= 4
6
46 t
o <
= 4
8
48 t
o <
= 5
0
50 t
o <
= 5
2
52 t
o <
= 5
4
54 t
o <
= 5
6
56 t
o <
= 5
8
58 t
o <
= 6
0
Capacity
(Metr
ic T
ons)
Outside Diameter (Inches)
United States Line Pipe Nominal Manufacturing Capacity (All Wall Thickness)
Domestic Content Requirements for Pipelines
43
May 16, 2017
applications require cut-to-length plate with ASTM standards with a specified minimum
yield strength of 100,000 psi or more and may have requirements for abrasion
resistance, and corrosion resistance and other characteristics.
Exhibit 3-4: Production Capacity by U.S. Companies Offering API 5L Cut-to-length Plate
Owner Name Plate Capacity
(Thousand Metric Tons)
Grade Capability
Width Range (Inches)
Max Thickness (Inches)
Is Steel Domestically
Melted? (Yes/No)
ArcelorMittal Group
3,145 X42M, X60M, X65M, X70M,
X80M 74 - 148 Up to 1.5 Yes
Jindal Group 1,200 NA Up to 160 Up to 6 No
US Steel Group
558 X42,X52,X60,X65,X70,X80
NA NA Yes
SSAB - Svenskt Stal
Group 300
X42, X52, X60, X65, X70
Up to 120 0.771 - 1 Yes
Nucor Group 891 NA NA NA Yes
Evraz Group 640 X70, X80 48 - 135 Up to 8 No
Total U.S. 6,734
(Capacity shown is for all cut-to-length plate, not just API 5L plate)
Hot Rolled Plate Coil
ICF has identified 11 companies that make API 5L quality hot rolled plate coil in the U.S.
These companies have a total capacity to produce hot rolled coil (both plate coil and
various kinds of sheet coils) of 53.3 million metric tons per year. Generally speaking,
sheet coils have a thickness of 0.125 inches (10 gauge) or thinner while plate coils are
0.187 inches (3/16 inches) or thicker. Plate coils have many of the same uses as cut-to-
length plate. Sheet coils have many applications including the manufacturing of
automobiles and appliances. As with cut-to-length plate used to make line pipe, the
specifications required for hot rolled plate coil used to manufacture API 5L line pipe can
be very different than the specifications required for hot rolled plate and sheet coil
intended for other applications.
Of the total HRC capacity among the 11 companies producing API 5L plate coal, 85% of
the HRC is made with domestic steel melt with the other 15% using imported slabs.
Exhibit 3-5 provides details on the companies with their capacities and HRC making
capabilities. Based on limited information available, it seems that only one company,
Arcelor Mittal, has the width capability to produce coil for longitudinal weld line pipe of
diameter greater than 30 inches.
Domestic Content Requirements for Pipelines
44
May 16, 2017
Exhibit 3-5: Production Capacity by U.S. Companies Offering API 5L HRC (capacity
is for all HRC including sheet coils and non-API plate coils)
Owner Name HRC Capacity
(Thousand Metric Tons)
Grade Capability Width Range
(Inches)
Max Thickness (Inches)
Is Steel Domestically
Melted? (Yes/No)
AK Steel Group 5,364 X40 - X65, X70F 26 - 80 0.525 Yes
ArcelorMittal Group
9,019 X42M, X60M, X65M,
X70M, X80M 74 - 148 NA Yes
ArcelorMittal Group; NSSMC
Group 2,417 NA NA NA No
BlueScope Steel Group; Gerdau
Group 1,518 NA 42 - 62 NA Yes
Evraz Group 800 X70, X80 36 - 96 NA No
JFE Steel Group; Vale Group
2,918 X80 27 - 72 NA No
Nucor Group 11,804 X42-X52 42.5 - 64 0.625 Yes
SSAB - Svenskt Stal Group
965 NA NA NA Yes
Steel Dynamics Group
5,687 NA 36 - 76 0.625 Yes
US Steel Group 11,027 X42, X52, X60, X65,
X70, X80 40 - 76 0.750 Yes
NLMK Group 1,786 NA NA NA No
Total U.S. 53,306
Use of Imported Slabs to make Cut-to-length Plate and Plate Coil
Some companies that roll cut-to-length plate and plate coils for line pipe do not make
their own suitable-quality steel16 in an electric arc furnace or blast furnace. Some of
these non-integrated rollers17 expressed concerns that they may not be able to
purchase the necessary slabs or other semi-finished products under a domestic content
requirement that stipulates that the steel contained in line pipe must be melted in the
U.S. These slab-importing rollers are concerned that integrated U.S. steel mills will
16 Most steel made in the U.S. is produced at mini-mills using recycled steel. The resulting steel may
contain high amounts of non-iron metals such as copper and zinc that make the steel unsuitable for direct use to make plate and coil for high yield strength line pipe. Such steel could be mixed with new steel made at basic oxygen furnaces to adjust its chemical makeup but such mixing is not always logistically or economically feasible. Mini mills usually are set up to make steel and then use it in a continuous process to produce high-volume products such sheet coils and rebar with relative wide specifications for steel chemistry. 17
See DOC-2017-0002, comments submitted by NMLK Robert D Miller President and Chief Executive Officer to the Department of Commerce April 7, 2017. These comments include a study by a Rutgers economist discussing the reluctance of integrated mills to sell slabs and other semi-finished products to their competitors who do not make their own steel.
Domestic Content Requirements for Pipelines
45
May 16, 2017
follow their recent practice of marketing very little of their semi-finished products to other
U.S. steel product producers and instead use their production of semi-finished products
to supply their own finished product manufacturing needs. If this occurs, these slab-
importing rollers could be at risk of dropping out of the API 5L cut-to-length plate and
plate coil markets when any domestic content requirement for pipelines goes into effect.
In the U.S. there are numerous companies that have integrated steel mills that operate
either an electric arc furnace or a blast furnace and produce semi-finished products of
ingots, blooms, billets and slabs. These semi-finished products are often processed
further in the same facilities to make cut-to-length plate, HRC and other steel products.
In addition to companies selling the finished product, companies have the ability to sell
the semi–finished product of ingots, blooms, billets and slab. As shown in Exhibit 3-6,
the domestically-marketed or exported semi-finished products make up only 1.5%- 2.5%
of the raw steel production in the United States.
Exhibit 3-6: Domestic Steel Production and Portion Market as Semi-finished Products
Specifically for 2014, data provided in USGS’s Mineral Yearbook5 shows there was 1.1
million metric tons of U.S.-produced steel sold as ingots, blooms, billets and slabs.
Additionally, the U.S. imported 9.6 million metric tons of ingots, blooms, billets and slabs
to supply non-integrated mills and other consumers. As illustrated in Exhibit 3-7, in the
last several years of domestic production of semi-finished products constituted only
about 12% of supplies to U.S. non-integrated mills, which depended on imports for the
remaining 88% of semi-finished supplies. If imports of slabs are prohibited under
domestic content policies, non-integrated rolling mills producing cut-to-length plate and
Source: ICF estimate developed from Department of Census international trade data, Preston Pipe Report and
ICF survey of sponsoring association members. Seamless line pipe is all made from billets (or similar round or
square long shapes) while welded line pipe is made from both flat plate coils and flat cut-to-length plates.
2015 2016
Domestic Content Requirements for Pipelines
50
May 16, 2017
Exhibit 3-10: Summary of Imported Pipe and Materials in U.S. Line Pipe Market (average for 2015 & 2016 in metric tons)
Changes in Sourcing of Steel Products Needed to Meet Domestic Content
Requirements
Exhibit 3-11 shows the shift in sourcing of billets, cut-to-length plates and plate coils that
hypothetically would be needed to accommodate a domestic content requirement for
U.S. line pipe. These numbers are based on the average line pipe sales in 2015 and
2016 shown in the previous table and assume that the same volumes in terms of sizes
and types of line pipe sold in those years would also be sold in the hypothetical future
under a domestic content requirement. The top part of the exhibit represents the
historical sales and materials sourcing for 2015-16, the middle part is the sourcing
pattern that might be expected under the hypothetical domestic content requirement,
and the bottom part of the exhibit is the volume changes (hypothetical minus historical
actual) that would have to occur.
The columns of the exhibit are set up to distinguish the location where the line pipe is
manufactured (foreign versus U.S.), the location where the plate or coil is rolled, and the
location where the slabs for the plate/coils are melted. The first column represents
imports of finished line pipe where all manufacturing is foreign and none takes place in
the U.S. The second column represent U.S. manufactured line pipe made from imported
cut-to-length plate and plate coil. The third column represents U.S. manufactured line
pipe made from U.S. rolled plates/coils made from imported slabs. The fourth column
represents the volume of line pipe manufactured in the U.S. using U.S. rolled plate/coil
made from U.S. melt. The fifth column is the sum of all manufacturing of line pipe in the
Domestic Content Requirements for Pipelines
51
May 16, 2017
U.S. (regardless of the source of steel) and the last column is the sum of all line pipe
supplied to the U.S. including both domestic and foreign.
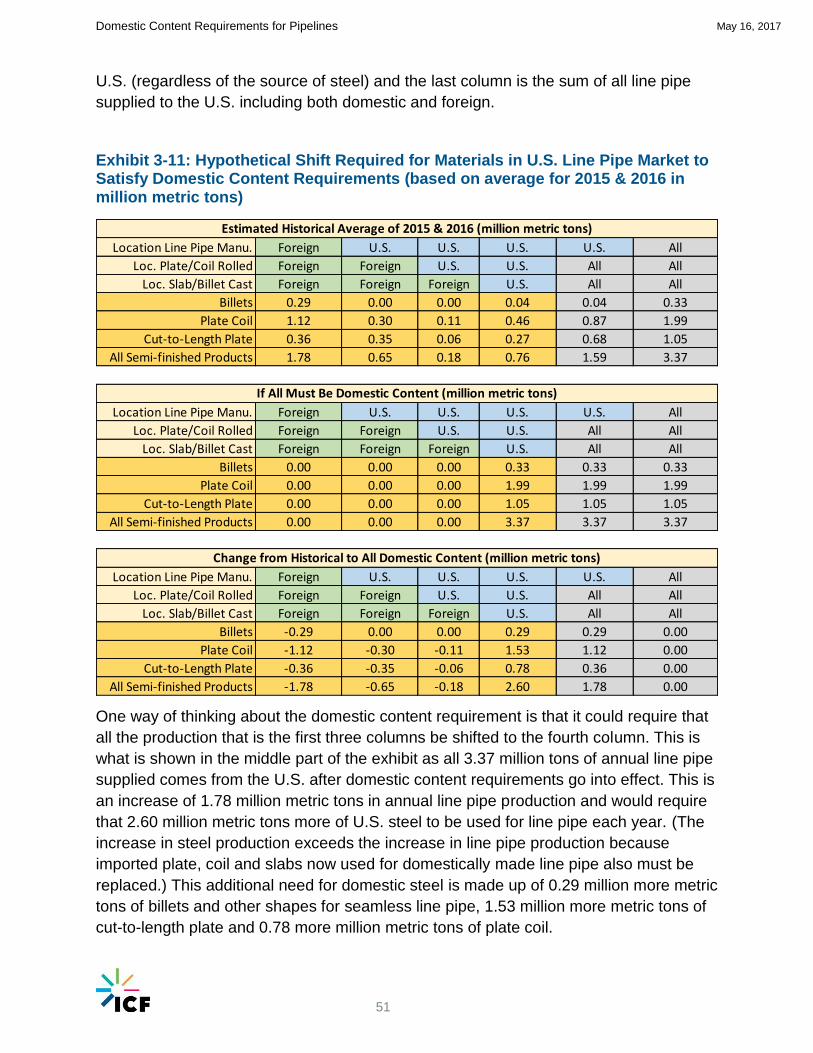
Exhibit 3-11: Hypothetical Shift Required for Materials in U.S. Line Pipe Market to Satisfy Domestic Content Requirements (based on average for 2015 & 2016 in million metric tons)
One way of thinking about the domestic content requirement is that it could require that
all the production that is the first three columns be shifted to the fourth column. This is
what is shown in the middle part of the exhibit as all 3.37 million tons of annual line pipe
supplied comes from the U.S. after domestic content requirements go into effect. This is
an increase of 1.78 million metric tons in annual line pipe production and would require
that 2.60 million metric tons more of U.S. steel to be used for line pipe each year. (The
increase in steel production exceeds the increase in line pipe production because
imported plate, coil and slabs now used for domestically made line pipe also must be
replaced.) This additional need for domestic steel is made up of 0.29 million more metric
tons of billets and other shapes for seamless line pipe, 1.53 million more metric tons of
cut-to-length plate and 0.78 more million metric tons of plate coil.
Location Line Pipe Manu. Foreign U.S. U.S. U.S. U.S. All
Loc. Plate/Coil Rolled Foreign Foreign U.S. U.S. All All
Loc. Slab/Billet Cast Foreign Foreign Foreign U.S. All All
Billets 0.29 0.00 0.00 0.04 0.04 0.33
Plate Coil 1.12 0.30 0.11 0.46 0.87 1.99
Cut-to-Length Plate 0.36 0.35 0.06 0.27 0.68 1.05
All Semi-finished Products 1.78 0.65 0.18 0.76 1.59 3.37
Location Line Pipe Manu. Foreign U.S. U.S. U.S. U.S. All
Loc. Plate/Coil Rolled Foreign Foreign U.S. U.S. All All
Loc. Slab/Billet Cast Foreign Foreign Foreign U.S. All All
Billets 0.00 0.00 0.00 0.33 0.33 0.33
Plate Coil 0.00 0.00 0.00 1.99 1.99 1.99
Cut-to-Length Plate 0.00 0.00 0.00 1.05 1.05 1.05
All Semi-finished Products 0.00 0.00 0.00 3.37 3.37 3.37
Location Line Pipe Manu. Foreign U.S. U.S. U.S. U.S. All
Loc. Plate/Coil Rolled Foreign Foreign U.S. U.S. All All
Loc. Slab/Billet Cast Foreign Foreign Foreign U.S. All All
The value of imported goods that are shown in the charts and tables of this report are
the so called “customs value” as appraised by U.S. Customs and Border Protection.
This is defined as the price actually paid for merchandise when sold for exportation to
the U.S. It excludes U.S. import duties, freight, insurance, and other charges incurred in
bringing the merchandise to the U.S. It also excludes freight costs within the U.S.
Exhibit 3-21 shows the average costs for insurance and freight paid in 2015 and 2016
for steel products imported from selected countries and regions. For line pipe, the
average insurance and freight cost to the U.S. port of entry was $72/metric ton.
Domestic Content Requirements for Pipelines
64
May 16, 2017
Exhibit 3-21: Average Cost of Insurance and Freight for Selected Steel Products Imported to the U.S. in 2015 and 2016 ($/metric ton)6
Country or Region of Export
Line Pipe
OCTG
High Strength
CTL Plate
High Strength
Plate Coil
Average of These
Steel Products
Africa $61 $46 $31 $52
Asia $77 $66 $73 $45 $72
Canada $14 $20 $13 $15
Eastern Europe/FSU $47 $68 $64 $56
Mexico $30 $45 $13 $8 $37
Middle East $101 $98 $99
South/Central America
$88 $58 $39 $38 $63
Western Europe $98 $85 $45 $41 $77
World Average $72 $63 $45 $25 $63
3.6 History of International Trade of High Strength Cut-to-
length Plate and Plate Coil Imports
The following figures display historic results of the aggregated international trade data
from the U.S. Census Bureau6. For the purposes of this section, high strength steel cut-
to-length plate and plate coil imports most suitable for making line pipe are defined as
those with a minimum yield strength of 51,000 psi, a width 24 inches or more and a
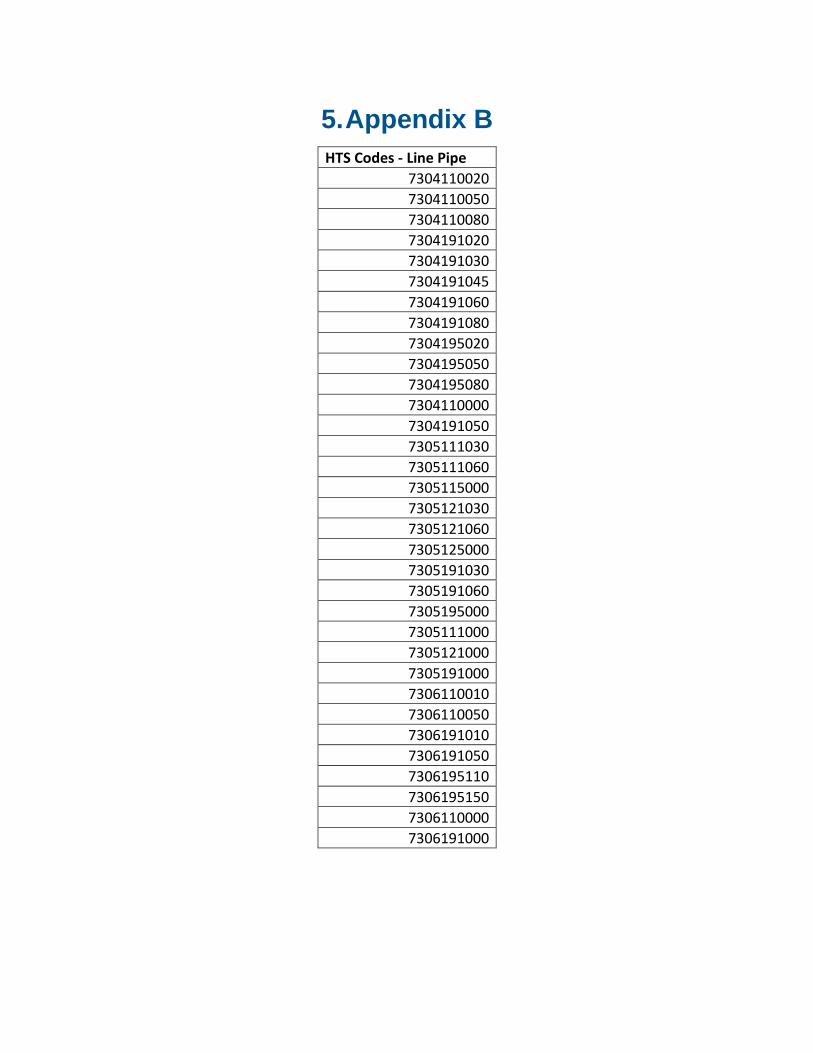
thickness of 0.187 or more.18 ICF has combined data for various HTS codes to
produced totals for high strength steel hot rolled coil and cut-to-length plate. The results
for cut-to-length plate and plate coil are shown as a set of three charts. Each set
displays the historic values of imports and exports for three parameters: volume of trade
in metric tons, value of trade in million dollars, and value per metric ton. The specific
HTS codes used to obtain these results were selected to represent the kinds of plates
and coil that would likely be used to make line pipe and are listed in Appendix B.
18 It is certainly possible to use coils less than 24 inches wide and with specified minimum yields strengths
below 51,000 psi to make line pipe. Therefore this definition will miss some imports of coils that could be used for line pipe. On the other hand, not all imports of plate and coils that meet this definition are necessarily used to make line pipe.
Domestic Content Requirements for Pipelines
65
May 16, 2017
Exhibit 3-22: International Trade in High Strength Cut-to-length Plate
Domestic Content Requirements for Pipelines
66
May 16, 2017
Exhibit 3-23: International Trade in High Strength Plate Coil
Domestic Content Requirements for Pipelines
67
May 16, 2017
Exhibit 3-24: High Strength Cut-to-length Plate and Plate Coil Maximum Imports into the U.S. by Exporting Country
Country Exporting to U.S.
Max Quantity High Strength Plate Imports (metric tons)
Max Quantity High Strength Plate Coil Imports (metric tons)
Australia 0 6,316
Canada 31,612 100,678
Finland 14,111 2,908
France 181,741 1,609
Germany 171,054 7,136
India 0 4
Korea, South 24,260 86,768
Mexico 1,717 36,362
Netherlands 43 19,777
New Zealand 0 200
Russia 20,408 40,440
Spain 627 0
Taiwan 18,870 467
Turkey 18,306 72,946
Brazil 7,660 17,014
Japan 13,473 7,713
South Africa 6,865 15
Sweden 4,996 1,512
United Kingdom 35,485 33,966
Africa 6,865 15
China 252 310
Belgium 619 0
Italy 16,135 46,117
Switzerland 823 0
Ukraine 4,447 0
Austria 35,838 0
Poland 465 0
Czech Republic 6,809 0
Denmark 205 0
Macedonia 3,640 0
Malaysia 2,712 0
Romania 3,773 0
Bulgaria 674 0
Sum (metric tons) 634,486 482,274
Domestic Content Requirements for Pipelines
68
May 16, 2017
Anti-dumping and Countervailing Duties Applied to Cut-to-length Plate and Plate Coil
As with line pipe, international trade of cut-to-length plate and plate coils has been
influenced by trade disputes with steel producers and the governments of several
countries. U.S. steel producers of cut-to-length plate and plate coils have obtained
remedies in the forms of anti-dumping duties (AD) when imports were deemed to have
sold in the U.S. at unreasonably low prices and countervailing duties (CVD) for cases
were illegal government subsidization was determined to have occurred. Exhibit 3-25
shows that there are currently 20 duty orders in existence that relate to steel plate and
19 orders that relate to hot rolled products including plate coil and sheet coil. The
counties with the largest number of currently effective orders are South Korea, China,
India, Indonesia, Brazil, South Africa and Taiwan.
Exhibit 3-25: Number of U.S. Anti-dumping and Countervailing Duty Orders in Effect for Steel Cut-to length Plate and Plate Coil
Country Plates Hot Rolled Coil and other Flat
Products
Australia 0 1
Belgium 1 0
Brazil 1 2
China 3 1
India 2 2
Indonesia 2 2
Japan 1 1
Korea 4 2
Netherlands 0 1
Russia 0 1
South Africa 3 0
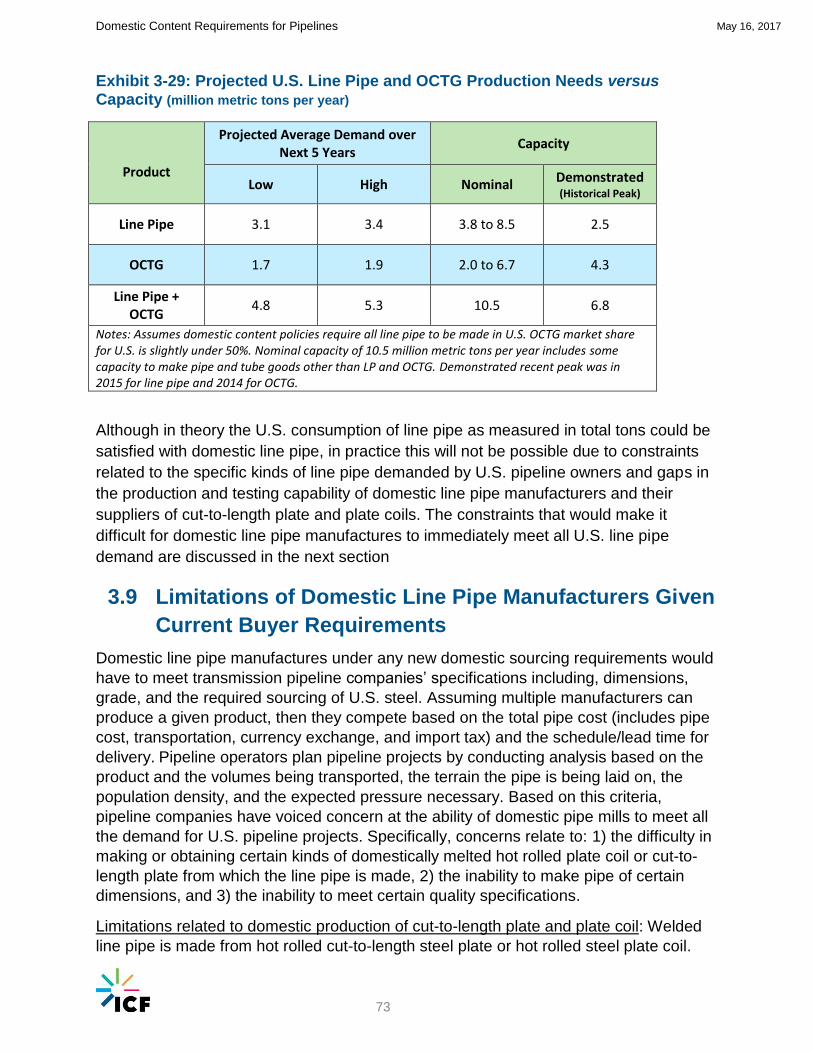
Taiwan 2 1
Thailand 0 2
Turkey 1 1
U.K. 0 1
Ukraine 0 1
All Counties 20 19
Source: ITC accessed April 2017: https://www.usitc.gov/trade_remedy/731_ad_701_cvd/investigations.htm
Domestic Content Requirements for Pipelines
69
May 16, 2017
3.7 Imports and Domestic Production of Alloying Agents
As was mentioned earlier, the most relevant line pipe specifications and testing
requirements are contained in API’s 5L (carbon steel) and 5LC (corrosion resistant
steel) standards. There are different specs for different types of line pipe such as
different yield strength grades (e.g., X60, X65, and X70). API has similar standards for
various types of OCTG. Because OCTG are exposed to unprocessed natural gases and
oils which sometimes contain corrosive mixtures of water, carbon dioxide and hydrogen
sulfide and which sometimes are found in high pressure, high temperature
environments that accelerate corrosion, users of casing and tubing are more likely to
need corrosion resistant steels alloyed with chromium, nickel and other elements.
Corrosion resistant steel may also be needed for gathering lines that collect gas and oil
from oil and gas wells and deliver it to separators and processing plants. (Gathering
lines in corrosive environments may also be made from high-density polyethylene
plastics or composite plastic/fiber materials.) Alloy and stainless steel make up only
about 7% of U.S. steel production (the remainder being carbon steel), but alloy steels
are in the neighborhood of 40% of U.S. OCTG production19.
The API standards contain minimum and maximum limits for metals, minerals and other
constituents in the steels that are used to make line pipe and OCTG. These alloying
agents are often added to the steel to provide it with desired characteristics (tensile
strength, yield strength, corrosion resistance, etc.). In other cases, the metals and
minerals are considered undesirable and their content is limited by the specifications to
certain maximum percentages. Non-iron metals added as alloying agents include
manganese, molybdenum, vanadium, magnesium, chromium and nickel and the
min/max percentages of these metals are often found in line pipe and OCTG
specifications. As shown in Exhibit 3-26, much and sometimes all of the U.S.
consumption of some of these metals is supplied by imports.
19 Platts, “Steel Data and Analysis”,
https://www.platts.com/IM.Platts.Content/ProductsServices/Products/steeldataanalysis.pdf. In the trade data for OCTG, all items are not broken out by alloy or stainless steel versus carbon. However considering the OCTG items that can be identified as alloy or stainless steel, imports are 25% by weight and 36% by value. Exports of alloy or stainless steel OCTG are 37% by weight and 45% by value. https://usatrade.census.gov/
Domestic Content Requirements for Pipelines
70
May 16, 2017
Exhibit 3-26: U.S. 2015 Balance for Some Metals Used as Steel Alloying Agents (Metric Tons per Year)5
It is expected that – in keeping with other domestic content requirements issued by the
Federal government in other contexts - any Department of Commerce’s domestic
content rule for oil and gas line pipe would not require iron ores or alloying agents be
sourced from the U.S. If the use of imported alloying agents is not clearly exempted,
then the disruption to the API 5L cut-to-length plate and plate coil markets caused by
the domestic content rule could be even more severe than anticipated in this report.
3.8 Expected Future Demand for Steel Line Pipe and
Comparison to Domestic Capacity
Apparent demand for line pipe in the U.S. (shipments from U.S. plants plus imports
minus exports) totaled 3.9 million metric tons in 2015 and 2.5 million metric tons in
20164. According to ICF “Base Case” and “High Case” estimates prepared for API12 of
future pipeline infrastructure needs, line pipe consumption in the U.S. over the next five
years will average between 2.8 to 3.1 million tons as shown on Exhibit 3-27. The exhibit
illustrates that demand for line pipe has gone up and down dramatically year to year
due to commodity price fluctuations and the coming and going of large pipeline
construction projects. Line pipe exports from the U.S. have historically averaged 0.3
million tons in the last five years. If that level of exports continues into the future total
demand (domestic consumption plus exports) would average 3.1 to 3.4 million tons over
the next three years.
Metal US Production Imports Exports RecyclingUS Consumption
(Reported)
Niobium (Columbium) none 8,900 1,300 - 7,700
Manganese
none mined in US, but
there is production
from imported ores
1,100,000 5,000 - 990,000
Chromium
only one US company
produced metal,
quantity unknown
676,000 381,000 162,000 418,000
Molybdenum 56,300 22,200 63,400 - 19,000
Nickel 168,500 162,700 61,270 - 250,000
Vanadium none 9,490 484 - 3,600
Titanium (does not include
titanium oxide used for
pigments, etc.)
US prod. withheld by
USGS, but imputed as
~10,000
22,600 1,640 - 30,600
Domestic Content Requirements for Pipelines
71
May 16, 2017
Exhibit 3-27: Projected U.S. Line Pipe Consumption (metric tons per year, excludes
exports)
In the study for API ICF also estimated the number of U.S. jobs that would be
associated with future pipeline construction and repair projects. The study estimates
that there will be an average of approximately 417,000 jobs each year from 2017 to
2021 in the “Base Case” and 456,000 jobs in the “High Case.” This job count includes
direct, indirect and induced jobs.20 These jobs relate to all aspects of the construction of
flow lines, gathering systems, and pipelines including all compressors, pumps, SCADA
systems, and construction costs – not just jobs related to the line pipe itself. These total
jobs are the jobs that would be at risk if the domestic content requirements caused
pipeline projects to be delayed or canceled.
Projected demand for OCTG in the U.S. from the two API cases is shown in Exhibit
3-28. By 2019 demand is expected to exceed 4.0 million metric tons per year and then
stay in the range of 4.0 to 5.0 million tons through 2025. These are values well below
the recent peak of 6.8 million metric tons reached in 2014. If imported OCTG maintains
a market share slightly over half of the market, then U.S. production of OCTG will
20 The terms “direct,” “indirect,” and “induced” are commonly used in economic analysis using input/output
modeling. The direct jobs are those related to the expenditures on primary (or direct) goods and services (in this case the materials, equipment, and services purchased during the construction or repair of a pipeline system). The indirect jobs are associated with all of the intermediate materials and services that go into the production of the primary/direct goods and services. The induced jobs are those that are created when the income earners in direct and indirect sectors spend their income.
-
500
1,000
1,500
2,000
2,500
3,000
3,500
4,000
4,500
2005 2010 2015 2020 2025
U.S. Oil & Gas Line Pipe Consumption (1,000 metric tons per year)
US Domestic Market API High Case API Base Case
Domestic Content Requirements for Pipelines
72
May 16, 2017
average 1.7 to 1.9 million metric tons per year over the next five years and will stay well
below estimated OCTG capacity of approximately 5.0 million metric tons per year.
Exhibit 3-28: Projected U.S. OCTG Consumption (thousand metric tons per year,
excludes exports)
Adding together the next five years’ expected levels of domestic manufacturing needs
for line pipe under a domestic content policy (3.1 to 3.4 million metric tons per year) to
the expected domestic production of OCTG (1.7 to 1.9 million metric tons per year)
yields a range for both types of products that is 4.8 to 5.3 million metric tons per year.
The nominal production capacity of active U.S. line pipe manufacturers with API 5L
certification is 10.5 million metric tons per year, so these anticipated near-term demand
levels as measured in metric tons of product are within nominal capacity.
As shown in Exhibit 3-29, these total line pipe plus OCTG production needs are also
within the historically demonstrated capacity (that is, the actual maximum achieved
rates of production) of 6.8 million tons per year for both products. However, the specific
range of need for line pipe (3.1 to 3.4 million metric tons) is above the demonstrated
capacity of 2.5 million metric tons per year for line pipe only. This means that line pipe
producers would have to activate unused line pipe capacity or shift capacity away from
the production of other products to supply all U.S. steel line pipe demand.
-
1,000
2,000
3,000
4,000
5,000
6,000
7,000
8,000
2005 2010 2015 2020 2025
U.S. OCTG Consumption (1,000 metric tons per year)
Historical Shipments & Net Imports API High Case API Base Case
Domestic Content Requirements for Pipelines
73
May 16, 2017
Exhibit 3-29: Projected U.S. Line Pipe and OCTG Production Needs versus Capacity (million metric tons per year)
Product
Projected Average Demand over Next 5 Years
Capacity
Low High Nominal Demonstrated (Historical Peak)
Line Pipe 3.1 3.4 3.8 to 8.5 2.5
OCTG 1.7 1.9 2.0 to 6.7 4.3
Line Pipe + OCTG
4.8 5.3 10.5 6.8
Notes: Assumes domestic content policies require all line pipe to be made in U.S. OCTG market share for U.S. is slightly under 50%. Nominal capacity of 10.5 million metric tons per year includes some capacity to make pipe and tube goods other than LP and OCTG. Demonstrated recent peak was in 2015 for line pipe and 2014 for OCTG.
Although in theory the U.S. consumption of line pipe as measured in total tons could be
satisfied with domestic line pipe, in practice this will not be possible due to constraints
related to the specific kinds of line pipe demanded by U.S. pipeline owners and gaps in
the production and testing capability of domestic line pipe manufacturers and their
suppliers of cut-to-length plate and plate coils. The constraints that would make it
difficult for domestic line pipe manufactures to immediately meet all U.S. line pipe
demand are discussed in the next section
3.9 Limitations of Domestic Line Pipe Manufacturers Given
Current Buyer Requirements
Domestic line pipe manufactures under any new domestic sourcing requirements would
have to meet transmission pipeline companies’ specifications including, dimensions,
grade, and the required sourcing of U.S. steel. Assuming multiple manufacturers can
produce a given product, then they compete based on the total pipe cost (includes pipe
cost, transportation, currency exchange, and import tax) and the schedule/lead time for
delivery. Pipeline operators plan pipeline projects by conducting analysis based on the
product and the volumes being transported, the terrain the pipe is being laid on, the
population density, and the expected pressure necessary. Based on this criteria,
pipeline companies have voiced concern at the ability of domestic pipe mills to meet all
the demand for U.S. pipeline projects. Specifically, concerns relate to: 1) the difficulty in
making or obtaining certain kinds of domestically melted hot rolled plate coil or cut-to-
length plate from which the line pipe is made, 2) the inability to make pipe of certain
dimensions, and 3) the inability to meet certain quality specifications.
Limitations related to domestic production of cut-to-length plate and plate coil: Welded
line pipe is made from hot rolled cut-to-length steel plate or hot rolled steel plate coil.
Domestic Content Requirements for Pipelines
74
May 16, 2017
The thickness of the cut-to-length plate and plate coil to be used is the same thickness
as the finished line pipe, which typically ranges from 0.188 to 1.50 inches (4.76 to 38.1
mm). The strength of the cut-to-length plate and plate coil is determined by the chemical
composition of the steel, manufacturing process, and the post-rolling heat treatment
regime. One important measure of line pipe strength is its minimum yield strength
measured in pounds per square inch. The most common yield strength demanded for
new large pipeline projects is 70,000 pounds per square inch (designated X70). An
important concern among line pipe buyers is that there is limited ability in the U.S. to
manufacture cut-to-length plate and plate coil of X70 strength in large widths and
particularly for cut-to-length plates in thicknesses above 0.625 inches, from
domestically-sourced slabs (per the definition of “produced within the United States” in
the Presidential Memorandum).
Operators have indicated challenges with obtaining cut-to-length plate and plate coil
with specific tolerances on chemical properties or alloy metal content from domestic
suppliers. Operators have indicated that during the procurement process domestic
suppliers often respond with specification deviations that are unacceptable. Deviations
could be due to a variety of factors ranging from process control, heat treatment
methods, available technology for making plates and HRC, and steel refining
techniques.
Limitations related to wall thickness, ovality, and other specifications: One specific area
of concern among line pipe buyers is that there are no domestic suppliers of line pipe
with domestic plate suitable for deepwater offshore applications where pipe with a
thickness of 1.5 inches or greater may be needed and where standards for roundness
(called ovality specifications) are very strict. Ovality is typically defined as the difference
between the maximum and minimum diameter of a cross section of pipe over the
nominal outside diameter. Offshore deepwater operations require less deviation in the
pipe’s roundness because it is submerged under thousands of feet of water and
undergoes greater pressures and strains. Additionally, pipe for low temperature
applications is not produced within the U.S. Another concern among line pipe buyers is
that domestic seamless pipe with thick walls and certain kinds of thick-walled ERW and
DSAW pipe have limited availability.
In addition to the items listed above voiced by operators, in theory there is the potential
for other limitations to occur based on following items.
EAF Steel Dilution Limit - The maximum amount of EAF steel (that is, new steel
made by recycling old steel products) that can be diluted with blast furnace or
direct reduced iron steel without compromising the quality of the steel needed for
pipe making in the absence of more advanced refining techniques
Die Size for Pipe-making – Whether there is a limitation on the hydraulic presses
(tonnage and die bed size) that limits the size of pipe being manufactured.
Ram Pressure Pipe (U-ing, O-ing) - Whether there is a limitation on the hydraulic
presses (tonnage) for the equipment to shape the pipe
Domestic Content Requirements for Pipelines
75
May 16, 2017
Pipe Expansion (E-ing) - Whether there is an expansion limit on the hydraulic
mandrel that limits the maximum OD of the pipe being manufactured.
Rolling and Heat Treatment of Steel for Pipe: Higher grades of line pipe require
cut-to-length plate and plate coils that typically have more complex and time
consuming rolling and heat treatment processes, which reduces the mill
throughput. U.S. mills often prefer to roll higher volume and less complex
products with which they can maintain high capacity utilization rates.
Limitations related to quality and testing: Many line pipe buyers require or prefer line
pipe that exceeds the manufacturing and testing specifications in the applicable API 5L
standards. Companies can have more stringent metallurgical and dimensional quality
requirements, smaller deviation allowances, or more stringent hydrostatic testing both in
pressure and duration. While some pipeline operators reported no unique differences in
the ability of domestic and foreign suppliers to meet their specifications, other pipeline
operators, particularly operators with company-specific standards that exceed API 5L,
noted that domestic suppliers oftentimes have more exceptions (or deviations) in their
bid to the pipeline order specifications. These exceptions indicate each requirement the
pipeline manufacturer is unable to meet. Companies oftentimes require specifications
more stringent than API 5L for CO2, offshore, LNG and corrosive pipe. In particular,
companies voiced concern about pipe mills ability to produce line pipe greater than 24
inch diameter in the specifications that would be demanded.
There are numerous types of testing that pipe mills conduct to ensure quality including
but not limited to radiographic, ultrasonic for the plate/coil, weld and pipe body, hydro
testing, magnetic particle, electromagnetic, eddy current testing. Even within the various
forms of testing, there are differences in the necessary equipment. For example, some
ultrasonic testing equipment have more probes and higher accuracy. Pipeline
companies through experience, testing, and third party testing have identified the type
of equipment they find necessary to meet the specifications they require. Below are
descriptions for some of the types of testing equipment that is used in industry:
Ultrasonic testing is used to identify transverse, longitudinal, or weld seam flaws
within the pipe, with more precise testing equipment utilizing multiple probes.
Flaws are oftentimes identified by an audible sound made when an imperfection
is identified.
Magnetic particle testing is utilized such that the pipe or weld seam is
magnetized where flaws will create a flux visible under a black light.
Electromagnetic testing can detect longitudinal defects by using flux leakage by
electromagnetic induction.
Eddy-current testing induces an eddy current around the pipe that flaws will
disturb.
Radiography utilizes gamma rays that eventually produces a latent image
depicting the varying densities.
Operators have indicated preference for line pipe makers who have online control of
cut-to-length plate, plate coil, and pipe dimensions as the product is being manufactured
Domestic Content Requirements for Pipelines
76
May 16, 2017
leading to tighter tolerance control, as opposed to testing the products post
manufacturing. The interviews conducted by ICF indicate that these kinds of modern
measurement, testing and control processes are much more prevalent at foreign rolling
and pipe mills compared to domestic mills, which tend to be older.
ALPPA agrees that limitations to domestic line pipe manufacturing capabilities Currently
exist: The American Line Pipe Producers Association (ALPPA) seems to have
conceded this point in stating in their comments to the Department of Commerce: “To
the extent that there are niche products that the domestic industry does not currently
produce, the very purpose of Buy America is to provide incentives for companies to
innovate, and develop new products and improve manufacturing processes. ALPPA
members are prepared to work with our customers and domestic steel suppliers to
reach a mutual solution when niche product issues arise. At the same time, ‘Buy
America’ requirements allow waivers in appropriate circumstance to overcome market
limitation such as product unavailability.”21
Pipeline buyers’ expectations of solely domestic purchasing on line pipe prices: Another
major concern among line pipe buyers is that any prohibition on buying line pipe from
foreign pipe mills would increase the cost of their future line pipe purchases. Even now
companies have observed that equivalent pipe produced domestically can be 0% to
50% (averaging at 25%) more expensive than their foreign counterparts. One concern
for the future is that if the necessary investments in new line pipe manufacturing
facilities discussed above were to be made, those investment dollars would have to be
recovered quickly due to the legal and political uncertainty regarding the domestic
content requirement’s long-term status. This may results in even higher line pipe prices
in the near term. The other reason for concern is that the loss of competition within a
smaller bidders’ pool would raise prices. (See discussion below on market competition
before and after import restrictions.) The third concern about higher prices stems from
the observation that domestic API 5L-compliant hot rolled plate coil and cut-to-length
plates would not be easy to obtain and, thus, the line pipe manufacturer materials cost
would go up leading to more upward pressure on line pipe prices.
Potential effect on the reliance of small diameter seamless line pipe: Another potential
problem exists in the market for small diameter seamless line pipe where imports
represent 89% of the 330,000 metric tons annual market (averaged over 2015 and
2016). It is not clear whether there is now enough excess domestic seamless line pipe
capacity to accommodate such a shift. However, the fact that the average capacity
utilization rate for OCTG in 2016 was about 21% suggests that there may be enough
excess capacity (both seamless and welded) at facilities that make both small diameter
line pipe and OCTG to accommodate the shift away from imports. If sufficient excess
capacity does not exist, it is possible that domestic production capacity now used to
make seamless OCTG could be shifted toward making seamless line pipe, although
such a shift might encourage more imports of OCTG. It is also possible that in the face
21 See ALPPA comments to the Department of Commerce at
When used to look at the effects of a merger, the HHI measure can be thought of as an
indication of how the shape of the supply curve will change. In other words, after a
merger the total supply of a product that is available to the market is likely to be the
same as before, so the total quantity at the end of the supply curve will not change.
However, if a merger increases market power of the merged companies it is possible
that the new entity might benefit by offering its product at non-competitive prices (that is,
prices above the marginal cost of production). This has the effect of changing the shape
of the supply curve to reduce the quantities available at low prices.
In the context of any domestic content requirements that led effectively to prohibiting
imports, the supply curve would be shifted to the left by removing inframarginal foreign
supplies and -- if market concentration increases substantially -- the remaining
(domestic only) suppliers may be able to change their pricing strategy to realize higher
prices. These double effects are shown in Exhibit 3-31. The added dashed red line
represents what the new supply curve might look like (after the inframarginal imported
supplies are removed from the market) if the domestic suppliers are highly concentrated
and can improve profits by changing their pricing strategy to offer less supply at lower
prices.
Exhibit 3-31: Illustration of How High Market Concentration Can Lead to Even Higher Prices after Loss of Inframarginal Supplies
$0
$500
$1,000
$1,500
$2,000
$2,500
0.0 1.0 2.0 3.0 4.0 5.0 6.0 7.0 8.0 9.0 10.0
$/m
etri
c to
n
Million metric tons of Supply or Demand
Illustration of Effects of High Market Concentration
Initial Supply
Demand
Inframarginal SuppliesRemoved
High Market Concentrationafter Infra. Sup. Removed
Domestic Content Requirements for Pipelines
82
May 16, 2017
The calculations of lost inframarginal supplies and the increase in market concentration
as measured by HHI are made assuming demand for line pipe is the average of the
levels realized in 2015 and 2016 as shown in Exhibit 3-32. This amount of 3.4 million
tons per year is similar to the expected levels of line pipe demand for the next five years
in the two API infrastructure study cases including an allowance for exports (3.1 to 3.4
million ton per year). Note that these same line pipe demand assumptions will be used
below to look at the market effects of import restrictions in the cut-to-length plate and
plate coil markets.
Exhibit 3-32: Market Size Used to Compute Loss of Inframarginal Supplies and HHI Indices (average of 2015 & 2016 in metric tons and import market share as a percent)
The first submarket evaluated is for line pipe of 24 inch diameter and greater and is
shown in Exhibit 3-33. The top part of the exhibit shows the domestic producers of line
pipe in that submarket and their estimated capacity. The average of actual domestic
production in 2015 and 2016 is allocated to each company based on a pro rata share of
estimated capacity. (Actual production by company is not known.)
The lower part of the exhibit shows the maximum imports by country realized in the last
five years. The total trade volumes in this exhibit are the average import volumes into
the U.S. for 2015 and 2016 summed across all exporting counties. This total is then
allocated to various countries based on their maximum exports.24 This method of
producing a level of export is used (instead of using trade volumes for any given year)
so that all countries that have traded with the U.S. in the recent years are shown in the
exhibit and the full diversity of supply sources that could trade with the U.S. in the future
are included in the HHI market concentration calculation.
About 30% of this submarket for line pipe greater than 24 inches is supplied by imported
line pipe and so prohibiting imports would reduce inframarginal supplies by the same
percent. Furthermore, market concentration among suppliers would go from 722 points
to 1,200 points. This is an increase of 478 points, or twice the 200 point threshold that
24 The use of exports from a country as a whole (as opposed to individual companies in that country) is
typically used to measure market concentration because publically available trade data does not reveal company-level information. This has the effect of overstating market concentration in the unrestricted case and understating the increase in concentration caused by restricting exports to the U.S.
ImportsU.S.
ProductionAll Supply
Import
M.S.
Diameter <=4.5 in 210,254 73,003 283,257 74%
Diameter 4.6-16 in 647,625 232,563 880,188 74%
Diameter 16.1-24 in 555,467 442,496 997,963 56%
Diameter >24 in 363,137 841,873 1,205,010 30%
All Sizes 1,776,482 1,589,936 3,366,418 53%
Domestic Content Requirements for Pipelines
83
May 16, 2017
Department of Justice uses to determine if mergers would lead to unacceptable
increases in market concentration.25
The calculations for the 16.1-24 inch submarket for line pipe are shown in Exhibit 3-34.
In this submarket, 56% of the inframarginal supplies will be lost. The market
concentration as represented by the HHI shows a small increase of 88 points without
imports, going from 699 to 787 points.
The third submarket of line pipe from zero to 16 inches is shown in Exhibit 3-35. The
U.S. depends heavily on imports for this submarket and some 74% of inframarginal
supplies would be lost. In this submarket the HHI goes up by 290 points without imports,
from 659 to 949.
On the whole, these calculations for the line pipe manufacturing submarkets indicate
that the biggest effects in the market would come about due to losses of large
percentages of inframarginal supplies, particularly for the zero to 16 inch market
segment. The increase in market concentration would be most significant in the line
pipe submarket above 24 inches where the HHI increases by 478 points.
As indicated in the discussions above, there would likely remain market niches
(submarkets within submarkets) where few -- if any -- domestic line pipe producers exist
and in those niches market concentration would be greater than would be indicated by
this analysis of three broad submarkets. Note also that these calculations are for the
line pipe manufacturing segment itself. The market concentration calculations for the
cut-to-length plate and plate coil markets (which also have an effect on finished line pipe
3.14 Competition in High Strength Cut-to-length Plate and
Plate Coil Markets with and without Imports
This section of the report presents for cut-to-length plate and plate coil markets the
same two measures of the market effects stemming from restrictions on imports: the
lost inframarginal supplies as a percent of the historical market and the increase in
market concentration as measured by the HHI. The amount of cut-to-length plate and
plate coil demand by the market is based on the average of the 2015 and 2016
consumption estimates presented earlier in this report.
Exhibit 3-36 presents the results for high strength plate that is compliant with API 5L line
pipe standards. As with the line pipe calculations, the top part of the exhibit lists the
domestic companies in this market and the bottom part of the exhibit shows the
countries that export to the U.S. As with line pipe, the production of for plate is spread
out among domestic companies based on total estimated plate capacity (which is not
necessarily the same as API 5L plate capacity). Export of plate from various countries is
based on the maximum level of export seen in the last five years.
One difference compared to line pipe in the calculations for cut-to-length plate (and also
for the plate coil market that will be shown next) is that there are two estimates of the
lost inframarginal supplies and increase in HHI points. In the first calculation it is
assumed that cut-to-length plate (and plate coil) producers that rely now on imported
slabs would be able to stay in the market by obtaining domestic slabs suitable for
making plate for line pipe. In the second calculation, producers that depend on imported
slabs are assumed not to be able to obtain domestic slabs and would have to exit the
API 5L market for cut-to-length plate.26
Exhibit 3-36 shows that restricting imports would remove 51 to 64% of the inframarginal
supplies of cut-to-length plate and that market concentration would increase
substantially by 1,644 to 3,420 HHI points. This several times the 200 point threshold
used by the Department of Justice and other federal agencies to indicate a worrisome
loss of market competition. This loss of inframarginal supplies and large increase in the
HHI indicate that restricting imports could put substantial upward pressure on API 5L
plate prices and, as a result, API 5L line pipe prices.
The results for plate coil are shown in Exhibit 3-37. In this market 34 to 44% of
inframarginal supplies would be removed and the HHI would increase from 695 to 1,174
points (several times the 200-point threshold). As with the cut-to-length plate market,
26 See discussion of this issue above in Section 3.2. Also see DOC-2017-0002, comments submitted by
NMLK Robert D Miller President and Chief Executive Officer to the Department of Commerce April 7, 2017. These comments include a study by a Rutgers economist discussing the reluctance of integrated mills to sell slabs and other semi-finished products to their competitors who do not make their own steel.
Domestic Content Requirements for Pipelines
88
May 16, 2017
these measures are indicative of substantial upward pressures on plate coil prices and
line pipe prices if import restrictions were to be imposed.
Exhibit 3-36 Change in Market Competition for API 5L Cut-to-length Plate with and without Imports
Company
Capacity All
Plate (metric
tons/ year)
Allocated Sales
API 5L Plate
(metric tons/
year)
Market
ShareHHI
Market
ShareHHI
Market
ShareHHI
ArcelorMittal Group 3,145,000 156,456 22.8% 522 46.7% 2,181 64.3% 4,130
Evraz Group 640,000 31,838 4.6% 22 9.5% 90 0.0% -
Jindal Group 1,200,000 59,697 8.7% 76 17.8% 318 0.0% -
US Steel Group 558,000 27,759 4.1% 16 8.3% 69 11.4% 130
SSAB - Svenskt Stal Group 300,000 14,924 2.2% 5 4.5% 20 6.1% 38
Nucor Group 891,000 44,325 6.5% 42 13.2% 175 18.2% 331
US Sum 6,734,000 335,000 48.9% 682 100.0% 2,853 100.0% 4,629
Country
Max Export to
US (metric
tons/ year)
Typical Export to
US (metric tons/
year)
Market
ShareHHI
Market
ShareHHI
Market
ShareHHI
Japan 13,473 8,112 1.2% 1 0.0% - 0.0% -
Finland 14,111 8,496 1.2% 2 0.0% - 0.0% -
Italy 16,135 9,715 1.4% 2 0.0% - 0.0% -
Turkey 18,306 11,022 1.6% 3 0.0% 0.0%
Taiwan 18,870 11,362 1.7% 3 0.0% 0.0%
Russia 20,408 12,288 1.8% 3 0.0% 0.0%
Korea, South 24,260 14,607 2.1% 5 0.0% 0.0%
Canada 31,612 19,034 2.8% 8 0.0% 0.0%
United Kingdom 35,485 21,366 3.1% 10 0.0% 0.0%
Austria 35,838 21,578 3.2% 10 0.0% 0.0%
Germany 171,054 102,993 15.0% 226 0.0% 0.0%
France 181,741 109,427 16.0% 255 0.0% 0.0%
Foreign Sum 581,293 350,000 51.1% 527 0.0% - 0.0% -
Total Market Size 685,000 100.0% 1,209 100.0% 2,853 100.0% 4,629
Increase in HHI w/o Imports 1,644 3,420
Loss of Inframarginal Supplies 51% 64%
Without Imports
(Current importers of
slab LEAVE market)
With Imports to US
Allowed
Without Imports
(Current importers of
slab STAY IN market)
Domestic Content Requirements for Pipelines
89
May 16, 2017
Exhibit 3-37: Change in Market Competition for API 5L Plate Coil with and without Imports
Company
Capacity All
HRC (metric
tons / year)
Allocated Sales
API 5L Plate Coil
(metric tons /
year)
Market
ShareHHI
Market
ShareHHI
Market
ShareHHI
AK Steel Group 5,364,000 57,358 6.6% 43 10.1% 101 11.8% 140
ArcelorMittal Group 9,019,000 96,442 11.1% 123 16.9% 286 19.9% 395
US Steel Group 11,027,000 117,914 13.6% 184 20.7% 428 24.3% 590
NLMK Group 1,786,000 19,098 2.2% 5 3.4% 11 0.0% -
US Sum 53,305,000 570,000 65.5% 642 100.0% 1,495 100.0% 1,974
Country
Max Export to
US (metric tons
/ year)
Typical Export to
US (metric tons /
year)
Market
ShareHHI
Market
ShareHHI
Market
ShareHHI
Australia 6,316 3,987 0.5% 0 0.0% - 0.0% -
Germany 7,136 4,505 0.5% 0 0.0% - 0.0% -
Japan 7,713 4,869 0.6% 0 0.0% - 0.0% -
Brazil 17,014 10,740 1.2% 2 0.0% 0.0%
Netherlands 19,777 12,485 1.4% 2 0.0% 0.0%
United Kingdom 33,966 21,442 2.5% 6 0.0% 0.0%
Mexico 36,362 22,954 2.6% 7 0.0% 0.0%
Russia 40,440 25,529 2.9% 9 0.0% 0.0%
Italy 46,117 29,112 3.3% 11 0.0% 0.0%
Turkey 72,946 46,049 5.3% 28 0.0% 0.0%
Korea, South 86,768 54,774 6.3% 40 0.0% 0.0%
Canada 100,678 63,555 7.3% 53 0.0% 0.0%
Foreign Sum 475,233 300,000 34.5% 158 0.0% - 0.0% -
Total Market Size 870,000 100.0% 800 100.0% 1,495 100.0% 1,974
Increase in HHI w/o Imports 695 1,174
Loss of Inframarginal Supplies 34% 44%
Without Imports
(Current importers of
slab LEAVE market)
With Imports to US
Allowed
Without Imports
(Current importers of
slab STAY IN market)
Domestic Content Requirements for Pipelines
90
May 16, 2017
3.15 Markets for Fittings Used for Gathering, Pipeline and
Gas Distribution
Another important aspect of the oil and gas industry that requires steel are certain
pipeline fittings. Pipeline fittings represent specific components surrounding equipment
such as connectors or joints. Fittings used in oil, gas, NGL, CO2 and petroleum product
pipelines are often designated “high yield fittings” indicating they are made of steel with
a high minimum yield strength. Some examples of common fittings include:
Flange: This part fits at the end of a pipe or somewhere along the pipe and
provides a means to connect and disconnect that pipe to another pipe, valve,
meter or other device using fasteners (nuts and bolts) or other means. Flanges
have ridge or protrusions that increase the strength of a connection of pipe and
typically have a flat smooth surface against which another pipe or fitting with a
similar flat smooth surface will be positioned to help prevent leakage.
Elbow or Bend: This fitting is a bent connector27 used to change direction of a
particular pipe connecting one pipe segment with another. The amount of bend
can vary depending on the application.
Tee: This fitting allows for two pipes to connect to a main line at 90 degree
angles with the shape created by the intersection giving the source of the name.
This fitting is widely used in when connecting pipeline systems.
Sleeves: Sleeves are pipes or two longitudinally split pipe halves that fit over a
pipe of slightly small diameter to provide a means of connecting two pipes,
protecting a pipe or repairing damage to a pipe.
Reducers: This fitting adapts one diameter pipe to a pipe of a different diameter.
Manifolds: This fitting brings flows from several pipes into a single stream or vice
versa.
Insulating Joints: Fittings placed between two sections of line pipe to prevent
electricity flows between them.
Expenditures for fittings might be expected to be about 8% of the cost of line pipe (at
the mill or port of entry). Using this rule-of-thumb the size of the U.S. market for iron and
steel fittings for flow lines, gathering systems and pipeline would have been
approximately $465 million in 2015 and $270 million in 2016.
27 Small bends in line pipe (that is, a few degrees of bend) can be made in the field during construction
using pipe bending machines. High-degree bends have to be made in facilities that heat the pipe to enable bends without damage to the pipe. The facilities then heat treat the line pipe afterwards to relieve stresses added by the bending process.
Domestic Content Requirements for Pipelines
91
May 16, 2017
ICF compiled a list of fitting manufacturers from survey responses. This list, shown in
Exhibit 3-38 below, does not necessary reflect the entire population of domestic
suppliers of line pipe fittings.
Exhibit 3-38: List of Domestic Pipe Fitting Manufacturers
Manufacturer
Advance Products & Systems Inc. E-Z Line Pipe Support Co., LLC
Allied Fitting LP (Allied Group North America) Elster Perfection
Boltex Gajeske, Inc.
Custom Alloy Corp. GE Oil and Gas - Dresser Pipeline Solutions
Edgen Murray Corp. Hy-Lok USA
Erne Hydra Stop
Eze-Flow Inner-Tite Corp.
Galperti Iracore International
Hackney Ladish Inc. ISCO Industries, Inc.
Steam Systems Inc. Norton McMurray Manufacturing
Steel Forgings Inc. NOV Wilson
Sumitomo PCC Energy Group
T D Williamson Inc. Performance Pipe
Taylor Forge Engineered Systems Inc. Project Piping Solutions, LLC
Tectubi Raccordi R.W. Lyall & Company, Inc.
Tube Forgings Of America Inc. Sandl Surplus
United Products & Services Inc. Sisco-Specialty
Wolseley Industrial Group Supply Solutions
Dynamic Products Swagelok Company
Allied Tectubi Topaz, Inc.
Team Industrial Services TPE Supply, LLC
AF Global Corporation Victaulic
Canadoil Group Weldbend Corporation
CRC-Evans Supply Weldfit
Dow Chemical Company Worldwide Pipe & Supply
Pipeline fittings are normally made from high strength steel alloyed with manganese and
other agents. Fittings are subject to maximum content limits for carbon and other
important alloying elements to assure the finished components can be easily welded
and retain specified strength and toughness specifications without requiring post-weld
heat treatments. As with line pipe, a high level of metallurgical engineering and
manufacturing know-how is required to produce fittings for modern high strength
pipelines -- particularly for large pipe diameters where the dimensions and mass of the
fittings make manufacturing and quality control more difficult.
Domestic Content Requirements for Pipelines
92
May 16, 2017
Forged fittings: A wide variety of manufacturing methods are used to make pipe line
fittings. For example, flanges and some other type of fittings are usually machined from
forgings made from steel ingots, billets or blooms. These steel shapes are hot forged to
form a near-final shape and then heat treated to achieve their specified mechanical
properties (i.e. strength, toughness). The final steps in the manufacturing process are to
machine the flange to specified dimensions and drilling bolt holes in the flange ring.
Wrought fittings: Other kinds of fittings such as elbows, tees and reducers are
wrought, or hot formed from steel cylinders or other steel shapes. These cylinders are
most commonly cut from seamless pipe but welded pipe is used for larger diameter
fittings. For very large fittings the starting shape might be steel plates that are hot
formed and welded together to produce the desired finished form. As with flanges, the
final manufacturing steps include heat treatment and machining to smooth edges and
form a smooth end where the pipe will be welded.
In an effort to characterize the pipe fitting market using U.S. International trade data,
ICF reviewed imports reported by HTS code. However, these codes are not specifically
delineated by industry type. As such, fittings for water pipes or residential usage were
not readily distinguishable from fittings using for oil and gas line pipe. Given this, ICF did
not include this data for the purposes of market review. However, ICF did collect data
on fitting purchases as part of our survey of association members. The survey included
responses that cover the purchase of approximately 34,000 fittings of which 32,000 had
data on country of manufacture. The results of the survey revealed that 70% of the
finished fittings were manufactured in the U.S., 27% came from Europe (primarily Italy)
and 2% were made in Canada. The remaining 1% were identified as coming from Japan
and China.
The results were very different for the subset of purchases of fittings of diameters over
16 inches (these large fittings made up 2,300 out of 34,000 fittings of all sizes) where
the U.S. market share was only 20% and imports were 80%. Because imported fittings
are more common among the large diameter sizes which are more expensive, imports
make up a bigger share of the estimated value of the fittings (42%) than they do of the
count of fittings (30%) reported in the survey.
The survey responses indicated that manufacturing quality considerations often led the
buyers to use for foreign suppliers. One respondent explaining the high number of forge
fittings purchased from Italy said “Historically, U.S. suppliers have had great difficulty
achieving material properties for high strength forgings (through body properties).”
Another buyer or large induction bends from Japan said that “U.S. suppliers were
included in bid but were unable to meet all requirements.”
The survey indicated that the value added represented by the fittings was often not
contributed by a single country. For example, fittings formed in Europe can be finished
and heat-treated in the U.S. Also fittings made in the U.S. are sometimes made from
steel imported from foreign sources. As an example, the largest domestic manufacturer
Domestic Content Requirements for Pipelines
93
May 16, 2017
for high strength (a.k.a. high yield) fittings sources specialized pipe from Japan and
Korea to use in its manufacturing processes. Foreign sources supply the seamless pipe
used to make fittings because the volume requirements for semi-finished steel pipe for
fittings generally do not meet the minimum volume manufacturing tonnage currently
required by domestic mills.
Of particular concern for gas distributors are 3 to 5 inch prefabricated insulated joints, a
type of pipe fitting that is used to prevent electrical current flow between two sections or
steel or iron main or service line. Stopping the current flow helps to prevent pipe
corrosion. Such 3 to 5 inch prefabricated insulated joints for distribution lines are not
produced in the U.S.
3.16 Markets for Oil and Valves and Regulators Used for
Gathering, Pipeline and Gas Distribution
The oil and gas industry requires control of the flow of product throughout the supply
chain to maintain safe operation. Regulation of the flow of oil, gas, water and other
liquids transported via pipeline is accomplished through various kinds of valves. Some
common types of valves include the following:
Ball Valve: These valves involve a ball-shaped gateway with two openings which
can rotate independently of the pipe. To regulate flow, the ball valve rotates in
such a way that the openings of the gateway line up with the cross sectional area
of the pipe allowing materials to pass through. To close the valve, the openings
within the gateway are rotated such that they are no longer parallel with the pipe,
preventing material from passing through.
Butterfly Valve: These valves containing a rotating circular disk that, when the
valve is considered closed, can fill the entire cross-sectional area within a pipe.
The valve is considered open when the disk is rotated in such a way that some
space within the pipe is clear allowing the contents of the pipe to pass through.
Gate Valve: These valves contain a sliding plate or panel that can be extended
into or retracted from the pipeline, preventing flow once completely extended.
The valve is considered open when the sliding plate is completely removed,
allowing flow to continue as normal.
Globe Valve: These valves operate by engaging a blockage in an opening within
a specially designed spherical valve body. The design forces the contents of the
pipe to pass through an opening within the body, which the valve regulates using
a disk like plug that can prevent flow entirely. When the valve is open, flow
continues through the opening within the body normally.
Domestic Content Requirements for Pipelines
94
May 16, 2017
Valves are made using either forging or casting processes. In the forging process a
semi-finished steel shape such as an ingot, bloom or billet is heated and then forced at
high pressure to conform to the shape of molds for each major part of the valve. Then
the forged work that will be the valve body is machined to remove steel so as to form
the interior of the valve and to deburr and shape its exterior. For large valves the body
may be formed by two forged pieces that are welded together. The forged work that
becomes the valve bonnet is also machined to form its shape.
The second common way to make a valve is the casting process in which molten steel
or iron is poured into a mold to form the valve body and other parts. The advantages of
casting is that can produce complex forms, accommodate strong steels that may be
difficult to forge and by forming a hollow shape it eliminates the need to remove steel to
form the valve interior or to welded two pieces to from the body. For these reason the
casting process is often used to manufacture large diameter, high-pressure valves.
Exhibit 3-39 shows ICFs estimate of the number of valves purchased in 2015 for certain
applications and their dollar value28. These applications include production, gathering,
transmission and distribution of oil, gas, NGLs, petroleum products and CO2. In total
there were an estimated 933,000 valves sold at a cost of $2.4 billion. However this
includes a large number of valves connected to plastic pipe in distribution system and at
gathering and production facilities where -- by the presumptions used in this study -- any
domestic content requirements would not apply. The valves that would be expected to
be included in the domestic content policies are those connected to steel line pipe and
pipe and that subset of the market represent 95,000 valve units and $1.7 billion in dollar
sales value.
There are many companies in the U.S. that make valves that are used in production
flow lines, gathering lines, pipelines, and distribution systems. However, a large portion
of the value added in these valves (approximately 40% on average and up to 60% in
some cases) comes from imported parts. Requiring the valves to be manufactured
entirely within the U.S. using domestic iron and steel would severely disrupt existing
valve-parts supply chains. Of particular concern is the foundry capacity in the U.S. to
make the necessary castings for large valve bodies (for all kinds of valves) and the balls
used in ball valves. As an example, the ball for ball valves over 12 inches are not cast
within the U.S.
28 The value for sales in the displayed table were developed by ICF using the Annual Survey of
Manufacturers (ASM) shipment data and percent of sales by industry from the Valve Manufacturer’s Association (VMA) (https://www.census.gov/programs-surveys/asm.html and http://c.ymcdn.com/sites/www.vma.org/resource/resmgr/Files/Annual_Shipments_by_End-User.pdf). Please note, the value of shipments reported by ASM is much larger than reported by VMA. Our interpretation for this is that the VMA data only represents a subset of the industry reported by ASM.
Domestic Content Requirements for Pipelines
95
May 16, 2017
Exhibit 3-39: Estimate of U.S. Valve Market that Might be Included in Domestic Content Policies
Exhibit 3-40 contains a list of oil and gas valve producing companies with an indication
of whether they have the capability of producing valves above 16 inches in size. This list
was compiled using the Valve Manufacturers Association29 membership and industry
buyers guides and therefore may be an incomplete listing of all domestic valve
manufacturers. The list contains companies that supply valves to oil and gas producers,
processors, refiners and pipelines. Companies that could be confirmed to produce
valves larger than 16 inches are indicated in the second column of the exhibit.
ICF also analyzed U.S. International trade data for industrial valve manufacturing and
valve components. Exhibit 3-41 below contains a comparison of imports and exports
(quantity and value) of industrial valves as well as value per metric ton. Additionally,
Exhibit 3-42 also includes a comparison of the domestic value of shipments of industrial
valves from the Annual Survey of Manufacturers30 (ASM) and the import value of valve
components from the U.S. International trade data. These data indicate that imported
parts represent approximately 40% U.S. industrial valve production.