AN ABSTRACT OF THE THESIS OF Michael Aldo Fiasca for the Ph. D. in Education (Name) (Degree) (Major) Date thesis is presented March 9, 1966 Title FEASIBILITY OF INTEGRATION OF SELECTED ASPECTS OF (CBA) CHEMISTRY, (CHEMS) CHEMISTRY AND (PSSC) PHYSICS INTO A TWO YEAR PHYSICAL SCIENCE SEQUENCE Redacted for Privacy Abstract approved (Major Professor) The purpose of this study is to compare in selected outcomes the effectiveness of an integrated chemistry -physics course with chemis- try and physics courses taught separately. Six classes, three of which studied an integrated course prepared from content of the CBA chemistry course and the PSSC physics course and three of which studied an integrated course developed from PSSC physics and CHEMS chemistry materials, constituted the treat- ment groups. Six PSSC physics classes, three CBA chemistry classes and three CHEMS chemistry classes constituted control groups. Treatment and control classes were compared in (1) gains in critical thinking; (2) subject matter achievement gains in chemistry and physics and (3) changes in attitudes towards science and the scien- tist. A pretest battery of tests and questionnaires was administered to all students in the Fall of 1963. A posttest battery consisting of
Transcript
AN ABSTRACT OF THE THESIS OF
Michael Aldo Fiasca for the Ph. D. in Education (Name) (Degree) (Major)
Date thesis is presented March 9, 1966
Title FEASIBILITY OF INTEGRATION OF SELECTED ASPECTS OF
(CBA) CHEMISTRY, (CHEMS) CHEMISTRY AND (PSSC)
PHYSICS INTO A TWO YEAR PHYSICAL SCIENCE SEQUENCE Redacted for Privacy
Abstract approved (Major Professor)
The purpose of this study is to compare in selected outcomes the
effectiveness of an integrated chemistry -physics course with chemis-
try and physics courses taught separately.
Six classes, three of which studied an integrated course prepared
from content of the CBA chemistry course and the PSSC physics
course and three of which studied an integrated course developed from
PSSC physics and CHEMS chemistry materials, constituted the treat-
ment groups. Six PSSC physics classes, three CBA chemistry classes
and three CHEMS chemistry classes constituted control groups.
Treatment and control classes were compared in (1) gains in
critical thinking; (2) subject matter achievement gains in chemistry
and physics and (3) changes in attitudes towards science and the scien-
tist.
A pretest battery of tests and questionnaires was administered to
all students in the Fall of 1963. A posttest battery consisting of
identical or equivalent instruments was given in the Spring of 1964.
Instruments used were the Otis Mental Ability Test Gamma: Form
EM; a student questionnaire; a teacher questionnaire; the Watson
Glaser Critical Thinking Appraisals, Form YM and ZM; a chemistry
achievement examination and a physics achievement examination.
Using classes as units data was analyzed using a paired t -test.
The following conclusions were drawn from this study.
1. There is no significant difference in performance on a critical
thinking criterion test between classes that study the integrated chem-
istry- physics courses and those classes that study separate chemistry
courses.
2. There is no significant difference in performance on a critical
thinking criterion test between classes that study the integrated
chemistry -physics courses and those classes that study the separate
physics course.
3. There is no significant difference in performance on an achieve-
ment criterion test between classes that study the integrated chem-
istry- physics courses and those classes that study separate chemistry
courses.
4. There is no significant difference in performance on an achieve-
ment criterion test between classes that study the integrated chemistry -
physics courses and those classes that study the separate physics
course.
5. There is no significant difference in changes of attitudes toward
science and the scientist between students who study integrated
chemistry -physics courses and students who study separate chemistry
courses.
The fifth hypothesis was divided into fifteen sub -hypotheses based
on selected attitude statements about science and the scientist.
Appendix B.
Of fifteen tests of sub -hypotheses with respect to changes of at-
titudes towards science among treatment and chemistry control
classes, the null hypothesis was accepted for thirteen of them and re-
jected for two. One of these rejections favored the integrated classes,
the other the chemistry control classes.
6. There is no significant difference in changes of attitudes towards
science and the scientist between students who study integrated
chemistry -physics courses and students who study a separate physics
course.
The sixth hypothesis was divided into fifteen sub- hypotheses based
on selected attitude statements about science and the scientist.
Appendix B.
Of fifteen tests of sub -hypotheses with respect to changes of at-
titudes towards science among treatment and physics control classes,
fourteen were accepted and one was rejected. The rejection favored
the treatment classes.
FEASIBILITY OF INTEGRATION OF SELECTED ASPECTS OF (CBA) CHEMISTRY, (CHEMS) CHEMISTRY AND (PSSC) PHYSICS
INTO A TWO YEAR PHYSICAL SCIENCE SEQUENCE
by
MICHAEL ALDO FIASCA
A THESIS
submitted to
OREGON STATE UNIVERSITY
in partial fulfillment of the requirements for the
degree of
DOCTOR OF PHILOSOPHY
June 1966
APPROVED: Redacted for Privacy
Associate Professor of Science Education In Charge of Major
Redacted for Privacy
Chairman of D artment of Science Education
Redacted for Privacy
Dean of Graduate School
Date thesis is presented March 9, 1966
Typed by Marcia Ten Eyck
ACKNOWLEDGEMENTS
That an endeavor of this kind is not the product of the efforts of
a single individual is attested to by the persons listed below. With-
out their counsel, encouragement, support and confidence, this
volume could not have been completed. A profound expression of
gratitude is owing to the following persons for their many kindnesses:
My wife, Marjorie
My children, Lori, Ann and Michele
Dean Vernon Cheldelin
Dr. Fred Fox
Dr. Stanley Williamson
Dr. Lyle Calvin
The pilot teachers and students.
M. A. F.
TABLE OF CONTENTS
INTRODUCTION
Page
1
The Problem 6
Hypotheses 6
Assumptions 10
Limitations 10
Meaning of Integration 11
REVIEW OF THE LITERATURE 13
Historical and Philosophical Considerations That Concern Integrated Curricula 13
Historical and Philosophical Considerations That Concern Integrated Chemistry and Physics Courses 17
Integrated Physical Science Courses and Their Evaluations 25 Summary 31
THE STUDY 32
A Description of the Experimental Courses 32 The Experimental Design 43 Testing Instruments, Scoring Methods and Statistics
Calculated 46 School, Student and Teacher Characteristics 56 Summary 72
PRESENTATION AND INTERPRETATION OF DATA 75
Critical Thinking 75
Achievement in Chemistry Content 81 Achievement in Physics Content 84 Attitudes Toward Science 87
SUMMARY, CONCLUSIONS AND RECOMMENDATIONS 93
Summary 93 Conclusions 94 Recommendations 98
BIBLIOGRAPHY 101
APPENDIX A 106
APPENDIX B 142
LIST OF FIGURES
Figure Page
.1 Mean Preparation of Treatment and Control Classes in Science and Mathematics - Group I 63
2 Mean Preparation of Treatment and Control Classes in Science and Mathematics - Group II 63
3 Mean Preparation of Treatment and Control Classes in Science and Mathematics - Group III 64
4 Mean Preparation of Treatment and Control Classes in Science and Mathematics - Group IV 64
5 Mean Preparation of Treatment and Control Classes in Science and Mathematics - Group V 65
6 Mean Preparation of Treatment and Control Classes in Science and Mathematics - Group VI 65
7 Mean Preparation of Treatment and Control Classes in Science and Mathematics - All Groups 66
LIST OF TABLES
Table
I Class Organization and Teacher Assignments
II Mean Grade Placement of Students in Treatment and Control Classes
Page
45
57
III I. Q. Scores of Students in Treatment and Control Classes 59
IV Percent of Total Number of Students Whose Parents Are Engaged in Various Occupation Categories 61
V Preparation of Teachers 69
VI Mean Science and Mathematics Preparation of Teachers - Semester Hours 70
VII Institute Preparation of Teachers in PSSC, CHEMS and CBA 71
VIII Teacher Experience 72
IX Mean Experience of Teachers - Years 72
X Means, Standard Deviations and Confidence Intervals of Treatment and Chemistry Control Classes on the Watson -Glaser Critical Thinking Appraisal 77
XI Class Means and Differences on the Watson -Glaser Critical Thinking Appraisals 78
XII Means, Standard Deviations and Confidence Intervals of Treatment and PSSC Classes on the Watson -Glaser Critical Thinking Appraisal 79
XIII Class Means and Differences on the Watson -Glaser Critical Thinking Appraisals 80
XIV Means, Standard Deviations and Confidence Intervals of Treatment and Chemistry Control Classes on Chemistry Achievement Examinations 82
LIST OF TABLES Continued
Table
XV Class Means and Differences on the Chemistry Achievement Tests
Page
83
XVI Means, Standard Deviations and Confidence Intervals of Treatment and Physics Control Classes on a Physics Achievement Examination 86
XVII Class Means and Differences on the Physics Achieve- ment Tests 87
XVIII Method of Ascribing Quantitative Values to Responses on the Attitudes Inventory 89
XIX Summary of Data on Attitude Changes Among Treat- ment and Control Classes 91
XX Summary of Mean Class Changes on Various Attitude Statements 143
FEASIBILITY OF INTEGRATION OF SELECTED ASPECTS OF (CBA) CHEMISTRY, (CHEMS) CHEMISTRY AND (PSSC) PHYSICS
INTO A TWO YEAR PHYSICAL SCIENCE SEQUENCE
CHAPTER I
INTRODUCTION
The need to seek continuity in science offerings has been of
interest to the science educator for quite some time. Arbitrary frag-
mentation into traditional disciplines such as physics, chemistry and
biology has been seriously questioned by a persistent core of cur-
riculum specialists over the past half century. Recently, The Panel
on Educational Research and Development has again raised this issue
with the following statement.
. . . The division of science, at the secondary school level, into biology, chemistry and physics is both unreasonable and uneconomical.
Ideally, a 3 year course that covered all three disciplines would be far more suitable than a sequence of courses which pretends to treat them as distinct . . . (59, p. 52)
From our vantage point in history it is evident that previous
attempts to integrate the sciences have met with mixed success.
Blending of botany and zoology into biology early in the present cen-
tury has gained wide acceptance until this fused course is taught
almost to the exclusion of the separate courses. Yet, integrated
physical science courses have never been able to claim a large and
enthusiastic following on the secondary school level, at any rate.
Integration of the physical sciences has been tried in numerous ways;
often technology and functional information have served as the core
2
of such a course. Several courses of study have been formulated
which draw their substance from fundamental concepts in physics,
chemistry, astronomy, geology, meteorology and mathematics. A
third kind of course limited content to chemistry and physics.
These courses together with others that combined the themes
described above were adopted in the era between 1920 and 1955; none
of them however, achieved the status of the fused biology course.
The Physical Science Study Committee was initiated in 1956 to
consider preparation of an integrated two year sequence in physical
science which was to include the major concepts of both physics and
chemistry.
The first of the major science curriculum reforms was the Physical Science Study Committee, and, as its name suggests, it began in revolt against the fractionation of chemistry and physics at the high school level into separate disciplines. This revolt was short - lived; it proved impossible in 1956 to bring physicists and chemists under the same roof, and the PSSC proceeded to devote its efforts exclusively to physics. In doing so it set a model for later curriculum programs in science, and the fractionation has persisted. (59, p. 52)
Several months later chemists set about up- dating the traditional high
school chemistry course, utilizing organizational patterns that proved
so productive for the Physical Science Study Committee. The two
groups that met with the most success were The Chemical Bond
Approach Committee (CBAC) and the Chemical Education Materials
Study (CHEMS) .
The three courses PSSC physics, CBA chemistry and CHEMS
3
chemistry were vast improvements over the traditional courses in
several respects. Emphasis of scientific principles replaces tech-
nology and industrial applications, they are intellectually more satis-
fying in the sense that depth of subject matter coverage in a few selec-
ted topics replaces superficial treatment of many, laboratory activ-
ities are truly directed at conveying to students the empirical nature
of science and finally a variety of superior instructional materials
specifically designed to accompany the courses are provided for
students.
The problem of fragmentation, however, still remained. This
condition is accompanied by unnecessary duplication of subject mat-
ter, faulty topic sequence, superficial treatment of some rather pro-
found natural laws and the belief among students that chemistry and
physics are unrelated. More specifically, thorough mastery of many
concepts in the new chemistry courses depend on understanding, in
depth, of energy relationships. These are presented rather super-
ficially with the result that students leave the course with limited in-
sight into these magnificent conservation laws. The PSSC physics
course treats this topic in depth --both on macroscopic and sub-
microscopic levels and energy systems in between. Other topics
such as behavior of gases, electrochemical cells, the structure of
matter, structure of the atom and electrical phenomena are part
of the content of most modern chemistry and physics courses.
4
This is rather uneconomical in terms of time expenditure and is also
costly in dollars. Substantial savings can be realized if the respec-
tive contents of both chemistry and physics courses are sifted and
content deleted to avoid this duplication.
In the textbook developed by PSSC, Physics (43, p. 95 -150),
hasty work is made of the evidence for our belief in the atomicity of
matter. This is not intended to be a criticism of the text for it is not
possible to devote the necessary pages to present a convincing case
for this concept in a physics text book. Integration could permit the
use of the more elaborate treatment of this concept found in one of
the chemistry texts. Another example refers to the rather intuitive
manner in which potential and kinetic energy are discussed in
Chemical Systems (12, p. 173 -199), the CBA textbook, and Chemistry
An Experimental Science (33, p. 113 -114) the CHEMS textbook.
Here the PSSC textbook provides a detailed, quantitative approach
that should provide students with a clearer understanding of these
concepts.
Close inspection of the courses also reveals that what might be
called the tools of the physical scientist and his epistomology are
also duplicated in these courses. Graphical analysis, significant
figures, measurement, scientific notation and model building are
representative examples of this.
Confronted with evidence of this sort PSSC, CBA, and CHEMS
5
teachers began to ask, why not capitalize on the strengths of the new
courses by effecting an integration of them? Two such courses have
been constructed by the Portland Project Committee; one combines
PSSC with CBA the other PSSC with CI-EMS.
School administrators, science educators and parents will be
vitally concerned about the educational outcomes of these courses.
Questions are sure to be raised regarding their effectiveness in con-
veying subject matter content as compared with the separate courses.
Other educational values that may be influenced by an integrated
course relate to its effect on critical thinking abilities. For example,
is there a discernible influence on students' abilities to recognize
assumptions, to formulate hypotheses, to interpret data and draw
valid conclusions ? Yet another question that requires answering
which is suggested by such a curriculum change relates to changes
in students' attitudes towards science and the scientist as a result of
his encounter with the integrated course. Does he more readily per-
ceive himself in the role of a scientist? How does he react to content
when presented in the integrated fashion: is it more or less difficult?
How is his awareness of the interaction of science and the culture
modified? Is there a differential change in how he views the scien-
tific process? All of these and many other questions arise when one
contemplates this particular science curriculum change. Such ques-
tions give rise to the current study.
6
The Problem
The purpose of this study is to compare the effectiveness, in
selected outcomes, the integrated chemistry -physics courses de-
veloped by the Portland Project committees with chemistry and
physics courses taught separately. Experimental and control classes
are evaluated in terms of differential gains in subject matter achieve-
ment, critical thinking abilities and attitudes towards science.
Hypotheses
1. There is no significant difference in performance on a critical
thinking criterion test between classes that study the integrated
chemistry -physics courses and those classes that study separate
chemistry courses.
2. There is no significant difference in performance on a critical
thinking criterion test between classes that study the integrated
chemistry -physics courses and those classes that study the separate
physics course.
3. There is no significant difference in performance on an achieve-
ment criterion test between classes that study the integrated chemis-
try- physics courses and those classes that study separate chemistry
courses.
4. There is no significant difference in performance on an
7
achievement criterion test between classes that study the integrated
chemistry -physics courses and those classes that study a separate
physics course.
5. There is no significant difference in changes of attitudes towards
science and the scientist between students who study integrated
chemistry -physics courses and students who study separate chemistry
courses.
The fifth hypothesis is divided into fifteen sub -hypotheses derived
from selected attitude statements (Appendix A, pages 139-141) about
science and the scientist. The sub -hypotheses stated in null form
are:
There is no significant difference in changes of attitudes on the
following statements between students who study the integrated
chemistry -physics courses and students who study separate chemistry
courses:
1. Science is a systematic way of thinking.
7. To become a scientist requires superior ability.
9. Scientists are willing to change their ideas and beliefs.
12. Modern science is too complicated for the average citizen
to understand and appreciate.
14. It is undemocratic to favor exceptional scientific talents.
15. The monetary compensation of a Nobel Prize winner in
physics should be at least equal to that given popular enter-
tainers.
8
20. Scientists are honored persons who stand very high in
popular prestige.
24. Scientific work is boring.
26. Scientific findings always lead to final truths.
34. There is much self- satisfaction to be received from work
as a scientist.
36. Science helps us to understand our environment.
42. Scientific work is monotonous.
43. The working scientist believes that nature is orderly rather
than disorderly.
47. Curiosity motivates scientists to make their discoveries.
48. The chief reward in scientific work is the thrill of discovery.
6. There is no significant difference in changes of attitudes towards
science and the scientist between students who study integrated
chemistry -physics courses and students who study a separate physics
course.
The sixth hypothesis is divided into fifteen sub - hypotheses derived
from selected attitude statements (Appendix A, pages 139 -141) about
science and the scientist. The sub -hypotheses stated in null form
are:
There is no significant difference in changes of attitudes towards
science on the following statements between students who study the
integrated chemistry -physics courses and students who study a
9
separate physics course:
1. Science is a systematic way of thinking.
7. To become a scientist requires superior ability.
9. Scientists are willing to change their ideas and beliefs.
12. Modern science is too complicated for the average citizen
to understand and appreciate.
14. It is undemocratic to favor exceptional scientific talent.
15.. The monetary compensation of a Nobel Prize winner in
physics should be at least equal to that given popular
entertainers.
20. Scientists are honored persons who stand very high in
popular prestige.
24. Scientific work is boring.
26. Scientific findings always lead to final truths.
34. There is much self-satisfaction to be received from work
as a scientist.
36. Science helps us to understand our environment.
42. Scientific work is monotonous.
43. The working scientist believes that nature is orderly rather
than disorderly.
47. Curiosity motivates scientists to make their discoveries.
48. The chief reward in scientific work is the thrill of discovery.
10
Assumptions
1. The Otis Quick Scoring Mental Ability Test, Gamma: Form EM
is a valid and reliable instrument for measuring students' scholastic
abilities.
2. The Watson -Glaser Critical Thinking Appraisals, Forms YM
and ZM are valid and reliable instruments for measuring critical
thinking abilities.
3. Selected items from the Reaction Inventory, Attitudes Towards
Science and Scientific Careers measures students' attitudes towards
science and the scientist.
4. The chemistry and physics achievement examinations assembled
by the investigator possess content validity and reliability.
5. Student and teacher involvement in this experiment did not dif-
ferentially influence their performance in the courses or on exami-
nations.
Limitations
1. Data accumulated and analyzed over a test period of one year is
utilized to generalize about students' subject matter achievement,
changes in critical thinking abilities and attitudes towards science.
2. Instructional facilities and equipment available to students and
teachers could not be controlled in the experimental and control
groups.
11
3. Teacher preparation was controlled only insofar as there was
evidence that he had preparation and /or teaching experience in CBA,
CHEMS, or PSSC.
4. Participating schools were limited to the Portland, Oregon,
Metropolitan Area, and thus can be expected to yield results charac-
teristic of one kind of school setting.
Meaning of Integration
According to Gwynn (26, p. 243) "integration" is one of the most
abused and misused of technical terms. It has been employed in the
literature in two senses, one referring to the growth of the whole
child and the other referring to the uniting of subject matter. At
the present time there is no clear understanding among many teachers
as to whether integration refers to one or the other of these mean-
ings.
The term "integration" came into general use as studies re-
vealed that the child did not develop in parts but as a whole. These
studies gave rise to the use of the term "integration" to mean the
formulation, development and union of the child's activities into a
unified growth pattern. "Integration" in this sense refers to the
processes which occur within the mind of the individual when he es-
tablishes a close relationship between diverse factors in his environ-
ment.
12
In this volume the term "integration" will be used together with
"correlation" to mean unification of subject matter content which is
extracted from separate disciplines. Hurd as reported in Alcorn
(1, p. 155) gives support for this connotation to the term when he
says, "There is a trend towards the integration of a wide range of
science fields. Within the next few years one may expect high
schools to teach Science I, II, III and IV, rather than general science,
biology, physics and chemistry." Fuller's remarks (24, p. 5) give
further support to this interpretation of the term. He says, "If the
beginning student is to understand the fundamental interdependence
of modern chemistry and physics, he should be introduced to these
two sciences in an integrated course."
Inspection of the outlines and the descriptions of the physics -
chemistry courses developed by the Portland Project Committees
that appear on pages 32 -43 of this volume reveals that these courses
are developed in accordance with Fuller's recommendations for
" integrated courses "; chemistry and physics content are inter-
meshed with one another.
13
CHAPTER II
REVIEW OF THE LITERATURE
Much has been written concerning the educational values to be
derived through integration of various subject matter disciplines.
This chapter is concerned with a summary of these publications,
first in a general way, then with attention fixed on a discussion of
integration of chemistry and physics for secondary schools. This
chapter is presented in three sections:
1. Historical and Philosophical Considerations That Concern
Integrated Curricula
2. Historical and Philosophical Considerations That Concern
Integrated Chemistry and Physics Courses
3. Integrated Physical Science Courses and Their Evaluations.
Historical and Philosophical Considerations That Concern Integrated Curricula
Integrated curricula were originated as a reaction against severe
compartmentalization which characterized the curriculum of most
schools in the early nineteenth century. When it was recognized that
the solution of many problems required breadth of knowledge inte-
gration of school subjects began to gain favor.
There appear to be at least two fundamental values that can be
derived from course integration. The first can be traced to
14
educational theory formulated by Herbart which emphasizes
concentration, i. e. , the complete absorption of the learner in the
learning task.
The correlated curriculum is a subject curriculum in which two or more subjects are articulated and relationships between them or among them are made a part of the instruction without destroying the subject boundaries. The idea of correlating courses originated in the last century from the psychological and educational conceptions of Herbart. His views laid great stress upon concentration, by which he meant complete absorp- tion in an idea or object of thought, and correlation, by which he meant the reinforcement of the idea by related and sup- porting conceptions. (51, p. 399 -400)
Tyler (54) states in his article dealing with the organization of
learning experiences that the primary function of curriculum organ-
ization is to relate learning experiences as much as possible to
obtain the maximum cumulative effect. This reinforces the Herbart
belief about the efficacy of correlation of learning experiences.
In their text book, Fundamentals of Curriculum Development,
Smith, Stanley and Shores (51, p. 495) suggest that bringing the
content of two or more courses together and reorganizing the ex-
periences into a coherent whole is an improvement over the piece-
meal presentation of the separate courses where the recognition of
interrelationships is left to chance. They point out that new relation-
ships can be developed which might have been neglected due to ad-
herence to "specialized interests or fear of teaching beyond the sub-
ject boundaries. . . "
15
The second educational value that is attributed to correlated
courses concerns the rapid accretion of knowledge over the past
few decades. As the storehouse of fundamental concepts increases,
time pressure will become an even more burdensome problem.
Integration can assist in providing a partial solution to this problem
by limiting duplication of content.
Taba, in her textbook Curriculum Development - Theory and
Practice (53, p. 189 -190), states that integration of knowledge is
vital both from the standpoint of explosion and specialization of
knowledge and from social implications of technology. She ex-
presses the concern that pursuit of specialized subjects will become
increasingly impossible as the number of specialized fields increases.
Her statement on the matter is concluded with the assertion that
more, rather than less emphasis is needed on integrated knowledge.
One of the more significant discussions that has increasingly
occupied many academicians and lay persons alike in the past few
decades centers around the inability of specialists to communicate
with one another. This problem is an out - growth of zealous and suc-
cessful efforts of men to add to the storehouse of fundamental know-
ledge. Taba says:
The fundamental truths are the treasures of many com- munities of specialists which often become completely cut off from each other in their rapid growth. When decisions are made they are made by a collection of experts who have no way of communicating their knowledge to each other. (53, p. 190)
16
Certainly integration of school subjects could help alleviate
this serious limitation.
Critics of correlated courses have expressed the fear that inte-
gration breeds dilution of content and lowering of academic standards.
Unfortunately this has occurred in a number of instances. This need
not be the end result of integration. Taba says (53, p. 191) that by
careful analysis of basic ideas in various fields it should be possible
to isolate ideas that have relevance for a number of disciplines. If
these concepts are extracted with care from diverse fields and re-
assembled, integration of knowledge is possible without a corres-
ponding loss of "depth, precision and intellectual discipline. " The
facility with which this can be accomplished is affirmed in the fol-
lowing words: "The more basic the ideas the more they tend to point
to interrelationships with ideas of other fields at least in subjects
within the same large fields. "
Is there a perceivable trend towards or away from integration
of courses on the secondary school level? Opinions of school prin-
cipals appear to be divided in this respect. A survey completed in
1962 by a group of secondary and elementary school principals indi-
cated that fifty percent of the respondents expected no change in
trends in course organization by 1966. One fifth of them predicted
further emphasis on single subjects and one fourth of those polled
predicted combination of courses into broad fields. The article
17
concludes with the assertion that the principals expected a steady
movement towards organization of content based on broad fields both
in elementary and secondary schools (47, p. 36).
Historical and Philosophical Considerations That Concern Integrated Chemistry and Physics Courses
Part 1 of the present chapter considered the values that can be
derived through course integration in general. The present dis-
cussion is more specific to science - -with particular emphasis on
the integration of chemistry and physics.
A brief recapitulation of historical events in science education
that bear on the problem of integration will be followed by a sampling
of opinions of prominent scientists and educators relative to the
wisdom of integration. This will lead into a discussion of common
structural units present in chemistry and physics as viewed by
various scientists and educators. This section will conclude with
a summary of trends towards integration of chemistry and physics.
The general science movement originated about 1905. This
was the first evidence of a growing rebellion against highly special-
ized science courses for purposes of general education and by 1920
many schools had introduced the course.
Prior to the report of the Committee of Ten in 18 93 (58) one
semester courses in physics, chemistry, botany and zoology were
18
common. The report encouraged the extension of these courses to
extend over a full one year period. Courses in chemistry and
physics were developed that followed the recommendation of the
Committee, however, there was never wide acceptance of the full
year course in botany and zoology by most secondary schools.
The Committee on College Entrance Requirements in 1899
recommended for the second year of science: biology, botany and
zoology, or botany and geology (58). Most schools soon complied
with this recommendation and introduced one of the three courses
at the freshman or sophomore level.
At first biology textbooks were partitioned in the sense that the
first half of the book explored botany content with the second half
being devoted to zoology. Gradually authors began to correlate the
two divisions around central themes such as life processes. Publi-
cation of such texts triggered a corresponding increase in biology
courses. The trend was away from botany and zoology courses
per se. Today biology is taught in most schools virtually excluding
the separate courses which preceded it (58).
The movement towards integration of chemistry and physics,
which was to come much later took on a double character. One
kind of course stressed consumer application and social values of
science; the other was based on exposition of fundamental laws of
chemistry, physics and often times geology and astronomy (49).
19
A more detailed description of a few of these courses together with
results of evaluation studies are given later in this chapter.
Charges were made by many academicians that all integrated
science courses lacked intellectual challenge. These reactions, in
many instances, had some basis in fact because any attempt to sur-
vey several subject matter fields runs the risk of superficiality in
an effort to treat all or most of the major concepts of those fields.
This was pointed out earlier in the chapter as an inherent danger in
all curriculum synthesis projects.
Other objections to prevalent practices in designing integrated
science courses soon arose. They were conceived to provide for
two basic educational needs. First, to serve as a foundation on which
to build subsequent specialized subject matter and second, to meet
the need of many students for general education in the sciences in
the form of terminal courses. Most courses failed in their attempt
to provide for each of the two kinds of students. Subject matter cov-
erage was too broad and consequently lacked sufficient depth and intel-
lectual challenge to serve the needs of the former group and were too
disjointed to serve the needs of the latter because textbooks consisted
of exerpts from college textbooks with little sense of unity (49).
In spite of past failures to achieve a satisfactory blending of
physical science concepts, particularly those which deal with chemis-
try and physics, a strong climate of opinion persists among prominent
20
science educators urging that new attempts be made in this direction.
It is rather surprising in view of the abundance of support for
integrated science courses generally and physics- chemistry courses
in particular that progress in this direction has not been more rapid.
Possibly, the very people who are advocating efforts in this direction
are themselves handicapped by insufficient familiarity with both the
sciences. Partition of the subjects in formal education seems to be
a barrier that prevents training of persons sufficiently knowledgeable
about the several fields to effect their integration. A panel estab-
lished in 1961, operating under the auspices of the President's
Science Advisory Committee, prepared a rather strong statement
supporting integration of the sciences (59, p. 21 -22). Jarrold
Zacharias, one of the leaders in the PSSC movement and a spokes-
man for the panel, asserted that although there is much reason for
satisfaction with the outcome of PSSC, CHEMS, CBA and BSCS
(The Biological Curriculum Study), there are major deficiencies as
well. He points out that "the division of secondary school science
into biology, chemistry and physics is both unreasonable and unecon-
omical. " He says further that ideally a three year sequence which
combines content from all three subjects would be far more suitable.
He exhorts those interested in science curriculum to recognize that
such a coordinated course is possible within the existing framework
and might be readily adopted if available. His statement is concluded
21
with a plea for immediate action on this problem because the time
has now arrived that the separate disciplines are presented in a
manner acceptable to the professional scientist which should facili-
tate integration at this time.
Slesnick (49) also says that science must be viewed as a single
structure. He says further that the research scientist has divided
this field of knowledge to assist in providing research avenues to-
wards understanding the corporate whole. Outside of the artificial
arrangements in laboratories or classrooms one does not meet prob-
lems "biologically, physically or chemically. " He very wisely
points out that a tree, a stalled automobile or a mouse in the base-
ment are not phenomena that concern a single subject matter. His
statement is concluded with the observation that the solution of prob-
lems in science and industry requires knowledge that cuts across
subject matter boundaries.
Those few scholars who have devoted many years to intensive
study and reflection on common structural units in physics and chem-
istry are satisfied that there is sufficient commonality in course con-
tent to justify their union into a fused course. For example, the
Beloit Conference convened in 1961 to bring together college teachers
who had experience with integrated chemistry and physics courses.
The purposes of the conference were to exchange information and to
discuss propagation of this mode of instruction on both college and
22
secondary levels. Edward Fuller, chairman of the conference, made
these comments about the interdependence of chemistry and physics
in his summary report.
Chemistry has grown to such an extent that it is futile to introduce a student to this science by presenting him with an array of facts. The essentials of modern chemistry can be grasped by the student only when he comprehends a frame- work of principles and theories to which facts can be related. Modern theories in chemistry are developing in directions which increasingly demand understanding of certain fundamental concepts of physics. The opposite is also true: The most effective way to present modern chemistry and physics is to teach them together.
Several aspects of modern physics at the introductory level require the student to think in terms of atoms and molecules. Learning some basic chemical concepts along with physics enables the student to grasp more effectively the physical principles involved. The blending of chemistry with physics is most obvious in studies of the structure of matter and its interactions with energy in the form of heat, electricity and electromagnetic radiations.(24, p. 5).
In their textbook, Fundamentals of Curriculum Development,
(51, p. 406) Smith et al. recognize that some principles of science
are more fundamental than others in the sense that the latter are in-
cluded in the former. The authors point out that Boyle's Law, which
concerns the volume changes observed when pressures are applied
to gases, commonly considered physics content, must be explained
with the molecular theory of matter. The molecular theory of matter
is a generalization that cuts across subject matter fields because
not only does it explain Boyle's Law, but also the Law of Charles
and the Law of Partial Pressures both of which are considered
23
chemistry content. It is suggested that these major generalizations
can constitute the core of an integrated physics- chemistry course.
There appears to be a definite trend towards correlation of sub-
ject matter in the sciences on the undergraduate and the graduate
levels of education. Harold Schilling, Dean of the Graduate School
at Pennsylvania State University, in a speech delivered to a commit-
tee of educators interested in combined physics and chemistry courses
(48, p. 14), points out that productive scholarship and graduate work
are increasingly concerned with problems that transcend traditional
disciplinary boundaries and require understanding and competence in
more than one field. He says that this trend is quite evident if one
would take the time to peruse lists of doctoral dissertations, research
projects in progress and dual professional appointments. Dr.
Schilling observes, in addition, that in industry the chemist and
physicist loses his identification with his subject matter specialty
very quickly.
Hurd in Alcorn (1, p. 155 -159) believes that there is a trend
towards the integration of a wide range of science fields. He feels
that within the next few years one may expect schools to teach
Science I, II, III and IV rather than general science, biology, physics
and chemistry. He predicts that the first two years will be devoted
to a two year synthesis of the biological sciences and the remaining
two years to study of a two year physical science sequence.
24
McKibben (36) finds that there is a trend towards a new kind of
physical science course which embodies principles of chemistry and
physics. The course is academically sound in that broad coverage
is replaced by penetration in depth of only a few subject matter areas;
applications of science and technology are reduced to a minimum.
An unpublished masters thesis by Martens (35, p. 1 -98) sur-
veyed student and teacher attitudes towards integrated chemistry -
physics courses. Twenty -seven teachers distributed nationally, who
were then engaged in teaching such a course, responded to a question-
naire. A second questionnaire completed by 1034 students indicated
their preferred scientific interests and their opinions with respect to
the most valuable learning activities of science.
Teachers cited as advantages of the integrated course:
1. Greater emphases on the unity of science.
2. Better coverage of principles.
3. Economy in time utilization.
4. More logical presentation of topics.
In summarizing the content of integrated chemistry -physics
courses, Martens says that teachers felt there was little evidence
that it departed radically from the content of the separate courses.
Student responses revealed that interests of girls were more
in harmony with chemistry and the historical background of the
physical sciences; they were also less curious about unknown topics
25
and their interest seems to increase as they gain added experience
with a science subject. Boys were more appreciative of the role of
mathematics in the sciences and also showed a higher preference
for physics; particularly topics dealing with mechanics, electricity
and technological applications.
Martens interprets her findings as crucial in the design of
science curriculum. She feels that the integrated physics- chemistry
course will give girls experience with physics which should stimulate
them to desire more knowledge in this area. She says that by ignor-
ing the boundaries between the sciences the gap between the known
and the unknown may be bridged. Finally Martens suggests incor-
poration of more historical material to enhance the interest of girls
in physical science.
Integrated Physical Science Courses and Their Evaluations
The central position of evaluation in all curriculum development
is supported by a McNally and Pas sow publication, Improving the
Quality of Public School Programs (37, p. 106 -107). They observe
that evaluation of curriculum development programs can have two
foci: the process and the product. Evaluation calls for appraising
student attainments both before and after curriculum development
activities as well as gathering data to ascertain what changes should
be made in these procedures. They affirm that the center of such
26
evaluations should be the student and the techniques and procedures
used are those that will yield data on his growth and achievement.
Anderson (3, p. 234) and Caswell (7, p. 98) concur with the as-
sertions that curriculum innovations must be evaluated and that their
effectiveness ultimately depends on changes in the behavior of stu-
dents. Doll (18, p. 303 -325) believes that the behavior and perform-
ance of the teacher is also worth noting in such a study. He warns,
however, that one should not expect dramatic results of curriculum
changes.
One of the earliest attempts at integration of chemistry and
physics into a two year course is that reported in 1941 which was
undertaken at the Phillips Exeter Academy. Students had the option
of electing one year of physics, one year of chemistry, a minor course
in chemistry or physics followed by a second year of that course, or
a two year course in physical science.
Among the pertinent findings are (1) that the two year course in one science results in higher achievement than one - year courses in chemistry and physics and (2) that the inte- grated course results in higher achievement than the physical sciences taken separately. (39)
A study to make comparisons of a fused physics- chemistry
course which emphasizes consumer application with a conventional
physics course is reported by Heidel (28). The study was done at
Chuska High School, Chuska, Minnesota. Heidel reports the following
results:
27
1. Both courses produced gains in knowledge of scientific facts
and information, however, physics classes demonstrated
higher achievement. The author attributes this result to
the higher abilities of the students in the conventional
physics class.
2. The generalized course did not improve materially, know-
ledge about physics concepts. The conventional course was
far superior to the generalized course in this respect.
3. Neither course demonstrated the capacity to modify
attitudes towards science to a significant degree.
4. The generalized course was no more effective in developing
consumer applications than was the conventional physics
course.
Development and testing of an integrated biology, chemistry,
and physics course at the University School which is affiliated with
the Ohio State University is described by Slesnick in The Journal of
Research in Science Teaching (49). Students who studied a unified
sequence, Science I, II and III, at the University School constituted
the treatment group, and students who had elected the separate
courses; chemistry, biology, earth science, and physical science
who attended another Columbus, Ohio, secondary school constituted
the control group. Students were matched for mental abilities, age,
past academic performance, sex and grade. The main hypothesis
28
tested concerned the differential change in students' grasp of a
"rational image of the universe ", when they study the unified course
and the separate science courses. The main hypothesis was divided
into a number of subordinate hypotheses that related to grade place-
ment, mental ability, science achievement level and sex.
The investigator devised a paper and pencil test to ascertain
students' grasp of a "rational image of the universe ", from the com-
mon subject matter of unified science; questions appear to cut across
subject matter boundaries. Five features of a rational image of the
universe are defined and questions appropriate to each feature are
included in the examination.
These features are quoted:
1. Phenomena reflect the interdependencies and interactions of matter, energy and life.
2. The forms of matter, energy and life reveal a natural orderliness.
3. Things and events are perceived in accurate perspective in relation to time and space.
4. Real problems in controlling, predicting and interpreting events in the universe transcend single disciplines.
5. Man's relationship with his universe as an observer and as a part of the "web" is perceived realistically.
Slesnick concluded that when course content and methods are
organized upon a superstructure of major generalizations of science,
students were enabled to form a more inclusive "rational image of
the universe" than students whose school experience was subject
29
centered. He finds that this conclusion is not all inclusive because
only those students of average and above average mental ability and
achievement profited significantly from the unified course. He says
furthermore that in one of the features of the "rational image" the
experimental group failed to show an advantage over the control
group (49).
Description and testing of another integrated physics and chemis-
try course is reported by Lerner in The Science Teacher (31).
Students used the traditional textbooks Modern Physics (20, p. 1 -712)
and Modern Chemistry (21, p. 1 -694) in conjunction with PSSC and
CBA materials. Forty -nine students at Barrington High School in
Newark, New Jersey, constituted the treatment group; they studied
the two year fused physics- chemistry course. A sample of fifty -one
students with approximately the same mean I. Q. , who were given
separate chemistry and physics courses made up the control group.
Subject matter achievement was measured with the Dunning Physics
Test and the ACS Chemistry Test. Test results lead Lerner to con-
clude that students' gains in achievement as a result of exposure to
both kinds of courses are not significantly different.
He describes two limitations of his investigation; one pertaining
to the possible use of invalid instruments, the other questioning the
inadequate sample sizes. A number of subjective judgments based
upon observation of an discussions with students apparently conveyed
30
to the investigator that students who experienced the integrated course
were better able to do problem solving and demonstrated more en-
thusiasm than did the typical control student.
Rueck and Korth (45) describe a combined physics and chemistry
course they developed and evaluated at Barrington High School in
Barrington, Illinois. This endeavor most nearly approximates the
course that interested this investigator of all studies reviewed, in
that the primary sources of content were materials developed by
CBA, CHEMS and PSSC. There are, however, notable differences
in course sequence and in instruments used for evaluation. Rueck
and Korth utilized the CHEM Study Tests, the Cooperative Chemistry
Test and the Cooperative Physics Test.
Comparison of the treatment group with a control group that
studied the separate chemistry and physics courses led them to the
following conclusions:
1. Subject matter achievement of the physics control group
surpassed that of the treatment group.
2. Subject matter achievement of treatment and chemistry
control groups were substantially the same.
3. Student interest in treatment classes appeared to exceed
that of control classes.
4. Average students appeared to profit from the integrated
course.
5. The integrated course seems sound but needs revision and
refinement.
Summary
31
Review of the literature reveals a persistent concern for course
correlation and integration. Some opponents of this movement fear
dilution and loss of intellectual integrity.
A strong climate of opinion supporting integration of the sciences- -
particularly chemistry and physics --is evident over the past forty
years.
Attempts to integrate chemistry and physics have been accom-
plished in a variety of ways; some emphasizing technology and ap-
plications of science, others utilizing the more traditional content
and still others depending on the national curriculum movements for
their primary source of content.
Integration of chemistry and physics seems to result in subject
matter achievement measured at approximately the same levels as
that which is characteristic of non - integrated courses. Other
factors, such as students' grasp of a "rational universe image ",
attitudes of questing, better topic sequence and avoidance of content
duplication, are enhanced by the integrated physics- chemistry
courses.
32
CHAPTER III
THE STUDY
This chapter is presented in four major subdivisions:
1. A Description of the Experimental Courses.
2. The Experimental Design.
3. Testing Instruments, Scoring Methods and Statistics
Calculated.
4. School, Student and Teacher Characteristics.
A Description of the Experimental Courses
A committee of secondary school and university chemistry and
physics teachers undertook investigation of materials produced by
PSSC, CHEMS and CBA with the intention of producing a single inte-
grated course that embodied the flavor and content of these new ap-
proaches. The investigator acted as coordinator of the project and
also assisted with writing of Student Guides and Teacher Guides.
Intensive work over a period of two years resulted in the production
of student and teacher guides for two integrated courses - -one utilizing
PSSC and CHEMS materials, the other PSSC and CBA materials.
The initial objective of the writing conference was the production
of a single syllabus effecting the synthesis of chemistry and physics
33
into a two -year sequence. Due to substantial variation in the develop-
ment of CBA and CHEMS, two separate syntheses appeared to be a
more realistic goal. To accomplish this, the committee was divided
into two groups, one of which was to consider integration of PSSC
with CHEMS, the other, PSSC with CBA.
Two writing sessions were required to achieve the desired inte-
gration. A six -weeks conference at Portland State College in
Portland, Oregon, during the summer of 1963 resulted in the produc-
tion of two teacher guides detailing the first year of the two -year
sequence. The second conference, in the summer of 1964, saw the
completion of the teacher guides and related student guides.
CHEMS - PSSC Course Outline and Description (9, p. 1 -117)
Course Outline
1. Overview A. What is Science?
1. Activities 2. Uncertainty 3. Functions
B. Time and Its Measurement
C. Space and Its Measurement
D. Kinematics
E. Vectors
F. Gravitational Mass
G. Gases and Particles
34
H. Chemical Reactions and the Mole
I. Condensed Phases
J. The Periodic Table
II. Dynamics
A. Newton's Laws of Motion
B. Motion at the Earth's Surface
C. Universal Gravitation and the Solar System
D. Momentum and the Conservation of Momentum
E. Work and Kinetic Energy
F. Potential Energy
III. Heat and Energy Effects
A. Heat, Mechanical Energy and Internal Energy
B. Heat Changes and Chemical Reactions
C. Kinetic Molecular Theory and the Energy of a Molecule
IV. Chemical Reactions
A. Rates of Chemical Reactions
B. Equilibrium in Chemical Reactions
C. Solubility Equilibria
D. Acids and Bases
E. Oxidation- Reduction Reactions
F. Chemical Calculations
V. Optics and Waves
A. How Light Behaves
35
B. Reflection and Images
C. Refraction
D. Lenses and Optical Instruments
E. Particle Model
F. Introduction to Waves
G. Waves and Light
H. Interference
I. Light Waves
VI. Electricity and Magnetism
A. Some Qualitative Facts About Electricity
B. Coulomb's Law and the Elementary Electric Charge
C. Energy and Motion of Charges in Electric Fields
D. The Magnetic Field
E. Electromagnetic Induction and Electromagnetic Waves
VII. Atoms and the Structure of Matter
A. Exploring the Atom
B. Protons and Matter Waves
C. Quantum Systems and the Structure of Atoms
D. The Orbital Model
E. Chemical Bonding and Structure of Matter
VIII. Chemistry of the Elements
A. Chemistry of Carbon Compounds
36
B. Selections from the Following: 1. The Halogens 2. The Third Row of the Periodic Table 3. Second Column of the Periodic Table 4. The Fourth Row Transition Elements 5. Some Sixth and Seventh Row Elements 6. Some Aspects of Biochemistry 7. Qualitative Analysis
CHEMS - PSSC Course Description
Part I, "Overview ", represents an integration of content and
experiences from the first portion of the CHEMS and PSSC courses.
The objectives of this section are to introduce students to science
and the scientist, to develop tools and concepts to be utilized in sub-
sequent portions of the course, and to introduce a number of profound
questions and problems that will be intensively studied at a later
time.
Force, momentum, energy and the conservation laws are intro-
duced next because thorough understanding of these concepts is cru-
cial to topics that follow: namely, heat and molecular motion,
chemical equilibrium, atomic and molecular structure and electric-
ity. Those science educators who have considered the problem of
fusing chemistry with physics recognize the topics of "Heat" and
"Energy" as two of the major problem areas. The writing committee
deliberated on this problem at length and decided that the only feasible
solution lies in a complete rewrite of this material. This has been
37
accomplished and appears in the PSSC -CHEMS Teacher Guide (9).
The first year of the integration concludes with a presentation of
chemical equilibrium and equilibrium systems. The background
developed earlier in functions and dynamics provides significant help
in making these topics more intelligible to students.
The arrangement of topics for the second year experience is cal-
culated to strive toward a depth of understanding of the structure and
behavior of atoms and matter insofar as these concepts are under-
stood today. In Part V, "Optics and Waves ", students are led to
accept credibility in two models for light, i. e. , the particulate and
wave models. The high level of interest many PSSC teachers noted
among students in connection with this material was one of the influ-
ences that caused the committee to commence the second year with
this topic. Study of electricity, magnetism, and the electromagnetic
spectrum follows; light is then shown to be a portion of this spectrum.
Atomic structure is introduced in depth with heavy emphasis on
the contributions of Rutherford and Bohr. The particle -wave model
is extended to include the entire electromagnetic spectrum. The
wave nature of the electron is introduced at this point and the electron
associated with the hydrogen atom is represented as a standing wave
in single dimension. Here an opportunity presents itself to take full
advantage of synthesis of chemistry and physics. A "bridge" was
needed that led from the principle quantum number developed in PSSC
38
to the four required to complete the geometry of the orbital atom
model used by many chemists. This additional chapter appears in
the teacher guide bearing the title, "Atoms in Three Dimensions ".
Henceforth, chemical bonds may be described in terms of the orbital
atom model.
The remaining CHEMS chapters are somewhat independent of
one another. Discretion of the teacher and student interest can dic-
tate which of these will be studied. If time permits, one or more of
the PSSC advanced topics can also be presented.
Many CHEMS and PSSC teachers have stated that the content
included in the separate courses is well beyond what they can ef-
ficiently cover in the time available. Through integration, it was
anticipated that sufficient time could be conserved to make the original
goals of these course planners more realistic. Experience of pilot
teachers who gave instruction in the integrated CHEMS - PSSC course
confirms this point of view. Beyond this, it is possible that one or
two of the PSSC advanced topics could also be included as time allows.
CBA - PSSC Course Outline and Description (10, p. 1 -170)
Course Outline
I. Interpreting the Universe
A. Introduction
39
B. Fundamental Concepts and Measurements
1. Time and Space 2. Mathematical Functions 3. Kinematics and Vectors 4. Mas s
C. Nature of Chemical Change
1. Properties of Elements, Compounds and Mixtures 2. Mixtures and Chemical Change 3. Matter and Its Atomicity
II. Mechanics
A. Newton's Laws of Motion
B. Motion at the Earth's Surface
C. Universal Gravitation
D. Momentum and Conservation of Momentum
E. Work and Kinetic Energy
F. Potential Energy
III. Electrical Nature of Matter
A. Observations of Electrical Systems
B. Energy and Motion of Charges in Electric Fields
C. Interaction of Electricity and Matter
IV. Atomic Models
A. Rutherford Atom
B. Charge Cloud Model
V. Molecules and Energy
A. Kinetic -Molecular Theory
40 B. Boiling Points and Heats of Vaporization
C. Heat, Molecular Motion and Conservation of Energy
VI. Optics and Waves
A. Behavior of Light
B. Reflection
C. Refraction
D. Lenses
E. Particle Model
F. Introduction to Waves
G. Waves and Light
H. Interference
I. Light Waves
VII. Electromagnetics
A. The Magnetic Field
B. Electromagnetic Induction and Electromagnetic Waves
VIII. Quantum Systems
A. Photons and Matter Waves
B. Quantum Systems and the Structure of Atoms
C. Orbital Model of the Atom
IX. Enthalpy
X. Bonds in Chemical Systems
A. Metals
B. Ionic Solids
C. Ions in Solution
41
XI. Order, Disorder and Change
A. Free Energy
B. Concentration, Control and Chemical Change
C. Acids and Bases
D. Time and Chemical Change
E. Water
CBA - PSSC Course Description
The first major subdivision, "Interpreting the Universe ", serves
to introduce students to the concepts of time, space, matter and
methods of measurement. Functional relationships constitute the
next unit followed by the PSSC treatment of Kinematics. Daltonian
chemistry presented largely from CBA materials completes the first
portion of the course.
"Mechanics ", which is fundamental to electricity, atomic struc-
ture, kinetic theory, chemical energetics and chemical bonding, is
considered at this time. The principles of mechanics serve as a
spring board to electrical energy and charge separation. The dielec-
tric constant is introduced as an extension of Coulomb's Law because
it is applied later to the study of ions in solution. Other electrical
topics follow: electric fields, conservation of charge and the charge
on the electron. Various kinds of electrical circuits then occupy
students. The committee spoke out strongly in favor of amplification
42
of PSSC textual material relative to DC circuits. To accomplish this
a chapter appears in the teacher guide title, "More About Electrical
Systems".
Part IV develops two fundamental models: The Rutherford Atom
and The Charge Cloud Model. The Charge Cloud Model builds on the
concept of the nuclear atom and a set of assumptions pertaining to
the expected behavior of electron clouds.
Kinetic molecular theory is a topic which profits significantly
from integration. Traditionally, students encounter it in both chem-
istry and physics, each course relating only part of the story. Though
integration of this topic is fraught with difficulty, the final outcome
for the learner has proved rewarding. Chapter B of the PSSC -CBA
Teacher Guide (10, p. 132 -159), written for the integrated course
and title "Kinetic Molecular Theory ", treates the subject fully and
more coherently even though it represents far less reading than the
CBA and PSSC textbooks devoted to the same subject. The first year
of the integrated course is concluded here.
The empirical approach to "Optics and Waves ", designed by
the Physical Science Study Committee, was judged by the committee
to possess a high motivation factor. Moreover, this material,
particularly those aspects which deal with the wave - particle contro-
versy, leads naturally into subsequent topics such as the electro-
magnetic spectrum, the wave nature of matter, atomic spectra,
43
quantum systems and the orbital model of the atom.
Part VII deals with magnetic fields, electromagnetic induction
and electromagnetic waves. Development of this material is in ac-
cordance with the PSSC text (43, p. 522 -571).
The ultimate quantum behavior of nature on submicroscopic
levels is considered next. Here, as in the PSSC -CHEMS integra-
tion, a bridge is required to proceed smoothly from the one quantum
number developed in PSSC to the four required to describe an atom
in three dimensional space. The chapter "Standing Waves in Quan-
tum Systems" was written to accommodate this need. This also ap-
pears in the teacher guide.
The last three parts of the course, "Enthalpy ", "Bonds in Chem-
ical Systems ", and "Order, Disorder, and Change ", are studied as
they appear in CBA with little modification.
The Experimental Design
This study is designed to compare the effectiveness in selected
outcomes the integrated chemistry -physics courses developed by the
Portland Project committees, with chemistry and physics courses
taught separately. Experimental and control classes were evaluated
in terms of gains in subject matter achievement, critical thinking
abilities and attitudes towards science.
44
A non - equivalent control Group Design (25, p. 217) was employed
in which treatment and control groups were pretested. Treatment
groups studied the integrated chemistry -physics courses for an en-
tire school year and the control groups studied the separate PSSC,
CBA, and CHEMS courses. Posttesting occurred at the conclusion
of the school year.
Teachers responsible for instruction in treatment classes ex-
pressed an interest in teaching the course. Each teacher simply
designated classes as treatment or control groups the first day he
met them. He had no pre -knowledge of student characteristics that
made up these classes prior to selection. When the teachers an-
nounced to treatment groups they had been designated to study an
integrated course only two students of 149 chose not to participate.
Five Portland, Oregon, Metropolitan schools contributed six
experimental classes, six PSSC control classes and six chemistry
control classes to this study. Three of the six chemistry control
classes studied CBA chemistry and three of them studied CHEMS
chemistry. Three of the treatment classes studied the PSSC -CBA
integrated course and three the PSSC -CHEMS integration. This in-
formation is summarized in Table I. In each case affiliation with a
group implies membership at the same school except for the exclu-
sion indicated on the table.
Eight teachers had responsibility for instruction in all eighteen
45
Table I. Class Organization and Teacher Assignments
Group Class N Teacher
CBA - PSSC Integration 30 Alpha I PSSC Control Class 29 Alpha
*CBA Control Class 24 Beta
CBA -- PSSC Integration 24 Beta II PSSC Control Class 25 Beta
CBA Control Class 25 Beta
CBA - PSSC Lntegration 20 Gamma III PSSC Control Class 29 Gamma
CBA Control Class 13 Delta
CHEMS - PSSC Integration 27 Epsilon IV PSSC Control Class 32 Chi
CHEMS Control Class 25 Epsilon
CHEMS - PSSC Integration 23 Lambda V PSSC Control Class 16 Mu
CHEMS Control Class 29 Lambda
CHEMS - PSSC Integration 25 Lambda VI PSSC Control Class 18 Mu
CHEMS Control Class 26 Lambda
This CBA control class was selected from another school because no such control class could be obtained there.
*
46
classes. The last column of Table I summarizes teacher- assign-
ments. Greek letters are substituted for teachers' names.
Table I presents data that shows teacher assignments within each
group. In groups I and III the same teacher was responsible for the
treatment class and the PSSC control class. Other teachers taught
the CBA control classes. The same teacher gave instruction to all
three classes within group II. Groups IV, V and VI had an identical
pattern in that the same teacher was responsible for the treatment
classes and the CHEMS control classes. Other teachers gave in-
struction in the PSSC control classes.
Testing Instruments, Scoring Methods and Statistics Calculated
Measurement of Intelligence
The Otis Quick Scoring Mental Ability Test, Gamma: Form EM
was selected to assess, "the mental abilities- thinking power or the
degree of maturity of the mind, " (40, p. 1 -4) of each participant in
this study. Classroom teachers administered the examinations during
the first week of the 1963 -64 school year. The eighty -item test yields
a single score on word meaning, verbal analogies, scrambled sen-
tences, interpretation of proverbs, logical reasoning, number reason-
ing and design analogies.
Reliability of the test, determined by the split half method, is
47
reported at O. 92 for grade 10, 0. 91 for grade 11 and 0. 92 for grade 12.
The standardization of this new form is done by comparison with
older forms of the same instrument. Description of the normative
population is somewhat vague in the manual of directions which sug-
gests that the norms are characteristic of the entire country (6,
p. 361 -362).
Measurement of Critical Thinking
The Watson -Glaser Critical Thinking Appraisal: Form YM was
administered to all student participants in this study during the first
week of the 1963 -64 school year. A parallel ZM Form constituted
part of the posttesting program and was administered during the last
week of the school year.
The examinations consist of a series of items which require the
application of some of the relevant abilities involved in critical think-
ing. The exercises include problems, statements, arguments, and
interpretations of data. The test is made up of five sub -tests.
Test 1. Inference. (Twenty items) Samples ability to discriminate among degrees of truth or falsity of inferences drawn from given data.
Test 2. Recognition of Assumptions. (Sixteen items) Samples ability to recognize unstated assumptions or pre- suppositions which are taken for granted in given statements or assertions.
Test 3. Deduction. (Twenty -five items) Samples ability to reason deductively from given statements or premises, to
48
recognize the relation of implications between proportions, to determine whether what may seem to be an implication or a necessary inference from given premises is indeed such.
Test 4. Interpretation. (Twenty -four items) Samples ability to weigh evidence and to distinguish between (a) gen- eralizations from given data that are not warranted beyond a reasonable doubt and (b) generalizations which, although not absolutely certain or necessary, do seem to be warranted beyond a reasonable doubt.
Test 5. Evaluation of Arguments. (Fifteen items) Samples ability to distinguish between arguments which are strong and relevant and those which are weak or irrelevant to a particular question or issue (56, p. 2).
Product moment correlations of the YM Form with the Otis
Mental Ability Tests: Gamma give a value of . 75 for a sample of
20, 312 high school students. A somewhat lower correlation coef-
ficient, r = . 66, was obtained between the YM Form and the Iowa Test
of Educational Development for 318 Missouri ninth grade students.
Critical thinking abilities, therefore, show a definite positive cor-
relation with both intelligence and achievement. Verbal intelligence
and the ability to learn school subjects may not, however, be the
only abilities required to do critical thinking.
Reliability of the YM and ZM Forms using the split half method
yields an r = . 86 and r = . 80, respectively, for a sample in excess
of ten thousand high school students.
The YM and ZM Forms do not have the same difficulty level.
The Watson Glaser Critical Thinking Appraisal Manual presents a
table of equivalent scores between the forms. A variable difficulty
49
which sometimes equals a raw score difference of six exists between
them (56, p. 2). This must be corrected for, in any evaluation pro-
cedure.
Measurement of Attitudes
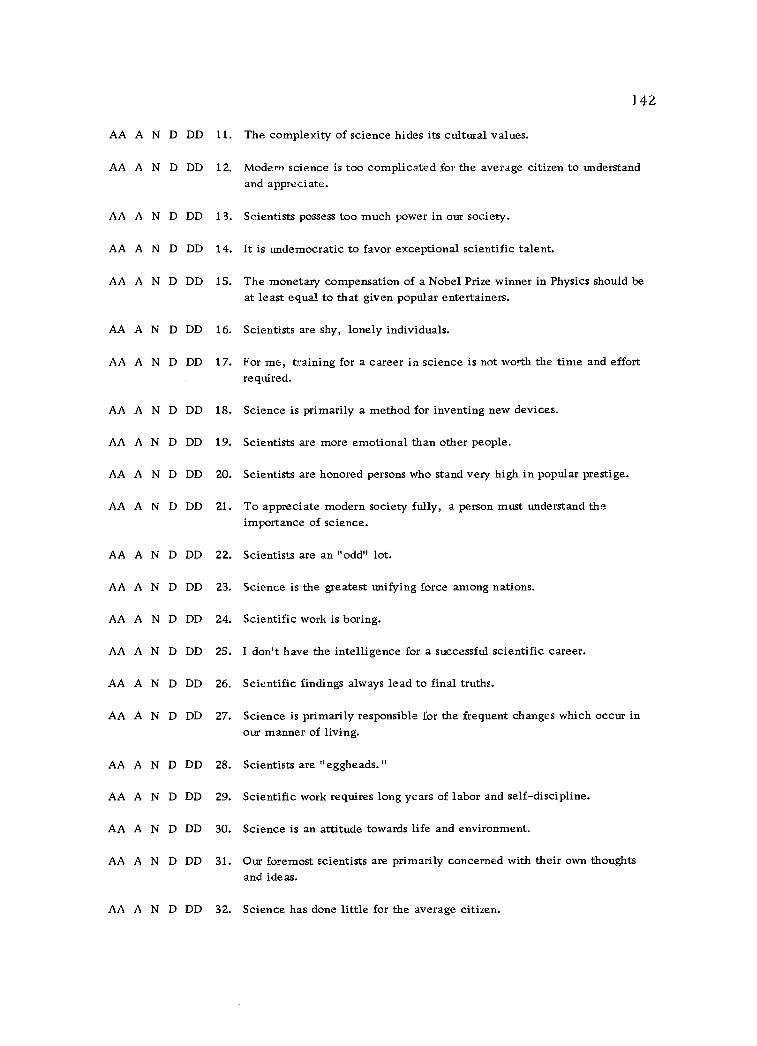
An adapted form of the Allen Reaction Inventory Attitudes Towards
Science and Scientific Careers (2, p. 1 -53) was assembled by the in-
vestigator to assess changes in students' attitudes towards (1) The
Nature of Science, (2) Society's Impact on Science, (3) Science's
Impact on Society, (4) The Scientist, and (5) Scientific Work. The
adapted form of the original inventory appears in Appendix A of this
volume. Each student who took part in the study had this instrument
administered to him the first week of the 1963 -64 school year. The
identical instrument was given at the conclusion of the school year
to assess changes in attitudes towards science as a result of his
classroom experience.
Allen prepared his original attitude scale by reviewing news-
papers and magazines noting negative statements about science and
the scientist. From this information and discussion with scientists
and students a 95 -item inventory was developed. These statements
were submitted to a panel of practicing scientists to determine their
responses. Panel responses were used as a yard stick to evaluate
student responses to the same item.
50
Forty -nine of Allen's statements were selected based on the
interest of the investigator to make up the criterion instrument used
in this study. As the study progressed preliminary evidence dictated
reduction of attitude statements to fifteen for purposes of analysis.
Careful perusal of the differences in responses between treatment
and control classes gave evidence on which statements might prove
fruitful for analysis. Statements which yielded the largest differences
between treatment and control class responses were selected for
analysis.
Howe's (30, p. 85 -87) method was utilized by the investigator
to evaluate student responses to the inventory items. Accompanying
each statement or attitude are five choices. The student can select
the one he feels best expresses his feelings.
AA - Strongly Agree
A - Agree
N - Neutral
D - Disagree
DD - Strongly Disagree
His selection was converted to a numerical score in the following way:
AA =O, A= 1, N =2, D= 3, andDD =4.
51
Measurement of Achievement in Physics
To assess students' achievement in physics a 35 -item test was
assembled from Tests of the Physical Science Study Committee
(22, V. 1 -.10). This examination was administered to all students
in the six physics control classes and to all students in the six treat-
ment classes. Identical forms were administered in a pre- and post -
testing period.
Content validity of the test was assumed for the PSSC control
classes because these items were designed by Educational Testing
Service and the Physical Science Study Committee to ascertain sub-
ject matter achievement of students who study their course. Content
validity for the treatment classes was determined by a panel of seven
experts who were intimately familiar with the content of the integrated
courses. All of the items in Tests of the Physical Science Study
Committee (22, V. 1 -10) served as a pool from which the 35 items
were drawn. All seven panelists had to agree that each item selected
was valid. If there was one dissenter, the item.was deleted.
Measurement of Achievement in Chemistry
To assess student achievement in chemistry two 35 -item tests
were designed. The first of these tests was assembled to measure
subject matter achievement in CBA chemistry. Tests of the Chemical
52
Bond Approach Project (11, V. 1 -8) were considered a pool from
which 35 items were selected. This examination was administered
to the three CBA control classes and to the three treatment classes
that studied the PSSC - CBA integrated course.
Content validity was assumed for the CBA control classes be-
cause all of these items were designed by Educational Testing Ser-
vice and the Chemical Bond Approach Project to test subject matter
achievement in the CBA course. Content validity for the treatment
classes was determined by a panel of five experts who were very
familiar with the content of the integrated course. In the selection
of the 35 items that was to constitute the test, if one panelist dis-
sented on a test item it was deleted.
For purposes of scoring and interpreting data nineteen of the
thirty -five items were used. The decision to reduce the number of
test items for analysis was caused by an unrealistic time schedule
for the integrated classes. Approximately one -third of the CBA con-
tent planned for the first year of the integrated course was not con-
sidered due to time taken out for testing and the customary slow pace
that is usually associated with teachers and students who are engaged
in a new course.
The second chemistry test was designed to assess subject matter
achievement in CHEMS chemistry. A 35 -item test was assembled
using the Chemical Education Material Study Achievement Tests
53
(13, V. 1-7) as a pool from which to draw items. This examination
was administered to the three control classes studying CHEMS chem-
istry and the three treatment classes studying the CHEMS - PSSC
integrated course.
Content validity of the test was assumed for the CHEM control
classes because the items were produced by Educational Testing
Service and The Chemical Education Materials Study to test subject
matter achievement in CHEMS. Content validity for the integrated
course was judged by a panel of six experts who were thoroughly
acquainted with the course. In the selection of the 35 items that were
to constitute the test if one panelist dissented on an item it was not
used.
For purposes of scoring and interpreting data 25 of the 35 items
were used. The decision to reduce the number of test items for pur-
poses of analysis was caused by an unrealistic time schedule adopted
for the integrated classes. They were not able to complete approxi-
mately one -fourth of the CHEMS content planned for them. This was
due to excessive time required for testing and the customary slow
pace usually associated with a pilot program.
Assessment of Student Characteristics
Other student characteristics were assumed to have some effect
on their performances. A questionnaire (Appendix A) which was
54
completed by all students the first week of the 1963 -64 school year
elicited information from them which summarized their educational
background in science and mathematics courses in high school, grade
in school and occupation of parents.
Assessment of Teacher Characteristics
Differences among teachers could also have an impact on the
results of this study. To obtain a profile of each individual teacher,
he was asked to complete a questionnaire (Appendix A) summarizing
teaching experience, preparation in science and professional interests
and activities. Particularly prominent in the questionnaire were
questions directed at training and experience in the new curricula,
i. e. , in CBA, CHEMS, and PSSC.
All instruments were hand scored by a team of four students who
attend Portland State College and checked for discrepancies by a
second team of three students.
Arithmetic means of I. Q. scores obtained with the Otis Quick
Scoring Mental Ability Test, Gamma: Form EM were calculated for
each class together with the standard deviation and confidence inter-
val.
Arithmetic means of performance on the Watson -Glaser Critical
Thinking Appraisal: Forms YM and ZM together with standard devi-
ations and confidence intervals were calculated for each class. Using
55
classes as units, the paired t -test (32, p. 119 -140) was applied to
the difference of means between the six treatment classes and the
six physics control classes to determine if these differences were
significant at the five percent level. In this procedure, the pretest
raw scores were subtracted from posttest scores, a mean calculated
for these differences, and the paired t -test applied to these means to
determine significance. The t -test was also applied at the five per-
cent level to determine if the difference of means between the six
treatment classes and the six chemistry control classes were signifi-
cant for changes in critical thinking abilities.
The arithmetic means, standard deviations and confidence inter-
vals for each class were calculated for the chemistry achievement
tests. Using classes as units the paired t -test was applied to the
difference of means between the six treatment classes and the six
chemistry control classes to determine if these differences were
significant at the five percent level. In this procedure the pretest
raw scores were subtracted from the posttest scores, a mean cal-
culated for these differences and the paired t -test applied to these
difference of means to determine significance.
The arithmetic means, standard deviations and confidence inter-
vals for each class were calculated for the physics achievement tests.
Using classes as units the paired t -test was applied to the difference
of means between the six treatment classes and the six physics control
56
classes to determine if these differences were significant at the five
percent level. In this procedure the pretest raw scores were sub-
tracted from the posttest scores, a mean calculated for these dif-
ferences and the paired t -test applied to these differences of means
to determine significance.
Fifteen of the 49 items that appear on the science attitudes inven-
tory (Appendix A) were chosen for analysis by the investigator.
Basis for selection of these statements appear on page 50. These
are 1, 7, 9, 12, 14, 15, 20, 24, 26, 34, 36, 42, 43, 47, and 48.
Numerical values were applied to each response as described pre-
viously in this chapter. The arithmetic mean for each response was
calculated using classes as units. The paired t -test was applied to
the differences of means for these items to determine significance
at the five percent level.
As in the previous calculations, the six treatment classes were
compared with the six physics classes and in a separate calculation,
the six treatment classes were compared with the six chemistry
control classes.
School, Student and Teacher Characteristics
School Characteristics
The Portland, Oregon, Metropolitan Area has historically taken
an active role in propagating new curriculum developments in
57
secondary school science. A variety of pilot programs continue to be
introduced into the schools which have been originated by local and
national committees. Just prior to the 1963 -64 school year when
this study was undertaken most of the secondary schools were either
fully committed to experimentation in science and mathematics course
offerings or moving in that direction.
Of the five schools taking part in this study two were suburban
schools and three were within the Portland, Oregon, city limits.
Student Characteristics
To make comparisons in students' ability, educational experience
and support from home; information in narrative and tabular form is
presented on their I. Q. , academic experiences, grade level and
parents' occupations.
Table II. Mean Grade Placement of Students in Treatment and Control Classes
A survey of student characteristics such as I. Q. , grade place-
ment, educational experience in science and mathematics and paren-
tal background make possible the following generalizations about
populations taking part in this experiment.
73
1. The mean I. Q. of treatment students is not greater than
the mean I. Q. of the chemistry control students and
physics control students.
2. The mean grade placement of students who comprise the
treatment classes is equal to that of students in the chem-
istry control classes but somewhat less than that of students
who make up the physics control classes.
3. The mean science preparation of students in treatment
classes prior to the onset of this study was approximately
0. 6 years per student less than the physics control students
but about 0. 3 of a year greater than the chemistry control
students.
4. The mathematics preparation of students who comprise the
treatment classes is approximately 0. 8 years per student
less than the physics control students but 0. 1 years greater
than the chemistry control classes.
5. There appears to be very little difference in occupations of
parents whose children make up the treatment and control
classes.
The following statements appear to be valid generalizations about
the teachers who gave instruction to the treatment and control classes.
1. Subject matter preparation of treatment teachers in physics
74
is substantially lower than their counterparts in the physics
control classes, but about equivalent to the chemistry and
mathematics preparation of control teachers.
2. The mean experience level of treatment teachers in chemis-
try is approximately 0. 8 years less than control chemistry
teachers. Their experience in teaching physics is likewise
substantially lower than the physics control teachers. The
experience of each group in mathematics teaching is about
the same.
3. Institute preparation of teachers to prepare them in the new
curricula favors the control teachers in both chemistry and
physics.
75 CHAPTER IV
PRESENTATION AND INTERPRETATION OF DATA
The purpose of this study is to compare in selected outcomes the
effectiveness of integrated chemistry- physics courses with chemistry
and physics courses taught separately. Experimental and control
groups were evaluated in terms of gains in subject matter achieve-
ment, critical thinking abilities and attitudes toward science.
Three of six treatment classes studied the CBA - PSSC integrated
course, the remainder studied the CHEMS - PSSC integrated course.
Three of six chemistry control classes studied CBA chemistry, the
remaining three studied the CHEMS chemistry course while six
PSSC physics classes served as physics control classes.
To assess the educational value students derived from these
courses, the differences between the posttest scores and pretest
scores were calculated on criterion instruments; then the paired
t -test was applied to the mean of these differences using each class
as an observation. Thus six observations constituted each of the
three samples that were drawn from the larger populations.
Critical Thinking
To evaluate comparative gains in critical thinking, alternate
forms of the Watson -Glaser Critical Thinking Appraisal were admin-
istered to all students, the YM Form as a pretest instrument and the
ZM Form as a posttest instrument.
76
Table X summarizes treatment and chemistry control class
performance on these instruments; the means, standard deviations
and confidence intervals are given. Differences in performance be-
tween treatment and chemistry control classes are more evident
when Table XI is constructed from data given in Table X. Contrast-
ing the gains in raw scores among treatment and chemistry control
classes reveals that four times out of six the treatment classes sur-
passed the control classes.
The hypothesis was tested that there is no significant difference
in gains made by the six treatment classes as compared with the six
chemistry control classes. With five degrees of freedom t must
equal 2. 571 in order to claim a significant difference in mean gain
at the five percent level. Calculation of t yielded 1.00. The result
suggests that the integrated physics- chemistry courses do not signif-
icantly enhance critical thinking abilities beyond the level achieved
by the separate chemistry courses.
Table XII summarizes student performance on the critical think-
ing appraisal for treatment classes and physics control classes.
Means, standard deviations and confidence intervals are presented.
Differences in performance between treatment and physics control
classes are more apparent when Table XIII is constructed from data
given in Table XII. Five times out of six the mean gain in raw scores
favor the treatment classes.
Table X. Means, Standard Deviations and Confidence Intervals of Treatment and Chemistry Control Classes on the Watson -Glaser Critical Thinking Appraisal
and draw conclusions based on evidence should be separated
from one another and analysis of data relative to these
specific abilities should be studied.
7. Achievement test items should be constructed that intersect
both chemistry and physics. These should be used together
with items that test achievement in the separate disciplines
to assess cognitive gains that result from exposure to the
combined and non - integrated courses.
101
BIBLIOGRAPHY
1. Alcorn, Marvin D., and James M. Linley (eds.) Issues in curriculum development. New York, World Book Company, 1959. 420 p.
2. Allen, Hugh, Jr. Attitudes of certain high school seniors toward science and scientific careers. New York, Columbia Teachers College, Columbia University, 1959. 53 p.
3. Anderson, Vernon E. Principles and procedures of curriculum improvement. 2nd ed. New York, The Ronald Press, 1962. 513 p.
4. Beauchamp, George A. Curriculum theory. Illinois, Wil- mette, The Kagg Press, 1961. 149 p.
5. Behnke, Frances L. Reactions of scientists and science teach- ers to statements bearing on certain aspects of science and science teaching. School Science and Mathematics 61:193 -207. 1961.
6. Buros, Oscar Krisen (ed.) The fifth mental measurement year- book. Highland Park, The Gryphon Press, 1959. 1292 p.
7. Caswell, Hollis L. et al. Curriculum improvement in public school systems. New York, Columbia University, 1950. 462 p.
8. Cheldelin, Vernon H. and Michael Fiasca. A synthesis of the new curricula in physics and chemistry for the secondary school. Journal of Research in Science Teaching 2 :283 -288. 1964.
9. Cheldelin, Vernon H. et al. Physics- chemistry: a two -year sequence. Portland, Oregon, Portland Curriculum Center, 1964. 117 p.
10. Cheldelin, Vernon H. et al. Teachers guide for physics -chem- istry: a resource book for a two -year course. Portland, Portland Curriculum Center, 1964. 170 p.
11. Chemical Bond Approach Committee and Educational Testing Service. Achievement Tests. Princeton, Educational Testing Service, n. d. , 8 vols.
102
12. Chemical Bond Approach Committee. Chemical systems. St. Louis, McGraw -Hill, 1964. 772 p.
13. Chemical Education Material Study Committee and Educational Testing Service. Achievement tests. Princeton, Educational Testing Service, 1963. 7 vols.
14. The Portland Project, Committee on the Integration of CBA and PSSC. Chemical Bond Approach - Physical Science Study Committee teachers guide: physics- chemistry. Portland, Oregon, Portland Curriculum Center, 1963. 84 p.
15. The Portland Project, Committee on the Integration of CBA and PSSC. Chemical Bond Approach - Physical Science Committee student guide: physics- chemistry. Portland, Oregon, Portland Curriculum Center, 1963. 92 p.
16. Conant, James Bryant et al. The identification and education of the academically talented student in the American secondary school. Washington, National Education Association, 1958. 160 p.
17. Darrell, Bernard J. Special problems in high school science education. National Association of Secondary School Principals Bulletin 37:178 -183. Jan. 1953.
18. Doll, Ronald C. Curriculum improvement: decision making and process. Boston, Allyn and Bacon, 1964. 337 p.
19. Downing, Elliot R. Some results of a test on scientific thinking. Science Education 20:121 -128. 1936.
20. Dull, Charles E., H. Clark Metcalfe and William O. Brooks. Modern physics. New York, Henry Holt, 1955. 712 p.
21, Dull, Charles E. , H. Clark Metcalfe and John E. Williams. Modern chemistry. New York, Holt, Rinehart and Winston, 19 62 . 694 p.
22. Ferris, Frederick L. , Jr. et al. Tests of the physical science study committee. Princeton, Educational Testing Service, 1959. 10 vols.
23. Freden, Gustaf. The course as a unit of teaching. School and Society 40:773 -775. 1934.
103
24. Fuller, Edward C. and R. Ronald Palmer. Teaching physics and chemistry in a combined course. Beloit, Wisconsin, Beloit College, 1961. 40 p.
25. Gage, N. L. (ed.) Handbook of research on teaching. Chicago, Rand McNally, 1963. 1218 p.
26. Gwynn, J. Minor. Curriculum principles and social trends. New York, MacMillan, 1960. 695 p.
27. Heath, Robert W. (ed.) New curricula. New York, Harper and Row, 1964. 292 p.
28. Heidel, Robert H. A comparison of the outcomes of instruction of the conventional high school physics course and the generalized high school senior science course. Science Education 28:88 -89. 1944.
29. Henry, Nelson B. (ed.) Rethinking science education; yearbook of the National Society for the Study of Education. vol. 59. Pt. 1. Chicago, University of Chicago Press, 1960. 344 p.
30. Howe, Robert Wilson. The relationship of learning outcomes to selected teacher factors and teaching methods in tenth grade biology classes in Oregon. Ph. D. thesis. Corvallis, Oregon State University, 1964. 263 numb. leaves.
31. Lerner, Morris R. Intergrated science: physics and chemistry. Science Teacher 31 :37 -38. Feb. 1964.
32. Li, Jerome C. R. Introduction to statistical inference. Ann Arbor, Edwards Bros. , 1961. 568 p.
33. Malm, Lloyd E. (ed.) Chemistry: an experimental science. 3d ed. San Francisco, The Freeman Company, 1962. 466 p.
34. Malm, Lloyd E. (ed.) Laboratory manual for chemistry: an experimental science. San Francisco, The Freeman Company, 1963. 137 p.
35. Martens, Mary Christine. Analysis and interpretation of student and teacher opinions preparatory to the development of a two - year integrated chemistry -physics course for secondary school girls. Master's thesis. St. Louis, St. Louis University, 1965. 98 numb. leaves.
104
36. McKibben, Margaret J. The study of new developments in secondary school science - grades 7 -12. Science Education 45:403 -409. 1961.
37. McNally, Harold J. et al. Improving the quality of public school programs. New York, Columbia University Teachers College, 1960. 331 p.
38. Morrison, Henry C. The curriculum of the common school. Chicago, University of Chicago, 1940. 681 p.
39. Noll, Victor H. What about integration in science? School Science and Mathematics 41:241 -243, 1941.
40. Otis, Arthur S. Manual of directions for Gamma test. New York, World Book, 1954. 4 p.
41. Passow, Harry A. (ed.) Curriculum crossroads. New York, Columbia University Teachers College, 1962. 123 p.
42. Physical Science Study Committee. Laboratory guide for physics. Boston, D.C. Heathand Company, 1960. 87 p.
43. Physical Science Study Committee. Physics. Boston, D. C. Heath and Company, 1961. 656 p.
44. Rueck, Elizabeth and William Korth. Chemistry -physics combination: a unified approach. Barrington, Illinois, Barring- ton High School, 1963. 21 p.
45. Rueck, Elizabeth and William Korth. Chemistry -physics com- bination program developed by Elizabeth Rueck and William Korth. Merit Fellow Newsletter 7 :1 -3. May 1963.
46. Rust, Velma. Factor analysis of three tests of critical thinking. The Journal of Experimental Education 29 :177 -181. 1960.
47. Sand, Ole. The principals look at the schools. A status study of selected instructional practices. Washington, D.C., National Education Association, 1962.
48. Schilling, Harold K. On the meaning of interdisciplinary. Teaching physics and chemistry in a combined course. Beloit, Wisconsin, Beloit College, 1961. 40 p.
105
49. Slesnick, Irwin L. The effectiveness of a unified science in the high school curriculum. Journal of Research in Science Teaching 1:302 -315. 1963.
50. Sibley, R. P. Orientation courses. School and Society 40:373- 377. 1934.
51. Smith, Othanel B., William O. Stanley and J. Harland Shores. Fundamentals of curriculum development. Rev. ed. Yonkers - on- Hudson, New York, World Book Company, 1957. 685 p.
52. Strong, Lawrence E. (ed.) Investigating chemical systems. St. Louis, McGraw -Hill, 1963. 135 p.
53. Taba, Hilda. Curriculum development: theory and practice. New York, Harcourt, Brace and World, 1962. 529 p.
54. Tyler, Ralph W. The organization of learning experience. In: Toward improved curriculum theory, ed. by Virgil E. Herrick and Ralph W. Tyler. Chicago, University of Chicago Press, 1950. p. 59 -67. (Supplementary Education Monographs no. 71.)
55. U.S. Employment Service. Dictionary of occupational titles. 2d ed. vol. 2. Washington, 1949. 743 p.
56. Watson, Goodwin and Edward Maynard Glazer. Critical thinking appraisal: manual. New York, World Book Company, 1952. 12 p.
57. Wellington, C. Burleigh and Jean Wellington. Teaching for critical thinking. New York, McGraw -Hill, 1960. 364 p.
58. Wise, Harold E. An integration of physics and chemistry. Science and Education 20:68 -72. 1936.
59. Zacharias, Jerrold R. et al. Innovation and experimentation in education. Washington, D.C., The President's Science Advisory Committee, March 1964. 79 p.
APPENDICES
106
APPENDIX A
107
TEACHER QUESTIONNAIRE
A. Name School
Age Subject(s) taught in Pilot Study
B. Training
1. Total semester hours of preparation in science 2. Total semester hours of preparation in chemistry 3. Total semester hours of preparation in physics 4. Total semester hours of preparation in mathematics 5. Have you had preparation in a teacher training institute in one or more
of the following? Please check the appropriate box or boxes.
D PSSC D CBA D CHEMS
6. Degrees - please circle and give the date the degree was granted.
1. Total number of years you taught chemistry 2. Total number of years you taught CBA or CHEMS
3. Total number of years you taught physics 4. Total number of years you taught PSSC
5. Total number of years you taught mathematics
D. Professional Activities and Interests
1. Please list the professional organizations to which you belong.
2. Please list the publications you read regularly.
3. Please list other professional activities.
108
STUDENT QUESTIONNAIRE
Name Date Last First Middle
Age Sex M F Grade 9 10 11 12
Circle one
School Teacher Course CBA CHEM PSSC PC
Circle one
Father's Occupation Mother's Occupation
School subject most liked
School subject least liked
Courses you have had in Science
General Science
Physical Science
Biology I
Chemistry
Physics
Electronics
Biology II
other
Courses you have had in Mathematics
General Mathematics
Algebra I
Algebra II
Geometry
Trigonometry
Number Theory
Calculus
other
109
CHEM STUDY ACHIEVEMENT TEST
You will be given 45 minutes to work on this test. There are several different types of questions. You will find special directions for each type inside the test book. Be sure you understand the directions before attempting to answer any questions.
It is not expected that everyone will finish all the questions in the time allowed. Work steadily and as quickly as you can without sacrificing accuracy. If a question seems too difficult, make the most careful guess you can, rather than waste time puzzling over it.
YOU ARE TO INDICATE ALL YOUR ANSWERS ON THE SEPARATE ANSWER SHEET ENCLOSED IN
THE TEST BOOK. You may use any blank spaces in the book for scratchwork, but no credit will be given for anything written in the test book. After you have decided which of the suggested answers
you want to give for a question, blacken the space between the dotted lines under its letter on the answer sheet, using only the special electrographic pencil.
Example:
I. Chicago is a
(A) state (B) city (C) country (D) continent (E) village
Sample Answer
A B C D E
I H 1 II H II
Mark only one space on the answer sheet for each question; no credit will be given for a question if more than one space is marked. If you wish to change an answer, erase your first line completely and mark your new choice. Be careful not to make stray marks on your answer sheet.
DO NOT OPEN THIS BOOK UNTIL YOU ARE TOLD TO DO SO
Questions 1 and 2 refer to the following situations:
An electrical force of 1 unit exists between two spheres which have a charge of 1 electrical unit each, when the centers of the spheres are 1 cm. apart.
An electrometer contains two spheres having charges of +2 and +3 electrical units, respectively. They are suspended as shown in the figure below.
Centimeter Scale Figure 1
1. If the centers of the spheres are 2 cm. apart, the electrical force between the spheres will be
(A)
(B)
(C)
(D)
(E)
2x3 2
2x3 2
2x3 2x2
2x3 2x2
2+ 3
2
units of force,
units of force,
units of force,
units of force,
units of force,
attraction
repulsion
attraction
repulsion
repulsion
110
Another electrometer contains spheres with charges of +8 and +3 electrical units, re- spectively, and the distance between their centers is 4 cm.
Centimeter Scale Figure 2
2. What is the ratio of the electrical force between the spheres in Figure 1 to the electrical force between the spheres in Figure 2?
(A) 1:4 (B) 1:2 (C) 1:1
(D) 2:1
(E) 4:1
GO ON TO THE NEXT PAGE
Questions 3 - 6 pertain to the following informa- tion regarding the element sulfur.
Atomic number = 16
Atomic weight = 32. 1
Mass number of the most abundant isotope of sulfur = 32
3. A neutral atom of an isotope of sulfur other than the most abundant isotope may contain
4. The assignment of the value 32.1 rather than 32 for the atomic weight of sulfur is based on which of the following assump- tions?
(A) All sulfur atoms contain the same number of protons and electrons.
(B) All sulfur atoms contain the same number of neutrons.
(C) Some sulfur atoms contain whole numbers of protons but fractional numbers of neutrons.
(D) The electrons in the sulfur atom have negligible mass.
(E) The proportion of various isotopes is
constant in a stable sample of sulfur.
111
5. In a molecular weight determination, a given volume of sulfur vapor was found to weigh 2. 0 grams and the same vol- ume of oxygen, 02, under the same conditions of temperature and pressure weighed O. 250 grams. On the basis of these data the molecular weight of sulfur is most likely
6. Two moles of silver atoms (atomic weight 107. 9) combine with one mole of sulfur atoms to form a mole of the compound, silver sulfide. What is the weight of a mole of silver sulfide?
(A) 123.9 grams (B) 140.0 grams (C) 247.9 grams (D) 280. 0 grams (E) None of the above
GO ON TO THE NEXT PAGE
tit Questions 7 - 9 deal with the following experiment relating the pressures and temperatures of some
samples of gases. Some helium gas was placed in a flask to which was attached a mercury man- ometer. The following pressures were observed by placing the flask in four different temperature baths.
Pressure in mm. of mercury 750 mm. 820 min. 1020 mm. 1300 mm. Temperature in °C 0° 25° 100° 200°
The data are plotted on the graph below.
1500
ao
1000
500 ul
-300 -200 -100 0 100 Temperature, °C
7. Since the above graph indicates that the pressure changes linearly with the temper- ature, it is possible to use the apparatus as
a gas thermometer and predict the temper- ature at various pressures. When the pressure is 375 mm. Hg, the temperature is approximately
(A) -60 °C (B) -105 °C (C) -135 °C
(D) -165 °C (E) -273 °C
8. Which of the following statements is FALSE?
(A) The point on the graph representing the temperature at zero pressure (extrapolated) is defined as zero on
the absolute temperature scale. The behavior of helium gas is found
to be very close to that of a perfect gas in the range tested.
The translational motion of the gas
molecules at -273 °C becomes zero.
If the temperature of the sample is
increased from 125 °C to 250 °C the pressure will be doubled.
The pressure is directly proportional to the temperature when the tempera- ture is expressed in degrees Kelvin or degrees absolute.
200 300
9. The experiment is repeated, using nitrogen gas at a pressure of 750 mm. Hg at 0 °C. Which of the following is
FALSE?
(A) If additional gas is added to the container and the experiment repeated, the entire curve would be expected to be higher but parallel to the one shown.
(B ) At any given temperature the nitrogen molecules would be moving with a lower average velocity than the helium mole- cules.
(C) At 0 °C the average kinetic energy of the nitrogen molecules is the same as the average kinetic energy of the helium molecules.
(D) The temperature at zero pressure (extrapolated) would be essen- tially the same for nitrogen as
for helium. (E ) The graph would be essentially
the same as for helium.
GO ON TO THE NEXT PAGE
(B)
(C)
(D)
(E)
: $i ;;=Qi1.i::= é' :ii:iii1:Ciii a.
E ::::e.aé::s::::: Ci =u: ::i1C mum ::::i 11BB111B111e==Nr.....
Tiiiii.....a..
1'3
Questions 10 -11 relate to the table below which shows the results of mixing a few milliliters of 0. 1 M solution of each of five substances with a few milliliters of 0. 1 M solution of each of the other substances, one at a time. "Ppt. " indicates that a precipitate formed, and "none" indicates that no visible reaction occurred.
NaNO3 sodium nitrate
K2SO4 potassium sulfate
Pt (CH3COO)2 lead acetate
Pb(NO3)2 lead nitrate
NaC1
sodium chloride
none none ppt. ppt.
Pb (NO3)2 lead nitrate
none ppt. none
Pb (CH3COO)2 lead acetate
none ppt.
K2SO4 potassium sulfate
none
10. A correct interpretation of the above data indicates the slight solubility of
(A) PbC12 only (B) PbC12 and PbSO4 only (C) PbC12, PbSO4, and NaCH3COO only (D) PbC12, KCH3COO, and KNO3 only (E) KCH3COO, KNO3, PbSO4, and
NaCH3COO only
11. Which of the following pairs of sub- stances would you predict would NOT produce a precipitate when equal volumes of their 0. 1 M solutions are mixed?
(A) Pb(NO3)2 (aq) and Na2SO4 (aq) (B) Pb(NO3)2 (aq) and KCH3COO (aq) (C) Pb(NO3)2 (aq) and KC1 (aq) (D) Pb(CH3COO)2 (aq) and HC1 (aq) (E) Pb(CH3COO)2 (aq) and K2SO4 (aq)
GO ON TO THE NEXT PAGE
Questions 12 -14 refer to the following situation.
A sealed ampule full of ether is placed in a flask containing air at a pressure of 740.0 mm. of mercury. The flask is connected to a mercury manometer (pressure gauge) as shown below. After the ampule is broken and the system is allowed to come to equilibrium at room tempera- ture, the total pressure indicated by the man- ometer is 803. 0 mm. Hg.
glass rod
Flask 1 a
glass rod
Flask 1 b
12. What is the partial pressure exerted by the gaseous ether molecules?
(A) 63 mm. (B) 677 mm. (C) 740 mm. (D) 760 mm. (E) 803 mm.
helium gas and air
Hg Hg Hg Hg Hg
Level 2
Flask 2
Flask 2, identical to flask 1, is con- nected to a manometer, and helium gas is forced in until the pressure of air and helium in flask 2 is exactly equal to the pressure of air and ether vapor in flask 1 b.
?14
13. If the temperature of both flasks is raised 10 °C, what will happen to levels 1 b and 2?
(A) Neither level will change. (B) Both levels will rise the same
amount. (C) Level 1 b will remain unchanged
but level 2 will rise. (D) Both levels will rise but level 1 b
will rise more than level 2.
(E ) Both levels will rise but level 2
will rise more than level 1 b.
14. After the manometer is disconnected from flask 1 b, the flask is heated until ether vapor has driven all the air out of the flask. Then the flask is sealed and the vapor is allowed to come to equi- librium with the remaining liquid at room temperature. Which of the fol- lowing statements is FALSE?
(A) The pressure in the flask would be the same as the partial pressure of ether in question 28.
(B ) Ether molecules are entering the gas phase at the same rate that ether molecules are condensing to the liquid phase.
(C) The potential energy of the gas phase molecules is higher than the potential energy of the liquid phase molecules.
(D) If the temperature of the system were increased, the pressure in the flask would be increased.
(E) All the ether molecules have the same kinetic energy.
GO ON TO THE NEXT PAGE
Level la
Questions 15 -17 relate to the following graph which represents the potential energy diagram for the reaction:
Heat + 2NH3 (g) = N2 (g) + 3H2(g)
Reaction Coordinate Reactant -a- Products
The curves represent two possible paths for the reaction. One is for a non -catalyzed reaction and the other is for a catalyzed reaction.
15. One can correctly conclude from the above graph that the heat of the reaction corre- sponds to the interval labeled
(A) A
(B) B
(C) C 17. The activation energy for the catalyzed (D) D reaction corresponds to the interval (E) E labeled
16. The activation energy for the non- catalyzed reaction corresponds to the interval labeled
(A) A
(B) B
(C) C
(D) D
(E ) E
(A) A
(B) B
(C) C
(D) D
(E ) E
GO ON TO THE NEXT PAGE
80
\
bFTOz /11 \
w ó a)
ó / \
p, x /
0
2NH 3
B
E
---y-- N2 + 3H2
11.5
Questions 18 - 21 are concerned with the following reaction:
2S0 + 2(g)
O2(g) = 2S03(g) + 45 kcal
18. Which one of the following sets of conditions would produce the greatest number of moles of SO3 (g) at equi- librium?
Pressure Temp. Initial Moles of
SO2 02
(A) 1 atm. 400 °K 1 1
(B) 10 atm. 400 °K 1 1
(C) 10 atm. 500 °K 2 2
(D) 100 atm. 400 °K 2 2
(E) 100 atm. 500 °K 1 2
19. If 64 grams of SO2(g) reacts completely, how many moles of SO3(g) would be formed? (Atomic weights: Sulfur = 32, Oxygen = 16. )
21. If 40 liters of SO2(g) reacts completely to form SO3 (g), how many liters of oxygen gas, measured at the same conditions of temperature and pressure, would be used?
23. In the process of the conduction of electricity by an aqueous solution, using a direct current, which one of the fol- lowing is FALSE?
(A) Cations and anions move in oppo- site directions.
(B ) Electrons are liberated by one electrode and taken up by the other electrode.
(C) The total number of positive charges must always be equal to the total number of negative charges.
(D) The number of cations is always found to be equal to the number of anions.
(E ) Chemical changes take place at the electrodes.
GO ON TO THE NEXT PAGE
Questions 24 - 27 relate to the apparatus illustrated below.
Ni (s)
voltmeter
Pb (s)
/ \
Ni+2
NO3 - Pb+2 NO3
A s S( )
Ag
+-J NO3
Each of the beakers contains a 1 M nitrate solution of the metal used as an electrode in the beaker. The half -cell reactions, with E° values and the relevant atomic weights are:
Ni(s) =Ni+2+2e
Pb(s) = Pb+2+ 2 e
Ag(s) = Ag+ + e
Metal
É = +0. 25 volt
E° = +0.13 volt
É = -0.80 volt
Atomic Weight
Ni 58. 7
Pb 207. 2
Ag 107.9
i
24. When the voltmeter is connected between the Ni and Pb electrodes it reads 0.12 volt. After 0. 01 mole of electrons have passed through the voltmeter the mass of the nickel electrode in the left -hand beaker will be
25. If the voltmeter is connected between the Ni and the Ag electrodes, it will read
(A) 0.12 volt (B) 0. 25 volt (C) 0.55 volt (D) 0.80 volt (E) 1.05 volts
26. With the voltmeter still connected be- tween the Ni and the Ag electrodes, current is allowed to flow through the cell until the mass of the nickel elec- trode has changed by 0.59 gram. During this time, the mass of the silver elec- trode will
(A) increase by 0.59 gram (g. )
(B ) increase by 1.08 g.
(C) increase by 2.16 g.
(D) decrease by 0.59 g.
(E) decrease by 2.16 g.
27. Based on the information given above, in which of the following cases would a
spontaneous reaction be expected to take place between the metal and the solution paired with it?
Ag(s), Ni+2 (aq) Pb(s), Ag (aq) Pb(s), Ni+2 (aq)
Ag(s), Pb+2 (aq) Ni(s), Pb+2(aq)
(A) V only (B) I and II only (C) I and V only (D) II and V only (E) I, III, IV only
GO ON TO THE NEXT PAGE
I /
O O
I.
II. III. IV.
V.
Questions 28 - 29 deal with the nuclei of hydrogen atoms. The following spectrum was obtained from a mass spectrograph experiment using a
sample of hydrogen gas. Due to the presence of a second isotope (deuterium D), five gaseous ions were produced; H2+, HD +, D2 +, H +, and D +. The atomic weight of deuterium is 2.
Ion Source I II III IV
28. Which two of the five positively charged ions would form a spectral line at position II?
34. The hydrogen carbonate ion, HCO3 , may, in water solution, act as either an acid or a base. An equation for a reaction in which it is acting as an acid is
(A) HCO3 ( aq) + H20 = H2CO3 ( aq) + OH ( aq)
(B) HCO3 (aq) + H20 = CO3-2(aq) + H30+(aq)
(C) HCO3 ( aq) + H3+ ( aq) = CO2(g) + 2H 20
(D) HCO3 (aq) + OH (aq) = H2CO3 ( aq) + 0-2(aq)
(E ) HCO3 ( aq) + CH3COOH ( aq) = CO2 ( g) + H20 + CH3COO- ( aq)
35. 0. 100 mole of solid sodium carbonate, Na2CO3 (s) is added to 1.00 liter of a solution of 0. 400 M hydrochloric acid, HC1. After the solution is warmed to expel the carbon dioxide gas, CO2(g), the resulting hydronium ion, H3O +, concentration will be
(A) 0. 050 M
(B) 0.100 M
(C) 0. 200 M
(D) 0. 300 M
(E ) 0. 400 M
120
CBA ACHIEVEMENT TEST
You will be given 45 minutes to work on this test. There are several different types of questions.
You will find special directions for each type inside the test book. Be sure you understand the
directions before attempting to answer any questions.
It is not expected that everyone will finish all the questions in the time allowed. Work steadily
and as quickly as you can without sacrificing accuracy. If a question seems too difficult, make the
most careful guess you can, rather than waste time puzzling over it.
YOU ARE TO INDICATE ALL YOUR ANSWERS ON THE SEPARATE ANSWER SHEET ENCLOSED IN
THE TEST BOOK. You may use any blank spaces in the book for scratchwork, but no credit will be
given for anything written in the test book. After you have decided which of the suggested answers
you want to give for a question, blacken the space between the dotted lines under its letter on the
answer sheet, using only the special electrographic pencil.
Example:
I. Chicago is a
(A) state (B) city (C) country (D) continent (E) village
Sample Answer
A B C D E
I II I II II II
Mark only one space on the answer sheet for each question; no credit will be given for a question
if more than one space is marked. If you wish to change an answer, erase your first line completely
and mark your new choice. Be careful not to make stray marks on your answer sheet.
DO NOT OPEN THIS BOOK UNTIL YOU ARE TOLD TO DO SO
121
Questions 1 -3 relate to the following 2. What will be the force between objects information.
By convention, the charge acquired by a
glass rod which has been rubbed with a cloth is
called positive ( +). A student possessing five charged objects (I, II, III, IV, V) performs some experiments and records the following data.
I repels glass charged with a cloth but attracts IV.
II attracts V but repels III.
IV repels II.
The force between I and II is 1 unit when they are 4 cm. apart.
The force between II and III is 8 units when they are 1 cm. apart.
1. Which of the following can the student correctly conclude regarding the signs of the charges on the objects?
(A) I, V positive; II, III, IV negative (B) I, II positive; III, IV, V negative (C) II, III positive; I, IV, V negative (D) I, III, V positive; II, IV negative (E) None of the above
I and II when they are 1 cm. apart? 1
(A) 4 unit
(B) 4 units
(C) 8 units
(D) 16 units
(E) None of the above
3. What is the ratio of the charge on I to the charge on III?
(A) 4:1
(B) 2:1
(C) 1:1
(D) 1:2 (E) None of the above
GO ON TO THE NEXT PAGE
4
Questions 4 - 9 relate to a reaction of NO with 02 which goes to completion rapidly.
1. 1
1.0
0. 9
ca 0. 8 Ë'o
0. 7 w
8 0.6 o á0.5 N
CS 0. 4
° 0.3
0. 2
0 1
0 0
GRAPH SHOWING AMOUNT OF NO ADDED
AND AMOUNT OF NO2 PRODUCED AT 100 °C WHEN A LIMITED SUPPLY OF 02 IS AVAILABLE
O
O
CO A A
o e
O
O
O
0.1 0 2 0.3 0.4 0.5 06 07 08 09 1 0
Amount of NO added, grams
4. If NO2 is the only product, which of the following is the chemical equation for the reaction between NO and 02?
(A)
(B)
(C)
(D)
(E )
NO + 02 - NO2
NO + 202 NO2
2NO + 0 2
2NO2
2NO + 202 -- 2NO2
None of the above
5. When 0. 60 gram of NO is mixed with suf- ficient oxygen to react completely, the amount of NO2 produced is most nearly
takes place in a calorimeter which re- quires 1050 calories to raise its tempera- ture 1. 0 °C. If the temperature of the calorimeter is raised 0. 20 °C by the reaction, then the amount of heat pro- duced per gram of NO2 formed is most nearly
(A) The maximum quantity of 02 that would react with any quantity of NO under any conditions is 0. 32 g.
(B ) The maximum quantity of NO that would react with any quantity of 02 under any conditions is 0. 60 g.
(C) The ratio of the amount of NO2 formed to the amount of oxygen reacted is not constant within experimental error.
(D) The amount of NO2 formed per unit of time is doubled when the temperature is doubled.
(E ) The amount of NO reacting is always about twice as great as the amount of 02 reacting.
N
? 0
... . -
Questions 10 -13 relate to several samples of dry air, each of which is composed of 79%
nitrogen, 20% oxygen, and 1% argon by volume. (Molecular weights: N2 = 28,
02 = 32, Ar = 40)
10. At constant temperature, the pressure on the first sample of dry air is doubled. This results in a doubling of the
(A) percent by volume of oxygen in the sample
(B) average kinetic energy of the molecules (C) average velocity of the molecules (D) density of the sample (E) volume occupied by the dry air
11. At constant pressure, the absolute tempera- ture of the second sample of dry air is doubled. This results in a doubling of the
(A) percent by volume of oxygen in the sample
(B) average kinetic energy of the molecules (C) average velocity of the molecules (D) density of the sample (E) number of molecules per milliliter
12. At constant volume, the absolute tempera- ture of the third sample is doubled. As a
result the
(A) pressure of the sample will be doubled (B) density of the sample will be doubled (C) sample will liquefy (D) oxygen and nitrogen molecules will
tend to split into two equal parts, O and N, respectively
(E) argon will tend to form diatomic molecules, Ar2
123
13. Suppose that the argon molecules are removed from the fourth sample of dry air and are replaced by an equal number of nitrogen molecules. If no other change is made, then the value of which of the following will be greater for the new gas mixture than it was for the original dry air?
(A) The percent by volume of oxygen (B) The average kinetic energy of the
molecules (C) The average velocity of the
molecules (D) The density (E) The time required for a given
number of molecules to effuse through a pinhole
GO ON TO THE NEXT PAGE
Questions 14-17 relate to the following bond energies.
H-H Cl-Cl H-Cl
104. 2 kcal /mole 58. 0 kcal /mole
103. 2 kcal /mole
14. On the basis of these data what is the activa- tion energy in kcal /mole for the reaction represented by the equation, H2 + Clr 2 HCl?
(A) (B) (C) (D)
(E)
58.0 104. 2
132.7 162. 2
It is impossible to determine the activa- tion energy without further informa- tion about the reaction.
15. Activation energy is
(A) equal to one half the sum of the bond energies of the reactants and the products
(B) always equal to the lowest bond energy of any of the reactants and products
(C) related to reaction pathway (D) equal to the sum of the bond energies of
the reactants (E) never related to bond energies of the
reactants
I 24
Questions 16 -17: Using hot and cold water, a
student finds that the "calorimeter constant" of a certain calorimeter is 20 calories per degree.
16. If 80 grams of water at 28 °C is poured into the empty calorimeter which is at 18 °C, the final temperature will be
(A) 20 °C (B) 23 °C (C) 24 °C (D) 25 °C (E) 26 °C
17. If 50 grams of methyl alcohol (specific heat = 0. 60 cal /gram /degree) at 28 °C is poured into the empty calorimeter which is at 18 °C, the final temperature will be
(A) 20 °C (B) 22 °C (C) 23 °C (D) 24 °C (E) 26 °C
GO ON TO THE NEXT PAGE
Questions 18 - 21 relate to a new temperature scale, graduated in degrees N. The reading 0 °N corresponds to 0 °K, and the reading 100 °N corresponds to 273 °K (the freezing point of water).
18. The boiling point of water would be most nearly
19. Which of the lettered curves in the above graph correctly represents the relationship which would exist between the volume of a gas and its temperature in degrees N?
(A) A
(B) B
(C) C
(D) D
(E) E
125
20. One calorie is defined as the amount of heat required to raise the temperature of 1 gram of water by 1 degree centigrade. The number of calories required to raise the temperature of 5 grams of water by 20 °N would be most nearly
(A) 100 (B) 200 (C) 300 (D) 400 (E) 500
21. If the temperature of a sample of gas
were changed from 50°N to 49 °N, at constant pressure, the volume would
(A) increase by 1%
(B) decrease by 1%
(C) increase by 2%
(D) decrease by 2%
(E) increase by 5%
Question 22 relates to the following reactions which are all exothermic.
1. CH4 + 202 -.CO + 2
2H2O
2. 1 /2C + 1/20 2
--4-1/2C0 2
3. CH4 + 02- C + 2H2
4. C +O2- CO2
22. According to the data given, which reaction liberates the most energy?
(A) 1
(B) 2
(C) 3
(D) 4
(E ) It cannot be determined from the data given.
GO ON TO THE NEXT PAGE
A
2
\
Ene
rgy
(kilo
calo
ries
per
mol
e)
126
Directions: Each of the questions or incomplete statements below is followed by five suggested answers or completions. Select the one which is best in each case and then blacken the correspond- ing space on the answer sheet. Within each group of questions, information derived from some may be needed to answer others.
Questions 23 - 25 relate to the following energy diagrams.
100 -
80 -
60
40 -
Reaction I Reaction II
20 -
Reaction pathway --+ Reaction pathway
23. It can be correctly concluded from the 25. For reaction II, the activation energy in energy diagrams that
(A) only reaction I is exothermic (B ) only reaction II is exothermic (C) both reactions I and II are exothermic (D) both reactions I and II are endothermic (E ) neither reaction I nor reaction II is
exothermic
24. For reaction I, the over -all reaction energy (QH) in kcal /mole is
(A) -50 (B) -30 (C) -10 (D) +10 (E) +30
kcal /mole is
(A) -30 (B) +30 (C) +40 (D) +70 (E) +80
GO ON TO THE NEXT PAGE
F loo
80
60 0
40
g 20
-.-
127
Questions 26 - 29 involve the determination of the energy of the bond holding the carbon atoms together in acetylene, C2H2 . (The Lewis structure of acetylene is H : C : : : C : H)
(g)
The necessary values for AH (at 25 °C and 1 atmosphere) are:
Reaction energy of formation of C2H2
(g) Energy of sublimation of C
(s)
Dissociation energy of hydrogen
Bond energy of C -H
26. The correct form of the equation for which AH is 54 kcal /mole is
(A) 2C(g) + 2H(g)- C2H2
( g)
(B ) 2C(s) + 2H(g)_ . C2H2
(g)
(C) 2C (s)
H
2
- C H (s)
(g) 2
2(g)
(D) C + 1/2H - 1/2C H (s) 2(g) 2 2(g)
(E) C2H6 - C2H2 + 2H2
(g) (g) (g)
27. The most desirable form of the equation for determining the bond energies in C2H2 is
(A) C2H2 2C(g) (g)
+ 2H(g)
(g)
(B) C2H2 - 2C(s) + 2H(g)
(g)
(C) C2H2 - 2C(s) + H2
(g) (g)
(D) C2H2 -,- 2C(g) + H2
(g) (g)
(E) 1/2C2H2 -. C(s) + 1/2H2 (g) (g)
+ 54 kcal /mole
+ 172 kcal /mole
+ 104 kcal /mole
99 kcal /mole
28. The energy necessary to convert carbon and hydrogen from the forms in which they are found at 25 °C and 1 atmosphere pressure to the forms in the correct equation for question 27 is
29. To calculate the correct value for the energy of the bond between the carbon atoms one should now take the value for AH calculated for the correct equation in question 27 and
Questions 30 -33 relate to the following table of e lectrone gativitie s.
Electronegativity Table
H
2. 1
Li Be B C N O F
1.0 1.5 2.0 2.5 3.0 3.5 4.0 Si P S Cl
1.8 2.1 2.5 3.0 Ge As Se Br
1.8 2.4 2. 8
Sn Sb Te I
30. On the basis of the given data, which of the following statements can be correctly made concerning the hydrides of the second period?
The most polar bond would be formed between hydrogen and boron.
The most polar bond would be formed between hydrogen and fluorine.
The most polar bond would be formed between hydrogen and oxygen.
The hydride of carbon would be very soluble in water.
Lithium hydride would be very soluble in benzene.
31. On the basis of the given data, the highest dipole moment should be predicted for which of the following molecules?
(A) F2
(B) CIF
(C) BrC1
(D) Br2
(E ) IF
128
32. Which of the following statements may correctly account for the fact that the boiling point of NH3 (-33. 4°C) is higher than that of PH3 ( -87. 4 °C)?
(A) The electronegativity of N is greater than that of P.
(B ) The boiling point of elemental N is greater than that of elemental P.
(C) NH3 molecules are more sym- metrical than are PH3 molecules.
(D) There is more hydrogen bonding in PH3 than there is in NH3.
(E ) The van der Waals force between PH3 molecules is greater than that between NH3 molecules.
33. Which of the following statements may correctly account for the fact that the boiling point of H2O is higher than that of H2S?
The electronegativity of S is greater than that of O.
The boiling point of elemental O is lower than that of elemental S.
H2O molecules are more sym- metrical than are H2S molecules.
There is more hydrogen bonding in H2O than there is in H2S.
The van der Waals force between H2S molecules is greater than that between H2O molecules.
GO ON TO THE NEXT PAGE
(A)
(B)
(C)
(D)
(E )
(A)
(B)
(C)
(D)
(E)
Questions 34 - 35 relate to the following information.
The force between two charged particles
is given by F = K q
Er 2 , where E is the
dielectric constant. The dielectric constant
for water is 80.
34. If the dielectric constant for water were 8
instead of 80, it would be logical to predict that sodium chloride would
(A) be slightly more soluble in water (B) be much more soluble in water (C) be slightly less soluble in water (D) be much less soluble in water (E) have the same solubility in water
129
35. An explanation of this prediction is that if the dielectric constant of water were 8
instead of 80
(A) fewer water molecules would fit around a sodium ion
(B) more water molecules could enter the sodium chloride crystal
(C) the attraction between Na+ and Cl in solution would be greater
(D) ionic substances ionize more completely in solvents of low dielectric constant
(E) the solvation of Na and Cl- would not be changed
130
PSSC ACHIEVEMENT TEST
DIRECTIONS
This is a 45- minute test containing 35 items. When you are told to begin, turn this page and immediately begin answering the questions.
Do not spend too much time on any one question. If a question seems to be too difficult, make the most careful guess you can, rather than waste time puzzling over it. Your score is the number of correct answers you mark.
Each of the questions or incomplete statements is followed by five suggested answers or
completions. Select the one which is best in each case and blacken the corresponding space on
the separate answer sheet. Make your marks heavy and black. Note the SAMPLE on your answer
sheet. If you make a mistake or wish to change an answer, be sure to erase your first choice completely.
SAMPLE QUESTION
0 Which of the following is most directly measured by the use of a clock?
(A) Mass
(B) Time (C) Length (D) Density (E) Force
DO NOT TURN THIS PAGE UNTIL YOU ARE TOLD TO
Questions 1 -3 relate to the following information and diagram:
A certain stroboscope consists of a rotating disk with four slotted holes, as shown below. The disk is rotating at exactly five revolutions per second.
2. The stroboscope is used to take a single photograph showing pictures at several positions of a ball rolling along a level surface at a constant velocity of 4 meters per second. How far will the ball have moved between successive positions?
(A) 0. 2 meters (B) 0. 8 meters (C) 1 meter (D) 5 meters (E) 8 x 10 meters
3. If the stroboscope had speeded up while the photograph was made, without the experimenter knowing that the speed had changed, the
(A)
(B )
(C)
(D)
(E)
pictures would have become blurred.
ball would appear to have slowed down.
ball would appear brighter in suc- cessive pictures.
photograph would be unchanged. successive pictures of the ball would
be farther apart.
GO ON TO THE NEXT PAGE
132
Questions 4 -á relate to the following information:
The following chemical reaction, in which all the substances occur as gases, is observed to occur under conditions of fixed temperature and pressure:
7 grams of element X react with 16 grams of element Y to produce 23 grams of compound Z, with no X or Y left over
4. Under the same conditions, 14 grams of element X react with 32 grams of element Y. How much of compound Z will be produced?
6. Under the same conditions, 24 grams of element X and 48 grams of element Y
are mixed. What will be the composi- tion of the end -products of this reaction?
(A) 72 grams of compound Z only (B) 69 grams of compound Z only (C) 17 grams of element X, 32 grams
of element Y and 23 grams of compound W
(D) 3 grams of element X and 69 grams of compound Z
(E) none of the above
7. At the same temperature and pressure, 7 grams of element X occupy the same volume as do 8 grams of element Y. One can therefore conclude that the ratio of the number of molecules in the 7 -gram sample of X to the number in the 8 -gram sample of Y is
(A) 7:8 (B) 8:8 (C) 8:7 (D) 15:7 (E) 16:7
GO ON TO THE NEXT PAGE
133
Questions 8 -13 relate to the following information and graph:
An object is moving along a straight line. The graph shows its displacement from the starting point as a function of time. Various sections of the graph are identified by the letters A, B, C, D, and E.
8
6
1(1) 4 4-4 d E 2
4) 0
cd -2 75. ti
q -4
-6
1 2 3 4 5 6 7 8 9 11 12 13
- A --+--C -'14- D -014--E -'1 + B
Time (seconds) ar
8. The displacement of the object at the end 11. What was the average velocity of the of the first seven seconds is
9. Which section of the graph represents a 12. Which section of the graph represents constant velocity of +4 meters per second? a period of positive acceleration?
(A) A
(B) B
(C) C
(D) D
(E ) E
10. Which section of the graph represents a
time during which the object was at rest?
(A) A
(B ) B
(C) C
(D) D
(E) E
13. What was the instantaneous velocity of the object at the end of the fifth second?
(A) A (A) 4 meters /sec (B) B (B) 2 meters /sec (C) C (C) 4/6 meters /sec (D) D (D) 0 meters /sec (E) E (E) -4/6 meters /sec
GO ON TO THE NEXT PAGE
..WA . 111=1
.. =A1111
134
Directions: The items in this part of the test consist of five lettered answer choices followed by a
list of numbered questions. For each question select the one lettered answer which is most closely related to it and blacken the corresponding space on the answer sheet. An answer may be used once, more than once, or not at all.
Questions 14-18 relate to the following (A) 1 /2a0 information and diagrams:
Several identical springs and several identical masses are used to perform acceleration experi- ments on a frictionless surface. It is found that a single spring, when extended by an amount x0, gives an acceleration a0 to a single mass.
Single spring: unextended
Single spring: extended x0
x0
Two springs connected end -to -end: unextended
Two springs connected end -to -end: extended total amount 2x0
(B) a0 (C) 2a0
(D) 4a0
(E ) Cannot be determined without additional information
14. What acceleration would be produced on a single mass by two springs connected side -by -side and extended by an amount x0?
15. What acceleration would be produced on a single mass by two springs connected end -to -end and extended by a total amount 2x0?
16. What acceleration would be produced on two of the masses tied together if two springs are connected end -to -end and extended by a total amount 2x0?
17. What acceleration would be produced on two of the masses tied together if four springs are connected side -by -side and the combination is extended by an
Ix° 2x0 amount x0?
Two springs connected side -by -side: unextended 18. Two springs are connected side -by -side;
this combination is then connected end - to -end to an identical combination. What acceleration would be produced on a single mass if this arrangement of
Two springs connected side -by -side: extended x 0 springs is extended by a total amount
2x0?
i
GO ON TO THE NEXT PAGE
0
29 O Q9 Q.0 Q_A--
1
lx0
Q.9 Q-0 0-0
135
Directions: Each of the questions or incomplete statements below is followed by five suggested
answers or completions. Select the one which is best in each case and blacken the corresponding space on the answer sheet.
Questions 19 -22 relate to the following information and projectile graph.
The graph below shows the path of a projectile fired by a toy cannon. In answering the related questions, assume frictional forces to be negligible.
Y
T S
X i \Z
/AO/ ///////9/2/ I4leters
19. The speed of the projectile as it leaves the 21. The vertical component of the toy cannon is the same as its speed at momentum is zero at
(A) T
(B) Y
(C) S
(D) Z
(E) none of the above.
(A) X
(B) T (C) Y
(D) Z
(E) none of the above.
20. The horizontal component of the momentum 22. The momentum of the projectile as it of the projectile after it leaves the muzzle leaves the toy cannon is the same as
of the toy cannon is its momentum at
(A) greatest at point X.
(B) greatest at point T. (C) greatest at point Y. (D) greatest at point Z.
(E) the same at all points.
(A) T (B) Y
(C) S
(D) Z
(E ) none of the above.
GO ON TO THE NEXT PAGE
z N z N i N N
136
Questions 23 - 25 relate to the following information and diagram:
Two racing cars of masses Mi. and M2 are moving in circles of radii R1 and R2 as shown. Their speeds are such that they each make a complete circle in the same length of time T.
23. The ratio of the angular speed (measured in degrees of arc per second) of the first car to that of the second car is
(A) 1:1
(B) M1:M2
(C) M2:M1
(D) R1:R2
(E ) R2:R1
24. The ratio of the speed measured in meters per second of the first car to that of the second car is
(A) 1:1
(B) M1:M2
(C) M2:M1
(D) R1:R2
(E ) R2:R1
25. The ratio of the centripetal acceleration of the first car to that of the second car is
(A) 1:1
(B ) M1:M2
(C) M2:M1
(D) R1:R2
(E ) R2:R1
GO ON TO THE NEXT PAGE
N
137
Directions: Each of the questions or incomplete statements below is followed by five suggested answers or completions. Select the one which is best in each case and blacken the corresponding space on the answer sheet.
Questions 26 - 30 relate to the following graph and information:
-1
1 2
Distance (Meters)
The graph above shows the force applied to a 2- kilogram body initially at rest but free to move on a horizontal frictionless surface.
26.
(A)
(C)
Which represents during
ó
cd ti w
w v U Q
0
0 ó
m F a .
á U U
one of the the acceleration
the first meter
following graphs of the
of travel?
00 cd ti a)
(B) á U U
0
0 o
m
(D) á U
best body
28.
29.
Time Time
0 Time
(E) None of the above graphs
0 Time
27. After the body has moved a distance of 1 meter its kinetic energy is
Questions 31 - 35 relate to the following information and diagram:
Five small identical metal balls are hung from insu- lating silk threads and are handled only by the threads. They are not allowed to touch each other during the following experiment. It has previously been found that none of the balls is affected by a magnet, and it has been calculated that the gravitational force between any two of the balls is negligible. Two of the balls at a time are brought near each other, and the following observations are recorded: I
138
II III IV V
1. Metal balls II and V exert no force on one another. 2. Metal balls I and III repel one another. 3. All other pairs of metal balls attract one another. For example, ball I attracts II, IV, and V.
In answering the questions, allow for the possibility of electrostatic induction.
31. The above observations show that
(A) I and III are not electrically charged. (B) I and III carry electric charges of the
same sign. (C) I and III carry electric charges of
opposite sign. (D) II, IV, and V all carry electric charges
of sign opposite to the charge on I. (E) II, IV, and V carry electric charges of
the same sign as that on I.
32. All of the observations are consistent with the assumption that
(A) none of the five balls carries an electric charge.
(B ) II and V carry electric charges of opposite sign.
(C) II carries no electric charge. (D) II is the only one of the balls that
carries an electric charge. I is the only one of the balls that carries
an electric charge. (E )
33. On the basis of all of the observations, it is certain that
(A) V repels I, II, III, IV. (B) V exerts no force on any other of the
balls. (C) V attracts I, II, III, IV.
(D) V attracts I, III, and IV, but exerts no force on II.
(E) none of the above statements is true.
34. On the basis of all the observations the most complete conclusion concerning metal ball IV is that it
(A)
(B) (C)
(D)
(E )
carries electric charges of the same sign as the charge on I.
is neutral. carries electric charges on the
opposite sign to the charge on I.
is either neutral, or carries electric charges of the same sign as the charge on I.
is either neutral, or carries electric charges of the opposite sign to the charge on I.
35. On the basis of Observation I above, which is true for all observed separations of the balls, any net charge carried by V must be
(A) positive. (B) negative. (C) zero. (D) of opposite sign to any net charge
on II. (E ) of the same sign as that of any net
charge on II.
1
139
APPENDIX B
140
ATTITUDES TOWARD SCIENCE AND SCIENTIFIC CAREERS
Reaction Inventory*
NAME School First Last
Instructions: Please give your reactions to the following list of statements regarding science, scientists, and scientific careers. Work rapidly. Record your first impression--- - the feeling that comes to mind as you read the item.
Draw a circle around AA if you completely agree with the item. Draw a circle around A if you are in partial agreement. Draw a circle around N if you are neutral. Draw a circle around D if you partially disagree. Draw a circle around DD if you totally disagree.
100. In the springtime Paris is more beautiful than New York. (Since A is circled, this indicates that you are in slight agreement. )
1. Science is a systematic way of thinking.
2. The development of new ideas is the scientist's greatest source of satisfaction.
3. Scientists are too narrow in their views.
AA A N D DD 4. The scientist will make his maximum contribution to society when he has freedom to work on problems which interest him.
AA A N D DD 5. Scientists should be looked upon as "subjects for suspicion."
AA A N D DD 6. Scientific investigations are undertaken as a means of achieving economic gains.
AA A N D DD 7. To become a scientist requires superior ability.
AA A N D DD 8. Science requires creative activity.
AA A N D DD 9. Scientists are willing to change their ideas and beliefs when confronted by new evidence.
AA A N D DD 10. Scientists are "longhairs."
*From Attitudes of Certain High School Seniors Toward Science and Scientific Careers, Bureau of Publications, Columbia University, New York, N.Y. , 1959. Used by permission of the author, Hugh Allen, Jr.
141
AA A N D DD 33. The engineer serves a more practical purpose in society than does the research scientist.
AA A N D DD 34. There is much self- satisfaction to be received from work as a scientist.
AA A N D DD 35. A scientist's life is full of adventure.
AA A N D DD 36. Science helps us to understand our environment.
AA A N D DD 37. Scientists are against formal religion.
AA A N D DD 38. Scientists often have physical deformities which render them unfit for other work.
AA A N D DD 39. Science and its inventions have caused more harm than good.
AA A N D DD 40. One cannot have a normal family life and be a scientist.
AA A N D DD 41. American scientists are largely responsible for our country's status among nations.
AA A N D DD 42. Scientific work is monotonous.
AA A N D DD 43. The working scientist believes that nature is orderly rather than disorderly.
AA A N D DD 44. The modern world is dominated by science.
AA A N D DD 45. Scientists are often willing to sacrifice the welfare of others to further their own interests.
AA A N D DD 46. Scientists are usually unsociable.
AA A N D DD 47. Curiosity motivates scientists to make their discoveries.
AA A N D DD 48. The chief reward in scientific work is the thrill of discovery.
AA A N D DD 49. Americans place greater value on the practical applications of scientific discoveries than on the discoveries themselves.
142
AA A N D DD 11. The complexity of science hides its cultural values.
AA A N D DD 12. Modern science is too complicated for the average citizen to understand and appreciate.
AA A N D DD 13. Scientists possess too much power in our society.
AA A N D DD 14. It is undemocratic to favor exceptional scientific talent.
AA A N D DD 15. The monetary compensation of a Nobel Prize winner in Physics should be
at least equal to that given popular entertainers.
AA A N D DD 16. Scientists are shy, lonely individuals.
AA A N D DD 17. For me, training for a career in science is not worth the time and effort required.
AA A N D DD 18. Science is primarily a method for inventing new devices.
AA A N D DD 19. Scientists are more emotional than other people.
AA A N D DD 20. Scientists are honored persons who stand very high in popular prestige.
AA A N D DD 21. To appreciate modern society fully, a person must understand the importance of science.
AA A N D DD 22. Scientists are an "odd" lot.
AA A N D DD 23. Science is the greatest unifying force among nations.
AA A N D DD 24. Scientific work is boring.
AA A N D DD 25. I don't have the intelligence for a successful scientific career.
AA A N D DD 26. Scientific findings always lead to final truths.
AA A N D DD 27. Science is primarily responsible for the frequent changes which occur in our manner of living.
AA A N D DD 28. Scientists are "eggheads."
AA A N D DD 29. Scientific work requires long years of labor and self -discipline.
AA A N D DD 30. Science is an attitude towards life and environment.
AA A N D DD 31. Our foremost scientists are primarily concerned with their own thoughts and ideas.
AA A N D DD 32. Science has done little for the average citizen.
Table XX. Summary of Mean Class Changes on Various Attitude Statements
Group Treatment Classes Chemistry Classes Difference Physics Classes Difference
Difference of Difference of of Difference of of Means Means Differences Means Differences