Feasibility of Renewable Thermal Technologies (RTT) in Connecticut Helle H. Gronli Associate Research Scientist, Yale Department of Energy and Environmental Protection Webinar January 31 st , 2017
Transcript
Feasibility of Renewable Thermal Technologies (RTT) in Connecticut
Helle H. GronliAssociate Research Scientist, Yale
Department of Energy and Environmental ProtectionWebinar January 31st, 2017
Roadmap• Why a feasibility study?
• What is the potential?
• How do renewable thermal technologies compete?
• What are the barriers?
• What are possible solutions?
2
Background
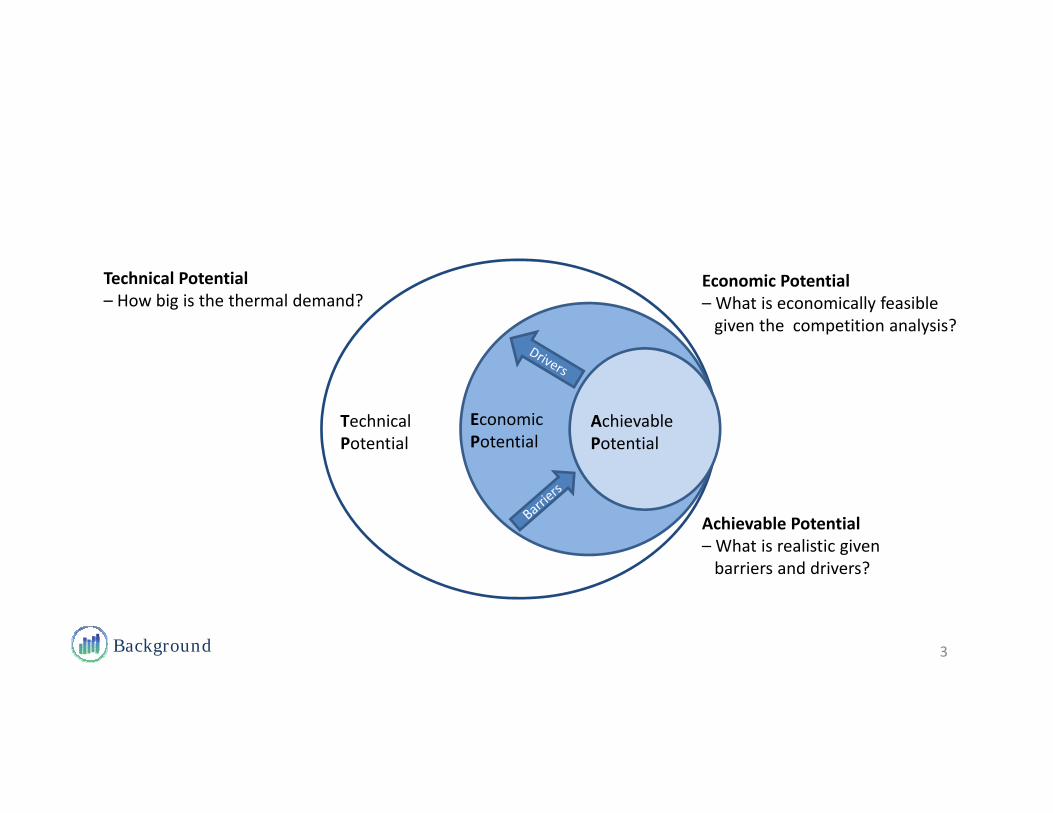
TechnicalPotential
EconomicPotential
AchievablePotential
Technical Potential – How big is the thermal demand?
Economic Potential – What is economically feasible given the competition analysis?
Achievable Potential – What is realistic given barriers and drivers?
3
4
Photo by Manowar064Photo by Oregon Department of Forestry
Photo by Mitsubishi ElectricPhoto by Koert Michiels
Background
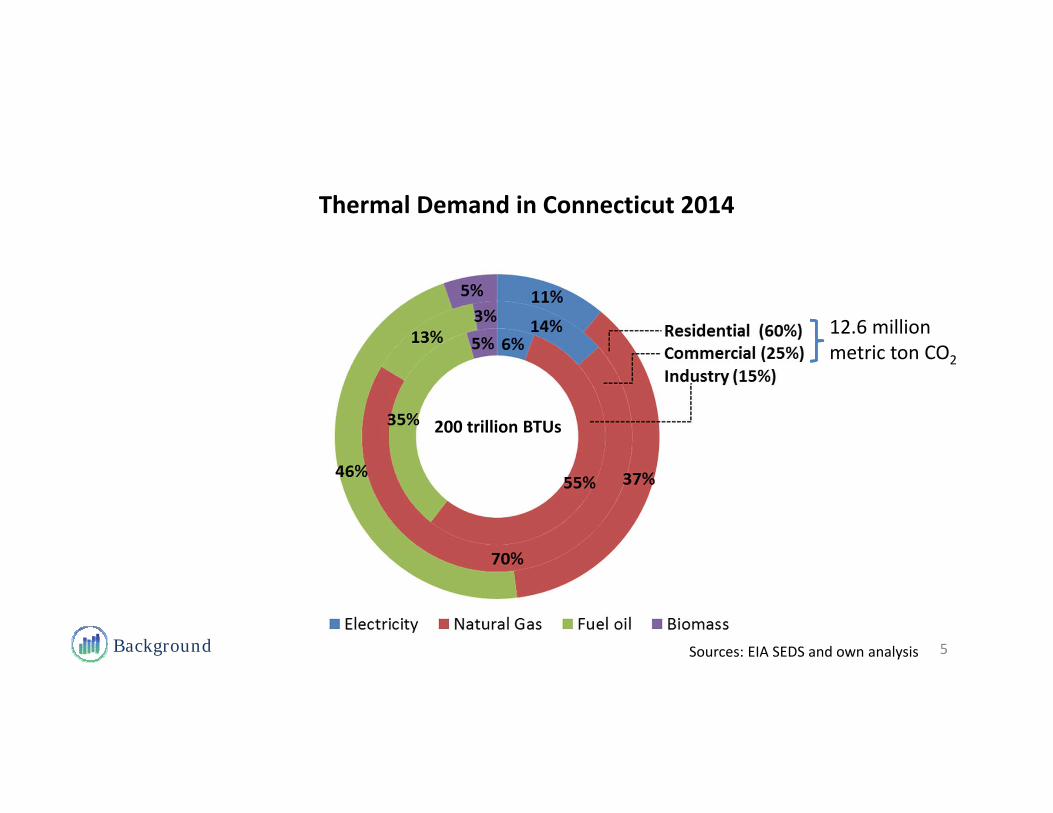
Thermal Demand in Connecticut 2014
5
200 trillion BTUs
Sources: EIA SEDS and own analysis
12.6 million metric ton CO2
Market potential
Demand Analysis – Main Findings
• Thermal demand in buildings is estimated to 103 – 142 trillion BTUs in 2050
• Ambitious building codes may considerably impact thermal demand, particularly in the commercial sector where the rate of new construction is expected to be high
• Higher outdoor temperatures reduce the thermal demand by 15 trillion BTUs per year by 2050
• An 80 percent reduction of the thermal demand by 2050 require a considerable number of buildings undergoing deep retrofit per year
Estimated GHG Emissions of Residential Thermal DemandCurrent estimate 9.1 mill ton C02e
1. Competitive RTT ‐ an immediate reduction of 0.6 mill ton C02e
2. Competitive RTT and efficient gas boilers an immediate reduction of 2.4 mill ton C02e
3. Competitive RTT and enforced deployment of GSHPs and efficient bas boilers halves the GHG emissions
4. 75% renewable electricity add a reduction of 1.2 mill ton C02e by 2050
13* GHG emission factors are based on the IPCC framework. Connecticut takes a more conservative approach when accounting for emissions from biomass
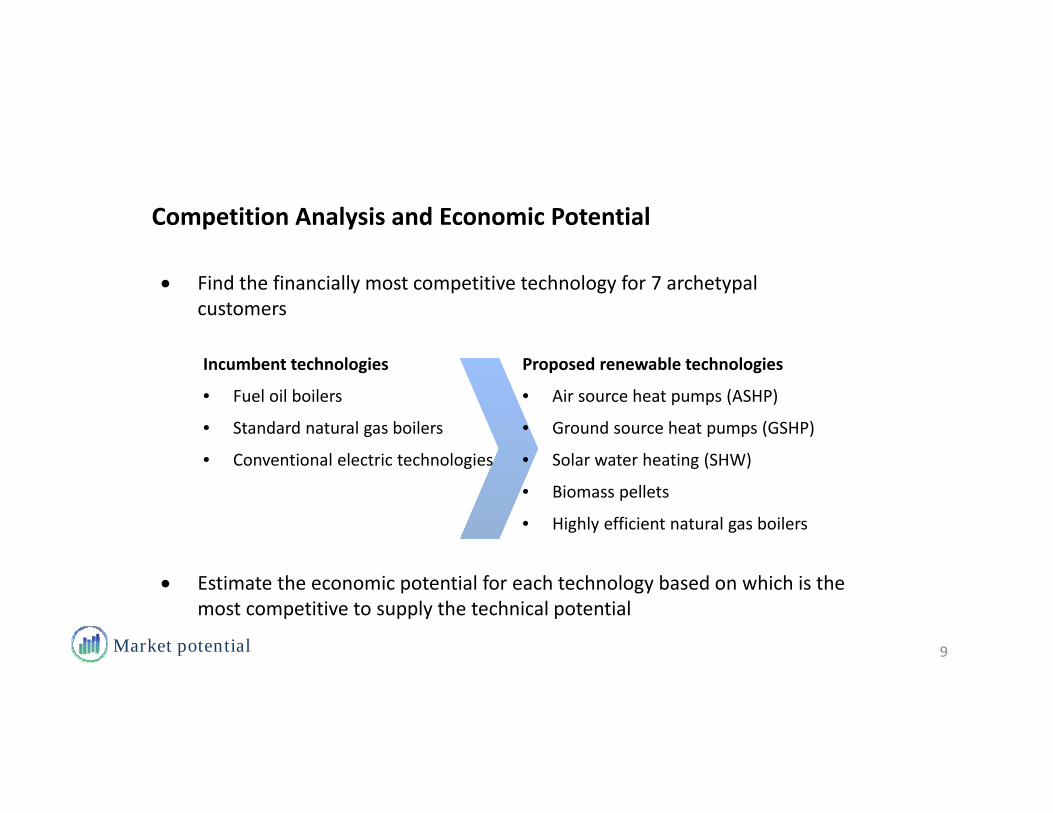
Competition analysis
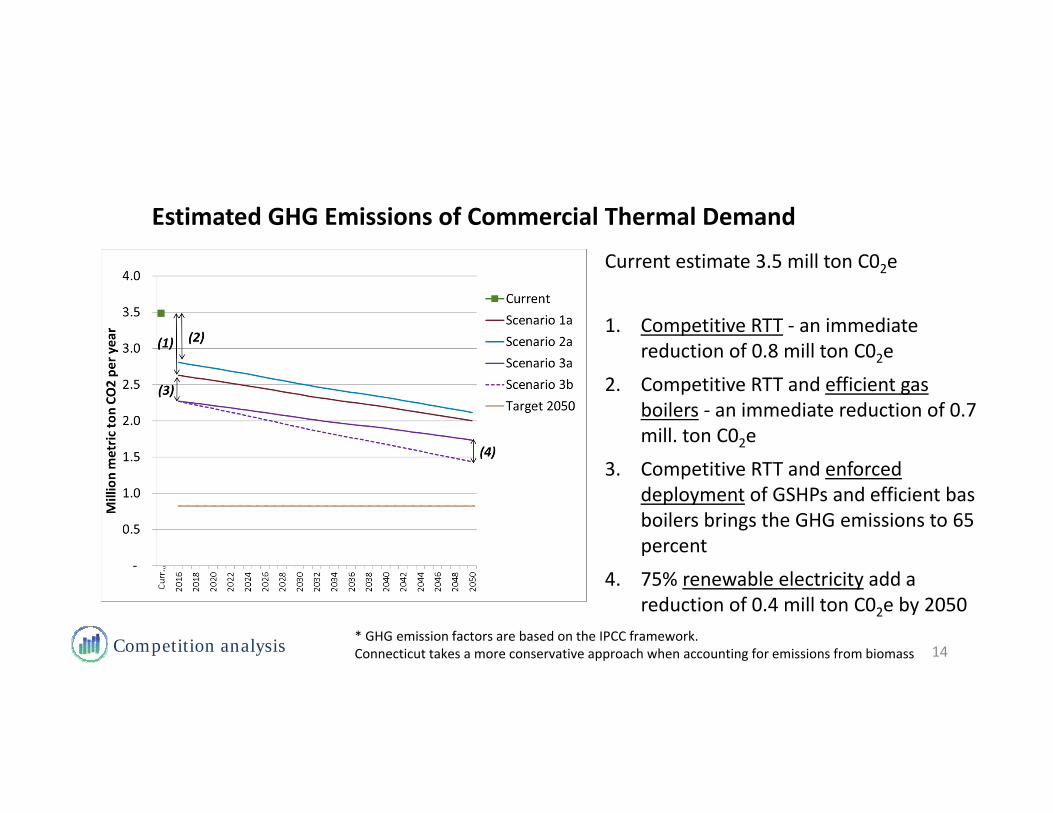
Estimated GHG Emissions of Commercial Thermal Demand
Current estimate 3.5 mill ton C02e
1. Competitive RTT ‐ an immediate reduction of 0.8 mill ton C02e
2. Competitive RTT and efficient gas boilers ‐ an immediate reduction of 0.7 mill. ton C02e
3. Competitive RTT and enforced deployment of GSHPs and efficient bas boilers brings the GHG emissions to 65 percent
4. 75% renewable electricity add a reduction of 0.4 mill ton C02e by 2050
14* GHG emission factors are based on the IPCC framework. Connecticut takes a more conservative approach when accounting for emissions from biomass
Sensitivity analysis
Sensitivity Analysis1. Fuel costs
of the incumbent technologya) 50 % increase b) 100 % increase
of the new technologyc) 25 % reductiond) Heat pumps + solar PV
2. Initial costsa) 25 % reductionb) Part load
3. Thermal Renewable Energy Credits4. Carbon price of 41 $ per ton CO2
5. Debt interest rate 6. Debt term7. Combinations
15
Sensitivity analysis
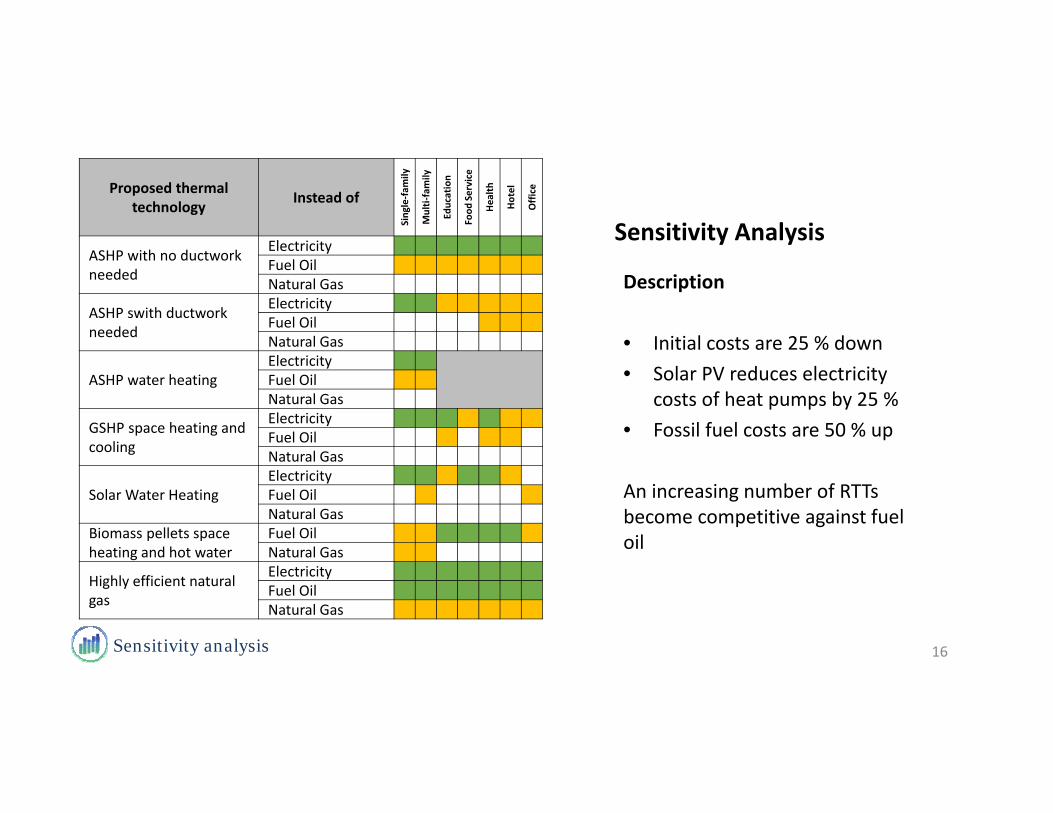
Sensitivity Analysis
Description
• Initial costs are 25 % down• Solar PV reduces electricity
costs of heat pumps by 25 %• Fossil fuel costs are 50 % up
An increasing number of RTTs become competitive against fuel oil
16
Proposed thermal technology Instead of
Single‐fam
ily
Multi‐family
Education
Food
Service
Health
Hotel
Office
ASHP with no ductwork needed
ElectricityFuel OilNatural Gas
ASHP swith ductwork needed
ElectricityFuel OilNatural Gas
ASHP water heatingElectricityFuel OilNatural Gas
GSHP space heating and cooling
ElectricityFuel OilNatural Gas
Solar Water HeatingElectricityFuel OilNatural Gas
Biomass pellets space heating and hot water
Fuel OilNatural Gas
Highly efficient natural gas
ElectricityFuel OilNatural Gas
Challenges and opportunities
High upfront costs
“We cannot afford to pay extra for environmental value, and the project has to be ‘Zero out of pocket’”
Institutional customer
“… The problem is: when you put everything up on your roof, there's an outlay of money ‐ and you're cash poor until the tax rebate is returned”
Residential customer
17
Cash Flow Analysis
Solarize for thermalSubsidiesTax Credits
Packaging Solar PVCarbon PriceThermal RECs
Financing products
Interest rates
Debt RatioLeasingThermal service agreements
18* Changes are cumulativeChallenges and opportunities
Single-family Home Replacing Conventional Electric by GSHP*
Challenges and opportunities
Awareness
“PV is killing solar thermal. The payback [for solar thermal technologies] with the tax credit is good, but it's not as sexy as PV”
Installer solar thermal
“When we talk to customers after the fact, they never talk about energy savings. They are always thrilled about how comfortable/quiet the home now feels. It’s an interesting transformation— ‘forget the savings, we love how comfortable our home is’”
Program administrator
19
Challenges and opportunities
Industry business models
“ESCOs are typically incentivized to choose projects that are most easily executed and can guarantee savings with relatively short payback periods”
“The work force needs to be developed”Institutional customer
“Investments were synergistic. As geothermal becomes more efficient, so does use of Solar PV, which made spray foam insulation in the attic a good investment”
Residential customer
20
Conclusion
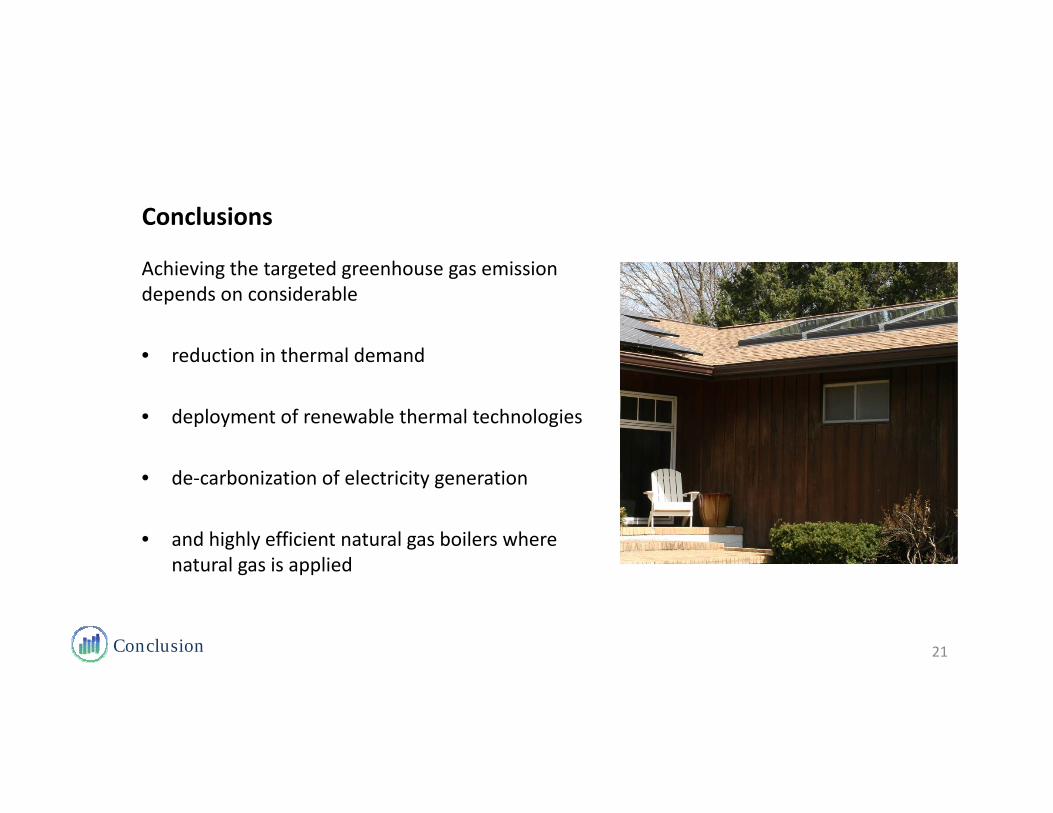
Conclusions
21
Achieving the targeted greenhouse gas emission depends on considerable
• reduction in thermal demand
• deployment of renewable thermal technologies
• de‐carbonization of electricity generation
• and highly efficient natural gas boilers where natural gas is applied