18 th European Thermal and ECLS Software Workshop 5-6 October 2004, ESA/ESTEC Sheet 1 FEASIBILITY OF USING A STOCHASTIC APPROACH FOR SPACE THERMAL ANALYSIS Matteo Gorlani, Danilo Lazzeri Blue Engineering, Torino, Italy Vincenzo Mareschi, Valter Perotto Alenia Spazio, Torino, Italy Olivier Pin European Space Agency, Noordwijk, The Netherlands 18 th European Thermal and ECLS Software Workshop 5-6 October 2004, ESA/ESTEC Sheet 2 OVERVIEW • Background • Stochastic Method Retained (Following Literature Survey) • Stochastic S/W Selected (Following Market Survey) • Practical Applications of Stochastic Method • TCS Activity Change with Stochastic Method • Conclusions • Distribution of Results
Transcript
18th European Thermal and ECLS Software Workshop5-6 October 2004, ESA/ESTECSheet 1
��� ����� �
FEASIBILITY OF USING A STOCHASTIC APPROACH FOR SPACE THERMAL ANALYSIS
18th European Thermal and ECLS Software Workshop5-6 October 2004, ESA/ESTECSheet 3
��� ����� �
BACKGROUND - 1/3• APPLICATION OF STOCHASTIC METHODS (SM) TO TCS IS
STILL LIMITED, WHY ?:
• Small number of specialists compared to other disciplines;
• Consolidated design procedures, often imposed by clients;
PRESSURE TO IMPROVE THIS STATIC SCENARIO:
• Need to achieve design with lower costs in shorter time;
• Awareness of limits in consolidated approach:– frequent over-design;– tests and correlation costs;– increasing complexity of space system and missions;– limited flexibility to accommodate design changes;
• Decreasing computational costs;
18th European Thermal and ECLS Software Workshop5-6 October 2004, ESA/ESTECSheet 4
��� ����� �
BACKGROUND – 2/3
BENEFITS OF STOCHASTIC FOR S/C THERMAL DESIGN:
• Possibility to account for distribution of parameters
• Association of probability to design
• Worst cases determination
• Design robustness assessment
• Design optimisation
• Test correlation
• Multidisciplinary optimisation
• Mission risk analysis
18th European Thermal and ECLS Software Workshop5-6 October 2004, ESA/ESTECSheet 5
��� ����� �
BACKGROUND – 3/3
ESA AWARDED A CONTRACT TO BLUE ENGINEERING AND ALENIA SPAZIO WITH THE FOLLOWING OBJECTIVES:
• Literature survey on SM;
• Survey of stochastic S/W and trade-off between make / buy;
• Verify usefulness of SM for TCS analysis/design/verification;
• Assess of pro’s/con’s of SM versus classical process;
• Identify requirements posed to TCS by introduction of SM;
• Produce handbook with guidelines of use of SM for TCS;
Activity started in Jan. 2003 and finalised in Sept. 2004
18th European Thermal and ECLS Software Workshop5-6 October 2004, ESA/ESTECSheet 6
��� ����� �
STOCHASTIC METHOD RETAINED (FOLLOWING LITERATURE SURVEY) – 1/3
• Random System
y=f(x) where: y response of the systemx random input variables
• MONTE CARLO SIMULATION (MCS) Analysis
(x1…xi…xn)1
x1
x2
…
xi
…
xn-1
xn
fx1
fx2
…
fxi
…
fxn-1
fxn
,
,
,
,
,
,
,
(x1…xi…xn)2
(x1…xi…xn)j
(x1…xi…xn)m-1
(x1,…xi…xn)m
(y1…yh…yk)1
(y1…yh…yk)2
(y1…yh…yk)j
(y1…yh…yk)m-1
(y1…yh…yk)m
Deter ministic
AnalysisI nput Sample
Random
Var iablesOutput
Responses
case 1
case 2
case j
case m-1
case m
Sample
Gener atorStatist ic
Post-Pr ocess
σy1, µy1
…
σy2, µ y2
…
σyh, µ yh
…
σyk-1, µ yk-1
…
σyk, µ yk
…
n random variablesk output response variablesm sample dimension
18th European Thermal and ECLS Software Workshop5-6 October 2004, ESA/ESTECSheet 7
��� ����� �
STOCHASTIC METHOD RETAINED (FOLLOWING LITERATURE SURVEY) – 2/3
Main steps of a MCS:
1. Definition of STOCHASTIC PROPERTIES of input variables.
• Association of Probability Distribution Functions (PDF) to input variables
• Association of an interval of variation to an input variable
RELEVANT DATA ARE NECESSARY
2. GENERATION OF A SAMPLE from the input data.
• Generation of sets of values of input variables from PDF
• Generation of numerical models
SPECIFIC TOOL COULD BE NECESSARY
18th European Thermal and ECLS Software Workshop5-6 October 2004, ESA/ESTECSheet 8
��� ����� �
STOCHASTIC METHOD RETAINED (FOLLOWING LITERATURE SURVEY) – 3/3
3. Execution of N ANALYSES CASES to generate the output sample.
• Management of remote machines
• Management of analyses cases in parallel
SEVERAL CPUS AND LICENCES COULD BE NECESSARY
4. STATISTICAL POST-PROCESSING of output responses.
• Management of great amount of data
• Calculation of statistical properties of variables
SPECIFIC TOOL COULD BE NECESSARY
CPU RESOURCES
DATA FOR PDF GENERATION STOCHASTIC S/W
18th European Thermal and ECLS Software Workshop5-6 October 2004, ESA/ESTECSheet 9
��� ����� �
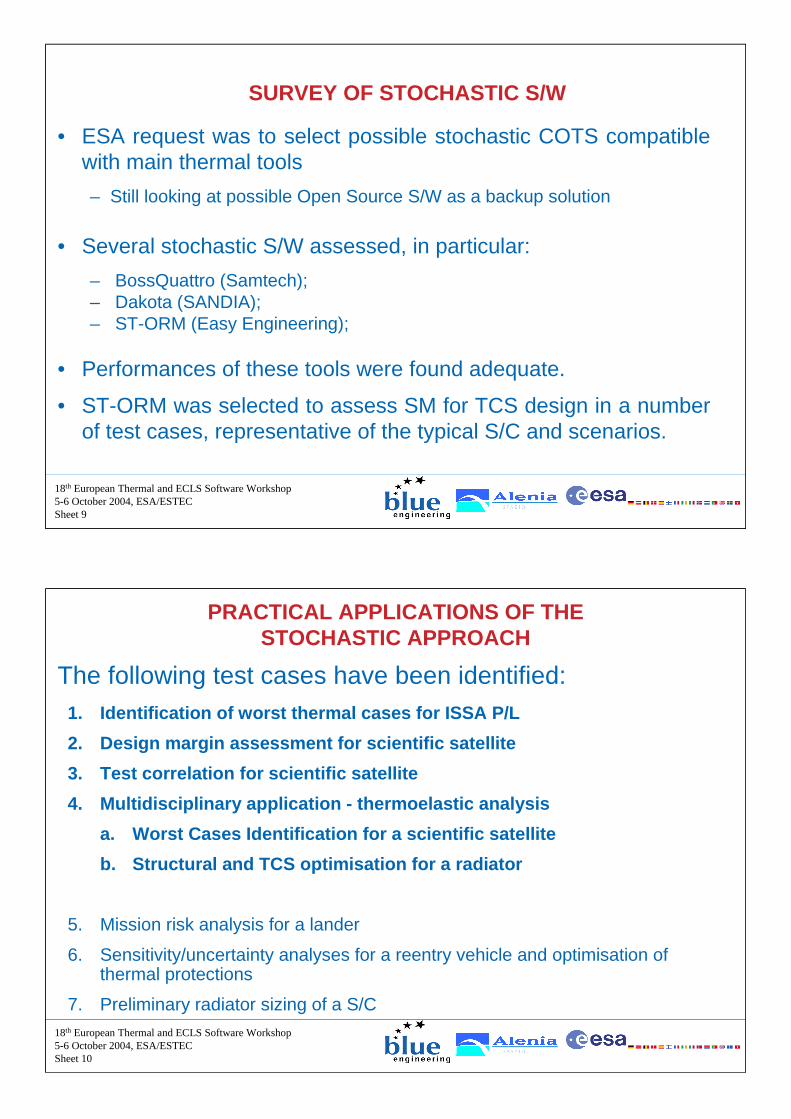
SURVEY OF STOCHASTIC S/W
• ESA request was to select possible stochastic COTS compatible with main thermal tools
– Still looking at possible Open Source S/W as a backup solution
a. Worst Cases Identification for a scientific satellite
b. Structural and TCS optimisation for a radiator
5. Mission risk analysis for a lander
6. Sensitivity/uncertainty analyses for a reentry vehicle and optimisation of thermal protections
7. Preliminary radiator sizing of a S/C
18th European Thermal and ECLS Software Workshop5-6 October 2004, ESA/ESTECSheet 11
��� ����� �
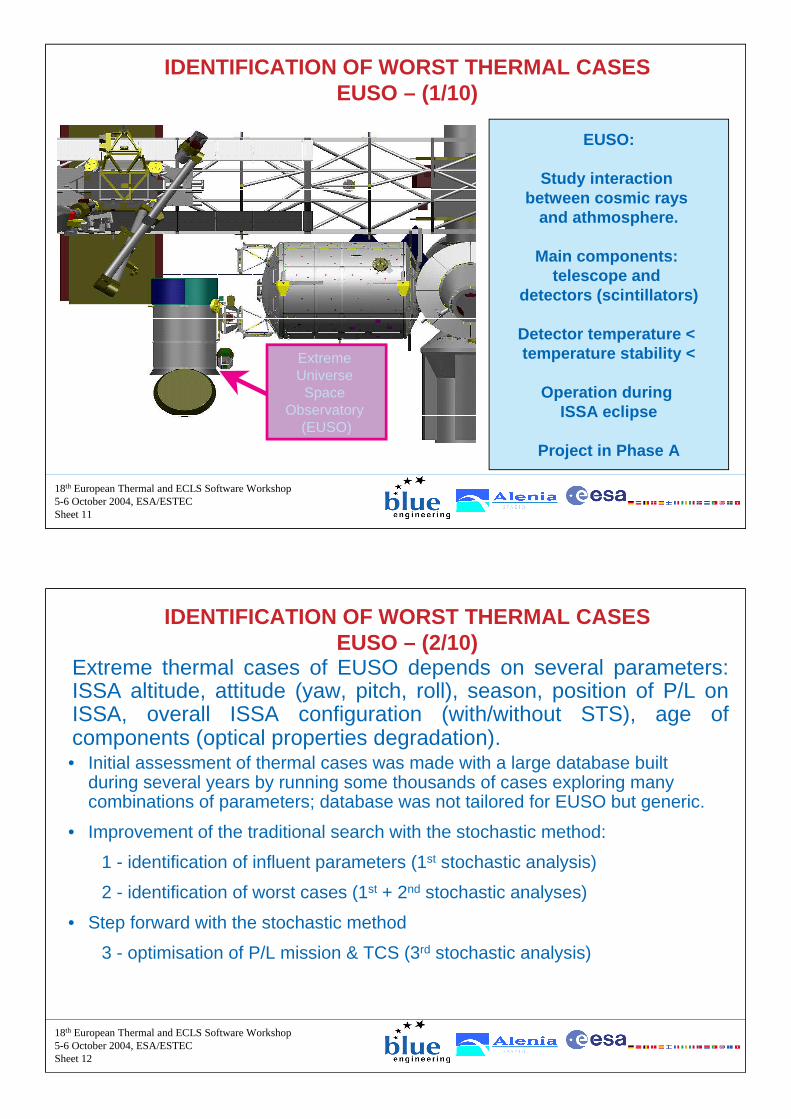
IDENTIFICATION OF WORST THERMAL CASES EUSO – (1/10)
Extreme Universe
Space Observatory
(EUSO)
EUSO:
Study interaction between cosmic rays
and athmosphere.
Main components: telescope and
detectors (scintillators)
Detector temperature < temperature stability <
Operation during ISSA eclipse
Project in Phase A
18th European Thermal and ECLS Software Workshop5-6 October 2004, ESA/ESTECSheet 12
��� ����� �
IDENTIFICATION OF WORST THERMAL CASES EUSO – (2/10)
Extreme thermal cases of EUSO depends on several parameters: ISSA altitude, attitude (yaw, pitch, roll), season, position of P/L on ISSA, overall ISSA configuration (with/without STS), age of components (optical properties degradation).• Initial assessment of thermal cases was made with a large database built
during several years by running some thousands of cases exploring many combinations of parameters; database was not tailored for EUSO but generic.
• Improvement of the traditional search with the stochastic method:
1 - identification of influent parameters (1st stochastic analysis)
(1) Right ascension of ascending node of ISS Orbit .(2) The range cov ers both ISS configurat ions: with and w ithout the Shutt le.(3) The extreme v alues of the li fe parameters correspond to:
0: B OL properties1: EO L properties
18th European Thermal and ECLS Software Workshop5-6 October 2004, ESA/ESTECSheet 14
��� ����� �
IDENTIFICATION OF WORST THERMAL CASES EUSO – (4/10)
Improvement of traditional approach: most influent parameters
18th European Thermal and ECLS Software Workshop5-6 October 2004, ESA/ESTECSheet 15
��� ����� �
IDENTIFICATION OF WORST THERMAL CASES EUSO – (5/10)
Improvement of traditional approach: preliminary worst cases
EUSO max temp. 39,76 °C
18th European Thermal and ECLS Software Workshop5-6 October 2004, ESA/ESTECSheet 16
��� ����� �
IDENTIFICATION OF WORST THERMAL CASES EUSO – (6/10)
Improvement of traditional approach: worst cases refinement
• select region of worst cases
• reduce no. of parameters to the most influent
• reduce variation interval of most influent parameters
• fix value of less influent parameters to
• conservative value• value provided by previous case
Descr iptions of Input Parameters Parameter M in Max Fixed Distr ibution Comments
242 282 Uniform Pie Chart Area > 10% 0.8 0.9 Uniform Pie Chart Area > 10%
240 320 Uniform Pie Chart Area > 10%
Omega [°] EUSO life parameter Day of the Year Roll [°] 9 15 Uniform Pie Chart Area > 10%
0.35 Traditional Hot Extreme Albedo Coefficient Earth Temperature [K] 257.2 Traditional Hot Extreme Orbit Altitude [m] 333E3 Traditional Hot Extreme
1.0 Traditional Hot Extreme Columbus life parameter ISS life parameter 1.0 Traditional Hot Extreme
4.584 From First Stochastic Case Yaw [°] Pitch [°] -6.58 From First Stochastic Case ISS Configuartion 101 108 Uniform Difficult Correlation
18th European Thermal and ECLS Software Workshop5-6 October 2004, ESA/ESTECSheet 17
��� ����� �
IDENTIFICATION OF WORST THERMAL CASES EUSO – (7/10)
Improvement of traditional approach: comparison of worst cases
Results of the SM are different with classic method; this is partly due to old database not tailored for EUSO, but similar change in worst cases due to SM was found also on other ISSA P/L
Tr adit ional Fir st Scans OptimisationL idar EUSO L idar EUSO L idar EUSO
Day of the YearSolar Constant [ W]Solar Declination [ °] -23.5 -22.81 -21.4 -21.73
Omega 261.78 277.18 272.7
Roll -15 11.67 9.89 14.73
EUSO life parameter 1.0 0.66 0.86 0.86
ISS configurationparameter
108 105 105 104
Refinement
18th European Thermal and ECLS Software Workshop5-6 October 2004, ESA/ESTECSheet 18
��� ����� �
IDENTIFICATION OF WORST THERMAL CASES EUSO – (8/10)
Step Forward: Assessing a probability of compliance to requirement
CONSEQUENCE FOR EUSO THERMAL DESIGN FROM WORST CASES : the updated worst hot case is so severe that thermal design is not compatible with allocated resources (mass, volume, heater power)
POSSIBLE SOLUTION:EUSO will be “off” around extreme hot case, and identify less severe case for thermal design, still compatible with mission requirement.
TECHNIQUE:use SM to find probability of occurrence of a worst condition, by extending the initial set of 125 cases.
18th European Thermal and ECLS Software Workshop5-6 October 2004, ESA/ESTECSheet 19
��� ����� �
IDENTIFICATION OF WORST THERMAL CASES EUSO – (9/10)
Step Forward: Assessing a probability of compliance to requirement
In 90% of possible cases the LIDAR max. temp. is about 20 °C, thence this could be the goal for the thermal design, which would be sufficient for 90% of the mission
--> EUSO will be switched off only 10% of the time, with a TCS compliant with allocated resources
18th European Thermal and ECLS Software Workshop5-6 October 2004, ESA/ESTECSheet 20
��� ����� �
IDENTIFICATION OF WORST THERMAL CASES EUSO – (10/10)
Test Case Summary
Direct comparison with the traditional procedure:
• Identified the most influent parameters
• Identified global worst cases
• Identified extreme worst cases
STRONG REFINEMENT OF WORST CASES W.R.T. TRADITIONAL
Step forward with the stochastic approach:
• Assessed a probability of compliance to requirement/worst cases
POSSIBILITY TO OPTIMISE P/L MISSION
18th European Thermal and ECLS Software Workshop5-6 October 2004, ESA/ESTECSheet 21
RISK OF OVERDESIGN WITH TRADITIONAL CALCULATION OF UNCERTAINTY
Step forward with the stochastic approach:
• Assessed a probability of compliance to requirement
POSSIBILITY TO ASSOCIATE PROBABILITY VALUES TO UNCERTAINTY OF TEMPERATURES
18th European Thermal and ECLS Software Workshop5-6 October 2004, ESA/ESTECSheet 28
��� ����� �
TEST CORRELATION ANALYSIS ASSESSMENTINTEGRAL - (1/11)
INTEGRAL satellite
main components are:
• The S/V
• The INTEGRAL Soft Gamma Ray Imager (ISGRI).
• The INTEGRAL Radiation Environment Monitor (IREM)
• The Joint European X-Ray Monitor (JEM-X)
• The Optical Monitoring Camera (OMC)
• The Imager on Board INTEGRAL Satellite (IBIS).
STR(Star Tracker)
S/VTanks
SAS(Solar Acquisition Sensor)
18th European Thermal and ECLS Software Workshop5-6 October 2004, ESA/ESTECSheet 29
��� ����� �
TEST CORRELATION ANALYSIS ASSESSMENTINTEGRAL - (2/11)
Correlation Analysis CasesCorrelation accounts for two different cases:a) Hot Case - Units close to maximum operative acceptance temperature. b) The Cold Case - Added when it was clear that the hot case only was not
sufficient to obtain good correlation of results.
a) b)
Hot Case Cold Case
18th European Thermal and ECLS Software Workshop5-6 October 2004, ESA/ESTECSheet 30
��� ����� �
TEST CORRELATION ANALYSIS ASSESSMENTINTEGRAL - (3/11)
Analysis of Measurement
Temperature Differences [°C]Mi PiT T− :
Mi
Pi
where
T Measured Temperature
T Calculated Test Temperature
→
→
Temperature Deviation [°C]
Standard Deviation [°C]
1Mi Pi
N
T T TN
∆ = −∑( ) 2
1
Mi PiN
T T T
Nσ
− − ∆ =
−
∑
When
N = Ntot With Ntot equal to the number of all measured temperatures, the above parameters can be referred as Global Temperature Deviation and Global Standard Deviation.
N = ni With ni < Ntot and equal to the number of a particular group of measured temperatures, the above parameters can be referred as Group Temperature Deviation and Group Standard Deviation.
18th European Thermal and ECLS Software Workshop5-6 October 2004, ESA/ESTECSheet 31
��� ����� �
TEST CORRELATION ANALYSIS ASSESSMENTINTEGRAL - (4/11)
Correlation Criteria
• Correlation performed for groups of units:S/V, P/L, TANK, JEM-X, STAR TRACKER, SAS, IBIS
• Criteria for traditional approach:- All Group Temperature Deviations ≤ 7 °C for Hot Case- All Group Temperature Deviations ≤ 6 °C for Cold Case
• Criteria for stochastic approach:1. Temperature level cri teria- G l o b a l T e m p e r a t u r e D e v i a t i o n ≤ 2 ° C f o r C o l d an d H o t
C as e s2 . S tan d ard d eviati o n cri teria- G l o b a l S t a n d a r d D e v i a t i o n ≤ 3 ° C f o r C o l d an d H o t C as e s3 . I n d i vi d ual u n i t s ucce s s cri teria- A l l G r o u p T e m p e r a t u r e D e v i a t i o n s ≤ 7 ° C f o r H o t C as e- A l l G r o u p T e m p e r a t u r e D e v i a t i o n s ≤ 6 ° C f o r C o l d C as e
18th European Thermal and ECLS Software Workshop5-6 October 2004, ESA/ESTECSheet 32
��� ����� �
TEST CORRELATION ANALYSIS ASSESSMENTINTEGRAL - (5/11)
Stochastic Optimisation:ST-ORM stopped after 37 Runs (15 Shots):
Generation of TMM
Execution of the Network Analysis Hot Case
Execution of the Network Analysis ColdCase
Generation of Values of Stochastic Analysis Input Parameters
Collection of Stochastic Analysis Output Parameters
18th European Thermal and ECLS Software Workshop5-6 October 2004, ESA/ESTECSheet 33
��� ����� �
TEST CORRELATION ANALYSIS ASSESSMENTINTEGRAL - (6/11)
Input V a r i a b l e s
(1) A total of 28 independent factors have been defined. One for each thermal conductivity parameter of honeycomb panels defined in the TMM
Parameter Min Max Distr ibution Fine Sun Sensor Head (α) 0.36 0.6 Uniform Fine Sun Sensor Head (ε) 0.833 0.859 Uniform ACC Radiator Efficiency Factor 0.8 1.0 Uniform CAE Radiator Efficiency Factor 0.8 1.0 Uniform IREM external Radiative Coupling Factor 1 14 Uniform MRU Contact Conductance [W/m²K] 100 200 Uniform SAS Bracket Conductance Factor 1 10 Uniform SAS +Y Cold Case Heater Power [W] 1.12 4.48 Uniform SAS -Y Cold Case Heater Power [W] 1.12 4.48 Uniform SAS +Y Hot Case Heater Power [W] 1.12 4.48 Uniform SAS -Y Hot Case Heater Power [W] 1.12 4.48 Uniform STR/Panel GL Factor 1 2 Uniform Honeycomb Panel Conductivity Factors(1) 1 3 Uniform
18th European Thermal and ECLS Software Workshop5-6 October 2004, ESA/ESTECSheet 34
��� ����� �
TEST CORRELATION ANALYSIS ASSESSMENTINTEGRAL - (7/11)
Stochastic Correlation: Results
Compliance of the Correlated Model with Temperature Level Criteria and Standard Deviation Criteria
18th European Thermal and ECLS Software Workshop5-6 October 2004, ESA/ESTECSheet 35
��� ����� �
TEST CORRELATION ANALYSIS ASSESSMENTINTEGRAL - (8/11)
Stochastic Correlation: Results
Compliance of the Correlated Model with Individual Unit Success Criteria
18th European Thermal and ECLS Software Workshop5-6 October 2004, ESA/ESTECSheet 36
��� ����� �
TEST CORRELATION ANALYSIS ASSESSMENTINTEGRAL - (9/11)
Stochastic Correlation: Evolution of Temperatures
Evolution of the Monitored Temperatures during the
Correlation Analysisin Hot Case
Evolution of the Monitored Temperatures during the
Correlation Analysisin Cold Case
18th European Thermal and ECLS Software Workshop5-6 October 2004, ESA/ESTECSheet 37
��� ����� �
TEST CORRELATION ANALYSIS ASSESSMENTINTEGRAL - (10/11)
The stochastic approach provides the lowest maximum absolute values (highlighted in bold) for all the parameters
GROUP Hot Case Cold case Traditional Stochastic Traditional Stochastic ∆T [°C] σ [°C] ∆T [°C] σ [°C] ∆T [°C] σ [°C] ∆T [°C] σ [°C] SVM UNITS -3.2 3.8 -1.05 3.40 1.0 2.8 1.56 2.39 PLM UNITS -3.0 3.0 -1.54 1.79 0.1 2.7 -0.54 2.04 TANK -2.3 3.2 -1.62 2.82 -0.8 5.4 -0.46 5.17 JEM-X 4.5 2.4 1.53 1.86 5.5 2.5 3.47 1.53 STAR TRACKER -0.1 4.4 1.72 2.31 0.5 3.6 1.12 2.28 SAS 0.0 4.5 -3.27 3.41 0.2 1.7 -0.31 3.16 IBIS 3.8 2.1 0.74 2.13 5.0 2.0 1.56 1.63
18th European Thermal and ECLS Software Workshop5-6 October 2004, ESA/ESTECSheet 38
��� ����� �
TEST CORRELATION ANALYSIS ASSESSMENTINTEGRAL - (11/11)
Test Case Summary
Direct comparison with the traditional approach:
• Model correlated vs. Global and Group Criteria
• Model correlated in Hot and Cold cases
• Automatic correlation with stochastic optimisation
SOLVED THE PROBLEMS ENCOUNTERED WITH TRADITIONAL ANALYSIS (GLOBAL CRITERIA, HOT CASE)
Step forward with the stochastic approach:
• Stochastic optimisation with concurrent consideration of Hot and Cold cases
MODEL DIRECTLY CORRELATED IN DIFFERENT CASES WITH A SINGLE STOCHASTIC ANALYSIS
18th European Thermal and ECLS Software Workshop5-6 October 2004, ESA/ESTECSheet 39
��� ����� �
IDENTIFICATION OF WORST CASES IN MULTIDISCIPLINARY ANALYSIS – GOCE - (1/4)
GOCE (Gravity field Ocean Circulation Explorer) satellite is constituted by two main payloads:
• Electrostatic Gravity Gradiometer
• Satellite to Satellite Tracking Instrument.
GOCE Gradiometer
18th European Thermal and ECLS Software Workshop5-6 October 2004, ESA/ESTECSheet 40
��� ����� �
IDENTIFICATION OF WORST CASES IN MULTIDISCIPLINARY ANALYSIS – GOCE - (2/4)
Input Parameters And DistributionsVar iable Distr ib. Min Max File Note
Day of the Year Uniform 1 360 Solar Constant [W] Solar Declination [°]
Dependent on the Day Sun and Epoch parameters. See following comments
GOCE_k.t Right ascension of ascending node. Only two values are possible : 90° 270°
EUSO life parameter Uniform 0 1 GOCE_g.t
GRADIO_g.t Optical Properties of surfaces See following comments
Operative Mode Discrete 1 6 Goce operative modes are six, corresponding to different levels of heat dissipation of the units.
Average Thrust level Discrete 1 4
Four different average thrust level are possible, corresponding to: 1. 1.7 2. 5.8 3. 8.3 4. 200
Thruster profile Discrete 1 3
GOCE.tpl
Three different thrust profile are possible.
18th European Thermal and ECLS Software Workshop5-6 October 2004, ESA/ESTECSheet 41
��� ����� �
IDENTIFICATION OF WORST CASES IN MULTIDISCIPLINARY ANALYSIS – GOCE - (3/4)
Output Variables
Three independent Star Sensors are mounted on GOCE:The alignment of the 3 Star Sensor Reference Frame (SSRF) with the Gradiometer Reference Frame (GRF) shall be verified (Not applicable to Operative Modes 4 and 5)
(ϕ,θ,ψ)j (with j = 1 to 3)
≤2 ·10-4 rad
Identification of extreme cases: Latin Hypercube 120 function evaluations constituted by - 1 thermal radiative analysis case (ESARAD run)- 1 thermal network analysis case (ESATAN run)- 1 structural analysis case (NASTRAN run)
18th European Thermal and ECLS Software Workshop5-6 October 2004, ESA/ESTECSheet 42
��� ����� �
IDENTIFICATION OF WORST CASES IN MULTIDISCIPLINARY ANALYSIS – GOCE - (4/4)
Worst Case:• Omega Angle = 270°• Operative case = 3
18th European Thermal and ECLS Software Workshop5-6 October 2004, ESA/ESTECSheet 43
��� ����� �
STOCHASTIC OPTIMISATION IN MULTIDISCIPLINARY ANALYSIS – PAYLOAD RADIATOR - (1/9)
Structural and TCS optimisation for a radiator
Plate
I lluminated Area
Reinforcements
Radiator in survival mode.TCS shall control the min. and max. temperatures
Temperature requirement:• Red Area with temperature limits 0/40°C.• Blue Area with temperature limits –10/30°C.
Radiator black bound Area is partially illuminated by the sun (100 W/m2).
Maximum deformation Requirements shall be satisfied
18th European Thermal and ECLS Software Workshop5-6 October 2004, ESA/ESTECSheet 44
��� ����� �
STOCHASTIC OPTIMISATION IN MULTIDISCIPLINARY ANALYSIS – PAYLOAD RADIATOR - (2/9)
SM to optimise structure and TCS:
• Find minimum heater power to satisfy requirements.• Define best heater and temperature sensor positions• Evaluate the radiator thickness and thermo-structural characteristics.
TEST PROCEDURE:1. Stochastic Optimisation: definition of best combination of input parameters to
satisfy thermal and structural requirements
2. Material selection: selection of a material with characteristics as similar as possible to those obtained in the previous phase
3. Uncertainty/sensitivity analysis: performed considering:• Inaccuracy for the material selected in phase 2• best heater and sensor positions evaluated in phase 1
18th European Thermal and ECLS Software Workshop5-6 October 2004, ESA/ESTECSheet 45
��� ����� �
STOCHASTIC OPTIMISATION IN MULTIDISCIPLINARY ANALYSIS – PAYLOAD RADIATOR - (3/9)
Single Heater Power [W] 0. 100. Heater X positions (1) 1 30 Heater Y positions (1) 1 15 Sensor X position (2) 1 30 Sensor Y position (2) 1 15 Plate Thickness [mm] 1 7 Reinforcement Thickness [mm] 1 7 Thermal Conductivity [W/m/k] 100 200 Specific Heat [J/Kg/K] 600 1000 Density [Kg/m3] 2500 3000 Modulus of Elasticity [N/mm2] 72000 206000 Coefficient of Thermal Expansion (CTE) [°C-1] 1.2⋅10-5 2.6⋅10-5
Input Variables: Uniform PDF
18th European Thermal and ECLS Software Workshop5-6 October 2004, ESA/ESTECSheet 46
��� ����� �
STOCHASTIC OPTIMISATION IN MULTIDISCIPLINARY ANALYSIS – PAYLOAD RADIATOR - (4/9)
Stochastic Optimisation: Output parameters
1) Temperatures reached in transient simulation (10,000 sec). Requirements are 0! !T 40 and -10! !T 3 0, e q u a l i t y o p t i o n m i n i m i s e t h e h e a t e r p o w e r .
2) Calculated during the last 5000 sec of transient simulation.3) Displacement reached in transient simulation (10,000 sec). Requirement is
Displ ! 0 . 1 5
Variable Target Value
Minimum Temperature Red Area [°C] (1) =0
Minimum Temperature Blue Area [°C] (1) =-10
Maximum Temperature Red Area [°C] (1) <40
Maximum Temperature Blue Area [°C] (1) <30
Heater Duty Cycle(2) =80%
Maximum Displacement [mm] (3) =0.15
18th European Thermal and ECLS Software Workshop5-6 October 2004, ESA/ESTECSheet 47
��� ����� �
STOCHASTIC OPTIMISATION IN MULTIDISCIPLINARY ANALYSIS – PAYLOAD RADIATOR - (5/9)
Stochastic Optimisation: ST-ORM stopped after 60 Runs (15 Shots)
• Red Zone temperatures: Both temperature targets reached • Blue zone temperatures: Only Maximum temperature target reached
Target
Target
Difficult to obtain high temperature gradient (10°C) in areas very close and strongly linearly coupled
:
18th European Thermal and ECLS Software Workshop5-6 October 2004, ESA/ESTECSheet 48
��� ����� �
STOCHASTIC OPTIMISATION IN MULTIDISCIPLINARY ANALYSIS – PAYLOAD RADIATOR - (6/9)
Stochastic Optimisation: ST-ORM stopped after 60 Runs (15 Shots)
• Duty cycle: Target reached • Maximum displacement: Target reached
Target
Target
18th European Thermal and ECLS Software Workshop5-6 October 2004, ESA/ESTECSheet 49
��� ����� �
STOCHASTIC OPTIMISATION IN MULTIDISCIPLINARY ANALYSIS – PAYLOAD RADIATOR - (7/9)
Calculate confidence levelcorrespondent to Ufp, CL(Ufp)
CL( Ufp) toohigh ?
Relax design
YES
18th European Thermal and ECLS Software Workshop5-6 October 2004, ESA/ESTECSheet 57
��� ����� �
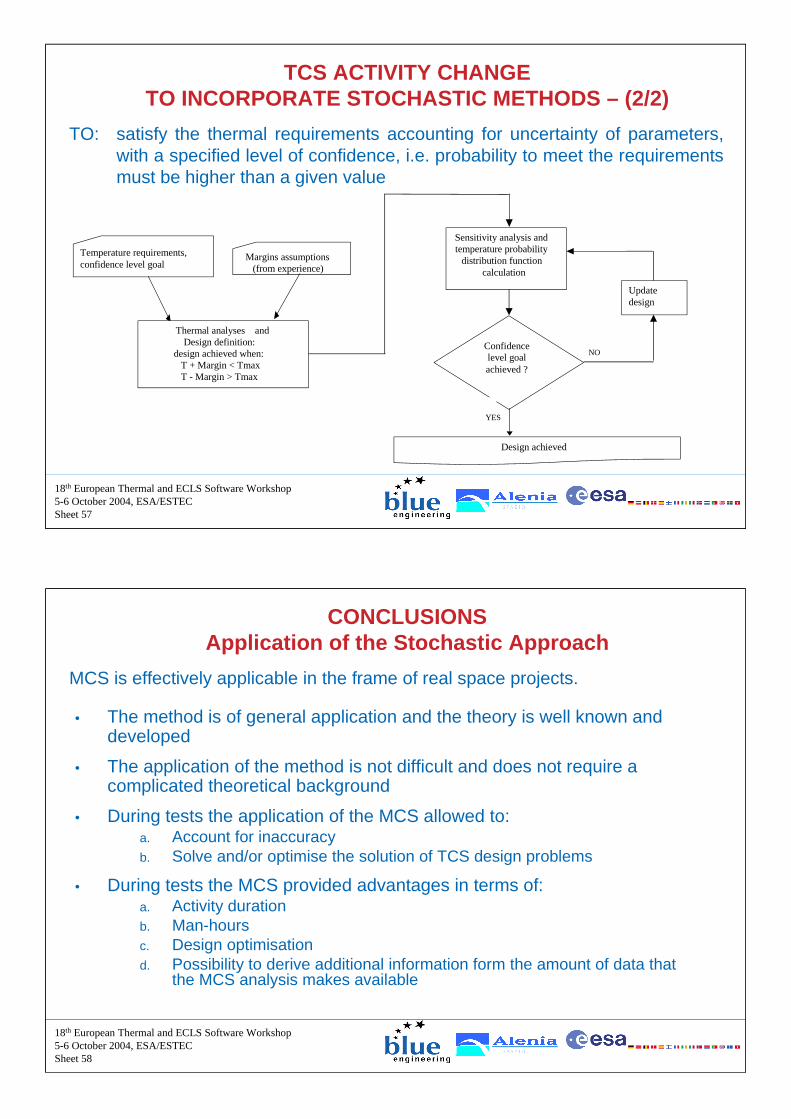
TCS ACTIVITY CHANGE TO INCORPORATE STOCHASTIC METHODS – (2/2)
TO: satisfy the thermal requirements accounting for uncertainty of parameters, with a specified level of confidence, i.e. probability to meet the requirements must be higher than a given value
18th European Thermal and ECLS Software Workshop5-6 October 2004, ESA/ESTECSheet 58
��� ����� �
CONCLUSIONSApplication of the Stochastic Approach
MCS is effectively applicable in the frame of real space projects.
• The method is of general application and the theory is well known and developed
• The application of the method is not difficult and does not require a complicated theoretical background
• During tests the application of the MCS allowed to:a. Account for inaccuracyb. Solve and/or optimise the solution of TCS design problems
• During tests the MCS provided advantages in terms of:a. Activity durationb. Man-hours c. Design optimisationd. Possibility to derive additional information form the amount of data that
the MCS analysis makes available
18th European Thermal and ECLS Software Workshop5-6 October 2004, ESA/ESTECSheet 59
��� ����� �
CONCLUSIONSComparison of Possible Stochastic Methodologies
Feasible when subcontractors are involved
Feasible when interface with other subsystems is necessary
Possible use of small samples for some types of analyses
Feasible in all phases of development
Reduced change of engineering approach
Always accounting for inaccuracy
+
+
+
+
+
+
Stochastic methodology focused on single activities
of TCS
Global stochastic methodology for TCS
18th European Thermal and ECLS Software Workshop5-6 October 2004, ESA/ESTECSheet 60
��� ����� �
CONCLUSIONSRecommendations For Future Activities
• INACCURACY OF PARAMETERS:
Studies dedicated to advanced methods for testing and measuring properties of materials in order to generate specific data relevant to inaccuracy would be useful.
• OPTIMISATION PROCEDURES:
It would be interesting the evaluation of the use of the MCS for accounting of inaccuracy together with different optimisation procedures (e.g. procedures based on emulators rather than on simulators).
18th European Thermal and ECLS Software Workshop5-6 October 2004, ESA/ESTECSheet 61
��� ����� �
DISTRIBUTION OF RESULTS
In ESA website will be available the results of the project :
• The Final Report: “Analysis and Assessment”, 02.07.035/TN4, issue 1, 30/9/2004
• The Handbook: “Guidelines for the Assessment and Implementation of Stochastic Methods for Space Thermal Analysis”, 02.07.035/TN5, issue 1, 30/9/2004
• The Executive Report: “Executive Report”, 02.07.035/TN6, issue 1, 30/9/2004
• The HTML version of the Handbook
• Some examples of the models implemented and used during the project