

18th European Thermal and ECLS Software Workshop5-6 October 2004, ESA/ESTECSheet 1
��� ����� �
FEASIBILITY OF USING A STOCHASTIC APPROACH FOR SPACE THERMAL ANALYSIS
Matteo Gorlani, Danilo LazzeriBlue Engineering, Torino, Italy
Vincenzo Mareschi, Valter Perotto
Alenia Spazio, Torino, Italy
Olivier PinEuropean Space Agency, Noordwijk, The Netherlands
18th European Thermal and ECLS Software Workshop5-6 October 2004, ESA/ESTECSheet 2
��� ����� �
OVERVIEW
• Background
• Stochastic Method Retained (Following Literature Survey)
• Stochastic S/W Selected (Following Market Survey)
• Practical Applications of Stochastic Method
• TCS Activity Change with Stochastic Method
• Conclusions
• Distribution of Results

18th European Thermal and ECLS Software Workshop5-6 October 2004, ESA/ESTECSheet 3
��� ����� �
BACKGROUND - 1/3• APPLICATION OF STOCHASTIC METHODS (SM) TO TCS IS
STILL LIMITED, WHY ?:
• Small number of specialists compared to other disciplines;
• Consolidated design procedures, often imposed by clients;
PRESSURE TO IMPROVE THIS STATIC SCENARIO:
• Need to achieve design with lower costs in shorter time;
• Awareness of limits in consolidated approach:– frequent over-design;– tests and correlation costs;– increasing complexity of space system and missions;– limited flexibility to accommodate design changes;
• Decreasing computational costs;
18th European Thermal and ECLS Software Workshop5-6 October 2004, ESA/ESTECSheet 4
��� ����� �
BACKGROUND – 2/3
BENEFITS OF STOCHASTIC FOR S/C THERMAL DESIGN:
• Possibility to account for distribution of parameters
• Association of probability to design
• Worst cases determination
• Design robustness assessment
• Design optimisation
• Test correlation
• Multidisciplinary optimisation
• Mission risk analysis

18th European Thermal and ECLS Software Workshop5-6 October 2004, ESA/ESTECSheet 5
��� ����� �
BACKGROUND – 3/3
ESA AWARDED A CONTRACT TO BLUE ENGINEERING AND ALENIA SPAZIO WITH THE FOLLOWING OBJECTIVES:
• Literature survey on SM;
• Survey of stochastic S/W and trade-off between make / buy;
• Verify usefulness of SM for TCS analysis/design/verification;
• Assess of pro’s/con’s of SM versus classical process;
• Identify requirements posed to TCS by introduction of SM;
• Produce handbook with guidelines of use of SM for TCS;
Activity started in Jan. 2003 and finalised in Sept. 2004
18th European Thermal and ECLS Software Workshop5-6 October 2004, ESA/ESTECSheet 6
��� ����� �
STOCHASTIC METHOD RETAINED (FOLLOWING LITERATURE SURVEY) – 1/3
• Random System
y=f(x) where: y response of the systemx random input variables
• MONTE CARLO SIMULATION (MCS) Analysis
(x1…xi…xn)1
x1
x2
…
xi
…
xn-1
xn
fx1
fx2
…
fxi
…
fxn-1
fxn
,
,
,
,
,
,
,
(x1…xi…xn)2
(x1…xi…xn)j
(x1…xi…xn)m-1
(x1,…xi…xn)m
(y1…yh…yk)1
(y1…yh…yk)2
(y1…yh…yk)j
(y1…yh…yk)m-1
(y1…yh…yk)m
Deter ministic
AnalysisI nput Sample
Random
Var iablesOutput
Responses
case 1
case 2
case j
case m-1
case m
Sample
Gener atorStatist ic
Post-Pr ocess
σy1, µy1
…
σy2, µ y2
…
σyh, µ yh
…
σyk-1, µ yk-1
…
σyk, µ yk
…
n random variablesk output response variablesm sample dimension

18th European Thermal and ECLS Software Workshop5-6 October 2004, ESA/ESTECSheet 7
��� ����� �
STOCHASTIC METHOD RETAINED (FOLLOWING LITERATURE SURVEY) – 2/3
Main steps of a MCS:
1. Definition of STOCHASTIC PROPERTIES of input variables.
• Association of Probability Distribution Functions (PDF) to input variables
• Association of an interval of variation to an input variable
RELEVANT DATA ARE NECESSARY
2. GENERATION OF A SAMPLE from the input data.
• Generation of sets of values of input variables from PDF
• Generation of numerical models
SPECIFIC TOOL COULD BE NECESSARY
18th European Thermal and ECLS Software Workshop5-6 October 2004, ESA/ESTECSheet 8
��� ����� �
STOCHASTIC METHOD RETAINED (FOLLOWING LITERATURE SURVEY) – 3/3
3. Execution of N ANALYSES CASES to generate the output sample.
• Management of remote machines
• Management of analyses cases in parallel
SEVERAL CPUS AND LICENCES COULD BE NECESSARY
4. STATISTICAL POST-PROCESSING of output responses.
• Management of great amount of data
• Calculation of statistical properties of variables
SPECIFIC TOOL COULD BE NECESSARY
CPU RESOURCES
DATA FOR PDF GENERATION STOCHASTIC S/W
18th European Thermal and ECLS Software Workshop5-6 October 2004, ESA/ESTECSheet 9
��� ����� �
SURVEY OF STOCHASTIC S/W
• ESA request was to select possible stochastic COTS compatible with main thermal tools
– Still looking at possible Open Source S/W as a backup solution
• Several stochastic S/W assessed, in particular:
– BossQuattro (Samtech);– Dakota (SANDIA);– ST-ORM (Easy Engineering);
• Performances of these tools were found adequate.
• ST-ORM was selected to assess SM for TCS design in a number of test cases, representative of the typical S/C and scenarios.
18th European Thermal and ECLS Software Workshop5-6 October 2004, ESA/ESTECSheet 10
��� ����� �
PRACTICAL APPLICATIONS OF THESTOCHASTIC APPROACH
The following test cases have been identified:1. Identification of worst thermal cases for ISSA P/L
2. Design margin assessment for scientific satellite
3. Test correlation for scientific satellite
4. Multidisciplinary application - thermoelastic analysis
a. Worst Cases Identification for a scientific satellite
b. Structural and TCS optimisation for a radiator
5. Mission risk analysis for a lander
6. Sensitivity/uncertainty analyses for a reentry vehicle and optimisation of thermal protections
7. Preliminary radiator sizing of a S/C
18th European Thermal and ECLS Software Workshop5-6 October 2004, ESA/ESTECSheet 11
��� ����� �
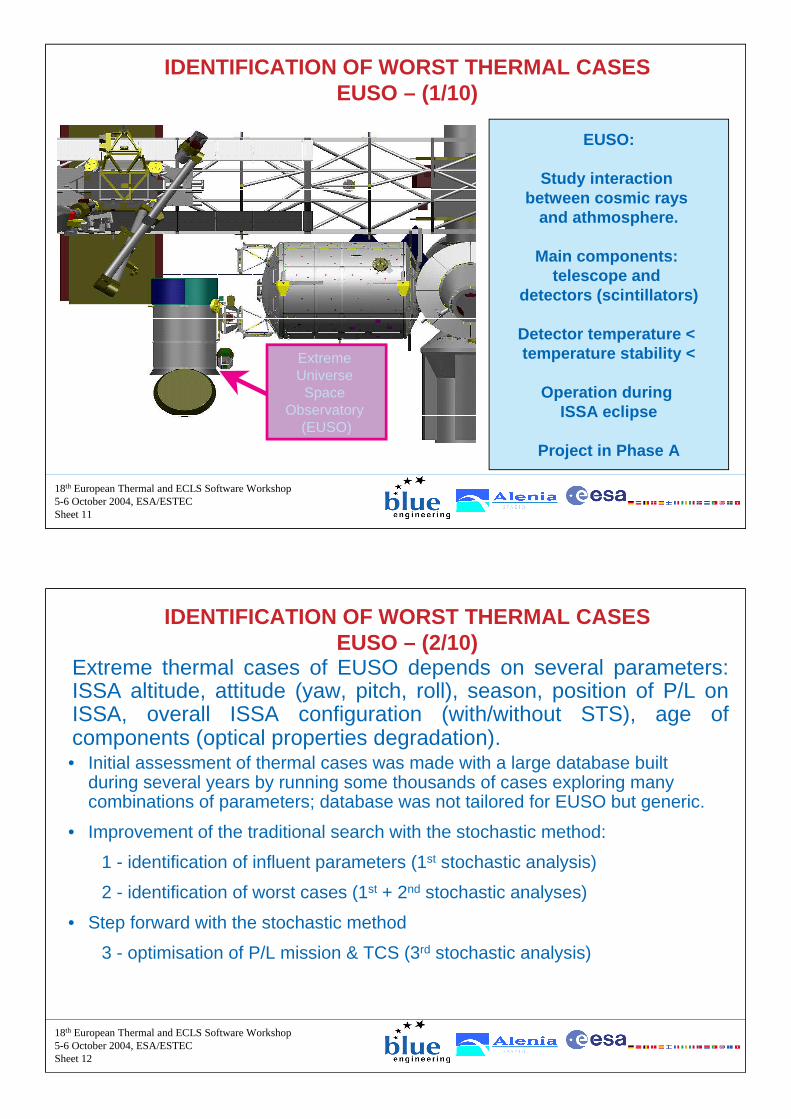
IDENTIFICATION OF WORST THERMAL CASES EUSO – (1/10)
Extreme Universe
Space Observatory
(EUSO)
EUSO:
Study interaction between cosmic rays
and athmosphere.
Main components: telescope and
detectors (scintillators)
Detector temperature < temperature stability <
Operation during ISSA eclipse
Project in Phase A
18th European Thermal and ECLS Software Workshop5-6 October 2004, ESA/ESTECSheet 12
��� ����� �
IDENTIFICATION OF WORST THERMAL CASES EUSO – (2/10)
Extreme thermal cases of EUSO depends on several parameters: ISSA altitude, attitude (yaw, pitch, roll), season, position of P/L on ISSA, overall ISSA configuration (with/without STS), age of components (optical properties degradation).• Initial assessment of thermal cases was made with a large database built
during several years by running some thousands of cases exploring many combinations of parameters; database was not tailored for EUSO but generic.
• Improvement of the traditional search with the stochastic method:
1 - identification of influent parameters (1st stochastic analysis)
2 - identification of worst cases (1st + 2nd stochastic analyses)
• Step forward with the stochastic method
3 - optimisation of P/L mission & TCS (3rd stochastic analysis)

18th European Thermal and ECLS Software Workshop5-6 October 2004, ESA/ESTECSheet 13
��� ����� �
IDENTIFICATION OF WORST THERMAL CASES EUSO – (3/10)
Improvement of traditional approach: first scan
• The Latin-Hypercube technique used, with 125 thermal analysis cases (compared to thousand of cases of traditional database)
• Different ISS configurations can be explored
• Optical Properties can be continuously explored
Par ameterName Descr i pt i on Fi l e
Di str i bu ti on M i n M ax
Sun and Epoch parametersDay of the Year kernel Unifo rm 1 360
Solar Constant [W ] kernel Day Dependent 1321 1423Solar Dec linat ion [°] kernel Day Dependent -23.5 23.5
Earth parametersA lbedo Coeff icient kernel Unifo rm 0.22 0.35Earth Temperature [ K ] kernel Unifo rm 240 257.2
Orbit parametersOrbit A lt itude [ m] kernel Unifo rm 333E3 500E3
Omega (1)
kernel Unifo rm 0 360
ISS attitude
Y aw [ °] kernel Unifo rm -15 15Pitch [ °]
(2)kernel Unifo rm -20 25
Rol l [° ] kernel Unifo rm -15 15
Optical Propert ies of external surfaces (3)
EUSO l ife parameter geometric Unifo rm 0 1
Colu mbus l ifeparameter
geometric Unifo rm 0 1
ISS l ife parameter geometric Unifo rm 0 1
ISS ConfigurationISS configurat ionparameter
geometric Unifo rm 101 108
(1) Right ascension of ascending node of ISS Orbit .(2) The range cov ers both ISS configurat ions: with and w ithout the Shutt le.(3) The extreme v alues of the li fe parameters correspond to:
0: B OL properties1: EO L properties
18th European Thermal and ECLS Software Workshop5-6 October 2004, ESA/ESTECSheet 14
��� ����� �
IDENTIFICATION OF WORST THERMAL CASES EUSO – (4/10)
Improvement of traditional approach: most influent parameters

18th European Thermal and ECLS Software Workshop5-6 October 2004, ESA/ESTECSheet 15
��� ����� �
IDENTIFICATION OF WORST THERMAL CASES EUSO – (5/10)
Improvement of traditional approach: preliminary worst cases
EUSO max temp. 39,76 °C
18th European Thermal and ECLS Software Workshop5-6 October 2004, ESA/ESTECSheet 16
��� ����� �
IDENTIFICATION OF WORST THERMAL CASES EUSO – (6/10)
Improvement of traditional approach: worst cases refinement
• select region of worst cases
• reduce no. of parameters to the most influent
• reduce variation interval of most influent parameters
• fix value of less influent parameters to
• conservative value• value provided by previous case
Descr iptions of Input Parameters Parameter M in Max Fixed Distr ibution Comments
242 282 Uniform Pie Chart Area > 10% 0.8 0.9 Uniform Pie Chart Area > 10%
240 320 Uniform Pie Chart Area > 10%
Omega [°] EUSO life parameter Day of the Year Roll [°] 9 15 Uniform Pie Chart Area > 10%
0.35 Traditional Hot Extreme Albedo Coefficient Earth Temperature [K] 257.2 Traditional Hot Extreme Orbit Altitude [m] 333E3 Traditional Hot Extreme
1.0 Traditional Hot Extreme Columbus life parameter ISS life parameter 1.0 Traditional Hot Extreme
4.584 From First Stochastic Case Yaw [°] Pitch [°] -6.58 From First Stochastic Case ISS Configuartion 101 108 Uniform Difficult Correlation

18th European Thermal and ECLS Software Workshop5-6 October 2004, ESA/ESTECSheet 17
��� ����� �
IDENTIFICATION OF WORST THERMAL CASES EUSO – (7/10)
Improvement of traditional approach: comparison of worst cases
Results of the SM are different with classic method; this is partly due to old database not tailored for EUSO, but similar change in worst cases due to SM was found also on other ISSA P/L
Tr adit ional Fir st Scans OptimisationL idar EUSO L idar EUSO L idar EUSO
Temper atur e [°C] 15 20 39.76 12.24 53.46 25.54Par ameter
283.9 294.4 292.41423 1421.5 1418.4 1419.2
Day of the YearSolar Constant [ W]Solar Declination [ °] -23.5 -22.81 -21.4 -21.73
Omega 261.78 277.18 272.7
Roll -15 11.67 9.89 14.73
EUSO life parameter 1.0 0.66 0.86 0.86
ISS configurationparameter
108 105 105 104
Refinement
18th European Thermal and ECLS Software Workshop5-6 October 2004, ESA/ESTECSheet 18
��� ����� �
IDENTIFICATION OF WORST THERMAL CASES EUSO – (8/10)
Step Forward: Assessing a probability of compliance to requirement
CONSEQUENCE FOR EUSO THERMAL DESIGN FROM WORST CASES : the updated worst hot case is so severe that thermal design is not compatible with allocated resources (mass, volume, heater power)
POSSIBLE SOLUTION:EUSO will be “off” around extreme hot case, and identify less severe case for thermal design, still compatible with mission requirement.
TECHNIQUE:use SM to find probability of occurrence of a worst condition, by extending the initial set of 125 cases.

18th European Thermal and ECLS Software Workshop5-6 October 2004, ESA/ESTECSheet 19
��� ����� �
IDENTIFICATION OF WORST THERMAL CASES EUSO – (9/10)
Step Forward: Assessing a probability of compliance to requirement
In 90% of possible cases the LIDAR max. temp. is about 20 °C, thence this could be the goal for the thermal design, which would be sufficient for 90% of the mission
--> EUSO will be switched off only 10% of the time, with a TCS compliant with allocated resources
18th European Thermal and ECLS Software Workshop5-6 October 2004, ESA/ESTECSheet 20
��� ����� �
IDENTIFICATION OF WORST THERMAL CASES EUSO – (10/10)
Test Case Summary
Direct comparison with the traditional procedure:
• Identified the most influent parameters
• Identified global worst cases
• Identified extreme worst cases
STRONG REFINEMENT OF WORST CASES W.R.T. TRADITIONAL
Step forward with the stochastic approach:
• Assessed a probability of compliance to requirement/worst cases
POSSIBILITY TO OPTIMISE P/L MISSION

18th European Thermal and ECLS Software Workshop5-6 October 2004, ESA/ESTECSheet 21
��� ����� �
DESIGN MARGIN & ROBUSTNESS ASSESSMENTHERSCHEL – (1/7)
Herschel satellite maincomponents are:• The SVM• The Cryostat Vacuum
Vessel (CVV, Elium IItank used to cool downthe telescope)
• The Telescope• Sunshade (Telescope
sun shield)• The Sunshield (CVV
sun shield)
18th European Thermal and ECLS Software Workshop5-6 October 2004, ESA/ESTECSheet 22
��� ����� �
DESIGN MARGIN & ROBUSTNESS ASSESSMENTHERSCHEL – (2/7)
Design margins are used to account for uncertainties in the model prediction and test/flight condition.
• MARGINS DEFINED at the beginning of a phase, by experience and sensitivity/uncertainty analysis with available models;
• MARGINS VERIFIED / REFINED during the phase, from updated models;
• DESIGN REFINED following evolution of margins.

18th European Thermal and ECLS Software Workshop5-6 October 2004, ESA/ESTECSheet 23
��� ����� �
DESIGN MARGIN & ROBUSTNESS ASSESSMENTHERSCHEL – (3/7)
Temp.
Quali ficationTemperature
AcceptanceMargin
Quali ficationMargin
AcceptanceTemperature
DesignTemperature
Stochastic Approach:T Calculated < Design Temperature with a determined confidence level
Design margins with stochastic method:
design to fit with specific probability to remain within limits
Temp.
QualificationTemperature
AcceptanceMargin
Uncertainty = DesignMargin
QualificationMargin
AcceptanceTemperature
DesignTemperature
CalculatedTemperature
Traditional Approach:T Calculated < Design Temperature - Design Margin
Design margins with
traditional method
18th European Thermal and ECLS Software Workshop5-6 October 2004, ESA/ESTECSheet 24
��� ����� �
DESIGN MARGIN & ROBUSTNESS ASSESSMENTHERSCHEL – (4/7)
Initial sensitivity/uncertainty analysis
InaccuracyParameter Traditional Approach Stochastic Approach
Absolute Value or Percentage Standard deviation of gaussiandistribution
Absorptivity +0.03 0.015Emissivity -0.03 for emissivity ≥0.2
-0.02 for emissivity <0.20.015 for emissivity ≥0.20.01 for emissivity <0.2
MLI conductance ±25% 12.76%Thermalconductivity
+20% homogenous materials+30% fibre panels and
composites
10.2% homogenous materials15.3% fibre panels and
compositesRadiating area ±5% 2.55%Linear conductivitybetween unit andstructure
±25% internal units±50% external units
12.76% internal units25.51% external units
Dissipation +10% warm units+10% for dissipation < 10 W+5% for dissipation > 10 W
5.1% warm units5.1% for dissipation < 10 W2.55% for dissipation > 10 W

18th European Thermal and ECLS Software Workshop5-6 October 2004, ESA/ESTECSheet 25
��� ����� �
DESIGN MARGIN & ROBUSTNESS ASSESSMENTHERSCHEL – (5/7)
Cumulative Distribution Function (CDF) vs no. of thermal analysis cases, stabilisation after 100 cases, the sample of 500 cases isadequate
18th European Thermal and ECLS Software Workshop5-6 October 2004, ESA/ESTECSheet 26
��� ����� �
DESIGN MARGIN & ROBUSTNESS ASSESSMENTHERSCHEL – (6/7)
Stochastic analysis: 500 cases Latin Hypercube with ST-ORMComparison of traditional/stochastic results:
Traditional Approach Stochastic Approach
I tem
Nominal
Temp.
[°C]Temp.
Design
[°C]
Temp.
Uncer tainty
[°C]
Temp.
Max
Predicted
[°C]
Temp.
Diff.
[°C]
Probability of
compliance
with
TemperatureDesign
Temp.
with 97.5%
probability
Temp.
Diff.
at 97.5%
probability
[°C]
ACC 36,30 42,00 5,00 41,30 0,70 99.80 % 39.95 2.05
FHWOV 5,05 12,00 6,14 11,19 0,81 99.20 % 10.25 1.75
FHWEV 20,50 27,00 5,79 26,29 0,71 98.80 % 26.10 0.90
FHWOH 5,06 12,00 6,12 11,18 0,82 99.60 % 10.25 1.75
FHWEH 20,80 27,00 5,82 26,62 0,38 97.99 % 26.60 0.40
RWL1 45,70 52,00 5,44 51,14 0,86 99.40 % 49.70 2.30
RWL3 46,30 52,00 5,45 51,75 0,25 99.20 % 50.25 1.75
RWL4 46,20 52,00 5,22 51,42 0,58 99.60 % 50.28 1.72

18th European Thermal and ECLS Software Workshop5-6 October 2004, ESA/ESTECSheet 27
��� ����� �
DESIGN MARGIN & ROBUSTNESS ASSESSMENTHERSCHEL – (7/7)
Test Case Summary
Direct comparison with the traditional approach:
• Provided higher temperature margins
RISK OF OVERDESIGN WITH TRADITIONAL CALCULATION OF UNCERTAINTY
Step forward with the stochastic approach:
• Assessed a probability of compliance to requirement
POSSIBILITY TO ASSOCIATE PROBABILITY VALUES TO UNCERTAINTY OF TEMPERATURES
18th European Thermal and ECLS Software Workshop5-6 October 2004, ESA/ESTECSheet 28
��� ����� �
TEST CORRELATION ANALYSIS ASSESSMENTINTEGRAL - (1/11)
INTEGRAL satellite
main components are:
• The S/V
• The INTEGRAL Soft Gamma Ray Imager (ISGRI).
• The INTEGRAL Radiation Environment Monitor (IREM)
• The Joint European X-Ray Monitor (JEM-X)
• The Optical Monitoring Camera (OMC)
• The Imager on Board INTEGRAL Satellite (IBIS).
STR(Star Tracker)
S/VTanks
SAS(Solar Acquisition Sensor)

18th European Thermal and ECLS Software Workshop5-6 October 2004, ESA/ESTECSheet 29
��� ����� �
TEST CORRELATION ANALYSIS ASSESSMENTINTEGRAL - (2/11)
Correlation Analysis CasesCorrelation accounts for two different cases:a) Hot Case - Units close to maximum operative acceptance temperature. b) The Cold Case - Added when it was clear that the hot case only was not
sufficient to obtain good correlation of results.
a) b)
Hot Case Cold Case
18th European Thermal and ECLS Software Workshop5-6 October 2004, ESA/ESTECSheet 30
��� ����� �
TEST CORRELATION ANALYSIS ASSESSMENTINTEGRAL - (3/11)
Analysis of Measurement
Temperature Differences [°C]Mi PiT T− :
Mi
Pi
where
T Measured Temperature
T Calculated Test Temperature
→
→
Temperature Deviation [°C]
Standard Deviation [°C]
1Mi Pi
N
T T TN
∆ = −∑( ) 2
1
Mi PiN
T T T
Nσ
− − ∆ =
−
∑
When
N = Ntot With Ntot equal to the number of all measured temperatures, the above parameters can be referred as Global Temperature Deviation and Global Standard Deviation.
N = ni With ni < Ntot and equal to the number of a particular group of measured temperatures, the above parameters can be referred as Group Temperature Deviation and Group Standard Deviation.

18th European Thermal and ECLS Software Workshop5-6 October 2004, ESA/ESTECSheet 31
��� ����� �
TEST CORRELATION ANALYSIS ASSESSMENTINTEGRAL - (4/11)
Correlation Criteria
• Correlation performed for groups of units:S/V, P/L, TANK, JEM-X, STAR TRACKER, SAS, IBIS
• Criteria for traditional approach:- All Group Temperature Deviations ≤ 7 °C for Hot Case- All Group Temperature Deviations ≤ 6 °C for Cold Case
• Criteria for stochastic approach:1. Temperature level cri teria- G l o b a l T e m p e r a t u r e D e v i a t i o n ≤ 2 ° C f o r C o l d an d H o t
C as e s2 . S tan d ard d eviati o n cri teria- G l o b a l S t a n d a r d D e v i a t i o n ≤ 3 ° C f o r C o l d an d H o t C as e s3 . I n d i vi d ual u n i t s ucce s s cri teria- A l l G r o u p T e m p e r a t u r e D e v i a t i o n s ≤ 7 ° C f o r H o t C as e- A l l G r o u p T e m p e r a t u r e D e v i a t i o n s ≤ 6 ° C f o r C o l d C as e
18th European Thermal and ECLS Software Workshop5-6 October 2004, ESA/ESTECSheet 32
��� ����� �
TEST CORRELATION ANALYSIS ASSESSMENTINTEGRAL - (5/11)
Stochastic Optimisation:ST-ORM stopped after 37 Runs (15 Shots):
Generation of TMM
Execution of the Network Analysis Hot Case
Execution of the Network Analysis ColdCase
Generation of Values of Stochastic Analysis Input Parameters
Collection of Stochastic Analysis Output Parameters

18th European Thermal and ECLS Software Workshop5-6 October 2004, ESA/ESTECSheet 33
��� ����� �
TEST CORRELATION ANALYSIS ASSESSMENTINTEGRAL - (6/11)
Input V a r i a b l e s
(1) A total of 28 independent factors have been defined. One for each thermal conductivity parameter of honeycomb panels defined in the TMM
Parameter Min Max Distr ibution Fine Sun Sensor Head (α) 0.36 0.6 Uniform Fine Sun Sensor Head (ε) 0.833 0.859 Uniform ACC Radiator Efficiency Factor 0.8 1.0 Uniform CAE Radiator Efficiency Factor 0.8 1.0 Uniform IREM external Radiative Coupling Factor 1 14 Uniform MRU Contact Conductance [W/m²K] 100 200 Uniform SAS Bracket Conductance Factor 1 10 Uniform SAS +Y Cold Case Heater Power [W] 1.12 4.48 Uniform SAS -Y Cold Case Heater Power [W] 1.12 4.48 Uniform SAS +Y Hot Case Heater Power [W] 1.12 4.48 Uniform SAS -Y Hot Case Heater Power [W] 1.12 4.48 Uniform STR/Panel GL Factor 1 2 Uniform Honeycomb Panel Conductivity Factors(1) 1 3 Uniform
18th European Thermal and ECLS Software Workshop5-6 October 2004, ESA/ESTECSheet 34
��� ����� �
TEST CORRELATION ANALYSIS ASSESSMENTINTEGRAL - (7/11)
Stochastic Correlation: Results
Compliance of the Correlated Model with Temperature Level Criteria and Standard Deviation Criteria

18th European Thermal and ECLS Software Workshop5-6 October 2004, ESA/ESTECSheet 35
��� ����� �
TEST CORRELATION ANALYSIS ASSESSMENTINTEGRAL - (8/11)
Stochastic Correlation: Results
Compliance of the Correlated Model with Individual Unit Success Criteria
18th European Thermal and ECLS Software Workshop5-6 October 2004, ESA/ESTECSheet 36
��� ����� �
TEST CORRELATION ANALYSIS ASSESSMENTINTEGRAL - (9/11)
Stochastic Correlation: Evolution of Temperatures
Evolution of the Monitored Temperatures during the
Correlation Analysisin Hot Case
Evolution of the Monitored Temperatures during the
Correlation Analysisin Cold Case

18th European Thermal and ECLS Software Workshop5-6 October 2004, ESA/ESTECSheet 37
��� ����� �
TEST CORRELATION ANALYSIS ASSESSMENTINTEGRAL - (10/11)
The stochastic approach provides the lowest maximum absolute values (highlighted in bold) for all the parameters
GROUP Hot Case Cold case Traditional Stochastic Traditional Stochastic ∆T [°C] σ [°C] ∆T [°C] σ [°C] ∆T [°C] σ [°C] ∆T [°C] σ [°C] SVM UNITS -3.2 3.8 -1.05 3.40 1.0 2.8 1.56 2.39 PLM UNITS -3.0 3.0 -1.54 1.79 0.1 2.7 -0.54 2.04 TANK -2.3 3.2 -1.62 2.82 -0.8 5.4 -0.46 5.17 JEM-X 4.5 2.4 1.53 1.86 5.5 2.5 3.47 1.53 STAR TRACKER -0.1 4.4 1.72 2.31 0.5 3.6 1.12 2.28 SAS 0.0 4.5 -3.27 3.41 0.2 1.7 -0.31 3.16 IBIS 3.8 2.1 0.74 2.13 5.0 2.0 1.56 1.63
18th European Thermal and ECLS Software Workshop5-6 October 2004, ESA/ESTECSheet 38
��� ����� �
TEST CORRELATION ANALYSIS ASSESSMENTINTEGRAL - (11/11)
Test Case Summary
Direct comparison with the traditional approach:
• Model correlated vs. Global and Group Criteria
• Model correlated in Hot and Cold cases
• Automatic correlation with stochastic optimisation
SOLVED THE PROBLEMS ENCOUNTERED WITH TRADITIONAL ANALYSIS (GLOBAL CRITERIA, HOT CASE)
Step forward with the stochastic approach:
• Stochastic optimisation with concurrent consideration of Hot and Cold cases
MODEL DIRECTLY CORRELATED IN DIFFERENT CASES WITH A SINGLE STOCHASTIC ANALYSIS

18th European Thermal and ECLS Software Workshop5-6 October 2004, ESA/ESTECSheet 39
��� ����� �
IDENTIFICATION OF WORST CASES IN MULTIDISCIPLINARY ANALYSIS – GOCE - (1/4)
GOCE (Gravity field Ocean Circulation Explorer) satellite is constituted by two main payloads:
• Electrostatic Gravity Gradiometer
• Satellite to Satellite Tracking Instrument.
GOCE Gradiometer
18th European Thermal and ECLS Software Workshop5-6 October 2004, ESA/ESTECSheet 40
��� ����� �
IDENTIFICATION OF WORST CASES IN MULTIDISCIPLINARY ANALYSIS – GOCE - (2/4)
Input Parameters And DistributionsVar iable Distr ib. Min Max File Note
Day of the Year Uniform 1 360 Solar Constant [W] Solar Declination [°]
Dependent on the Day Sun and Epoch parameters. See following comments
Albedo Coefficient Uniform 0.2 0.4 Earth Temperature [K] Uniform 240 257.2
Earth Parameters
Omega Discrete 90 270
GOCE_k.t Right ascension of ascending node. Only two values are possible : 90° 270°
EUSO life parameter Uniform 0 1 GOCE_g.t
GRADIO_g.t Optical Properties of surfaces See following comments
Operative Mode Discrete 1 6 Goce operative modes are six, corresponding to different levels of heat dissipation of the units.
Average Thrust level Discrete 1 4
Four different average thrust level are possible, corresponding to: 1. 1.7 2. 5.8 3. 8.3 4. 200
Thruster profile Discrete 1 3
GOCE.tpl
Three different thrust profile are possible.

18th European Thermal and ECLS Software Workshop5-6 October 2004, ESA/ESTECSheet 41
��� ����� �
IDENTIFICATION OF WORST CASES IN MULTIDISCIPLINARY ANALYSIS – GOCE - (3/4)
Output Variables
Three independent Star Sensors are mounted on GOCE:The alignment of the 3 Star Sensor Reference Frame (SSRF) with the Gradiometer Reference Frame (GRF) shall be verified (Not applicable to Operative Modes 4 and 5)
(ϕ,θ,ψ)j (with j = 1 to 3)
≤2 ·10-4 rad
Identification of extreme cases: Latin Hypercube 120 function evaluations constituted by - 1 thermal radiative analysis case (ESARAD run)- 1 thermal network analysis case (ESATAN run)- 1 structural analysis case (NASTRAN run)
18th European Thermal and ECLS Software Workshop5-6 October 2004, ESA/ESTECSheet 42
��� ����� �
IDENTIFICATION OF WORST CASES IN MULTIDISCIPLINARY ANALYSIS – GOCE - (4/4)
Worst Case:• Omega Angle = 270°• Operative case = 3

18th European Thermal and ECLS Software Workshop5-6 October 2004, ESA/ESTECSheet 43
��� ����� �
STOCHASTIC OPTIMISATION IN MULTIDISCIPLINARY ANALYSIS – PAYLOAD RADIATOR - (1/9)
Structural and TCS optimisation for a radiator
Plate
I lluminated Area
Reinforcements
Radiator in survival mode.TCS shall control the min. and max. temperatures
Temperature requirement:• Red Area with temperature limits 0/40°C.• Blue Area with temperature limits –10/30°C.
Radiator black bound Area is partially illuminated by the sun (100 W/m2).
Maximum deformation Requirements shall be satisfied
18th European Thermal and ECLS Software Workshop5-6 October 2004, ESA/ESTECSheet 44
��� ����� �
STOCHASTIC OPTIMISATION IN MULTIDISCIPLINARY ANALYSIS – PAYLOAD RADIATOR - (2/9)
SM to optimise structure and TCS:
• Find minimum heater power to satisfy requirements.• Define best heater and temperature sensor positions• Evaluate the radiator thickness and thermo-structural characteristics.
TEST PROCEDURE:1. Stochastic Optimisation: definition of best combination of input parameters to
satisfy thermal and structural requirements
2. Material selection: selection of a material with characteristics as similar as possible to those obtained in the previous phase
3. Uncertainty/sensitivity analysis: performed considering:• Inaccuracy for the material selected in phase 2• best heater and sensor positions evaluated in phase 1

18th European Thermal and ECLS Software Workshop5-6 October 2004, ESA/ESTECSheet 45
��� ����� �
STOCHASTIC OPTIMISATION IN MULTIDISCIPLINARY ANALYSIS – PAYLOAD RADIATOR - (3/9)
1 2 3 4 5 6 7 8 9 10 11 12 13 14 15 16 17 18 19 20 21 22 23 24 25 26 27 28 29 30
1 1 2 3 4 5 6 7 8 9 10 11 12 13 14 15 16 17 18 19 20 21 22 23 24 25 26 27 28 29 30
231 32 33 34 35 36 37 38 39 40 41 42 43 44 45 46 47 48 49 50 51 52 53 54 55 56 57 58 59 60
3 61 62 63 64 65 66 67 68 69 70 71 72 73 74 75 76 77 78 79 80 81 82 83 84 85 86 87 88 89 90
4 91 92 93 94 95 96 97 98 99 100 101 102 103 104 105 106 107 108 109 110 111 112 113 114 115 116 117 118 119 120
5 121 122 123 124 125 126 127 128 129 130 131 132 133 134 135 136 137 138 139 140 141 142 143 144 145 146 147 148 149 150
6 151 152 153 154 155 156 157 158 159 160 161 162 163 164 165 166 167 168 169 170 171 172 173 174 175 176 177 178 179 180
7 181 182 183 184 185 186 187 188 189 190 191 192 193 194 195 196 197 198 199 200 201 202 203 204 205 206 207 208 209 210
8211 212 213 214 215 216 217 218 219 220 221 222 223 224 225 226 227 228 229 230 231 232 233 234 235 236 237 238 239 240
9 241 242 243 244 245 246 247 248 249 250 251 252 253 254 255 256 257 258 259 260 261 262 263 264 265 266 267 268 269 270
10 271 272 273 274 275 276 277 278 279 280 281 282 283 284 285 286 287 288 289 290 291 292 293 294 295 296 297 298 299 300
11301 302 303 304 305 306 307 308 309 310 311 312 313 314 315 316 317 318 319 320 321 322 323 324 325 326 327 328 329 330
12 331 332 333 334 335 336 337 338 339 340 341 342 343 344 345 346 347 348 349 350 351 352 353 354 355 356 357 358 359 360
13 361 362 363 364 365 366 367 368 369 370 371 372 373 374 375 376 377 378 379 380 381 382 383 384 385 386 387 388 389 390
14391 392 393 394 395 396 397 398 399 400 401 402 403 404 405 406 407 408 409 410 411 412 413 414 415 416 417 418 419 420
15 421 422 423 424 425 426 427 428 429 430 431 432 433 434 435 436 437 438 439 440 441 442 443 444 445 446 447 448 449 450
X
Y
SM: input parameters
Variable Minimum Value
Maximum Value
Single Heater Power [W] 0. 100. Heater X positions (1) 1 30 Heater Y positions (1) 1 15 Sensor X position (2) 1 30 Sensor Y position (2) 1 15 Plate Thickness [mm] 1 7 Reinforcement Thickness [mm] 1 7 Thermal Conductivity [W/m/k] 100 200 Specific Heat [J/Kg/K] 600 1000 Density [Kg/m3] 2500 3000 Modulus of Elasticity [N/mm2] 72000 206000 Coefficient of Thermal Expansion (CTE) [°C-1] 1.2⋅10-5 2.6⋅10-5
Input Variables: Uniform PDF
18th European Thermal and ECLS Software Workshop5-6 October 2004, ESA/ESTECSheet 46
��� ����� �
STOCHASTIC OPTIMISATION IN MULTIDISCIPLINARY ANALYSIS – PAYLOAD RADIATOR - (4/9)
Stochastic Optimisation: Output parameters
1) Temperatures reached in transient simulation (10,000 sec). Requirements are 0! !T 40 and -10! !T 3 0, e q u a l i t y o p t i o n m i n i m i s e t h e h e a t e r p o w e r .
2) Calculated during the last 5000 sec of transient simulation.3) Displacement reached in transient simulation (10,000 sec). Requirement is
Displ ! 0 . 1 5
Variable Target Value
Minimum Temperature Red Area [°C] (1) =0
Minimum Temperature Blue Area [°C] (1) =-10
Maximum Temperature Red Area [°C] (1) <40
Maximum Temperature Blue Area [°C] (1) <30
Heater Duty Cycle(2) =80%
Maximum Displacement [mm] (3) =0.15

18th European Thermal and ECLS Software Workshop5-6 October 2004, ESA/ESTECSheet 47
��� ����� �
STOCHASTIC OPTIMISATION IN MULTIDISCIPLINARY ANALYSIS – PAYLOAD RADIATOR - (5/9)
Stochastic Optimisation: ST-ORM stopped after 60 Runs (15 Shots)
• Red Zone temperatures: Both temperature targets reached • Blue zone temperatures: Only Maximum temperature target reached
Target
Target
Difficult to obtain high temperature gradient (10°C) in areas very close and strongly linearly coupled
:
18th European Thermal and ECLS Software Workshop5-6 October 2004, ESA/ESTECSheet 48
��� ����� �
STOCHASTIC OPTIMISATION IN MULTIDISCIPLINARY ANALYSIS – PAYLOAD RADIATOR - (6/9)
Stochastic Optimisation: ST-ORM stopped after 60 Runs (15 Shots)
• Duty cycle: Target reached • Maximum displacement: Target reached
Target
Target

18th European Thermal and ECLS Software Workshop5-6 October 2004, ESA/ESTECSheet 49
��� ����� �
STOCHASTIC OPTIMISATION IN MULTIDISCIPLINARY ANALYSIS – PAYLOAD RADIATOR - (7/9)
Stochastic Optimisation:Results
1 2 3 4 5 6 7 8 9 10 11 12 13 14 15 16 17 18 19 20 21 22 23 24 25 26 27 28 29 30
1 1 2 3 4 5 6 7 8 9 10 11 12 13 14 15 16 17 18 19 20 21 22 23 24 25 26 27 28 29 30
2 31 32 33 34 35 36 37 38 39 40 41 42 43 44 45 46 47 48 49 50 51 52 53 54 55 56 57 58 59 60
3 61 62 63 64 65 66 67 68 69 70 71 72 73 74 75 76 77 78 79 80 81 82 83 84 85 86 87 88 89 90
4 91 92 93 94 95 96 97 98 99 100 101 102 103 104 105 106 107 108 109 110 111 112 113 114 115 116 117 118 119 120
5 121 122 123 124 125 126 127 128 129 130 131 132 133 134 135 136 137 138 139 140 141 142 143 144 145 146 147 148 149 150
6 151 152 153 154 155 156 157 158 159 160 161 162 163 164 165 166 167 168 169 170 171 172 173 174 175 176 177 178 179 180
7 181 182 183 184 185 186 187 188 189 190 191 192 193 194 195 196 197 198 199 200 201 202 203 204 205 206 207 208 209 210
8 211 212 213 214 215 216 217 218 219 220 221 222 223 224 225 226 227 228 229 230 231 232 233 234 235 236 237 238 239 240
9 241 242 243 244 245 246 247 248 249 250 251 252 253 254 255 256 257 258 259 260 261 262 263 264 265 266 267 268 269 270
10 271 272 273 274 275 276 277 278 279 280 281 282 283 284 285 286 287 288 289 290 291 292 293 294 295 296 297 298 299 300
11 301 302 303 304 305 306 307 308 309 310 311 312 313 314 315 316 317 318 319 320 321 322 323 324 325 326 327 328 329 330
12 331 332 333 334 335 336 337 338 339 340 341 342 343 344 345 346 347 348 349 350 351 352 353 354 355 356 357 358 359 360
13 361 362 363 364 365 366 367 368 369 370 371 372 373 374 375 376 377 378 379 380 381 382 383 384 385 386 387 388 389 390
14 391 392 393 394 395 396 397 398 399 400 401 402 403 404 405 406 407 408 409 410 411 412 413 414 415 416 417 418 419 420
15 421 422 423 424 425 426 427 428 429 430 431 432 433 434 435 436 437 438 439 440 441 442 443 444 445 446 447 448 449 450
Heater Sensor
X
Y
Heaters and sensor positions
Geometrical and Physical Variables
Input Variable Value from Optimisation
Single Heater Power [W] 26 Plate Thickness [mm] 4.3 Reinforcement Thickness [mm] 1.5 Thermal Conductivity [W/m/k] 168 Specific Heat [J/Kg/K] 916 Density [Kg/m3] 2593 Modulus of Elasticity [N/mm2] 74237 Coefficient of Thermal Expansion (CTE) [°C-1] 1.8⋅10-5
Al2219-O value 171 864
2840 73100
2.23⋅10-5
18th European Thermal and ECLS Software Workshop5-6 October 2004, ESA/ESTECSheet 50
��� ����� �
STOCHASTIC OPTIMISATION IN MULTIDISCIPLINARY ANALYSIS – PAYLOAD RADIATOR - (8/9)
Uncertainty / Sensitivity analysis
Input Variables: Gaussian PDF
Physical property Mean Standard deviation
Thermal Conductivity [W/m/k] 171 5 Specific Heat [J/Kg/K] 864 26 Density [Kg/m3] 2840 85 Modulus of Elasticity [N/mm2] 73100 2193 Coefficient of Thermal Expansion (CTE) [°C-1] 2.23⋅10-5 0.07⋅10-5 Single Heater Power [W] 26 0.8 Plate Thickness [mm] 4.3 0.13 Reinforcement Thickness [mm] 1.5 0.04
STORM used to generate a sample of 500 thermal analysis cases
Mean Outputs stabilised:Sample dimension adequate

18th European Thermal and ECLS Software Workshop5-6 October 2004, ESA/ESTECSheet 51
��� ����� �
STOCHASTIC OPTIMISATION IN MULTIDISCIPLINARY ANALYSIS – PAYLOAD RADIATOR - (9/9)
Uncertainty / Sensitivity analysis
Descr iption X_Min X_Max Mean Std CV(%) Min95% Max95% Requirement
Max Displacement 0.093 0.13 0.11 0.0062 5.6 0.098 0.12 ! 0.15
T min Red Zone 0.04 0.28 0.173 0.0433 25 0.09 0.2 " 0
T min Blue Zone -3.31 -2.41 -2.75 0.136 4.9 -3.0 -2.5 " -10
T max Red Zone 34 42.2 37.4 1.24 3.3 34.9 39.9 ! 40
T max Blue Zone 22.4 28.1 24.8 0.86 3.5 23.0 26.5 ! 30
Duty Cycle 69.5 100 80.9 5.53 6.8 69.8 91.9 80%
For all the Output variables the requirements are satisfied with a probability of 95%.
18th European Thermal and ECLS Software Workshop5-6 October 2004, ESA/ESTECSheet 52
��� ����� �
STOCHASTIC APPROACH INMULTIDISCIPLINARY ANALYSIS - SUMMARY
Multidisciplinary Test Cases Summary
• Considered inaccuracy/variation of structural parameters
• Considered inaccuracy/variation of thermal parameters
• Considered inaccuracy/variation of configuration parameters (positions)
• Direct assessment of structural sensitivities w.r.t. structural and non structural parameters
• Direct assessment of structural uncertainties due to inaccuracy of structural and non structural parameters
• Concurrent optimisation of structure and TCS design
POSSIBILITY OF CONCURRENT DEVELOPMENT OF STRUCTURE AND TCS

18th European Thermal and ECLS Software Workshop5-6 October 2004, ESA/ESTECSheet 53
��� ����� �
MISSION RISK ANALYSIS - BEPICOLOMBO MSE
Test Case Summary
• Considered inaccuracy/variation of:
a. Mercury soil characteristics
b. Inaccuracy of Aluminium properties
c. Variations of thermo-optical properties of materials
• Assessed the probability of survival
• Found the most influent parameters to reduce the risk of failure of the mission
POSSIBILITY TO ASSESS THE RISK OF THE MISSION AND FIND PARAMETERS FOR REDUCING IT
Rocks
Mercury soilDiameter = 100 m
X
YZ
MSE Position
Probability that the P/L temperature exceeds 35°C before 7 days is about 97%
18th European Thermal and ECLS Software Workshop5-6 October 2004, ESA/ESTECSheet 54
��� ����� �
SENSITIVITY/UNCERTAINTY ANALYSIS AND DESIGN OPTIMISATION OF SPHYNX
Test Cases SummaryDirect comparison with the traditional approach:
• Considered inaccuracy/variation of more than 60 parameters
• Assessed the sensitivity to the input parameters
• Assessed the uncertainty of temperature results
FOUND AREAS OF TPS OVER-DESIGN AND UNDER-DESIGN
Step Forward with the stochastic approach:
• Applied the stochastic optimisation to TPS design
17% REDUCTION OF THE TPS MASS BUDGET
Fuselagezone
Aftzone
Rudder zone

18th European Thermal and ECLS Software Workshop5-6 October 2004, ESA/ESTECSheet 55
��� ����� �
PRELIMINARY RADIATOR SIZING - VENUSSAT
Test Case Summary
Direct comparison with the traditional approach:
• Assessed worst cases
• Preliminary radiators sized with a stochastic optimisation
FAST AND AUTOMATIC SIZING OF RADIATORS ACCOUNTING FOR REQUIREMENTS
Step forward with the stochastic approach:
• Stochastic optimisation accounting for 3 different external environments
POSSIBILITY TO SIZE RADIATORS FOR DIFFERENT EXTERNAL LOADS AND REQUIREMENTS
18th European Thermal and ECLS Software Workshop5-6 October 2004, ESA/ESTECSheet 56
��� ����� �
TCS ACTIVITY CHANGE TO INCORPORATE STOCHASTIC METHODS – (1/2)
FROM: satisfy the thermal requirements accounting for uncertainty of parameters
NO
Temperaturerequirements
Margins assumptions(from experience)
Sensitivity analysisand uncertaintycalculation Ufp
Thermal analysesandDesign definition:
design achieved when:T + Margin < TmaxT - Margin > Tmax
NO
YESMargins
confirmed(Ufp < Margin) ?
Update / increasemargins
Update / improvedesign
Design achieved
Calculate confidence levelcorrespondent to Ufp, CL(Ufp)
CL( Ufp) toohigh ?
Relax design
YES
18th European Thermal and ECLS Software Workshop5-6 October 2004, ESA/ESTECSheet 57
��� ����� �
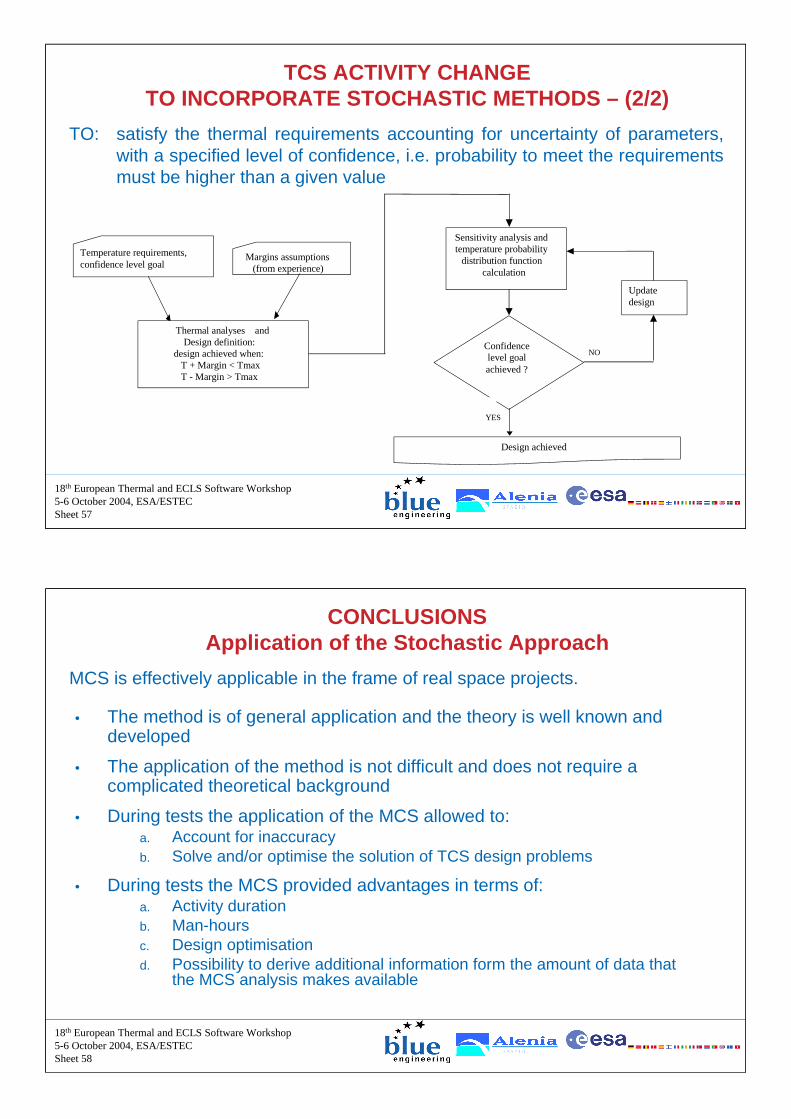
TCS ACTIVITY CHANGE TO INCORPORATE STOCHASTIC METHODS – (2/2)
TO: satisfy the thermal requirements accounting for uncertainty of parameters, with a specified level of confidence, i.e. probability to meet the requirements must be higher than a given value
Temperature requirements,confidence level goal
Margins assumptions(from experience)
Thermal analyses andDesign definition:
design achieved when:T + Margin < TmaxT - Margin > Tmax
Sensitivity analysis andtemperature probability
distribution functioncalculation
Confidencelevel goalachieved ?
Updatedesign
NO
YES
Design achieved
18th European Thermal and ECLS Software Workshop5-6 October 2004, ESA/ESTECSheet 58
��� ����� �
CONCLUSIONSApplication of the Stochastic Approach
MCS is effectively applicable in the frame of real space projects.
• The method is of general application and the theory is well known and developed
• The application of the method is not difficult and does not require a complicated theoretical background
• During tests the application of the MCS allowed to:a. Account for inaccuracyb. Solve and/or optimise the solution of TCS design problems
• During tests the MCS provided advantages in terms of:a. Activity durationb. Man-hours c. Design optimisationd. Possibility to derive additional information form the amount of data that
the MCS analysis makes available

18th European Thermal and ECLS Software Workshop5-6 October 2004, ESA/ESTECSheet 59
��� ����� �
CONCLUSIONSComparison of Possible Stochastic Methodologies
Feasible when subcontractors are involved
Feasible when interface with other subsystems is necessary
Possible use of small samples for some types of analyses
Feasible in all phases of development
Reduced change of engineering approach
Always accounting for inaccuracy
+
+
+
+
+
+
Stochastic methodology focused on single activities
of TCS
Global stochastic methodology for TCS
18th European Thermal and ECLS Software Workshop5-6 October 2004, ESA/ESTECSheet 60
��� ����� �
CONCLUSIONSRecommendations For Future Activities
• INACCURACY OF PARAMETERS:
Studies dedicated to advanced methods for testing and measuring properties of materials in order to generate specific data relevant to inaccuracy would be useful.
• OPTIMISATION PROCEDURES:
It would be interesting the evaluation of the use of the MCS for accounting of inaccuracy together with different optimisation procedures (e.g. procedures based on emulators rather than on simulators).

18th European Thermal and ECLS Software Workshop5-6 October 2004, ESA/ESTECSheet 61
��� ����� �
DISTRIBUTION OF RESULTS
In ESA website will be available the results of the project :
• The Final Report: “Analysis and Assessment”, 02.07.035/TN4, issue 1, 30/9/2004
• The Handbook: “Guidelines for the Assessment and Implementation of Stochastic Methods for Space Thermal Analysis”, 02.07.035/TN5, issue 1, 30/9/2004
• The Executive Report: “Executive Report”, 02.07.035/TN6, issue 1, 30/9/2004
• The HTML version of the Handbook
• Some examples of the models implemented and used during the project


