1 Feasibility Study for Effluent Thermal Energy Recovery at the Ithaca Area Wastewater Treatment Facility CEE 5910 Final Report Spring 2019 Written by: Shuyao Cai, Andrew Kang, Victor Khong, Mingdi Li, Saurav Sharma, Ken Shimizu, Katie White, Zixian Zhu
Transcript
1
Feasibility Study for Effluent Thermal
Energy Recovery at the Ithaca Area
Wastewater Treatment Facility
CEE 5910 Final Report
Spring 2019
Written by: Shuyao Cai, Andrew Kang, Victor Khong, Mingdi Li, Saurav Sharma, Ken Shimizu,
Katie White, Zixian Zhu
2
Table of Contents
Advisor’s Introduction 4
Executive Summary 5
Motivation for the Topic 6
Goals of the Project 6
Individual Background of Team Members 6
Scoping Statement and Clarifying Assumptions 7
Topics Explicitly Included in This Study 8
Topics Explicitly Excluded from This Study 8
Key Assumptions 8
Market Analysis 9
Technology and Equipment 9
Heat Pumps 9
Expansion Valves 10
Heat Exchanger 11
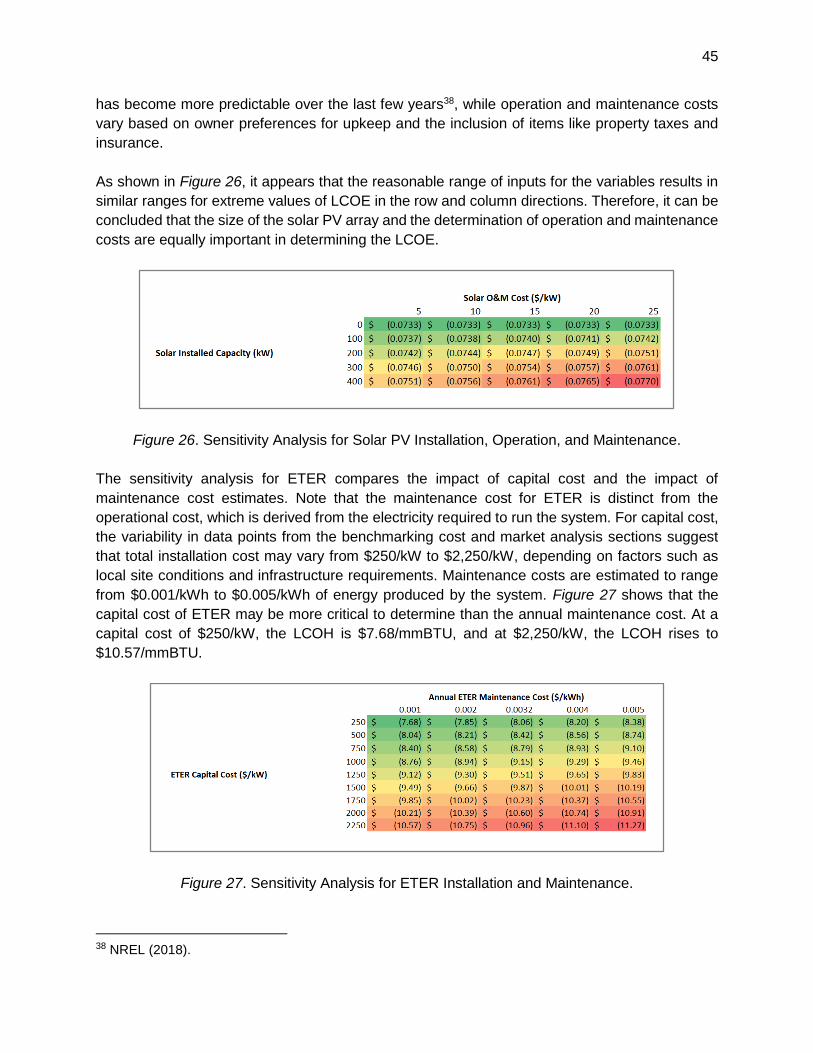
Energy Recovery within Wastewater Treatment Facilities 12
Chicago, Illinois 12
Gresham, Oregon 12
External District Energy Applications and Economics 13
Process for Thermal Heat Production in Buildings 13
Comparable District Systems in Canada 14
Single Building Application: Kiheung Respia WWTP, Korea 16
An Example of Competitive Alternatives: Freistadt WWTP, Austria 18
Building Demand: Xi’an Urban Wastewater Source Heat Pump (WWSHP) System 19
Local Application: ETER Prospect at City Harbor 20
Environmental Scope of ETER and Alternative Uses 21
Green Bay, Wisconsin 21
Hofmatt, Switzerland 21
University of Burgundy, France 23
Ithaca Wastewater Treatment Plant Overview and Lifecycle Analysis 23
Analysis of ETER Applications to IAWWTF 26
Technical Dimension and System Overview 26
Sludge Drying System Calculations and Potential Savings 27
Benchmarking Costs and Revenue 28
Korea Plant Analysis 28
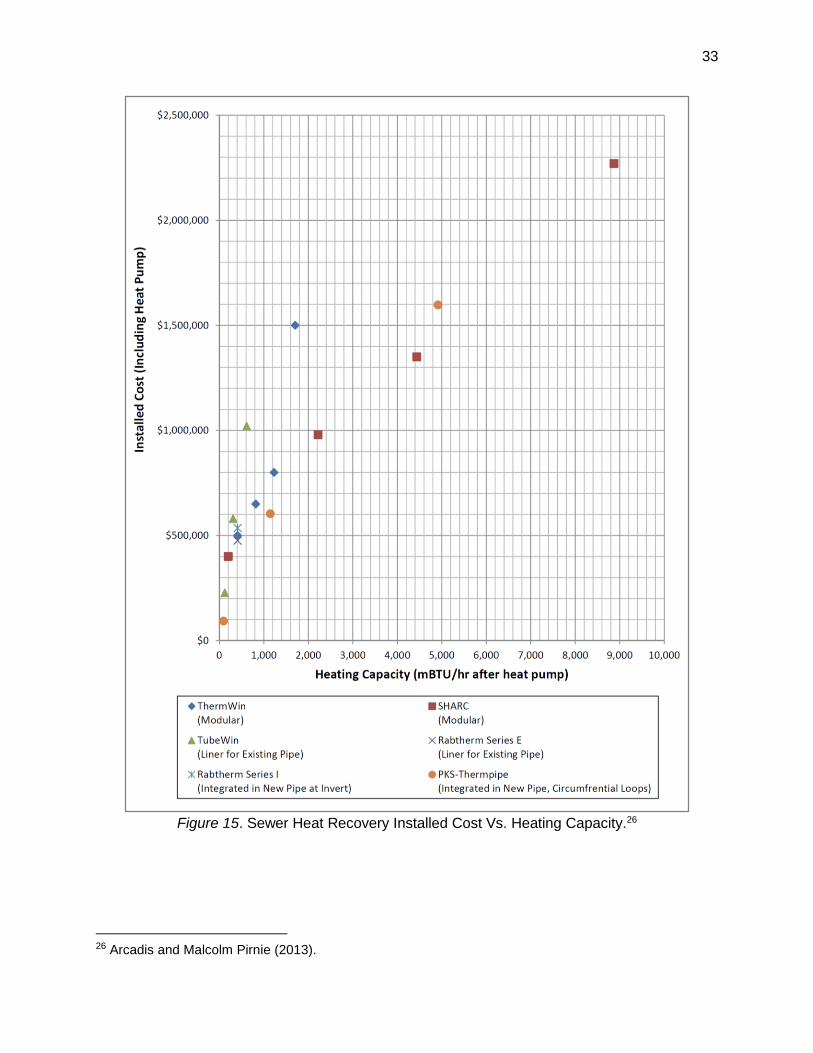
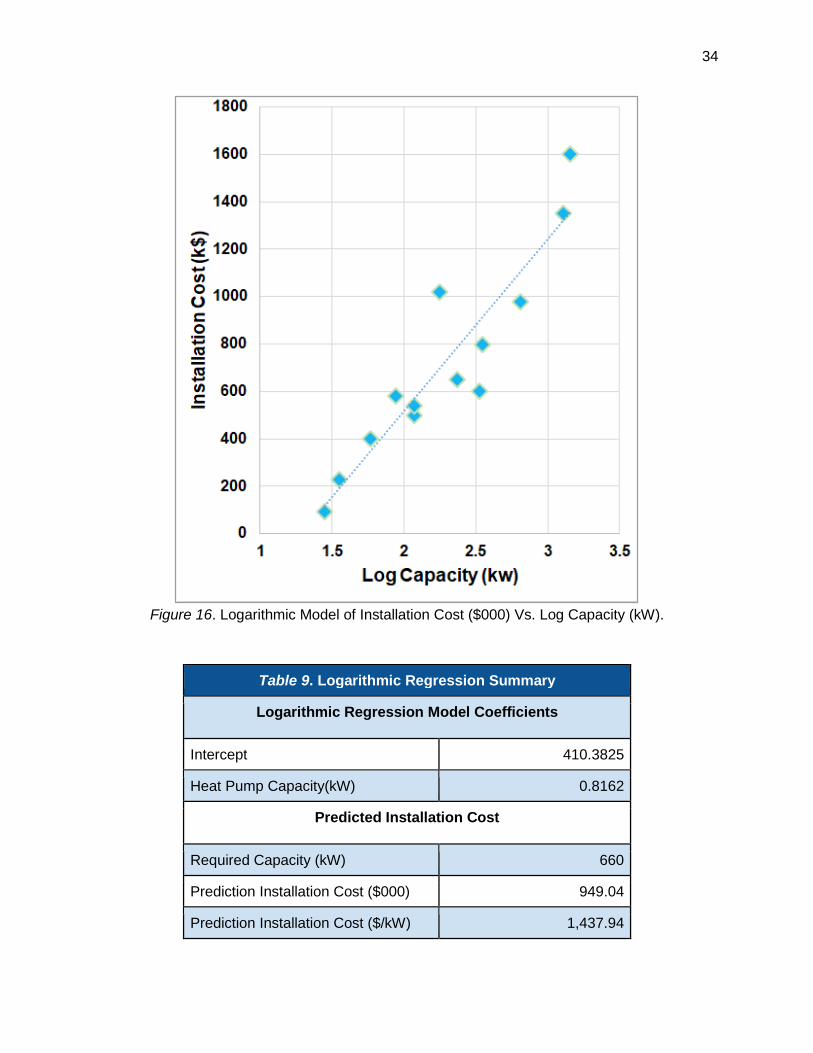
Heat Pump Manufacturer Regression 32
Solar Analysis 35
3
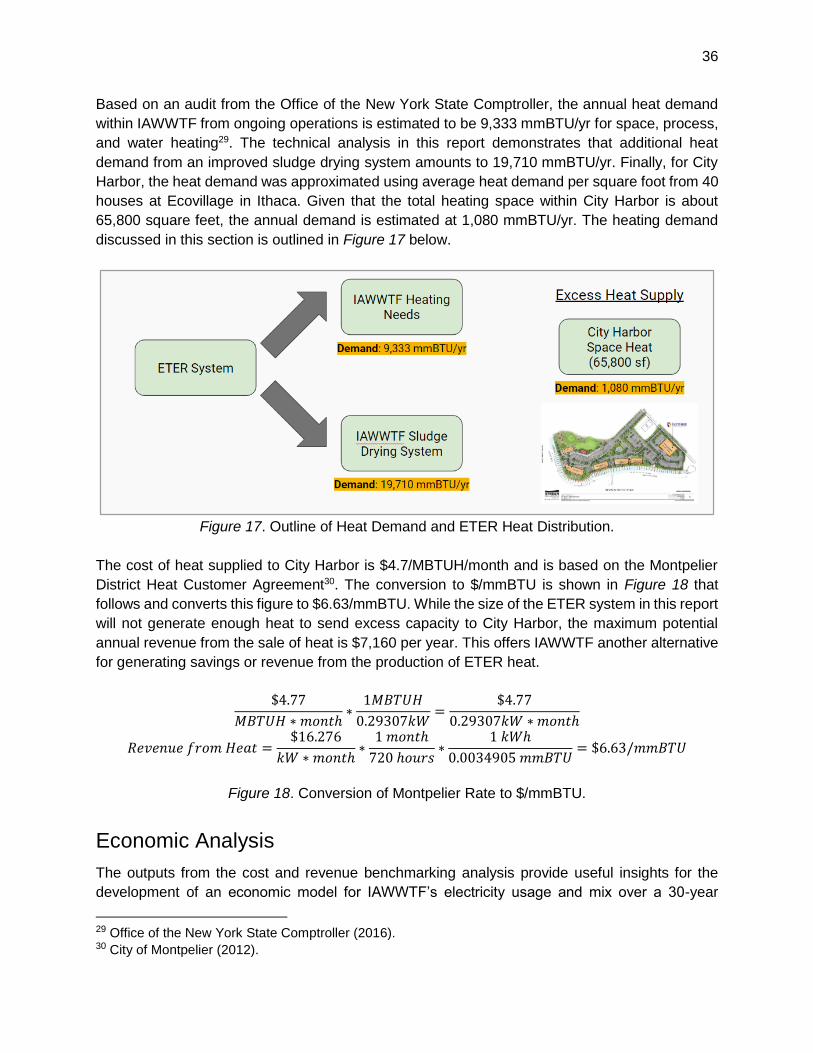
Revenue and Heat Demand from City Harbor 35
Economic Analysis 36
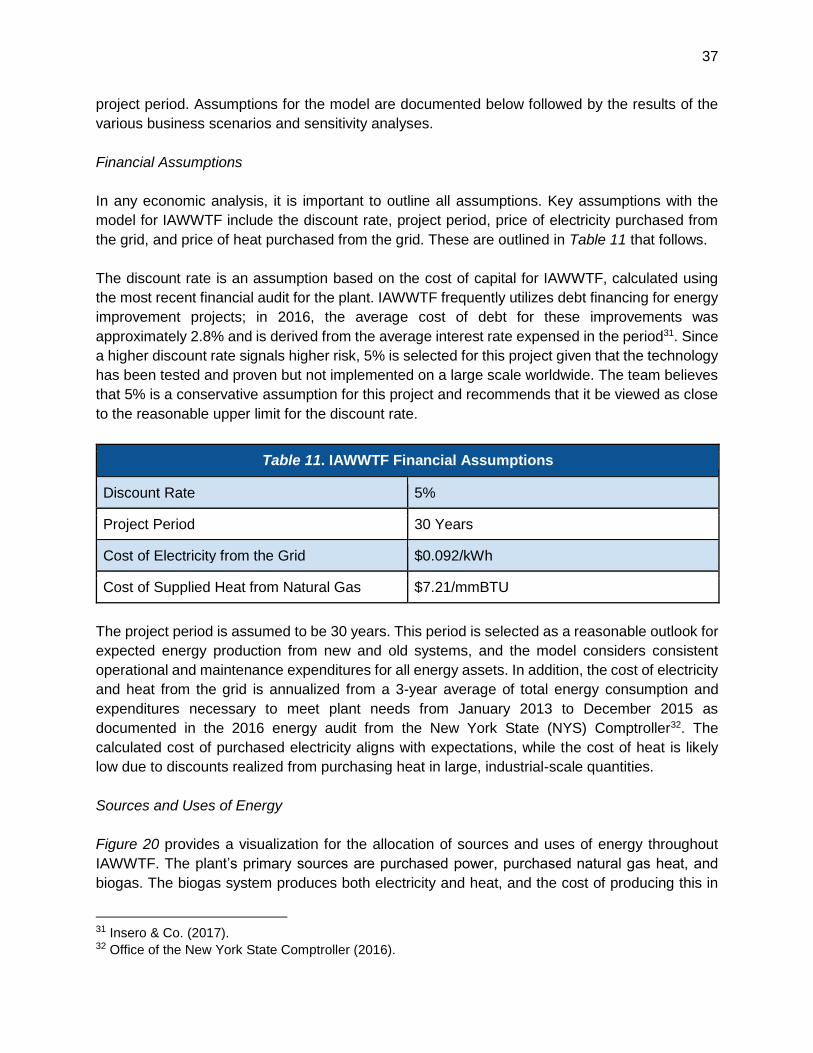
Financial Assumptions 37
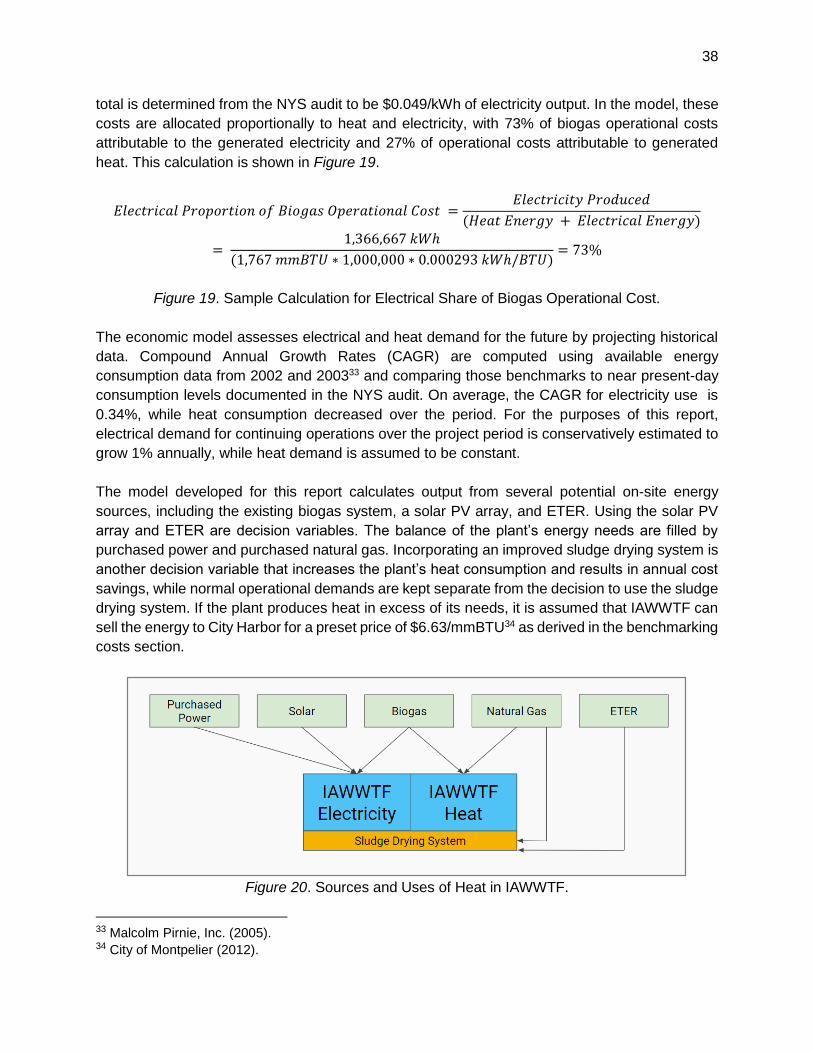
Sources and Uses of Energy 37
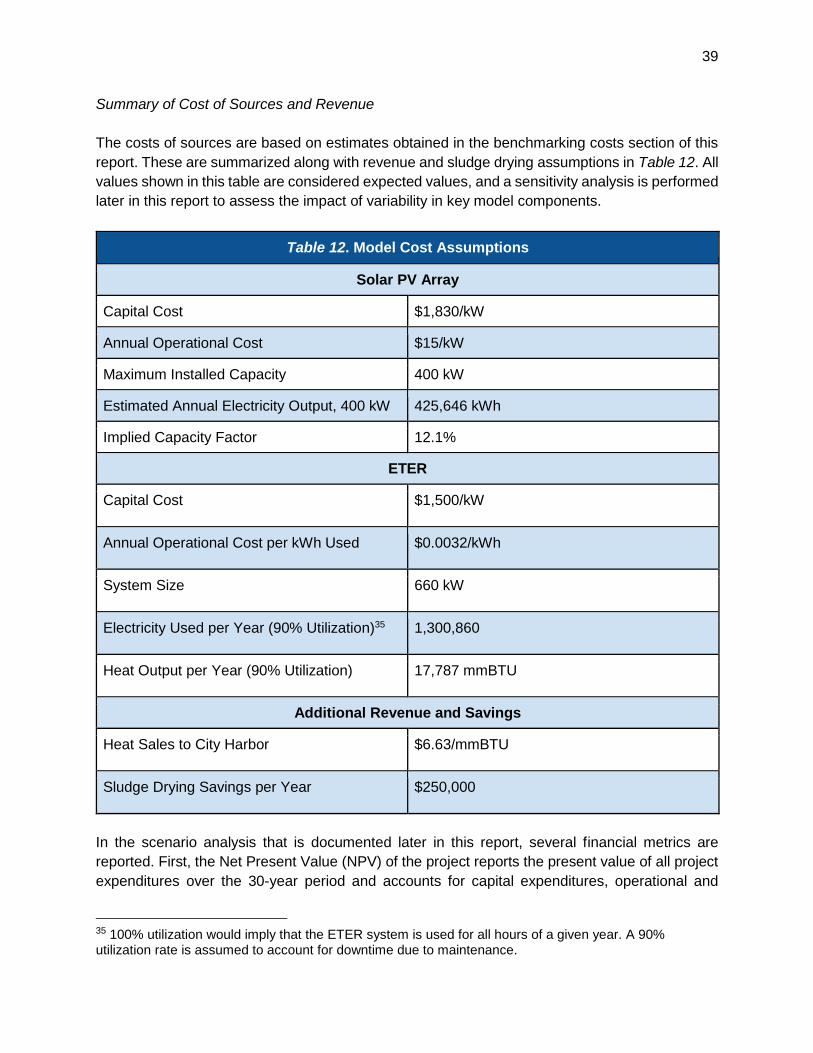
Summary of Cost of Sources and Revenue 39
Scenario Analysis 41
Results and Sensitivity 43
Environmental Analysis 46
Solar Installation Details 46
Emissions Breakdown at IAWWTF 47
Emissions by Scenario and ETER Benefits 48
Recommendations 51
Sources 53
4
Advisor’s Introduction
As faculty member in the School of Civil & Environmental Engineering at Cornell University, I
am pleased to write this introduction to the study that follows, “Feasibility Study for Effluent
Thermal Energy Recovery at the Ithaca Area Waste Water Treatment Facility.” I have had the
pleasure of working with eight students in our program: four from environmental engineering,
three from engineering management, and one from civil engineering.
Effluent Thermal Energy Recovery, or ETER for short, represents a potential source of
renewable energy that to date has not been greatly exploited in the U.S. ETER can be
accessed in sewer mains as they pass through the metropolis, but treatment plants are an
especially beneficial location, since the flow is so concentrated at that point, on the order of
millions of gallons per day, or more. Heat pumps introduced into the flow have the advantage
that capital costs are lowered compared to digging trenches or wells. The heat extracted can be
used internally within the wastewater treatment operation, or exported to adjacent loads.
Working with our partner Dr. Jose Lozano, Laboratory Director at IAWWTF, the student team
has assessed the size of the resource, the demands of possible loads, and technologies that
might be appropriate. They have also conducted an economic analysis of the project and
estimated greenhouse gas reductions. They have also considered how ETER might combine
with other sustainable options such as combined heat and power based on methane produced
from a biodigester, or a possible commercial-scale solar PV array installed at the plant.
In closing, the reader should be aware that this study was conducted for educational
purposes. The values contained in this report should not be used as a basis for decision-
making about a specific ETER project, as up-to-date costs for specific regions are needed for
that purpose. On behalf of the team, I wish to thank Jose and his assistants Gabrielle Hollfelder
and Roxanne Roberts for their assistance during this project and for the opportunity to work with
them on this promising technology. While their input is gratefully acknowledged, the contents of
this report do not represent the official positions of the Ithaca Area Waste Water Treatment
Facility or Cornell University, and responsibility for any and all errors and omissions rests with
the team and myself.
Yours in sustainability,
Francis M Vanek, PhD
Senior Lecturer and Research Associate
5
Executive Summary
The purpose of this report is to understand and analyze the implementation of an Effluent Thermal
Energy Recovery (ETER) system at the Ithaca Area Wastewater Treatment Facility (IAWWTF).
ETER is a developing technology that can extract heat from wastewater for distribution to an
internal or external system. Many examples and applications of ETER technology exist within and
outside of the United States. For this report, a team of Cornell University engineering students
focuses on the significance of carbon emissions from fossil fuels and calculates economic and
environmental outputs for an ETER system at IAWWTF over a 30-year investment horizon. By
determining the basic components, system capacity, sources and uses of energy, and developing
a comprehensive model that integrates options for a solar photovoltaic (PV) array, the team is
able to make recommendations for IAWWTF.
Using provided and researched information, the team analyzes the viability and benefits of ETER
at IAWWTF. ETER could produce enough heat to thoroughly dry sludge output at the plant, saving
at least $250,000 in annual landfill fees. Furthermore, any additional heat could be used for
ongoing operations or sold to the nearby City Harbor development. In addition, implementing solar
panels at IAWWTF would enable the plant to take a large step towards energy independence,
and this is found to be a cost-effective approach to reducing carbon emissions. While ETER and
solar have high capital costs, the analysis shows that the investment may pay off over time
because of sludge drying savings and relatively low operational costs.
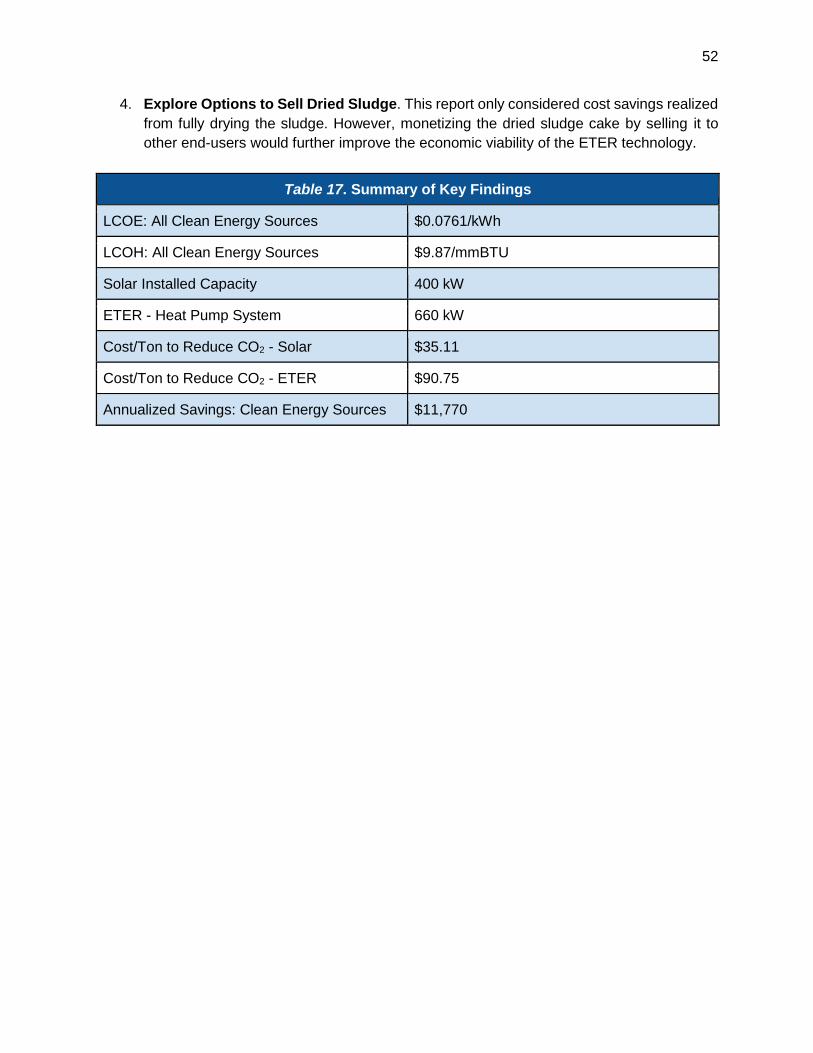
The team suggests that IAWWTF further study the implementation of both ETER and solar in
order to achieve optimal results. A 660-kW heat pump for the ETER system would reduce CO2 at
a cost of $90.75/ton. Combining the technologies can save IAWWTF about 590,000 kg of CO2
per year relative to the business-as-usual scenario with a sludge drying system powered entirely
by natural gas. It is also recommended that IAWWTF prioritize the installation of a solar array
because of its relatively low cost of reducing CO2 at $35.11/ton. Further research should be
performed to optimize the allotted space for solar around the facility, which would increase
installation capacity and reduce the carbon footprint of the electrical input for ETER. Finally, it is
important to secure a low total installation for ETER if possible, as sensitivity analyses reveal that
this is a critical factor in determining economic viability. However, conservative estimates and
studies of other plants show potential for a return on investment between 6 and 10 years, which
can be improved by exploring options to sell dried sludge to various end-users.
6
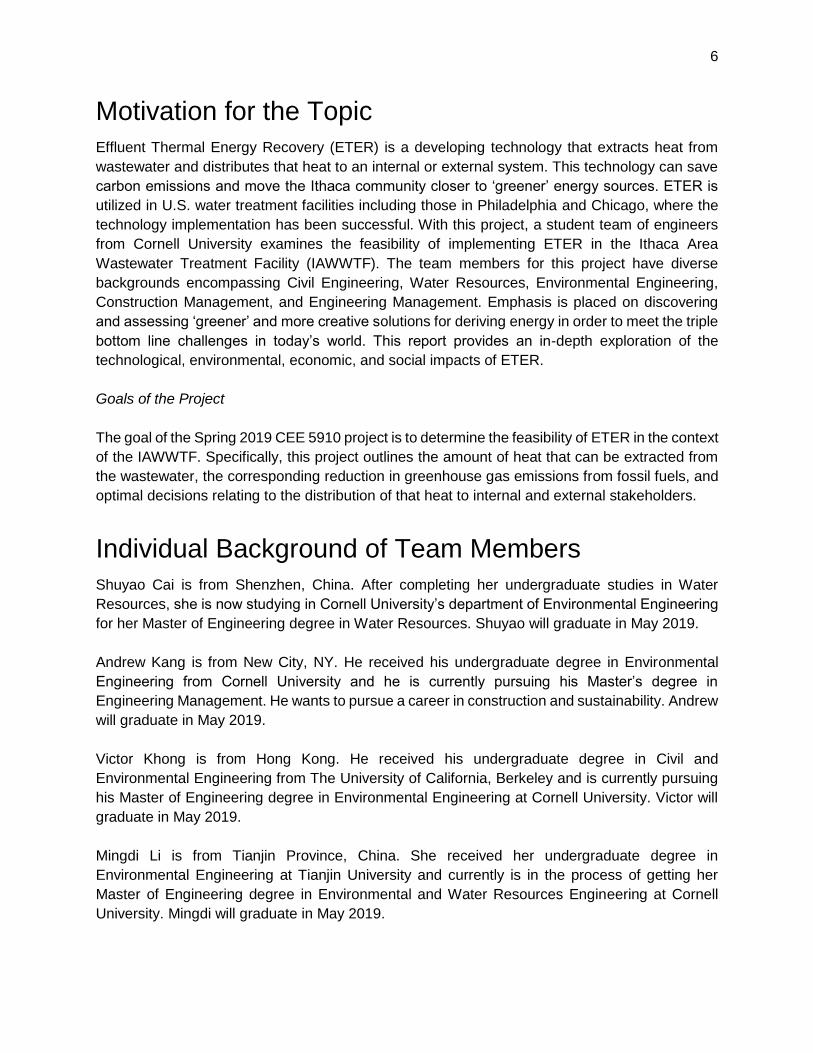
Motivation for the Topic
Effluent Thermal Energy Recovery (ETER) is a developing technology that extracts heat from
wastewater and distributes that heat to an internal or external system. This technology can save
carbon emissions and move the Ithaca community closer to ‘greener’ energy sources. ETER is
utilized in U.S. water treatment facilities including those in Philadelphia and Chicago, where the
technology implementation has been successful. With this project, a student team of engineers
from Cornell University examines the feasibility of implementing ETER in the Ithaca Area
Wastewater Treatment Facility (IAWWTF). The team members for this project have diverse
backgrounds encompassing Civil Engineering, Water Resources, Environmental Engineering,
Construction Management, and Engineering Management. Emphasis is placed on discovering
and assessing ‘greener’ and more creative solutions for deriving energy in order to meet the triple
bottom line challenges in today’s world. This report provides an in-depth exploration of the
technological, environmental, economic, and social impacts of ETER.
Goals of the Project
The goal of the Spring 2019 CEE 5910 project is to determine the feasibility of ETER in the context
of the IAWWTF. Specifically, this project outlines the amount of heat that can be extracted from
the wastewater, the corresponding reduction in greenhouse gas emissions from fossil fuels, and
optimal decisions relating to the distribution of that heat to internal and external stakeholders.
Individual Background of Team Members
Shuyao Cai is from Shenzhen, China. After completing her undergraduate studies in Water
Resources, she is now studying in Cornell University’s department of Environmental Engineering
for her Master of Engineering degree in Water Resources. Shuyao will graduate in May 2019.
Andrew Kang is from New City, NY. He received his undergraduate degree in Environmental
Engineering from Cornell University and he is currently pursuing his Master’s degree in
Engineering Management. He wants to pursue a career in construction and sustainability. Andrew
will graduate in May 2019.
Victor Khong is from Hong Kong. He received his undergraduate degree in Civil and
Environmental Engineering from The University of California, Berkeley and is currently pursuing
his Master of Engineering degree in Environmental Engineering at Cornell University. Victor will
graduate in May 2019.
Mingdi Li is from Tianjin Province, China. She received her undergraduate degree in
Environmental Engineering at Tianjin University and currently is in the process of getting her
Master of Engineering degree in Environmental and Water Resources Engineering at Cornell
University. Mingdi will graduate in May 2019.
7
Saurav Sharma is from Kathmandu, Nepal. He is currently pursuing his undergraduate degree in
Civil Engineering at Cornell University. Saurav will graduate in May 2019. Upon graduation,
Saurav plans to work in the field of road construction and eventually switch to project
management.
Ken Shimizu is from Edina, MN. He received his undergraduate degree in Civil Engineering from
Cornell University and is currently pursuing his Master of Engineering degree in Engineering
Management. Upon graduation in May 2019, Ken plans to work in the field of real estate,
construction, and infrastructure consulting.
Katie White is from Pittsburgh, PA. She received her undergraduate degree in Civil Engineering
from Cornell University and is currently pursuing her Master of Engineering degree in Engineering
Management. Katie will graduate in May 2019.
Zixian Zhu is from Anhui Province, China. She completed her undergraduate degree in
Construction Management at Beijing Jiaotong University. Currently, she is finishing her Master of
Engineering degree in Engineering Management at Cornell University and will graduate in May
2019.
Scoping Statement and Clarifying Assumptions
Considering the motivation behind this study, the reduction in greenhouse gas emissions due to
the introduction of the ETER in IAWWTF is determined. This requires an in-depth lifecycle
analysis of the plant and research on the equipment that will be used in a proposed ETER system.
The thermodynamics within the system are investigated, including the heat transfer between the
wastewater and the equipment, heat extraction coefficients of the different metals that make up
the equipment, and the energy required to power the heat pump.
Another important consideration is the economic feasibility of the plant. The plant should ideally
be sustainable such that the revenue or savings generated is greater than the cost incurred from
producing ETER heat. This requires an examination of the industrial equipment that is included
in the design system. A financial analysis is conducted to ensure that the ETER system is viable
and attractive for IAWWTF financially, whether that involves distribution of heat to internal
stakeholders, external stakeholders, or a combination of these two parties.
Finally, conclusions and recommendations are provided at the end of the study. Since the goal is
to optimize the benefits of the ETER system, the team examines how the different perspectives
are directly impacted from the introduction of the system and whether all of the economic,
environmental, and social components will benefit from ETER or other clean energy sources like
solar PV arrays.
8
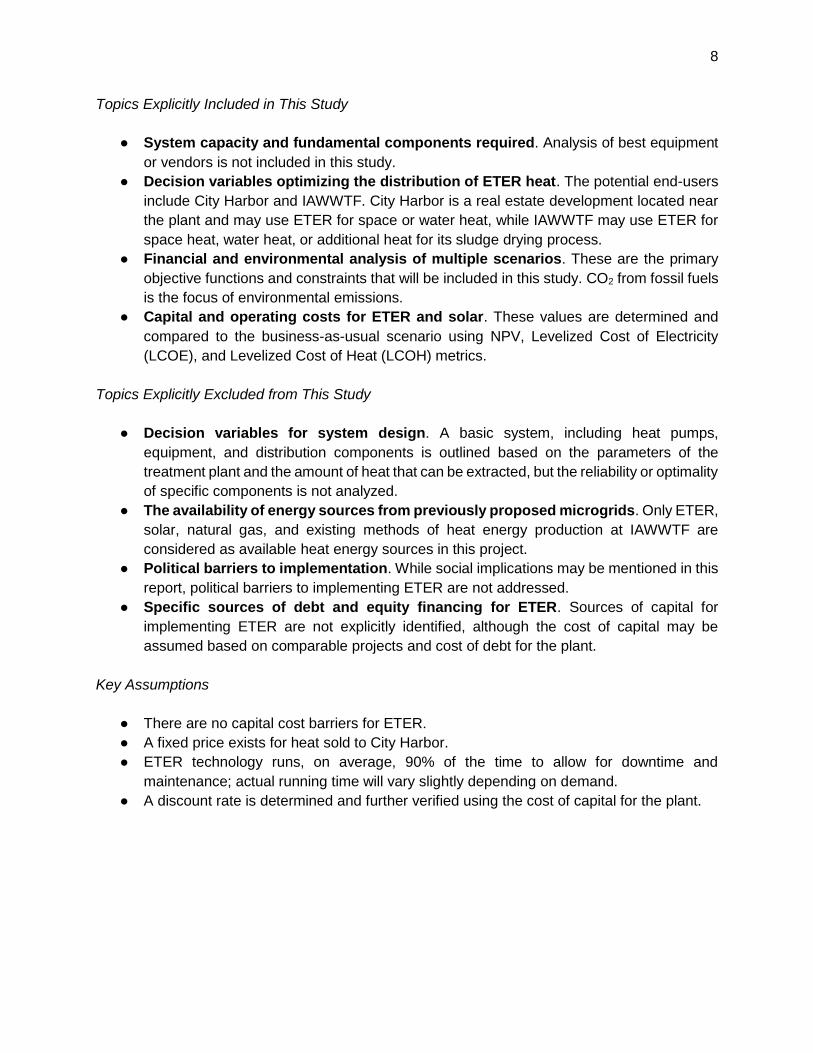
Topics Explicitly Included in This Study
● System capacity and fundamental components required. Analysis of best equipment
or vendors is not included in this study.
● Decision variables optimizing the distribution of ETER heat. The potential end-users
include City Harbor and IAWWTF. City Harbor is a real estate development located near
the plant and may use ETER for space or water heat, while IAWWTF may use ETER for
space heat, water heat, or additional heat for its sludge drying process.
● Financial and environmental analysis of multiple scenarios. These are the primary
objective functions and constraints that will be included in this study. CO2 from fossil fuels
is the focus of environmental emissions.
● Capital and operating costs for ETER and solar. These values are determined and
compared to the business-as-usual scenario using NPV, Levelized Cost of Electricity
(LCOE), and Levelized Cost of Heat (LCOH) metrics.
Topics Explicitly Excluded from This Study
● Decision variables for system design. A basic system, including heat pumps,
equipment, and distribution components is outlined based on the parameters of the
treatment plant and the amount of heat that can be extracted, but the reliability or optimality
of specific components is not analyzed.
● The availability of energy sources from previously proposed microgrids. Only ETER,
solar, natural gas, and existing methods of heat energy production at IAWWTF are
considered as available heat energy sources in this project.
● Political barriers to implementation. While social implications may be mentioned in this
report, political barriers to implementing ETER are not addressed.
● Specific sources of debt and equity financing for ETER. Sources of capital for
implementing ETER are not explicitly identified, although the cost of capital may be
assumed based on comparable projects and cost of debt for the plant.
Key Assumptions
● There are no capital cost barriers for ETER.
● A fixed price exists for heat sold to City Harbor.
● ETER technology runs, on average, 90% of the time to allow for downtime and
maintenance; actual running time will vary slightly depending on demand.
● A discount rate is determined and further verified using the cost of capital for the plant.
9
Market Analysis
Technology and Equipment
Heat Pumps
Heat pumps consist of industrial equipment that can increase the temperature of a waste-heat
source to a level at which the waste heat becomes useful. The waste heat can then replace
purchased energy and lower energy costs. Heat pumps require an external mechanical or thermal
energy source.
All heat pumps perform the same basic function: receive the heat from the waste-heat source,
increase the waste-heat temperature, and deliver the useful heat at the elevated temperature.
The wastewater is delivered to the evaporator to be vaporized. Then, the compressor increases
the pressure of the working fluid, which increases the condensing temperature. Finally, the
working fluid condenses in the condenser to deliver high temperature heat to the heat sink.
The heat pump can reduce energy costs when the cost of energy to operate is less than the value
of the energy saved and the net operating cost savings are sufficient to pay back the capital
investment in an acceptable time. The payback periods for heat pumps are typically 2 to 5 years,
but this can vary with the functions of different heat pumps.
There are many different types of heat pumps: Closed-cycle mechanical heat pumps, open-cycle
mechanical vapor compression heat pumps, open-cycle thermocompression heat pumps, and
closed-cycle adsorption heat pumps. Because of objectives involving process and water heating,
operational space heating, and large-scale space heating, the two types the team focuses on are
the closed-cycle mechanical compression and the closed-cycle adsorption. Closed-cycle
applications have a drying range of about 1 to 20 mmBTU/h of heat output. The vapor
compression evaporation delivers about 20 mmBTU/h to 100 mmBTU/h.
When choosing a heat pump, there are several critical questions: where is heat available from
the process, where is the heat required, what is the value of saved energy, and will the facility
gain non-energy benefits such as environmental improvements? A cost/benefit analysis needs to
be conducted along with a detailed feasibility study to define the benefits and costs, and this is
explored later in this report. There are 3 things that must be considered when choosing a heat
pump: the nature of the heat source, the nature of the heat sink, and the required temperature lift.
In the case of IAWWTF, the nature of the heat source is a liquid (wastewater). The nature of the
heat sink is also a liquid (space heating; air). The required temperature is about 80 to 90°C (176
to 194°F)
GEA provides industrial heat pumps for all types of industries. Their pumps are customizable for
closed cycle and adsorption. Some of the benefits to using these pumps include a reduction in
energy consumption, high supply temperatures in combination with high output, environmental
10
friendliness from the use of natural refrigerants, a 20-year lifecycle, profitable amortization period,
and low overall operation costs. Compression heat pumps from GEA offer condensation
temperatures that are effective not only for operation of the low temperature heating system, but
also for the supply of process heat.
Figure 1. Heat Pump Flow Diagram.
Thermax is also a supplier of heat pumps. The Thermax heat pumps utilize steam, hot water,
exhaust, fuel, geothermal energy or any combination of these sources to pump heat. These are
typically used for district heating applications. These heat pumps can bring hot water up to 90°C
(194°F) and have a COP ranging between 1.65 and 1.75.
It is difficult to obtain a financial estimate or quotes of a specific heat pumps without additional
specifications from IAWWTF. The ranges are too vast to be able to deduce the cost of a specific
heat pump that can handle 75 gal/min and heat water up to 80-90°C (176-194°F). However, the
economic analysis in this report addresses this problem by examining the capacities and costs of
comparable systems.
Expansion Valves
Thermal expansion valves (TEVs) are used in refrigeration and air conditioning systems and
control the amount of working fluid released into the evaporator to keep the heat. TEV is a key
element for heat pumps. It has a sensing bulb that is connected to the line of the piping so that
the temperature of the refrigerant that leaves the evaporator can be sensed. The liquid must take
time inside the evaporator to cool down or heat up. Therefore, the valve lowers the flow to give
the fluid ample time to change its temperature.
The cost of an expansion valve ranges between $50 and $500 depending on the installation, the
type of valve, and the type of system for implementation. There are many suppliers of valves, and
there are also many types of valves. Danfoss and Thermax supply valves, which vary in pricing.
However, more system specifics are required to be able to conclusively agree on the type and
size of valve needed.
11
Heat Exchanger
A heat exchanger is a device that efficiently transfers heat from one source to another. There are
many different types of heat exchangers such as, liquid to air, air to liquid, liquid to liquid, and air
to air. They can be distinguished from the direction of working fluid flow. There is parallel flow,
crossflow, and countercurrent. In parallel flow, both fluids move in the same direction. In cross
flow, the fluids run perpendicular from each other. And in countercurrent flow, the fluids move in
opposite directions from each other.
Figure 2. Concurrent, Parallel (left) and Cross Flow (right).
There are many different types of heat exchangers: shell and tube, plate heat, regenerative heat,
and adiabatic wheel. The shell and tube heat exchanger consists of multiple tubes which the fluid
runs through. The first set of tubes contains the fluid that needs to be heated, while the second
set is responsible for activating the heat exchange and transmitting its own heat to the liquid. The
plate heat exchanger consists of thin plates with a small amount of space between the plates.
The large surface area allows fluid to run in between the plates and ultimately transfer heat. It
also allows the liquid to cool down or heat up more efficiently than it would when using the shell
and tube.
The regenerative heat exchanger can be either a shell and tube or plate heat exchanger, but the
same fluid is passed along both sides of the exchanger. A large amount of energy is saved in this
system because the process is cyclical, and almost all the relative heat is transferred. Only a
small input of energy is needed to raise and lower the overall temperature. Lastly, the adiabatic
wheel heat exchanger consists of an intermediate fluid that is used to store heat. This then
transferred to the other side of the exchanger to heat the other fluid.
There are many suppliers of heat exchangers such as GEA, Thermax, Emerson, and Lytron.
Lytron specializes in thermal solutions and have a wide variety of heat exchangers that can be
utilized in our system. Again, while vendor quotes were not available for this project, an expected
price for the ETER system at IAWWTF is estimated and supplemented by a sensitivity analysis
in the economic section of this report. GEA has a specific product called a Varitube tubular heat
exchanger that is specifically designed for the thermal treatment of low to high viscosity products
that contain particles, pulp, and fibres. This is a shell and tube heat exchanger, which can be
customized to be corrugated, further increasing the thermal efficiency of the heat exchanger.
12
Energy Recovery within Wastewater Treatment Facilities
Chicago, Illinois
Chicago has the world’s largest water treatment plant which treats 1.2 billion gallons per day. It
has implemented a Sewage Heat Recovery process at its Kirie facility, commencing operations
in May of 20121. In the first six months, it halved the plant’s electricity usage. With the system’s
capital cost of $175,000, the plant has estimated a payback period of less than 8 years. The
system is relatively simple; the wastewater that travels to the treatment plant from showers,
dishwashers, toilets and other sources is typically around 60°F. A heat pump is used to transfer
this heat to clean water for the purpose of building heating needs, including showers,
dishwashers, or even radiators. The system is closed loop, so the clean water is never
contaminated by the wastewater. In most facilities, this heat is wasted as it takes much more
energy to heat cold water than water that is already at 60°F. Additionally, the heat pumps can be
reversed in the summer, which heats the wastewater to reduce a building’s cooling costs.
Chicago’s Metropolitan Water Reclamation District is aiming to reduce energy costs through
anaerobic digestion, which harvests gas produced by bacteria and helps break down components
of wastewater. The district already gets nearly a third of its energy from this process, it is aiming
to invest $10 million to expand efforts at the Calumet plant in Chicago’s South Side. Local
businesses, such as breweries, will pay the plant to take their waste for anaerobic digestion. This
will produce methane which can then be sold back to the grid. If the process is successful at this
plant, it will be incorporated at Stickney, which could produce enough energy to offset 75% of its
total energy use.
Gresham, Oregon
In April of 2015, Gresham, Oregon’s wastewater treatment facility achieved Net Zero Energy
status. 92% of its energy consumption is produced from converting organic matter sludge into
biogas. Most of this organic matter comes from wastewater filled with fats, oils, and grease that
is trucked in from Portland-area restaurants. The biogas is fed into two powerful engines that
convert it into heat and electricity that can be used at the plant; any excess electricity is returned
to the grid. The remaining 8% of its energy needs come from a ground mounted solar array. It is
estimated that these technologies save an average of $500,000 per year and generate an annual
revenue of about $250,000 from the waste accepted from local food establishments.
This plant receives approximately 13 million gallons of wastewater per day, which is about twice
the input of the IAWWTF but a more realistic comparison than the system in Chicago. The plant’s
operations are similar to operations at the IAWWTF and begin with Primary Treatment, where the
sludge is removed for the purposes of conversion to biogas. Next, Aeration helps the bacteria
break down organic matter and remove contaminants. Then, Secondary Clarification removes
1 Metropolitan Water Reclamation District of Greater Chicago (2019).
13
any remaining sludge. Next, Disinfection ensures that the water leaving the plant meets EPA
regulations. Finally, the Plant Effluent Phase discharges water into the Columbia River.
External District Energy Applications and Economics
ETER technology is also currently used to power portions of energy districts. The energy
produced using ETER is used for space heat and hot water for buildings. Often, these energy
districts do not derive the entirety of their capacity from ETER, and traditional natural gas systems
are a common alternative and backup that fills the balance of the energy needs. Canada is an
early adopter of this technology, and it has implemented ETER as a core component of the
Southeast False Creek Neighborhood and Whistler District Energy System.
Process for Thermal Heat Production in Buildings
Common methods for heating buildings include furnaces and boilers.2 Furnaces use electricity,
natural gas, or oil to produce heat that is subsequently distributed via fans and air ducts, and
these systems are installed in individual homes. Boilers are also installed in each home and
typically use oil or natural gas to heat water. The water is then pumped into pipes which circulate
throughout the house to provide heat.
District energy consolidates local thermal heating and cooling systems into a centralized location.
Although the concept dates back thousands of years to ancient Rome, widespread
implementation is limited in the U.S.3 An Energy Information Administration (EIA) report in 2018
documented 660 systems in the U.S. in 2012 that served 5.5 billion square feet with heating
capacity. District heating and cooling systems allow for the utilization of alternative fuel sources
in energy production - sources that would otherwise be impractical for use in individual properties.
This diverse array of fuels available, including renewables and clean technology, increases
reliability, decreases emissions, and lowers capital and operating costs for buildings.4
As illustrated in Figure 3, district energy systems send heat from a centralized utility to a building.
Each building must install an energy transfer station, which can use the supplied thermal energy
for hot water or space heat. ETER is one of the renewable energy sources that can contribute to
the production of the centralized thermal energy, although natural gas is the dominating source
in these systems. According to Table 1, natural gas comprises 80.5% of all fuel sources for U.S.
district energy plants that produce Non-CHP Heating.
2 Smarter House (2015). 3 Tredinnick (2013). 4 EIA (2018).
14
Figure 3. District Energy Layout with a Transfer Station for Heating.5
District energy can struggle to remain competitive with traditional furnace and boiler alternatives
that use low-cost natural gas. District energy is more competitive in scalability, leading to
increased usage in high-density, urban, and compact areas. Within the context of IAWWTF, the
feasibility of generating economically sensible, low-carbon heat energy using ETER is studied.
Outside of usage for plant operations, which is studied, this thermal energy could be used for
heating in a district energy setup for the nearby City Harbor Development.
Table 1. Sources Used in U.S. District Energy Systems: Non-CHP Heating Plants6
Fuel Source Energy Usage (MMBtu) Percentage of Total
Coal 58,998,023 12.8%
Electricity 0 0%
Natural Gas 372,251,735 80.5%
Oil 11,160,227 2.4%
Other (Biomass) 19,729,303 4.3%
Total 462,139,288 100.0%
Comparable District Systems in Canada
Canada has been a leading adopter of ETER in its energy districts, using this technology as the
main provider of space heat and hot water for compact areas of development. Two developments
that are explored in this report are the Southeast False Creek Energy District in Vancouver and
the nearby Whistler Energy District. While slightly larger than the proposed City Harbor
development in Ithaca, these projects provide insight into ETER implementation in contexts
5 City of Vancouver (2019). 6 EIA (2018).
15
outside of a water treatment plant. For the purposes of the market analysis, the focus is on the
total energy produced, amount of CO2 reduced, the percentage of energy derived from
wastewater heat recovery, the customers served, and the resulting electricity rates for consumers.
The Southeast False Creek (SEFC) district was most recently redeveloped for the 2010 Winter
Olympics hosted in Vancouver. The site was repurposed from an industrial to residential use for
the purpose of hosting athletes in the Olympic Village. Originally completed in 2010, the existing
plant capacity is 27 MW, which produces 46,000 MWh of energy for 5.2 million square feet spread
across 32 buildings7. When the expansion of the system is complete, it will serve 6.0 million
square feet of residential and mixed-use property and provide 63,000 MWh of energy per year at
a total capital cost of $40.3 million ($2010 USD)8.
Approximately 70% of the annual energy needs in SEFC are met using ETER, reducing building
heating pollution by 60%. Natural gas fills the balance of the demand at peak loads, and the
combination of the sources saved 3,500 tons of CO2 in 2017.9 The Vancouver City Council sets
rates for the SEFC district, imposing fixed and variable charges in an attempt to encourage
conversation in energy use. This information is summarized with the Whistler Energy District in
Table 2.
The Whistler District Energy System handles energy needs for the Cheakamus Crossing
Neighborhood. This system was also constructed in 2010 for an Athlete’s Village as part of the
Vancouver Winter Olympics. After the Olympics, the development transitioned to a mixture of
affordable and market-priced housing. The total capital cost was $3.9 million ($2010 USD), and
the system currently serves more than 500 residential units.10
The system was originally designed to serve up to 2,200 residents over 600 buildings consisting
of a total of 910,000 square feet. In their calculations, the Whistler Energy Study Program uses
26,500 kWh of energy consumption per year for the average house, implying a current capacity
of 13,250 MWh and potential capacity of 15,900 MWh. The District Energy System currently
reduces CO2 output by 1,320 tons relative to the all-natural gas alternative. Cheakamus Crossing
sets fixed rates per square footage of floor area to recover operating costs and replacement
reserves.
In a 2017 internal study of the system, the report estimated an average thermal energy cost of
$0.063/kWh USD relative to $0.09/kWh USD for typical alternatives. This corresponds to a 2018
cost of thermal energy equal to $0.064/kWh for the system, assuming a 1.87% inflation rate in
Canada in 2017.11
7 International District Energy Association (2018). 8 Conversion uses the average spot exchange rate in January 2010. 9 City of Vancouver (2019). 10 Whistler Infrastructure Services (2017). 11 Triami Media BV (2019).
16
Table 2. Comparable District Energy Applications Using ETER
Southeast False Creek
Location: Vancouver, Canada Constructed: 2010 Total Capital Cost: $40.3 million USD ($2010) 2017 Capacity: 46,000 MWh 2017 CO2 Reduced: 3,500 tons ETER Usage: 70% Net Effective Rate (2018): $83.4/MWh USD12
Whistler Energy District
Location: Vancouver, Canada Constructed: 2010 Total Capital Cost: $3.9 million USD ($2010) 2017 Capacity: 13,250 MWh 2017 CO2 Reduced: 1,320 tons ETER Usage: 50-90% Net Effective Rate (2018): $64.2/MWh USD
Single Building Application: Kiheung Respia WWTP, Korea
There are other international cases of ETER in use that document its environmental impact and
heating or cooling demand in districts, which are useful for analyzing IAWWTF’s situation.
The design capacity of the Kiheung Respia WWTP in Korea is 7.93 million gallons per day (MGD).
Among the three green energy resources considered in this study, two involve electrical energy
production (solar PVs and a small hydropower system), and one, the effluent heat, involves
thermal energy production using a heat pump. The thermal energy production is calculated
manually according to site-specific conditions and heat pump specifications. The green energy
production, potential reduction in GHG emissions, and economic viability of the proposed
technologies are also estimated.
To extract and transport the heat from the heat source to the heat sink, the heat pump uses some
amount of external energy (typically electricity) to accomplish the desired transfer, and the power
source is primarily used to drive the vapor compression cycle for heating or cooling purposes. For
each kW of electricity used in the heat pump, approximately 4 kW of heat are transferred to the
heat recovery system.
An existing nearby three-story administration building, the target building for the heat pump
application, was previously equipped with a cooling system running at 65.5 kW and a heating
system running at 74.6 kW. An 87.9 kW heat pump with a 25-kW compressor was implemented
12 City of Vancouver assumes a typical building profile using 10.1 kWh per square foot.
17
to match the system’s capacity. The net energy production of the heat recovery system is
calculated by subtracting the input energy from the produced thermal energy. In addition, the
produced thermal energy is converted to an electrical energy unit (MWh) to estimate the energy
independence of the WWTP.
Table 3. Kiheung Respia WWTP Statistics, Korea
Environmental Analysis
Green Energy Production and Savings (MWh/yr)
276
Energy Independence 3.65%
CO2 Emission Reduction per Year (Tons) 130
Economic Analysis and Savings
Capacity (kW) 87.9
Installation Cost ($USD/kW) 1,978
Capital Cost ($USD) 173,913
Operating Cost ($USD/yr) 870
Net Effective Rate ($USD/MWh) 100
Annual Electricity Sold ($USD/yr) 26,496
Payback Period (years) 6.8
As a single energy source, the ETER appears to be the most influential factor affecting overall
energy independence, which varies according to the number of operational hours of the heating
and cooling system.
Municipal wastewater demonstrates substantial thermal energy potential with this project.
However, insufficient demand for the recovered heat from the WWTPs in the spring and fall
seasons places a constraint on the installation of recovery systems for these thermal reserves. In
this case, the recovered surplus heat could be fed into aerobic digesters, which require a constant
temperature throughout the year, or supplied to local communities.
18
An Example of Competitive Alternatives: Freistadt WWTP, Austria
The Freistadt WWTP can be considered as a facility within settlement areas. Current land use in
the vicinity of the plant primarily encompasses commercial areas. In addition, a regional hospital
is located in the surroundings of the site, and additional commercial areas are being developed
at a distance of about 1.5 km from the site as part of a new expressway. Therefore, based on the
spatial context, Freistadt shows high potential for thermal surplus energy utilization from the
wastewater of existing and future energy consumers.
Based on sector-specific energy indices derived from energy analyses and census data on local
units of employment, the heating demand for the regarded business locations can be estimated,
amounting to 4,300 MWhth/a for space heating and 4,757 MWhth/a for process energy including
drying, process water, and heat up to a temperature level of 100°C (212°F).
The minimum heat price to supply external consumers with heating energy depends on the
demand level. The minimum price for supplying heat is, however, 5% lower than the current
district heating price in the area of about $64.8/MWh (USD). This heat price of $61.4/MWh (USD)
results from the investment and operating cost of a new installed Combined Heat and Power
(CHP) plant as well as several new heat pumps and required heat grid. Additionally, around 80%
of the used electricity has to be imported, resulting in an overall cost of approximately $261,000/yr.
These costs are facing a nearly equivalent annual revenue due to the fact that at $61.4/MWh
(USD), the Process Network Synthesis (PNS) calculations, which are used to optimize material
and energy flow systems, generate minimal economic benefit.
If process heat is considered, the demand doubles. The increased and more consistent demand
over the course of a year decreases the unit costs of production, and a resulting price 21% lower
than the prevailing heating cost in the region allows for a sufficient supply of external consumers.
At this price, however, only 89% of the 9,057 MWhth/a can be covered with the applied heating
technologies as the demand is highest in winter and cannot be met completely. To meet all
demand year-round, larger facilities are necessary, resulting in higher prices for consumers due
to increased investment requirements and electricity imports.
Figure 4. External Heat and Supply from the Case Study of the Freistadt WWTP.13
Next, the carbon footprint of the electricity required to run the heat pump is compared to solar and
natural gas scenarios. The heat pump driven by the EU mix generates roughly the same
ecological footprint as thermal heat produced using natural gas. An ecologically friendlier option
is to use heat pumps with an average Austrian electricity mix, resulting in a 52% carbon footprint
13 Kollmann et. al. (2016).
19
reduction compared to natural gas, or better yet, heat generated from solar heat collectors, which
results in a 66.8% reduction.
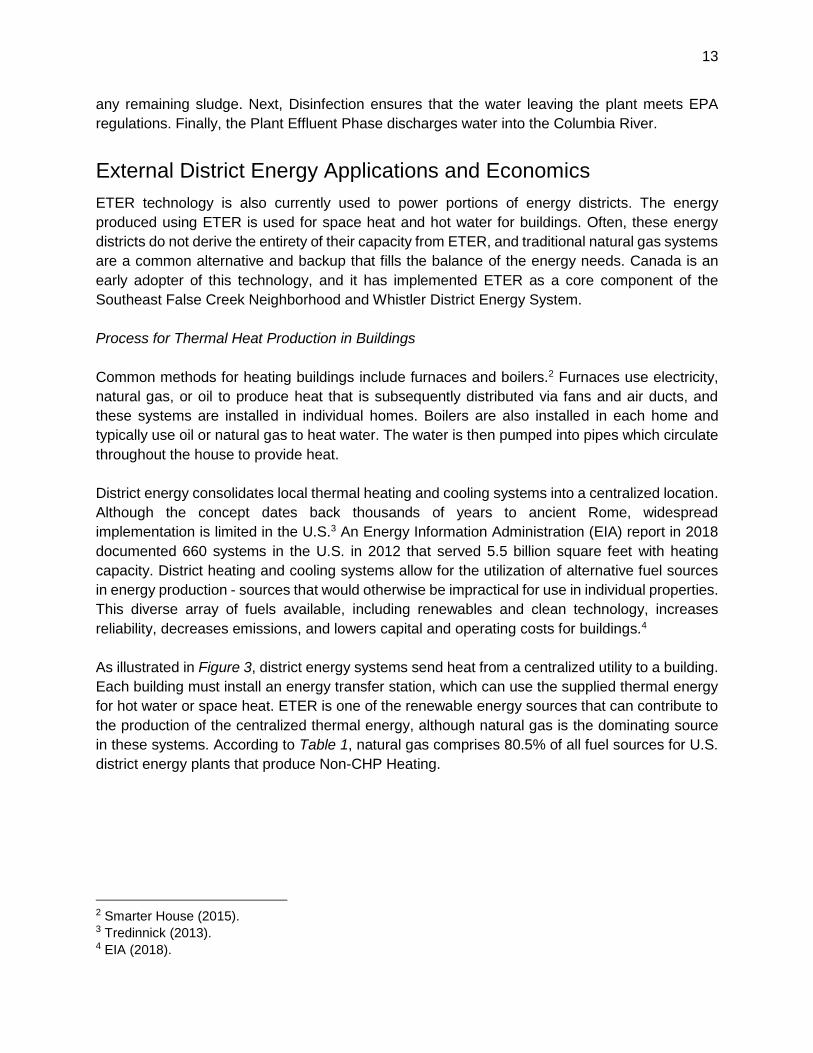
By far, the most sustainable option for producing the heat demand of 9,057 MWhth/a in the case
study is the scenario involving a wastewater heat pump that derives electricity exclusively from
renewable resources. This results in an ecological footprint reduction of almost 99% compared to
the business-as-usual scenario run by natural gas.
Figure 5. Ecological Evaluation of the Heat Production System in Freistadt WWTP.14
Building Demand: Xi’an Urban Wastewater Source Heat Pump (WWSHP) System
Xi’an No. 4 Wastewater Treatment Plant in China was adopted as a pilot project. As part of the
project, surrounding buildings were simulated and calculated. Using the operating data including
the effluent temperature, flow rate, and water quality as shown in Figure 6, the type of WWSHP
unit can be designed.
Since the maximum water treatment capacity of this plant is 2×10⁵–4×10⁵ m3/d (7.1-14.1 million
ft3/d), the minimum quantity of wastewater used for this WWSHP system can reach 7,500 m3/h
(264,900 ft3/h), which is calculated by adopting the seasonal adjustment coefficient as 0.9.
In this study, buildings named “X” use the treated wastewater effluent from No. 4 plant as a heat
source. “X” buildings are located about 2.5 km (1.55 mi) southeast of No. 4 plant. The building
types are residential and commercial. As shown in Figure 6, the total area is 530,000 m² (18.7
14 Kollmann et. al. (2016).
20
million ft3), with 444,000 m² (4.8 million ft3) for residential heating and 86,000 m² (926,000 ft3) for
commercial air-conditioning. A central air conditioning system, which adopts the WWSHP unit as
a heating and cooling source, is used for cooling and heating in commercial zones.
Figure 6. General Calculation of Cooling and Heating Load of “X” Buildings in Xi’an WWSHP.15
Local Application: ETER Prospect at City Harbor
The Ithaca City Harbor development, scheduled for construction in 2019, will be Ithaca’s only
waterfront neighborhood. The development includes upscale apartments, restaurant space, the
Guthrie Clinic, and possibly more mixed-use areas. City Harbor will house three waterfront
structures consisting of of 80 units16. There will be parking on the ground level and four floors of
apartments. In addition, a building facing the Cascadilla Creek called “The Point” will have
hospitality and residential uses including a waterfront restaurant. The Guthrie Clinic will be located
away from the shoreline in a three story, 60,000 square-foot building. 17
Figure 7. Revised Sketch Plan of Ithaca City Harbor.
There appears to be tremendous potential for supplying heat for City Harbor using an ETER
system at IAWWTF. With numerous residential spaces, recreational spaces, and medical spaces,
ETER would be an excellent addition to City Harbor’s vision of a “better way forward”. The system
15 Yaxiu, Huqiu, Yu, and Huanjuan (2011). 16 City Harbor (2019). 17 O’Connor and Crandall (2018).
21
could also assist with cooling during summers. This initiative would be a one-of-a-kind, a modern
residential space promoting renewable energy and significantly reducing the emission of
greenhouse gases through traditional sources of heating. Furthermore, City Harbor is located very
close to the IAWWTF, which would simplify energy transport and reduce losses.
City Harbor is currently designed for a mixture of upscale and affordable housing, and a feasibility
study of adjustments in utility and heating costs is recommended in order to obtain an accurate
estimate of the added costs or benefits for the residents if ETER is utilized.
Environmental Scope of ETER and Alternative Uses
A major benefit of recycling energy from IAWWTF using ETER is the corresponding reduction in
greenhouse gas (GHG) emissions. Although GHG itself is not harmful to the environment, the
large amount of anthropogenic GHG emissions today is the primary cause of global warming.
Hence, the question “How much CO2 can plants offset?” needs to be addressed.
Since minimal data is available with regards to the amount of GHG emissions IAWWTF can
reduce, other plants that are similar to Ithaca’s are examined. Several examples that meet this
criterion include the Green Bay, Wisconsin Metropolitan Sewerage District, the old-age home in
Hofmatt, Switzerland, and the University of Burgundy in France.
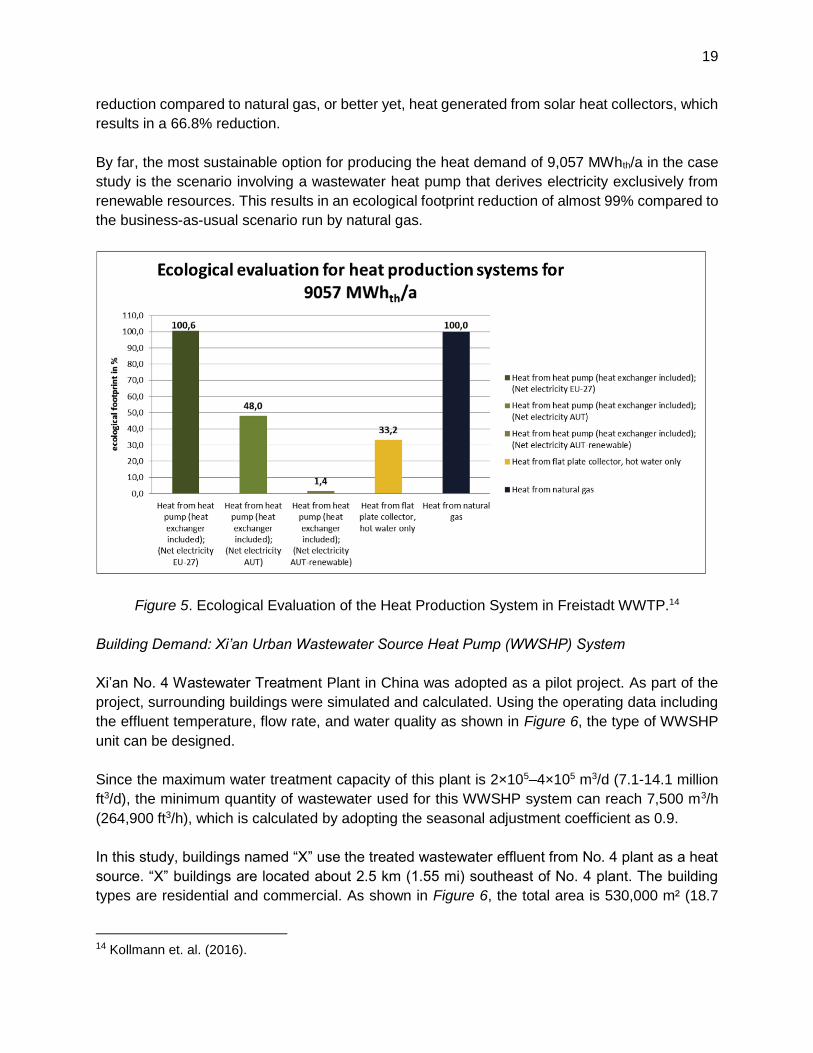
Green Bay, Wisconsin
The Green Bay, Wisconsin Metropolitan Sewerage District has two treatment plants that together
serve more than 217,000 residents. One of the treatment plants has installed new energy-efficient
blowers in its first-stage aeration system, reducing electricity consumption by 50 percent and
saving 2,144,000 kWh/year - enough energy to power 126 homes - and avoiding nearly 1,480
metric tons of CO2 emissions.
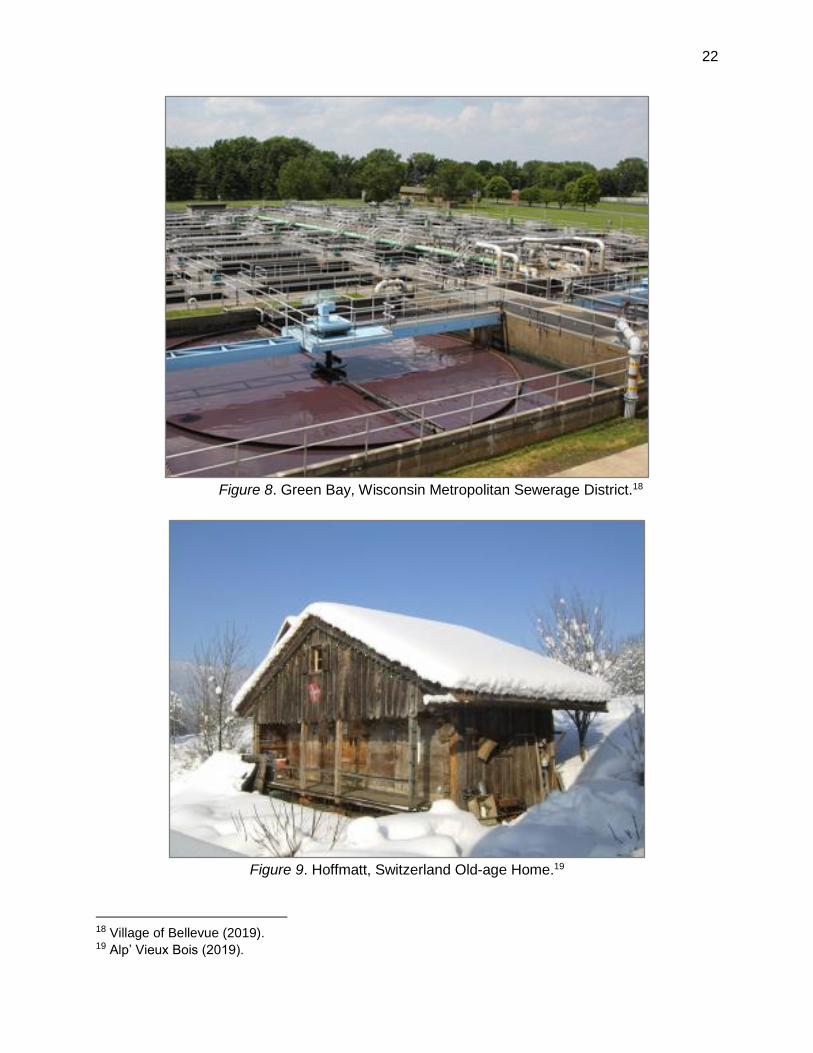
Hofmatt, Switzerland
In the old-age home Hofmatt in Switzerland, residents have decided to use the in-house
wastewater flow to recover energy for heating purposes and service water. The use of wastewater
at the source offers potential for greater efficiencies. The daily per capita production of wastewater
is 130 L (34.3 gallons) on average, and the water has a temperature of 23-25°C. When cooled by
15°C, approximately 2.26 kWh energy can be recovered per day and per capita. With a
permissible annual energy demand of 5.1 kWh/ft² according to KfW85 and an assumption of 170
heating days, this amount of energy is sufficient to heat approximately 75.3 ft² of living space at
100 percent duty.
22
Figure 8. Green Bay, Wisconsin Metropolitan Sewerage District.18
Figure 9. Hoffmatt, Switzerland Old-age Home.19
18 Village of Bellevue (2019). 19 Alp’ Vieux Bois (2019).
23
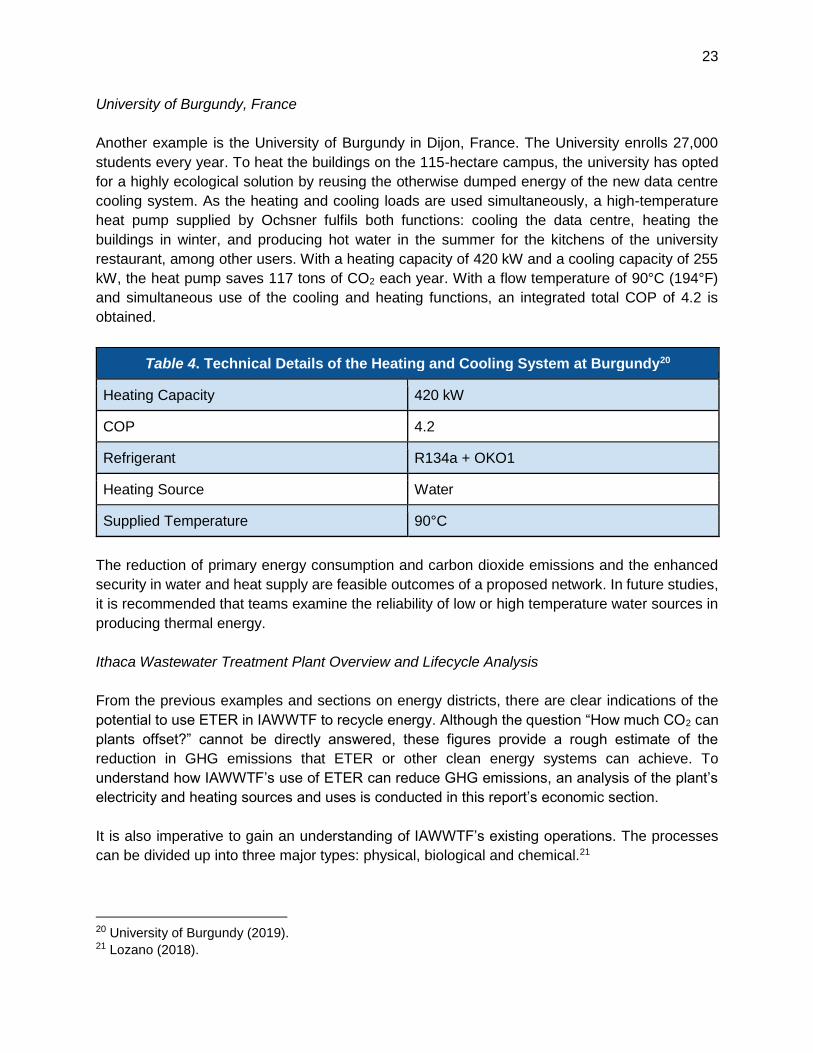
University of Burgundy, France
Another example is the University of Burgundy in Dijon, France. The University enrolls 27,000
students every year. To heat the buildings on the 115-hectare campus, the university has opted
for a highly ecological solution by reusing the otherwise dumped energy of the new data centre
cooling system. As the heating and cooling loads are used simultaneously, a high-temperature
heat pump supplied by Ochsner fulfils both functions: cooling the data centre, heating the
buildings in winter, and producing hot water in the summer for the kitchens of the university
restaurant, among other users. With a heating capacity of 420 kW and a cooling capacity of 255
kW, the heat pump saves 117 tons of CO2 each year. With a flow temperature of 90°C (194°F)
and simultaneous use of the cooling and heating functions, an integrated total COP of 4.2 is
obtained.
Table 4. Technical Details of the Heating and Cooling System at Burgundy20
Heating Capacity 420 kW
COP 4.2
Refrigerant R134a + OKO1
Heating Source Water
Supplied Temperature 90°C
The reduction of primary energy consumption and carbon dioxide emissions and the enhanced
security in water and heat supply are feasible outcomes of a proposed network. In future studies,
it is recommended that teams examine the reliability of low or high temperature water sources in
producing thermal energy.
Ithaca Wastewater Treatment Plant Overview and Lifecycle Analysis
From the previous examples and sections on energy districts, there are clear indications of the
potential to use ETER in IAWWTF to recycle energy. Although the question “How much CO2 can
plants offset?” cannot be directly answered, these figures provide a rough estimate of the
reduction in GHG emissions that ETER or other clean energy systems can achieve. To
understand how IAWWTF’s use of ETER can reduce GHG emissions, an analysis of the plant’s
electricity and heating sources and uses is conducted in this report’s economic section.
It is also imperative to gain an understanding of IAWWTF’s existing operations. The processes
can be divided up into three major types: physical, biological and chemical.21
20 University of Burgundy (2019). 21 Lozano (2018).
24
IAWWTF begins with physical processes to remove solids in the wastewater. First, large solids
are removed by bar screens. The removed solids are landfilled. Next, the treated water is sent to
primary settling tanks to remove more solids. Heavy solids settle while lighter ones float, removing
approximately 30% of the incoming organic load. The settled solids are de-gritted and dewatered
before going to the digester.
However, the physical processes are unable to treat the water and remove harmful
microorganisms and microscopic particles in the water. This requires the use of an activated
sludge process in which the clarified primary wastewater is fed to aerobic microorganisms under
constant aeration. The microorganisms in the aeration tanks agglomerate and assimilate the
organics in the wastewater. The formed “floc” particles are clumps of microbes and food. Then,
the secondary clarifiers remove the floc by gravity settling. To keep a constant ratio between the
amount of biomass (organisms) in the aeration tanks and the amount of incoming organic loading
(food), much of the activated sludge that settles in the secondary clarifiers is returned to the
aeration tanks. The excess activated sludge is removed to the thickeners for further treatment.
Finally, the wastewater is sent through tertiary treatment. The tertiary treatment primarily utilizes
chemical processes to remove the excess microorganisms and micro-particles. Using 3 additives,
including polymer, ferric chloride and engineered sand, additional suspended solids are clumped
together in larger particles that are heavy enough to settle and be removed. This system is
optimized for phosphorus removal, removing roughly 80% of the remaining dissolved phosphorus.
Half of the other remaining conventional pollutants are also removed. Waste sludge from this
system goes to the thickeners.
Excess water is removed from all the waste sludges in the thickeners and sludges from the
previously described processes. The thickened sludge is pumped to the primary digester for
anaerobic digestion to reduce the biomass. The biomass is digested for 28 days at 98°F, and a
secondary digester is used for overflow. The digesters stabilize the sludge, after which it is
dewatered with chemical polymer and belt press. 6,000-12,000 lbs/day of semi-dried cake is
created and subsequently removed to a landfill.
Pathogen disinfection using chlorine bleach (sodium hypochlorite) occurs after tertiary treatment.
After thorough mixing, sulfur dioxide removes remaining chlorine. Finally, the clean effluent can
be discharged to Cayuga Lake.
Additionally, anaerobic digestion biogas generates methane. Although an energy upgrade is
planned, this biogas currently generates 25-30% of the total energy (heat and electricity
combined) requirements of the IAWWTF. As the energy performance upgrades are completed,
the total external energy requirements of the plant will decrease while the amount of energy
produced from biogas will increase. These improvements will result in 60% of IAWWTF’s energy
requirements met through the use of biogas.
25
Given these circumstances, IAWWTF can help transform Tompkins County into a place where
the community’s energy needs are met without production of GHG from fossil fuels. This is a
particularly opportune moment since Tompkins County is dedicated to reducing GHG emissions
by a minimum of 80% of 2008 levels by 2050 and decreasing its reliance on various sectors of
fossil fuels for energy production. Moreover, the government hopes that the energy efficiency of
all components of the community will improve and that the use of local and regional renewable
energy sources and technologies will increase. Hence, IAWWTF could be a key renewable energy
instigator by implementing ETER.
26
Analysis of ETER Applications to IAWWTF
Research into existing uses of ETER at water treatment facilities worldwide has provided insight
into options for applying that technology locally at IAWWTF. The technical analysis of this report
demonstrates the feasibility of an ETER project at IAWWTF, estimates the size of the system,
and provides the resulting energy output. The economic analysis examines capital and operating
costs for ETER, and it describes a model developed for this report that assesses how ETER would
be integrated into the plant’s energy mix and new sludge drying system. Finally, the environmental
analysis tracks the emissions of various energy mix scenarios at IAWWTF and quantifies the
reduction in CO2 resulting from burning fossil fuels. These results are synthesized to provide
recommendations and conclusions for IAWWTF’s energy plans.
Technical Dimension and System Overview
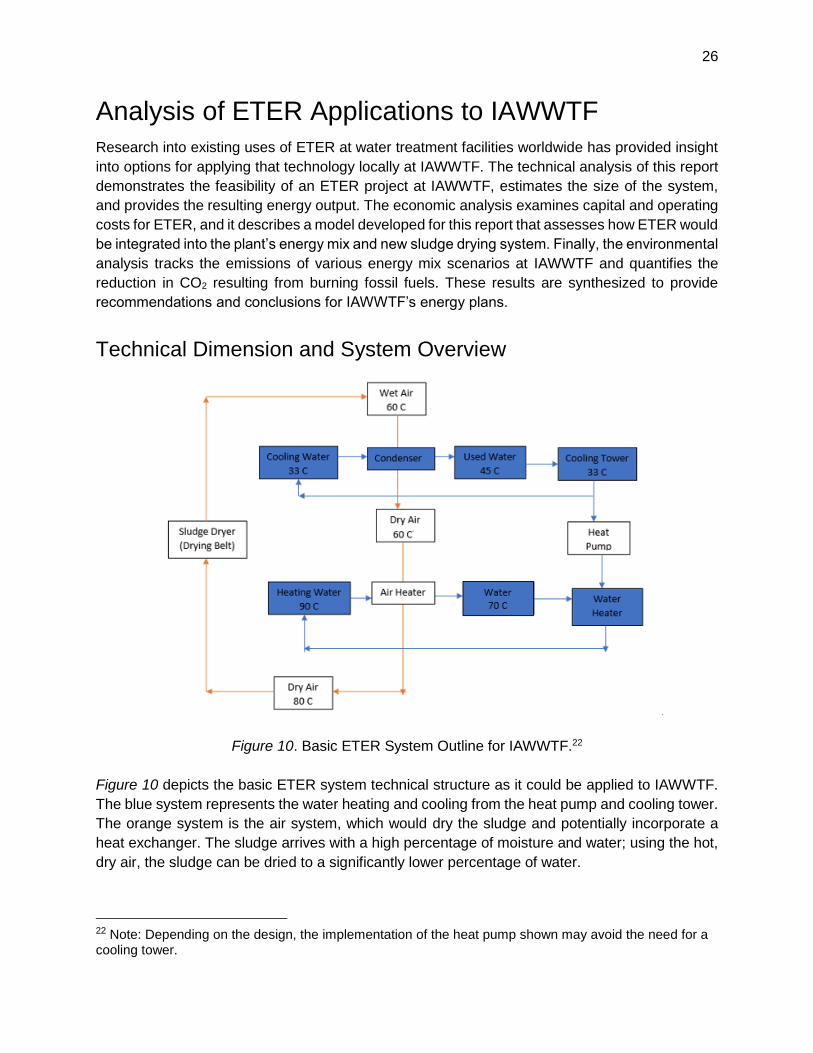
Figure 10. Basic ETER System Outline for IAWWTF.22
Figure 10 depicts the basic ETER system technical structure as it could be applied to IAWWTF.
The blue system represents the water heating and cooling from the heat pump and cooling tower.
The orange system is the air system, which would dry the sludge and potentially incorporate a
heat exchanger. The sludge arrives with a high percentage of moisture and water; using the hot,
dry air, the sludge can be dried to a significantly lower percentage of water.
22 Note: Depending on the design, the implementation of the heat pump shown may avoid the need for a cooling tower.
27
The water is recycled to absorb the moisture that the air has received from drying the sludge.
Next, the water moves into the heat pump where it is heated. Finally, using a heat exchanger, the
water transfers heat to the air to raise its temperature for drying the sludge.
The efficiency of the heat pump and heat exchanger must be considered to ensure that the
temperature lift is attainable. The following section outlines the assumptions of the ETER system
at IAWWTF using a Coefficient of Performance (COP) of 4, a temperature lift of 5 °F, and a
percent of sewage extracted of 15%. The minimum amount of water needed is calculated, but
there will be additional head and heat losses that need to be considered.
Sludge Drying System Calculations and Potential Savings
IAWWTF receives anywhere from 10 to 14 tons of liquid sewage and trucked waste for use in the
plant’s biodigester system23. When biogas is released in the system, sludge emerges as a
byproduct with a water content of 75%. While IAWWTF currently has a drying system to reduce
the total weight of sludge, the plant still pays approximately $250,000 per year to transport the
output to a landfill. If IAWWTF could use more heat in its drying system to reduce the sludge water
content to 10%, the leftover dried product could be used as fertilizer. With an upgraded sludge
drying system, IAWWTF could avoid the landfill fee and explore options to sell or donate the dried
sludge to local businesses.
Table 5. Sludge Drying Technical Analysis
Amount of Sludge the Plant Receives 14 tons per day
Amount of Heat Needed to Dry the Sludge 54.32 mmBTU/day
Wastewater Needed to Dry the Sludge using ETER 975,000 gallons per day
Clean Water Needed to Circulate in ETER System 181,000 gallons per day
Only 15% of the heat available from the wastewater is needed to properly dry the sludge. It is
likely that more heat could be extracted if desired, and this could be used for the plant’s
operational heating needs or sold to City Harbor.
In order to calculate the amount of wastewater heat required and the amount of clean water
needed in circulation, several assumptions have been developed as outlined in Table 5, Table 6
and Table 7.
23 Lozano (2018).
28
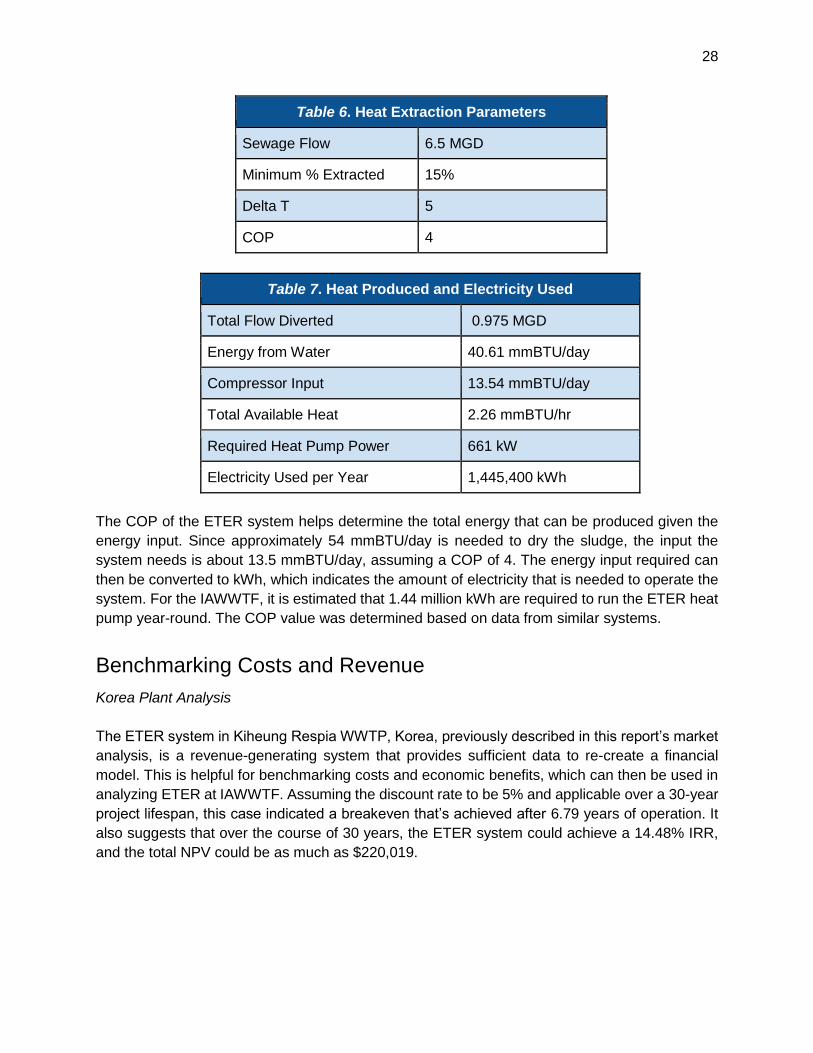
Table 6. Heat Extraction Parameters
Sewage Flow 6.5 MGD
Minimum % Extracted 15%
Delta T 5
COP 4
Table 7. Heat Produced and Electricity Used
Total Flow Diverted 0.975 MGD
Energy from Water 40.61 mmBTU/day
Compressor Input 13.54 mmBTU/day
Total Available Heat 2.26 mmBTU/hr
Required Heat Pump Power 661 kW
Electricity Used per Year 1,445,400 kWh
The COP of the ETER system helps determine the total energy that can be produced given the
energy input. Since approximately 54 mmBTU/day is needed to dry the sludge, the input the
system needs is about 13.5 mmBTU/day, assuming a COP of 4. The energy input required can
then be converted to kWh, which indicates the amount of electricity that is needed to operate the
system. For the IAWWTF, it is estimated that 1.44 million kWh are required to run the ETER heat
pump year-round. The COP value was determined based on data from similar systems.
Benchmarking Costs and Revenue
Korea Plant Analysis
The ETER system in Kiheung Respia WWTP, Korea, previously described in this report’s market
analysis, is a revenue-generating system that provides sufficient data to re-create a financial
model. This is helpful for benchmarking costs and economic benefits, which can then be used in
analyzing ETER at IAWWTF. Assuming the discount rate to be 5% and applicable over a 30-year
project lifespan, this case indicated a breakeven that’s achieved after 6.79 years of operation. It
also suggests that over the course of 30 years, the ETER system could achieve a 14.48% IRR,
and the total NPV could be as much as $220,019.
29
Table 8. Key Statistics for Kiheung Respia Financial Analysis
Energy Production (MWh/yr) 276
Heat Pump Capacity (kW) 87.925
Installation Cost Per kW (US$/kW) $1,978
Annual Operating Cost (US$/yr) $870
System Marginal Price (US$/kWh) $0.10
Revenue, Year 1 (US$/yr) $26,496
Financial Assumptions
Discount Rate 5%
Project Lifetime (yr) 30
Annual Revenue Escalations 0%
Financial Outputs
Initial Investment Cost (US$) $173,916
Payback Year (5% Discount Rate) 6.79
IRR (30-year-project) 14.48%
NPV Operating Cash Flows $393,934
Total NPV $220,019
The results of this analysis are documented in Table 8. In addition, a chart of the cumulative cash
flows for the project is shown in Figure 11 to illustrate the determination of breakeven in between
Year 6 and Year 7. Notably, although operating costs are provided for this project, they seem
representative of maintenance costs and do not appear to include the cost of electricity for
operating the heat pump. The cost of electricity might not be incorporated into the plant’s operation
cost data because of existing and sufficient on-site electrical energy resources to power the heat
pump, thereby eliminating the need for electricity purchases from the grid.
If Kiheung Respia incorporated the cost of electricity in the model and assumed a COP of 4, the
demand from the heat pump would be approximately 69 MWh/yr. At a cost of electricity of
$0.10/kWh, the additional annual cost would be $6,900. The resulting IRR would decrease to
10.2%, and the payback period would fall between 9 and 10 years. Incorporating electricity costs
in the financial analysis of Kiheung Respia appears to maintain the economic feasibility of the
plant’s ETER project.
30
Figure 11. Break Even Analysis for Kiheung Respia.
The Kiheung Respia plant is used to calculate a realistic annual maintenance cost of
$0.0032/kWh, which is the plant-provided Annual Operating Cost number divided by Energy
Electricity Used per Year (90% Utilization)35 1,300,860
Heat Output per Year (90% Utilization) 17,787 mmBTU
Additional Revenue and Savings
Heat Sales to City Harbor $6.63/mmBTU
Sludge Drying Savings per Year $250,000
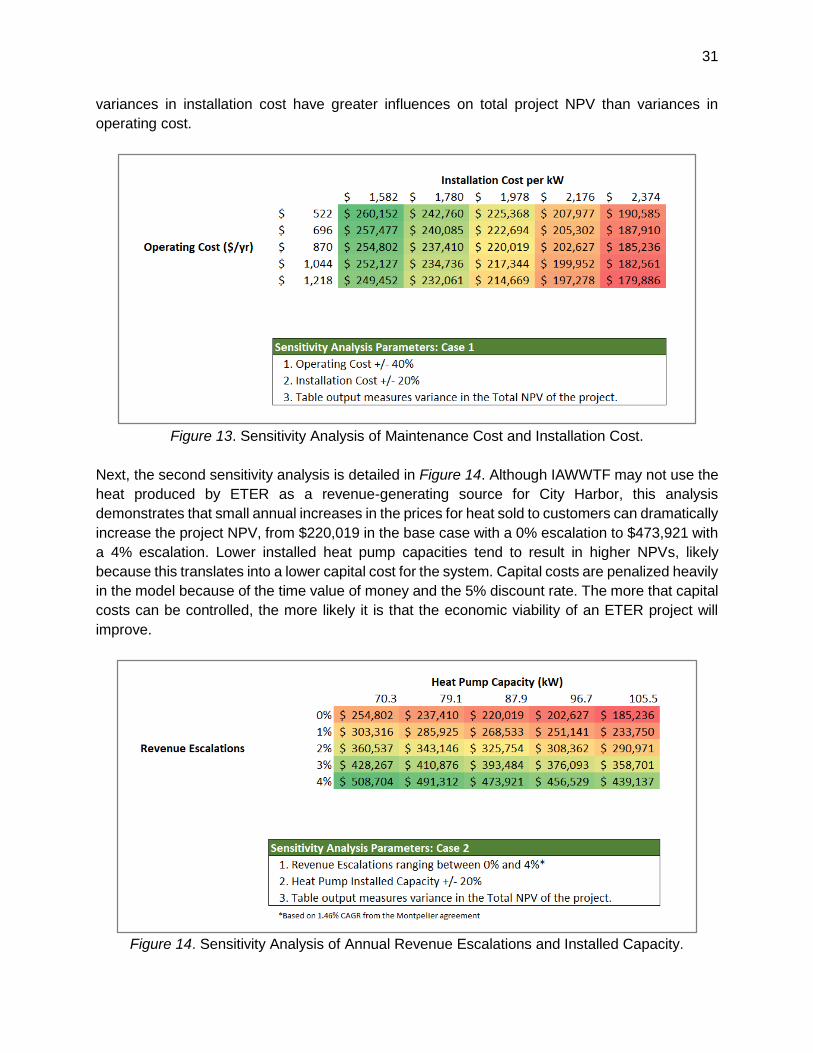
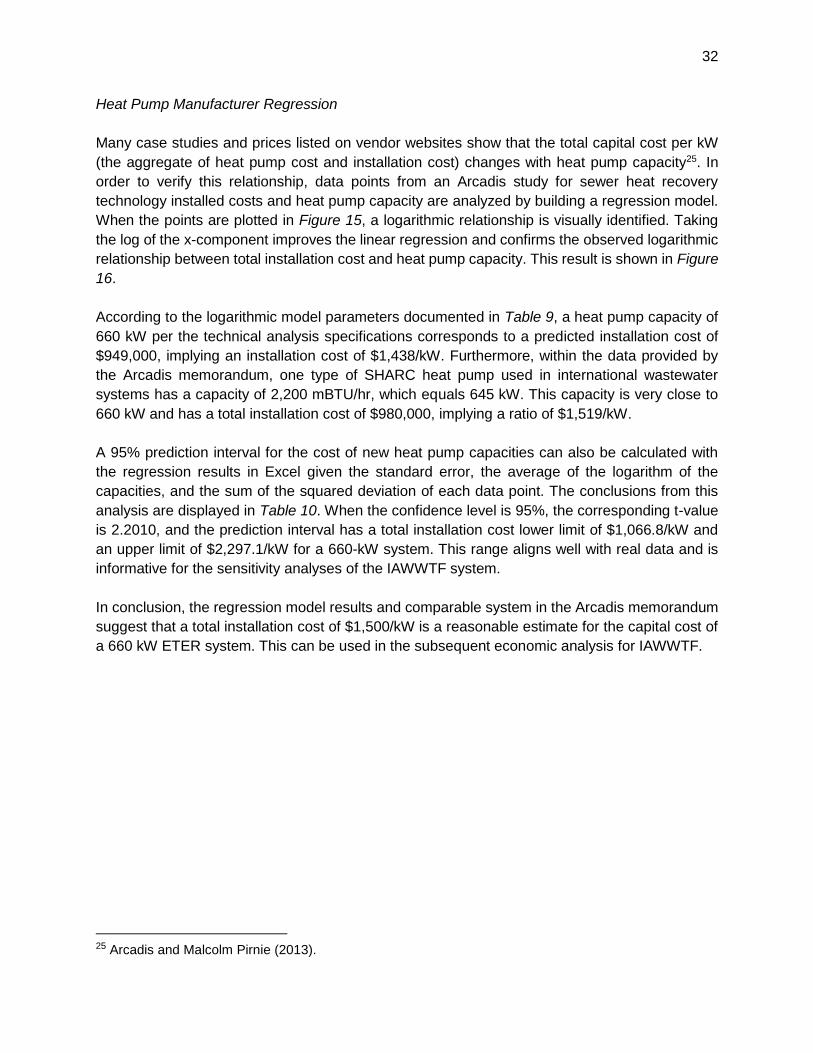
In the scenario analysis that is documented later in this report, several financial metrics are
reported. First, the Net Present Value (NPV) of the project reports the present value of all project
expenditures over the 30-year period and accounts for capital expenditures, operational and
35 100% utilization would imply that the ETER system is used for all hours of a given year. A 90% utilization rate is assumed to account for downtime due to maintenance.
40
maintenance costs, all purchased energy, revenue from the sale of heat to City Harbor, and
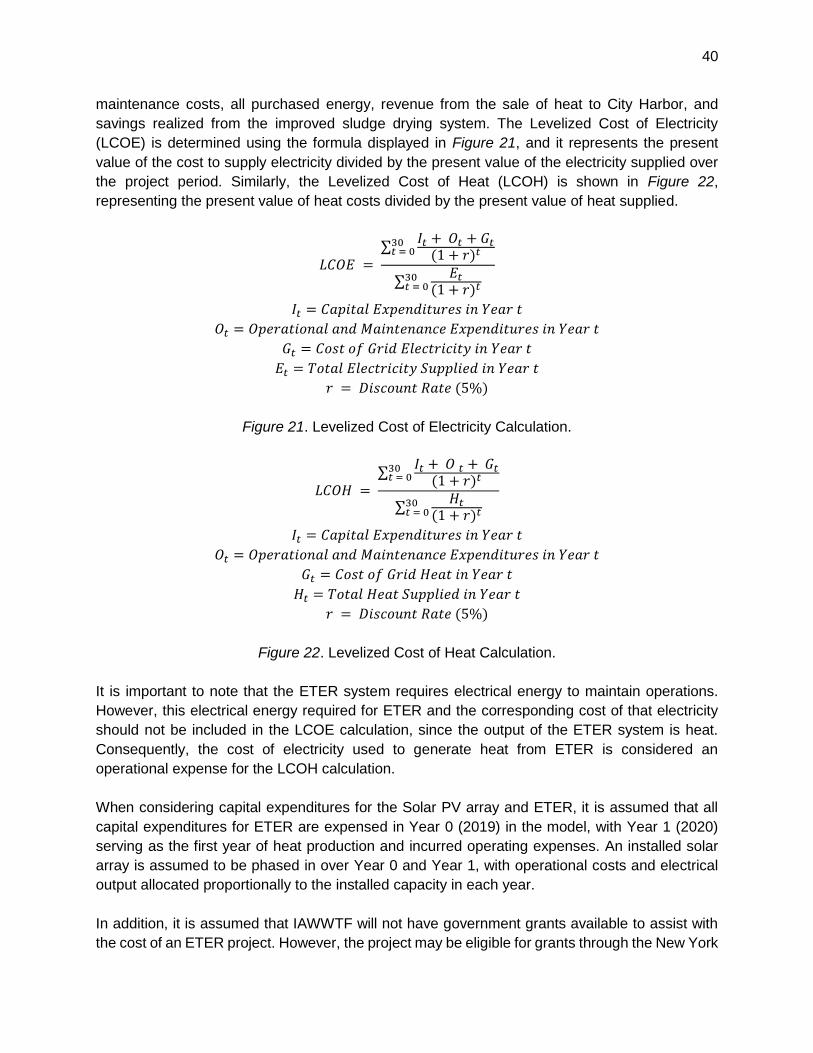
savings realized from the improved sludge drying system. The Levelized Cost of Electricity
(LCOE) is determined using the formula displayed in Figure 21, and it represents the present
value of the cost to supply electricity divided by the present value of the electricity supplied over
the project period. Similarly, the Levelized Cost of Heat (LCOH) is shown in Figure 22,
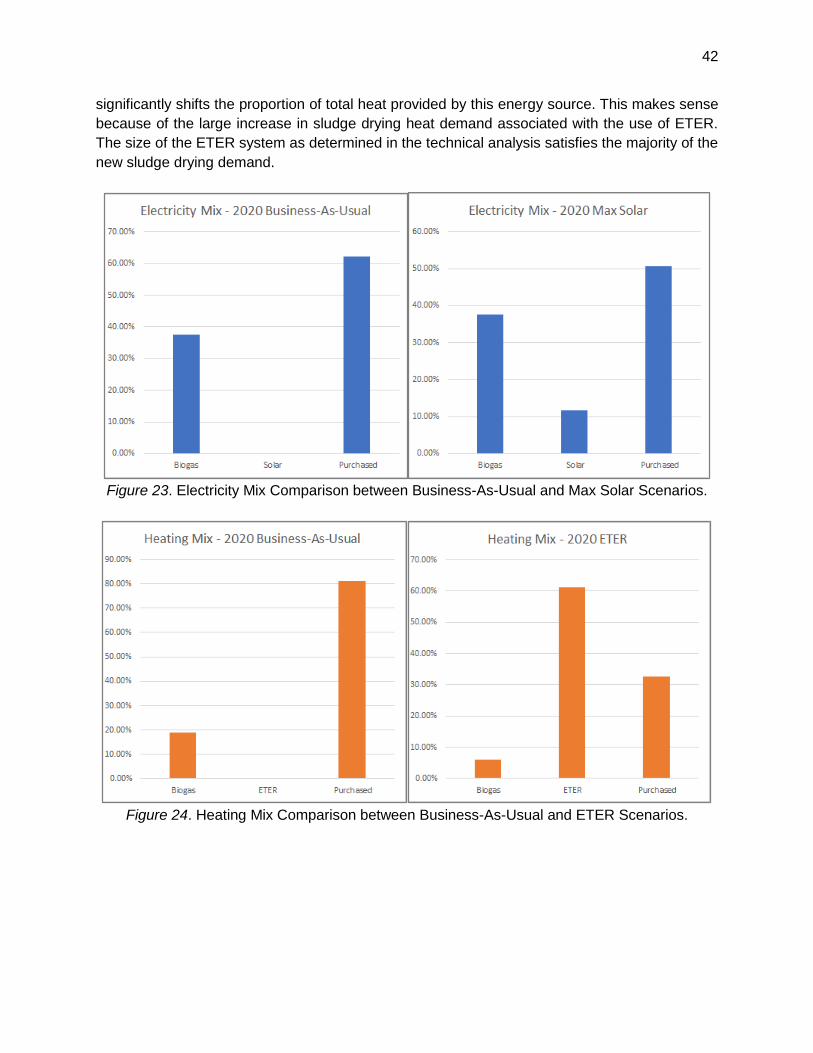
representing the present value of heat costs divided by the present value of heat supplied.