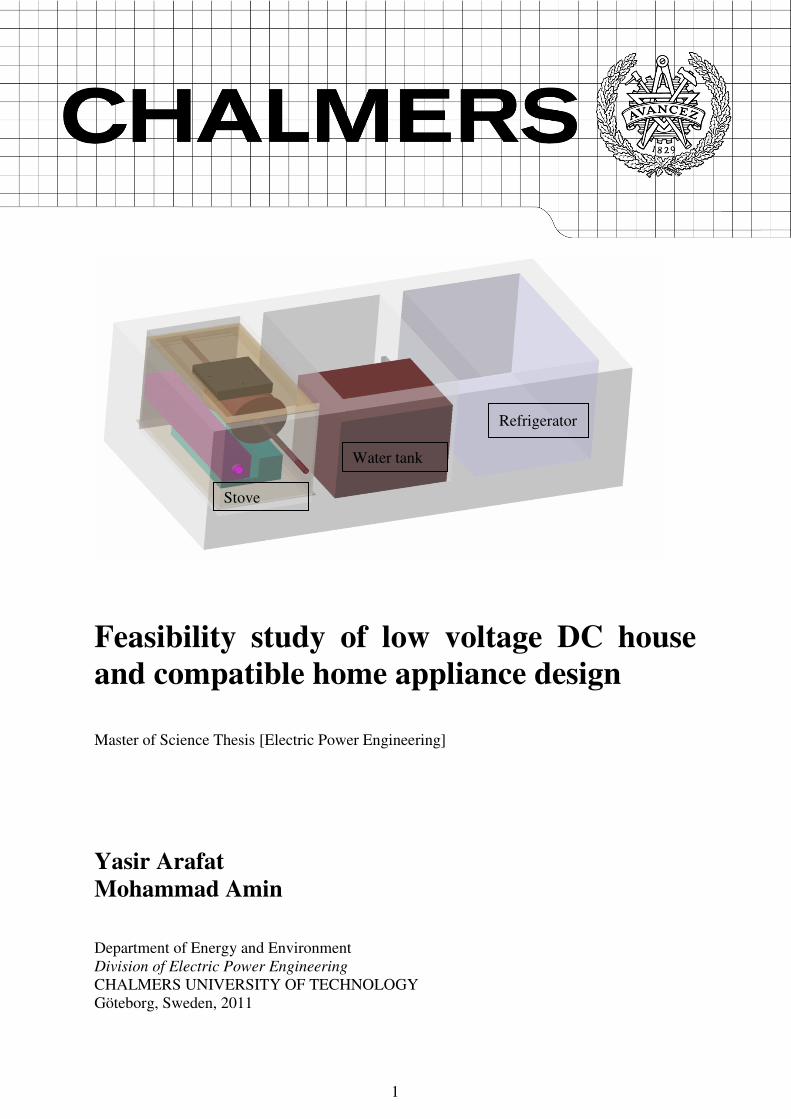
1 Feasibility study of low voltage DC house and compatible home appliance design Master of Science Thesis [Electric Power Engineering] Yasir Arafat Mohammad Amin Department of Energy and Environment Division of Electric Power Engineering CHALMERS UNIVERSITY OF TECHNOLOGY Göteborg, Sweden, 2011 Stove Water tank Refrigerator
Transcript
1
Feasibility study of low voltage DC house
and compatible home appliance design
Master of Science Thesis [Electric Power Engineering]
Yasir Arafat
Mohammad Amin
Department of Energy and Environment
Division of Electric Power Engineering
CHALMERS UNIVERSITY OF TECHNOLOGY
Göteborg, Sweden, 2011
Stove
Water tank
Refrigerator
2
3
Feasibility study of low voltage DC house and
compatible home appliance design
Y. Arafat & M. Amin
Department of Energy & Environment CHALMERS UNIVERSITY OF TECHNOLOGY
Göteborg, Sweden 2011
4
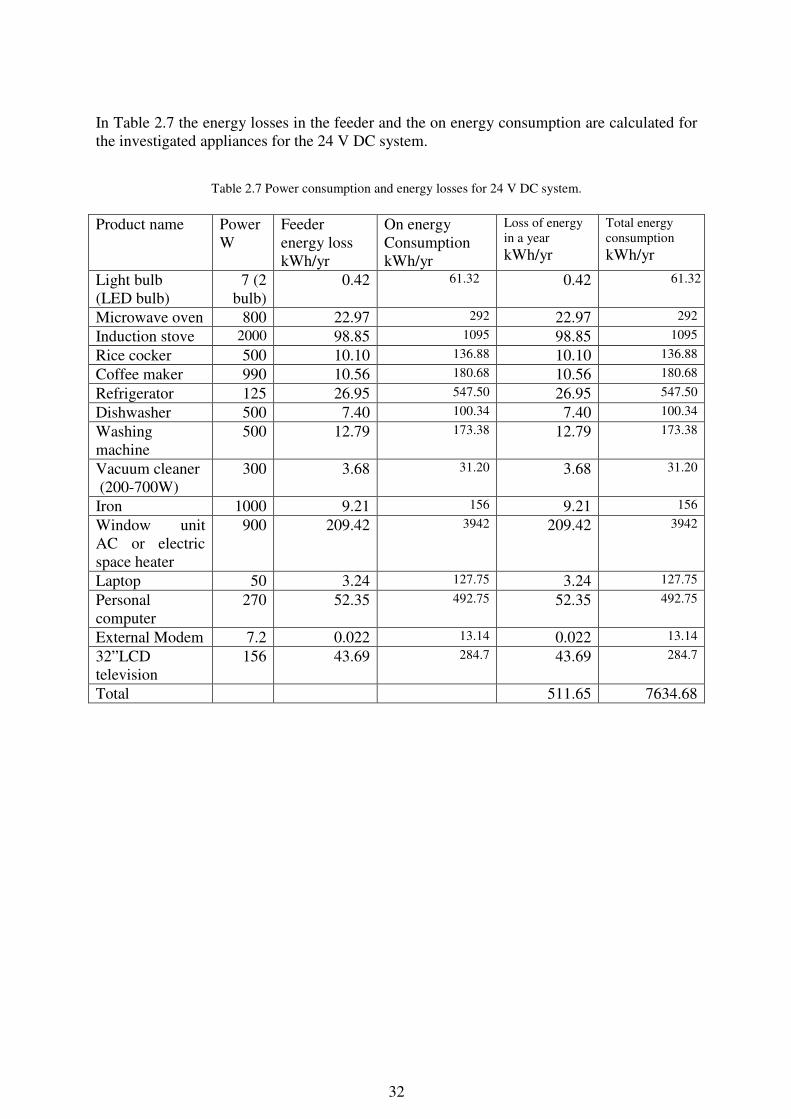
Feasibility study of low voltage DC house and compatible home appliance design
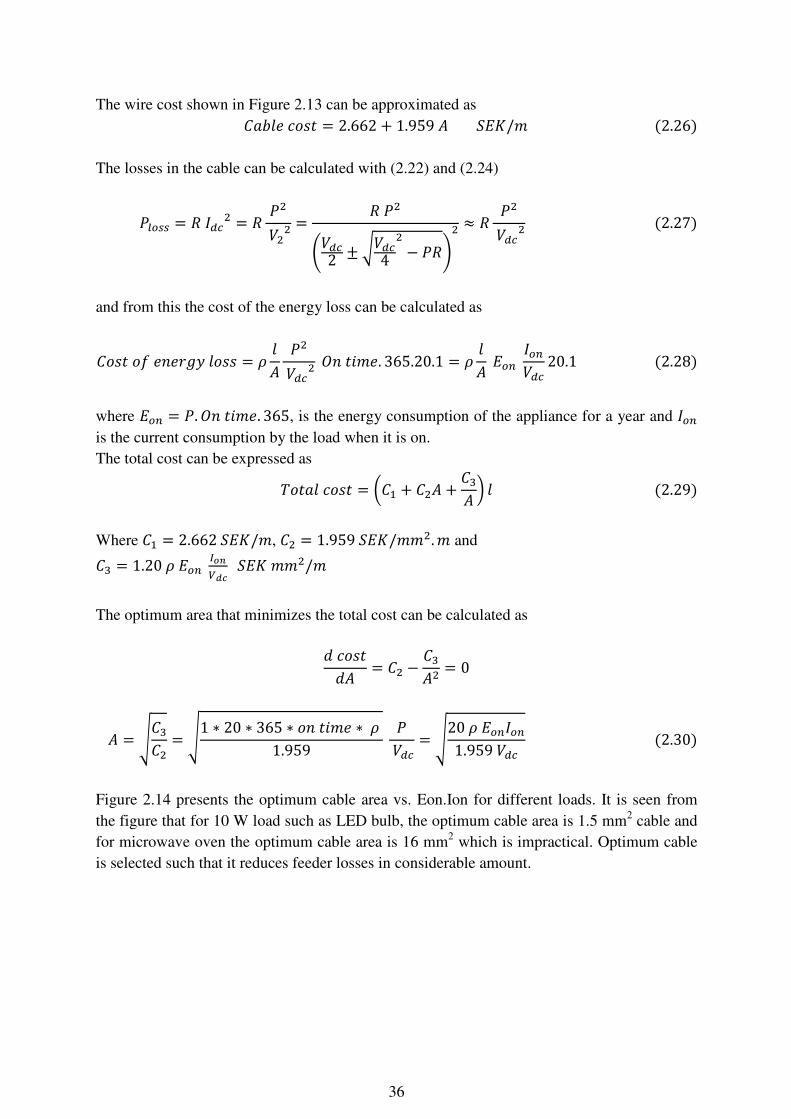
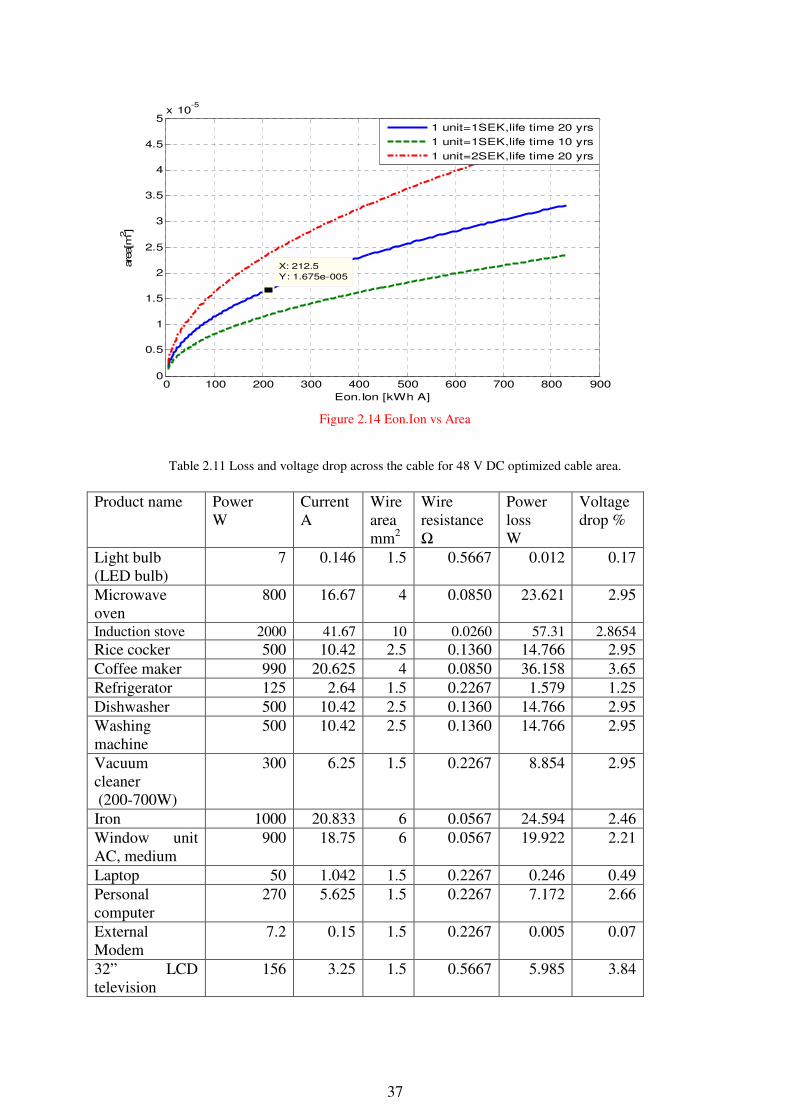
washer, washing machine, light bulb, vacuum cleaner, iron, window unit AC, laptop, personal
computer, external modem and 32” LCD television. The power rating of the investigated
loads are in the range of 7 W to 2000 W. The on-duration of household appliances is obtained
from a survey in some houses in Bangladesh and Sweden. The running hour of the appliances
varies from house to house, season to season and country to country. For example, some
houses use the washing machine for less than 50 cycles in a year and some houses use it for
more than 750 cycles per year [22]. The uses of washing machine are 230 cycles per year in
average [22]. For lighting, the bulb is on more than 12 hours during winter and during
summer it is not on for that long time. In Bangladesh people use the stove more than 2 hours
in a day, in Sweden it is less than 1 hour. Table 2.2 shows the power rating, standby power,
feeder length and on-duration in a day of the investigated appliances. It is obtained that the
dishwasher runs for 200 cycles per year and the washing Machine runs for 230 cycles per
year [22].
18
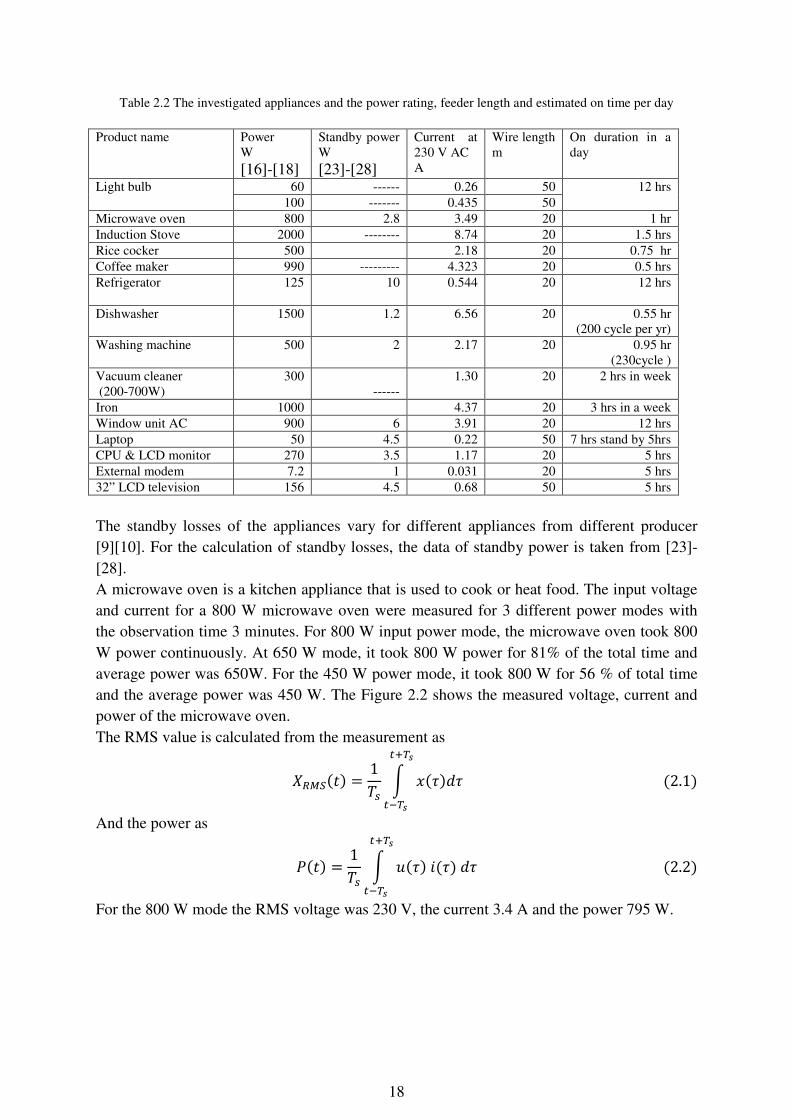
Table 2.2 The investigated appliances and the power rating, feeder length and estimated on time per day
Product name Power
W
[16]-[18]
Standby power
W
[23]-[28]
Current at
230 V AC
A
Wire length
m
On duration in a
day
Light bulb 60 ------ 0.26 50 12 hrs
100 ------- 0.435 50
Microwave oven 800 2.8 3.49 20 1 hr
Induction Stove 2000 -------- 8.74 20 1.5 hrs
Rice cocker 500 2.18 20 0.75 hr
Coffee maker 990 --------- 4.323 20 0.5 hrs
Refrigerator
125 10 0.544 20 12 hrs
Dishwasher 1500 1.2 6.56 20 0.55 hr
(200 cycle per yr)
Washing machine 500 2 2.17 20 0.95 hr
(230cycle )
Vacuum cleaner
(200-700W)
300
------
1.30 20 2 hrs in week
Iron 1000 4.37 20 3 hrs in a week
Window unit AC 900 6 3.91 20 12 hrs
Laptop 50 4.5 0.22 50 7 hrs stand by 5hrs
CPU & LCD monitor 270 3.5 1.17 20 5 hrs
External modem 7.2 1 0.031 20 5 hrs
32” LCD television 156 4.5 0.68 50 5 hrs
The standby losses of the appliances vary for different appliances from different producer
[9][10]. For the calculation of standby losses, the data of standby power is taken from [23]-
[28].
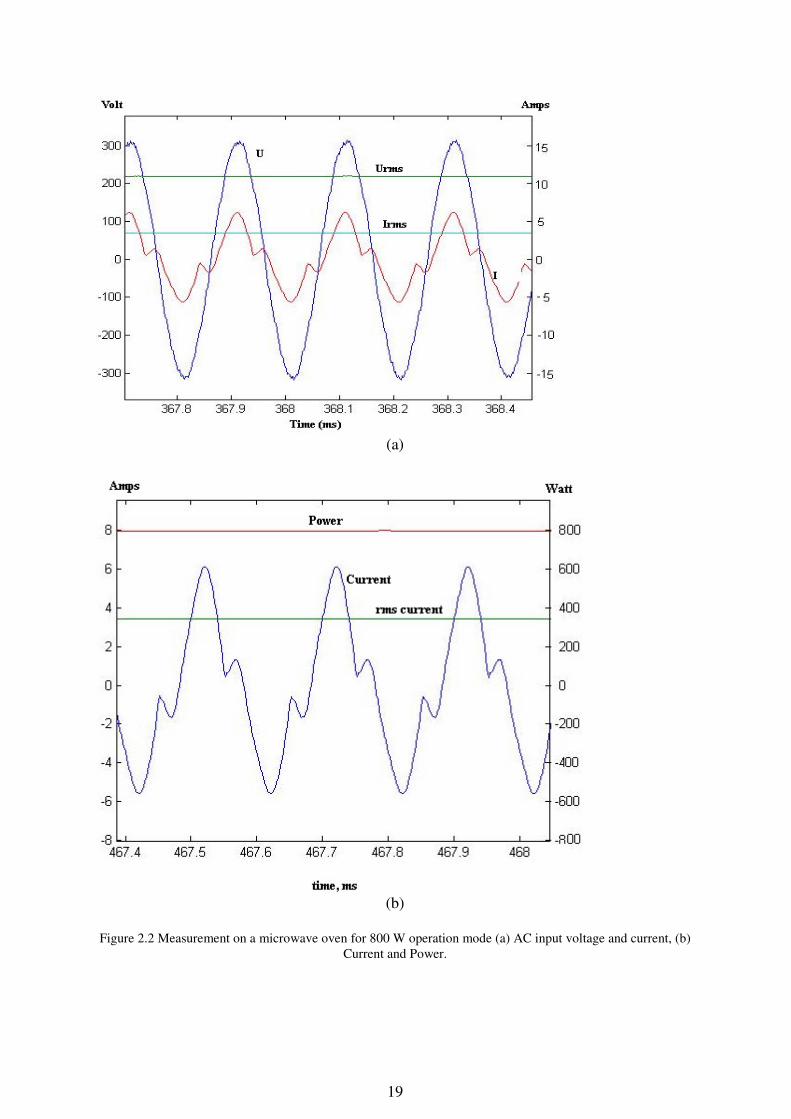
A microwave oven is a kitchen appliance that is used to cook or heat food. The input voltage
and current for a 800 W microwave oven were measured for 3 different power modes with
the observation time 3 minutes. For 800 W input power mode, the microwave oven took 800
W power continuously. At 650 W mode, it took 800 W power for 81% of the total time and
average power was 650W. For the 450 W power mode, it took 800 W for 56 % of total time
and the average power was 450 W. The Figure 2.2 shows the measured voltage, current and
power of the microwave oven.
The RMS value is calculated from the measurement as
1 2.1
And the power as
1 2.2
For the 800 W mode the RMS voltage was 230 V, the current 3.4 A and the power 795 W.
19
(a)
(b)
Figure 2.2 Measurement on a microwave oven for 800 W operation mode (a) AC input voltage and current, (b)
Current and Power.
20
The first technology used resistive heating coils for the electrical stove. Now induction stoves
are using which heat the cookware directly through electromagnetic induction and require
pots and pans with ferromagnetic bottoms. From the survey, on-duration of electric stove is
1.5 hrs per day. A Rice cooker is a resistive load. It consumes power at a constant rate. The
power rating of the rice cooker measured in the lab was 500 W and on-duration is 0.75 hrs per
day. A coffee maker is also a resistive load and the on-duration in average is half an hour per
day. It consumes constant power when the heater is on. For the coffee maker measured on,
the power consumption is 990 W. The compressor of a refrigerator does not operate for 24
hours in a day. For the refrigerator measured on in this work, the compressor was on for 12
hours and was left off for 12 hours. When the compressor is operating, it is taking 125W in
average and 10W when it is off. The speed of the compressor’s motor is controlled by varying
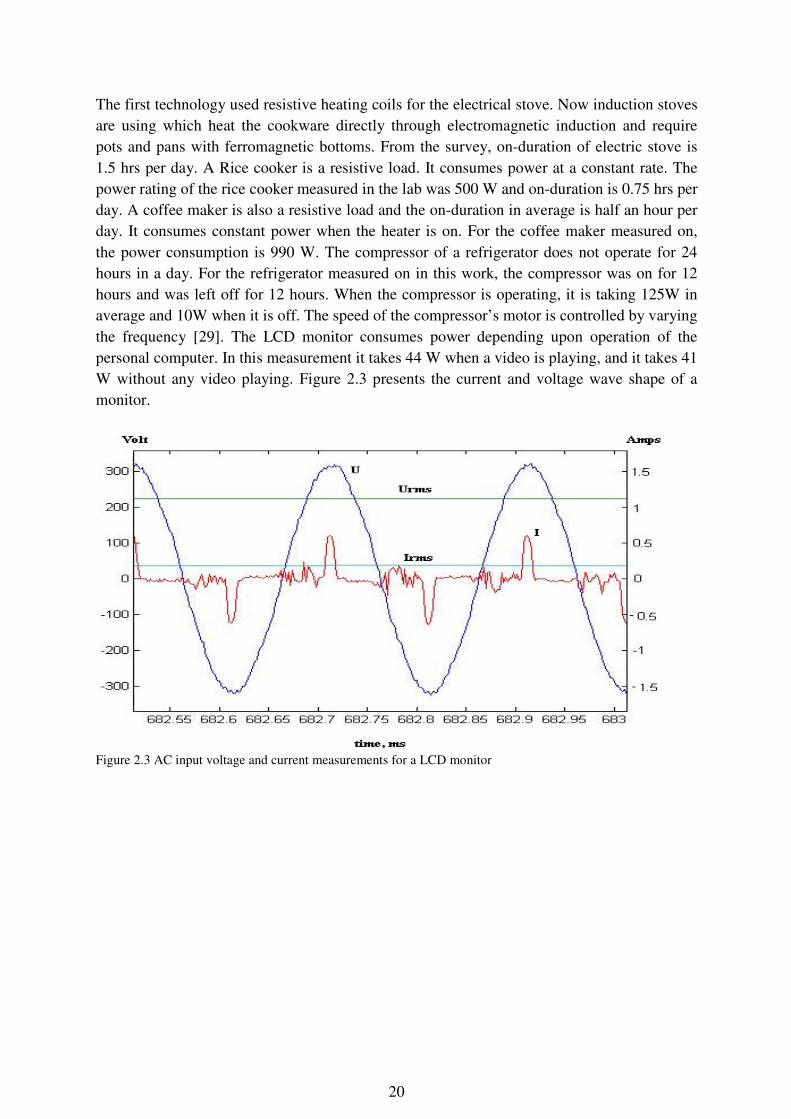
the frequency [29]. The LCD monitor consumes power depending upon operation of the
personal computer. In this measurement it takes 44 W when a video is playing, and it takes 41
W without any video playing. Figure 2.3 presents the current and voltage wave shape of a
monitor.
Figure 2.3 AC input voltage and current measurements for a LCD monitor
21
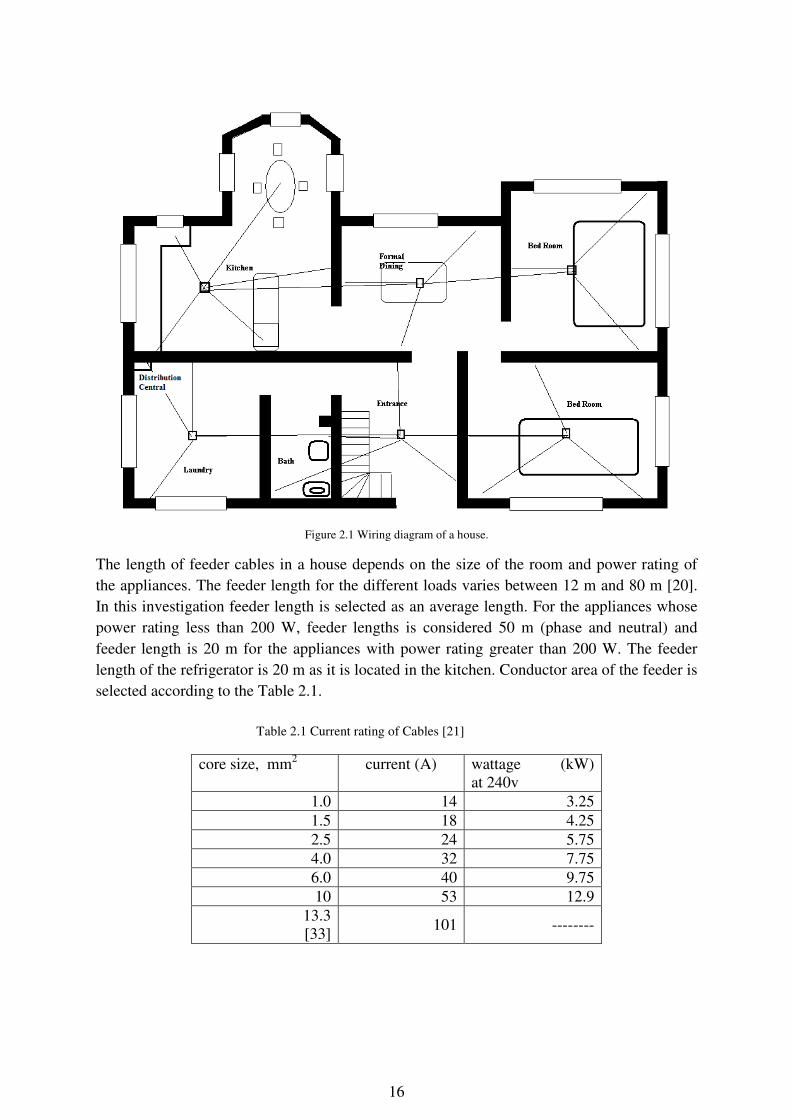
2.2 The 230 volt AC House
2.2.1 AC distribution system for the house
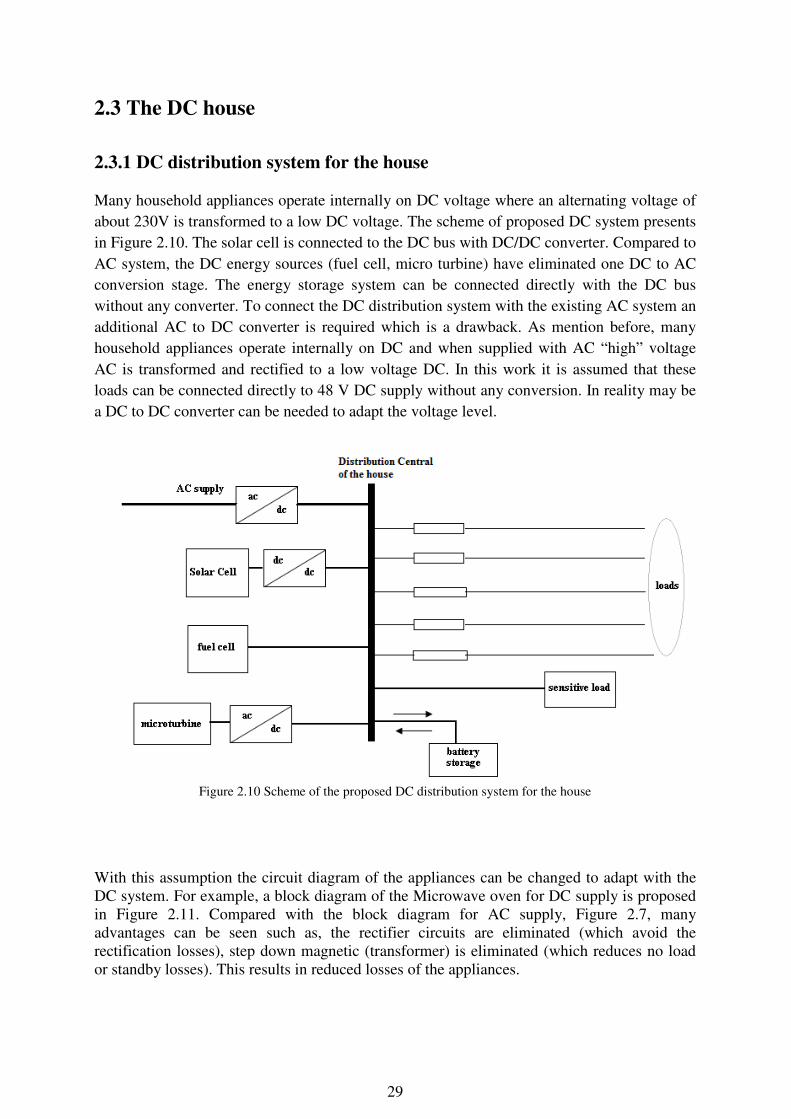
The Figure 2.4 shows a scheme of 230 volt AC system including distributed generation
sources and sensitive loads. The DC power sources such as solar cell, fuel cell can be
connected with the AC distribution system of a house. For solar cell and fuel cell, a DC to AC
converter is required in this power system. Utilizing solar energy in this way involves two
stages of energy conversion and wind energy (micro turbine) needs three stages of energy
conversions with inherent energy losses. For the micro turbine, a full scale frequency
converter is needed to connect with the AC bus. For the sensitive loads, uninterruptable
power supply (UPS) is required. The efficiency of dc-ac inverter is up to 85% [19]. There are
some losses in this conversion. These losses could be minimized by introducing DC grid.
Figure 2.4 Scheme of 230 Volt AC system including distributed generation sources and sensitive loads.
The losses and voltage drop over the feeder cable can be calculated for a single phase load by
using the circuit in Figure 2.5.
Figure 2.5 simple AC circuit
22
The voltages in the circuit can be calculated by using the phasor diagram method.
! "# $ ! "# 2.3
where is the RMS voltage at the distribution central of the house. ! "# is the current in the
circuit and R is the resistance of the cable, 2&'( is the reactance of the cable. L is the
cable inductance and f is the grid frequency.
If the load voltage is selected as reference phasor the current can be expressed as
! "# )! "#)cos- . )! "#)sin- 2.4
where φ is the angle between the load voltage and the current.
The voltages can be expressed as
2)! "#)cos- . )! "#)sin-3 2.5
2 )! "#)cos- X )! "#)sin-3 jR )! "#)sin- . X )! "#)cos - 2.6 The active power consumed by the load is ) ) )! "#)cos- 2.7:
And the reactive power; ) ) )! "#)sin- 2.7<
this gives
;|| . ;|| 2.8
Since many of the investigated loads are operating with unity or close to unity power factor at
least the high power consuming loads, unity power factor is used for all loads in this work.
Unity power factor means that; 0, this gives that the load voltage can be calculated as
|| $|| 2.9
|||| || $
|| . |||| $
|| ||2 A B||4 . )$) 2.10
CDE:FG HDI . J 100 % 2.10:
And the current as
)! "#) || 2.11
23
The losses in the feeder cable is calculated as
LM |! "#| 2.12
The resistance of the feeder cable can be calculated as
R N EO 2.13
Where ρ =1.7x10⁻⁸
Ωm-1
is the resistivity for copper, l is the length of the feeder and A is the
area of the feeder. The inductance can be calculated by assuming that the phase and neutral
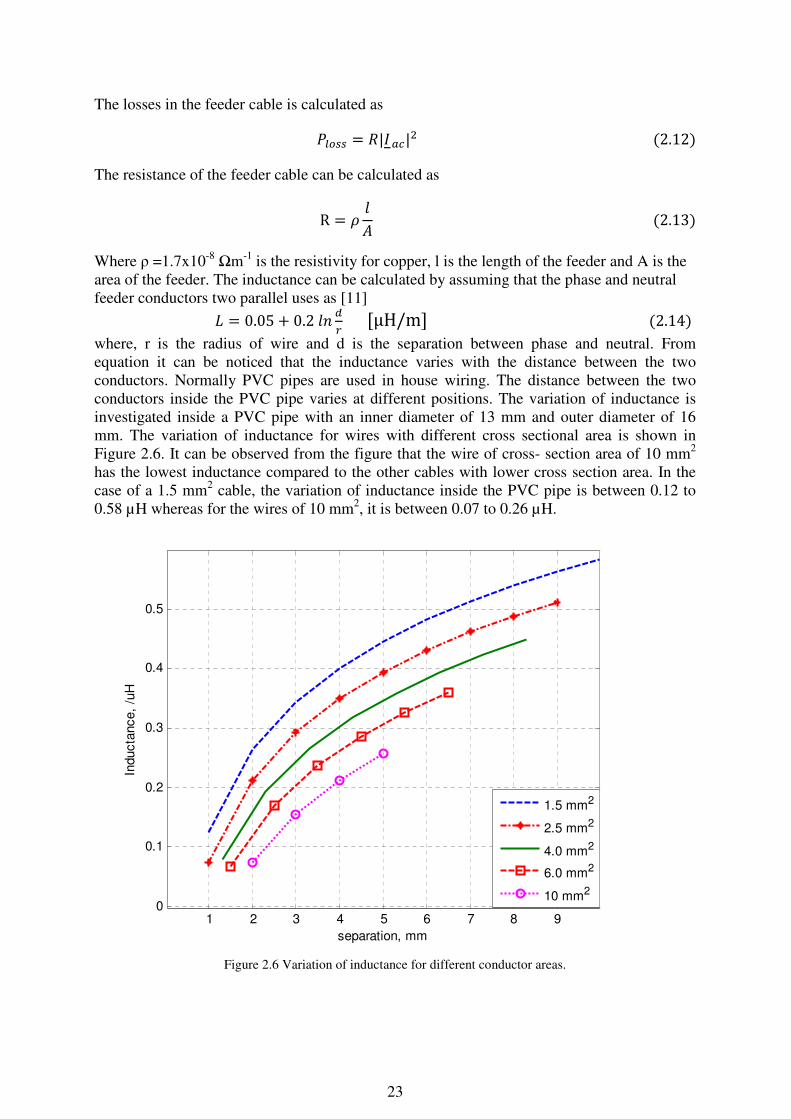
feeder conductors two parallel uses as [11] ( 0.05 0.2 EP QR SμH/mX 2.14 where, r is the radius of wire and d is the separation between phase and neutral. From
equation it can be noticed that the inductance varies with the distance between the two
conductors. Normally PVC pipes are used in house wiring. The distance between the two
conductors inside the PVC pipe varies at different positions. The variation of inductance is
investigated inside a PVC pipe with an inner diameter of 13 mm and outer diameter of 16
mm. The variation of inductance for wires with different cross sectional area is shown in
Figure 2.6. It can be observed from the figure that the wire of cross- section area of 10 mm2
has the lowest inductance compared to the other cables with lower cross section area. In the
case of a 1.5 mm2 cable, the variation of inductance inside the PVC pipe is between 0.12 to
0.58 µH whereas for the wires of 10 mm2, it is between 0.07 to 0.26 µH.
Figure 2.6 Variation of inductance for different conductor areas.
1 2 3 4 5 6 7 8 90
0.1
0.2
0.3
0.4
0.5
separation, mm
Inducta
nce,
/uH
1.5 mm2
2.5 mm2
4.0 mm2
6.0 mm2
10 mm2
24
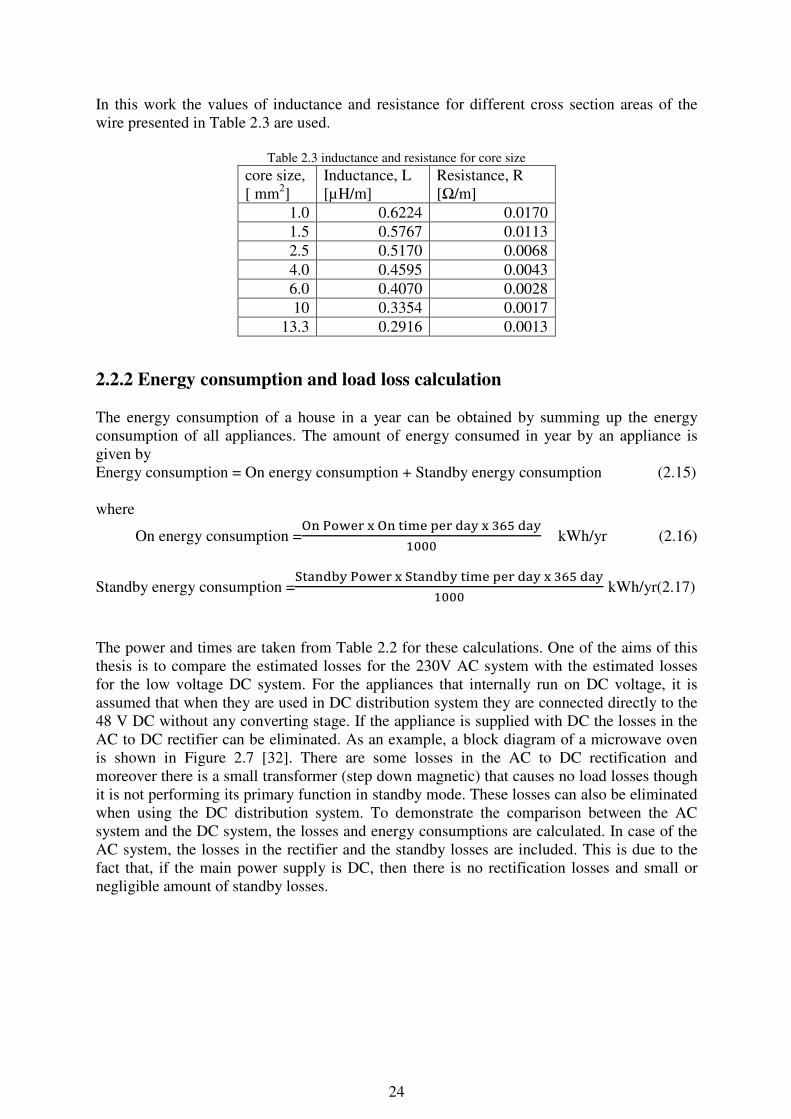
In this work the values of inductance and resistance for different cross section areas of the
wire presented in Table 2.3 are used.
Table 2.3 inductance and resistance for core size
core size,
[ mm2]
Inductance, L
[µH/m]
Resistance, R
[Ω/m]
1.0 0.6224 0.0170
1.5 0.5767 0.0113
2.5 0.5170 0.0068
4.0 0.4595 0.0043
6.0 0.4070 0.0028
10 0.3354 0.0017
13.3 0.2916 0.0013
2.2.2 Energy consumption and load loss calculation
The energy consumption of a house in a year can be obtained by summing up the energy
consumption of all appliances. The amount of energy consumed in year by an appliance is
given by
Energy consumption = On energy consumption + Standby energy consumption (2.15)
where
On energy consumption =OZ P\]^_ ` OZ abc^ d^_ efg ` hij efgkkk kWh/yr (2.16)
Standby energy consumption =SafZemg P\]^_ ` SafZemg abc^ d^_ efg ` hij efgkkk kWh/yr(2.17)
The power and times are taken from Table 2.2 for these calculations. One of the aims of this
thesis is to compare the estimated losses for the 230V AC system with the estimated losses
for the low voltage DC system. For the appliances that internally run on DC voltage, it is
assumed that when they are used in DC distribution system they are connected directly to the
48 V DC without any converting stage. If the appliance is supplied with DC the losses in the
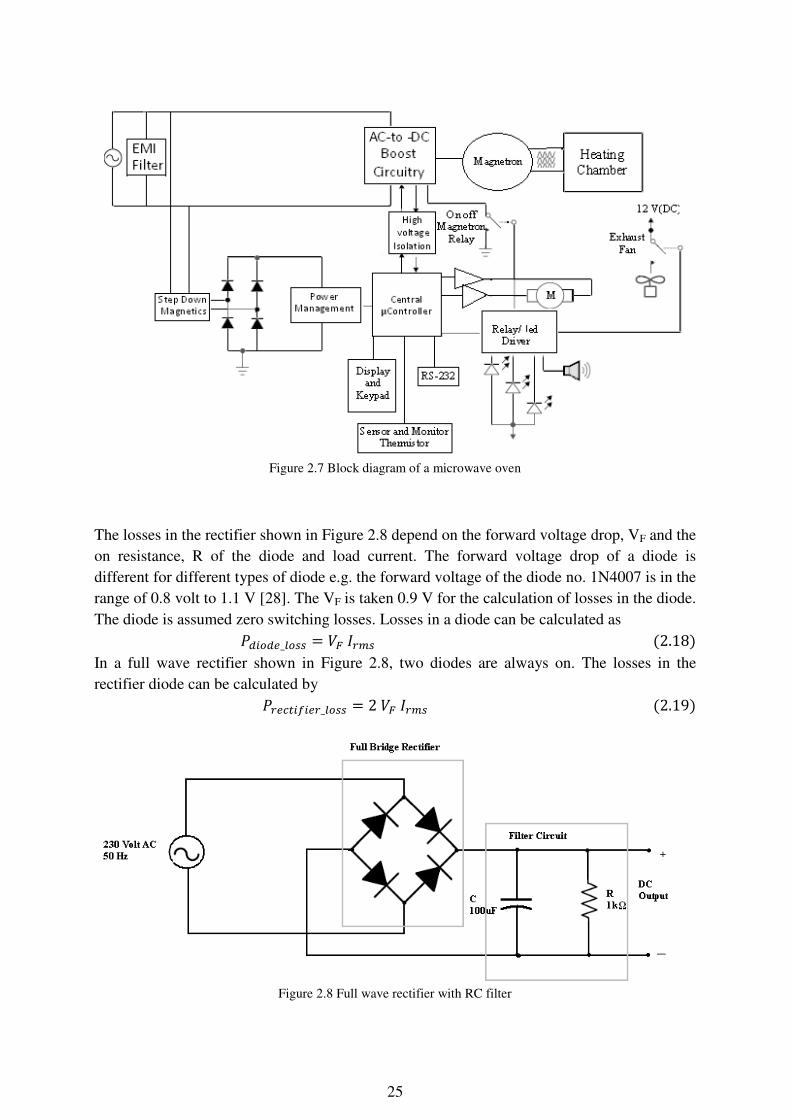
AC to DC rectifier can be eliminated. As an example, a block diagram of a microwave oven
is shown in Figure 2.7 [32]. There are some losses in the AC to DC rectification and
moreover there is a small transformer (step down magnetic) that causes no load losses though
it is not performing its primary function in standby mode. These losses can also be eliminated
when using the DC distribution system. To demonstrate the comparison between the AC
system and the DC system, the losses and energy consumptions are calculated. In case of the
AC system, the losses in the rectifier and the standby losses are included. This is due to the
fact that, if the main power supply is DC, then there is no rectification losses and small or
negligible amount of standby losses.
25
Figure 2.7 Block diagram of a microwave oven
The losses in the rectifier shown in Figure 2.8 depend on the forward voltage drop, VF and the
on resistance, R of the diode and load current. The forward voltage drop of a diode is
different for different types of diode e.g. the forward voltage of the diode no. 1N4007 is in the
range of 0.8 volt to 1.1 V [28]. The VF is taken 0.9 V for the calculation of losses in the diode.
The diode is assumed zero switching losses. Losses in a diode can be calculated as
QnMQo_LM Cq !Rr 2.18
In a full wave rectifier shown in Figure 2.8, two diodes are always on. The losses in the
rectifier diode can be calculated by Ro#nsnoR_LM 2 Cq !Rr 2.19
Figure 2.8 Full wave rectifier with RC filter
26
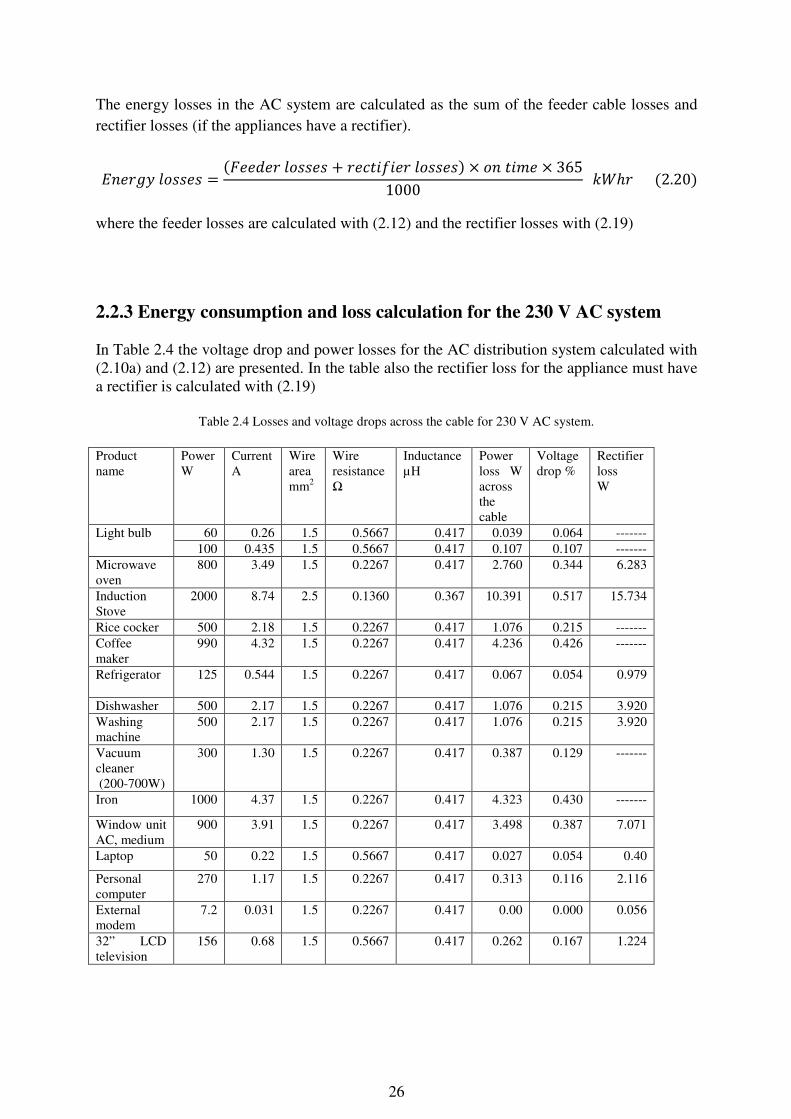
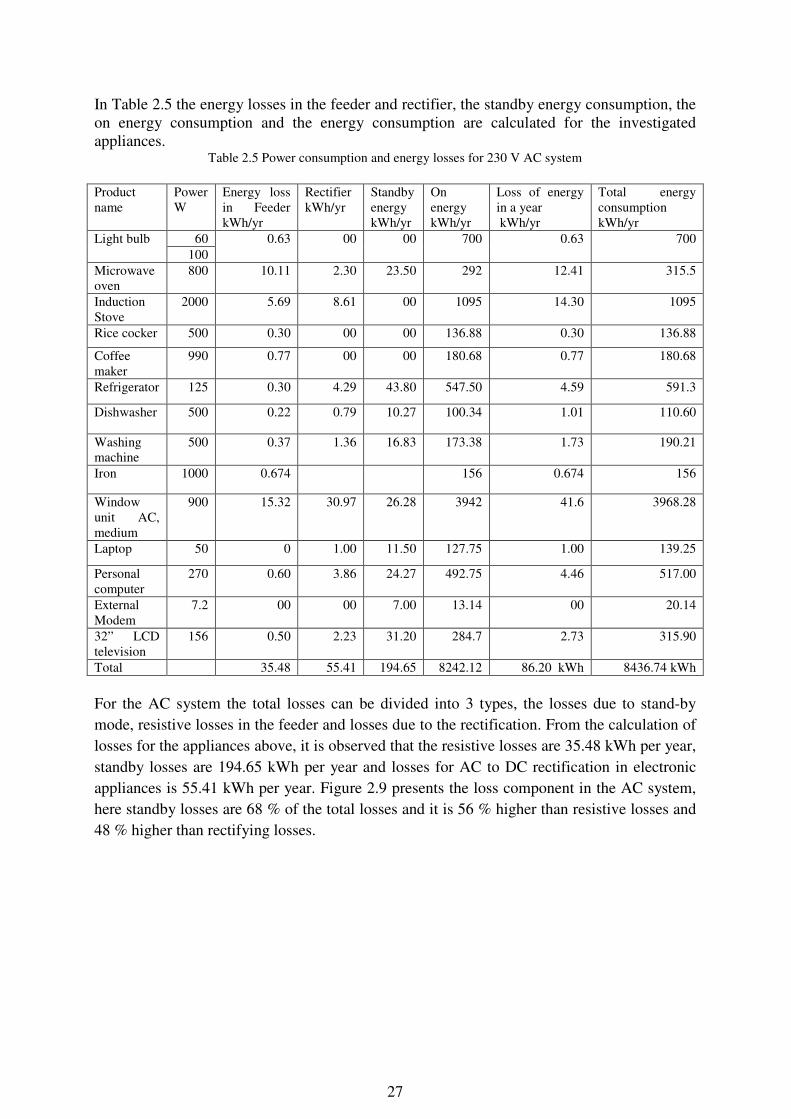
The energy losses in the AC system are calculated as the sum of the feeder cable losses and
rectifier losses (if the appliances have a rectifier).
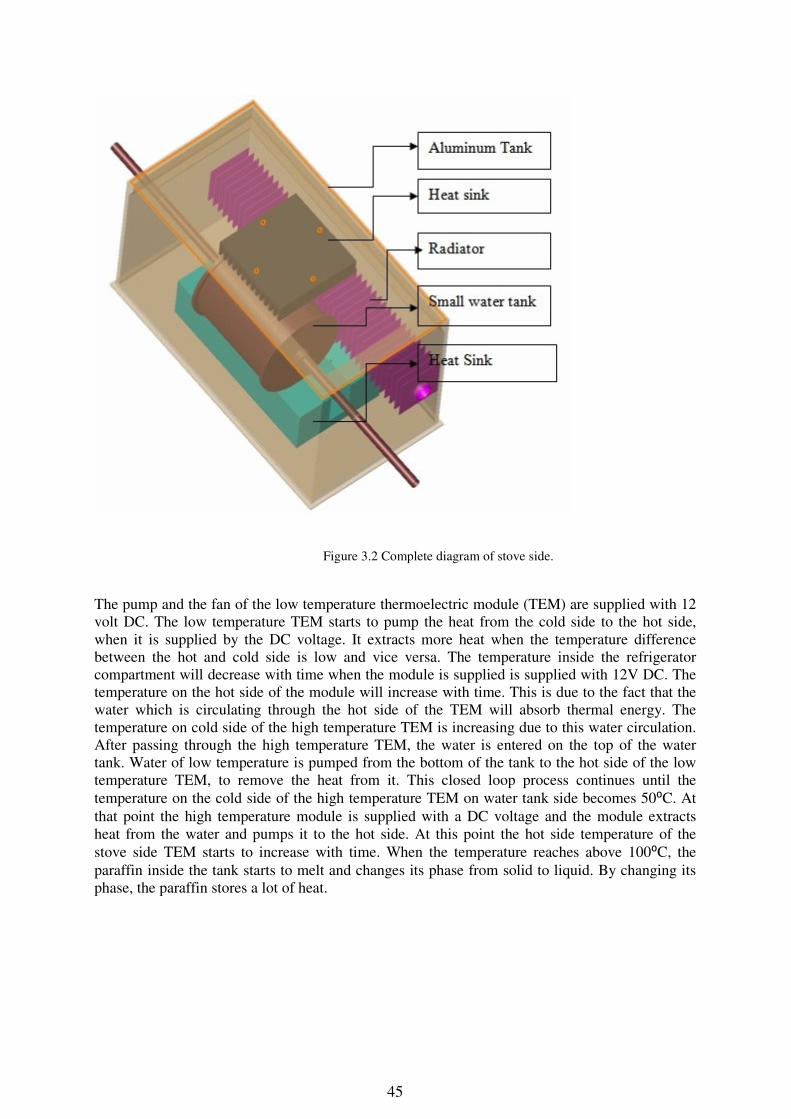
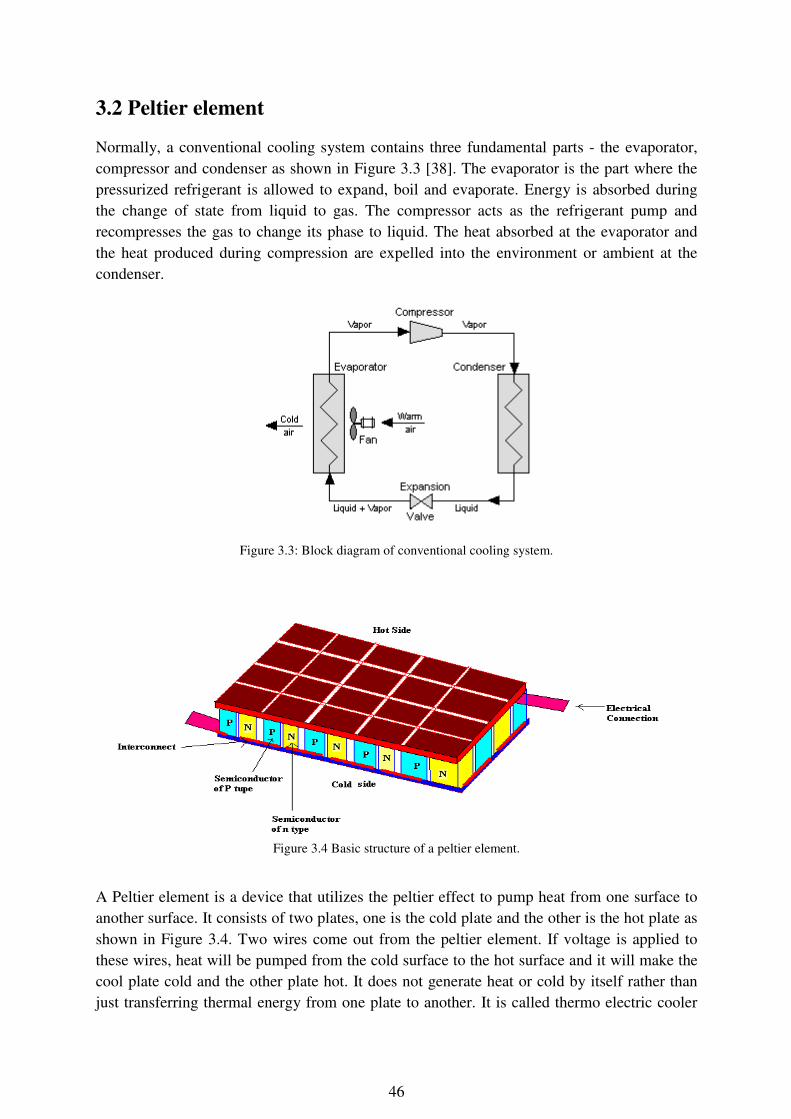
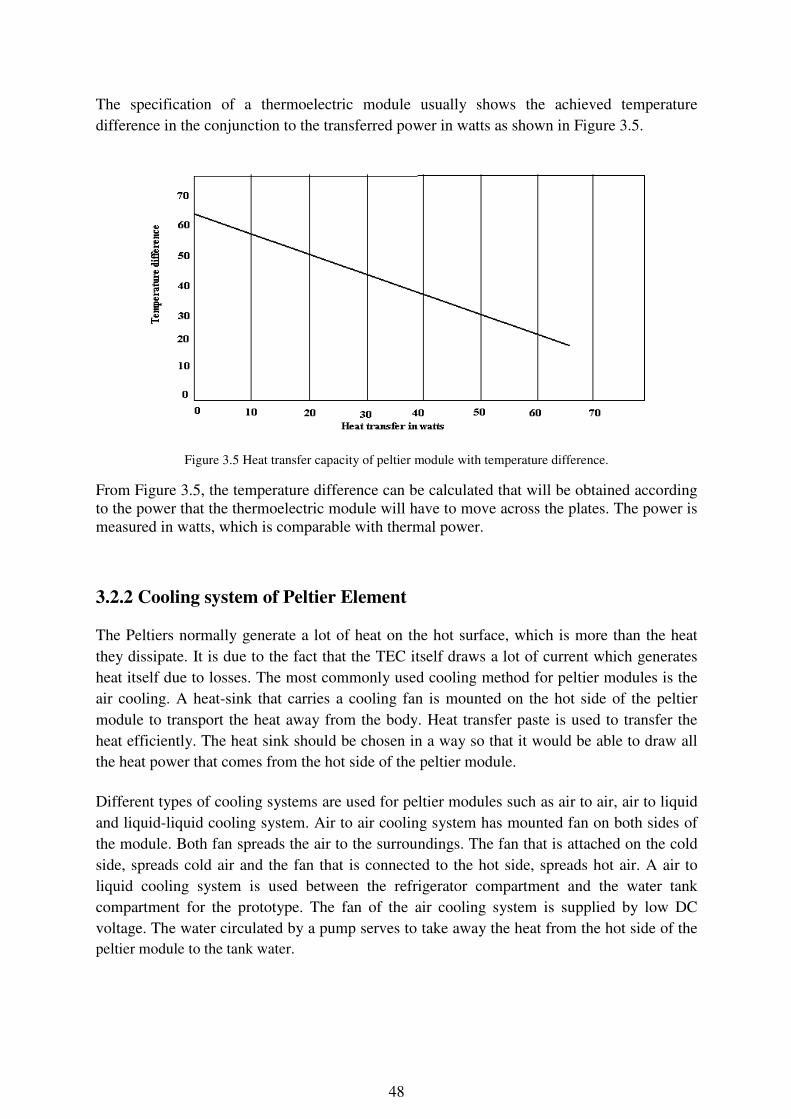
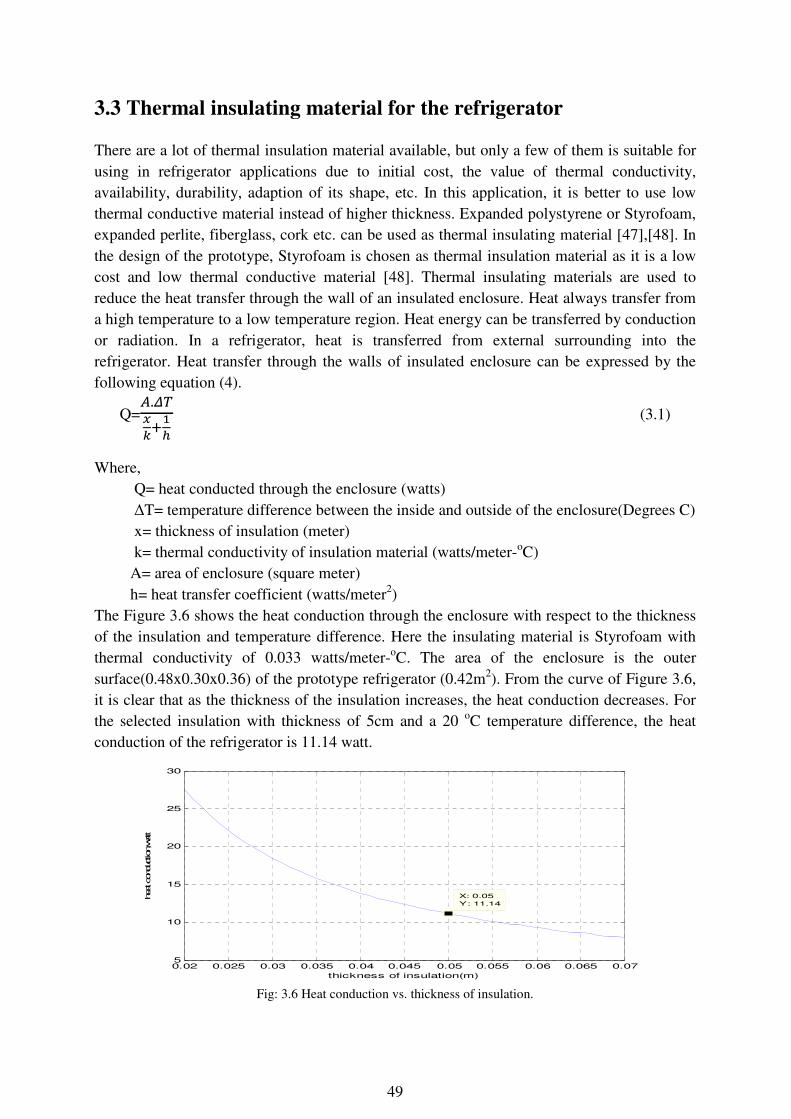
are used as these stages are manageable compared to gas. Different types of phase change
materials [45] are used to store the heat energy such as Organic Phase Change material for
example Paraffin (CnH2n+2) and Fatty acids (CH3(CH2)2nCOOH), Inorganic Phase Change
material for example Salt hydrates (MnH2O). Paraffin is good for storing thermal energy as it
has a high specific heat capacity and it is relatively cheap.
Solid liquid phase change materials such as paraffin, changes their state at a certain
temperature without increasing its own temperature significantly at that point. It absorbs huge
amount of thermal energy during this change of state from solid to liquid. The amount of the
stored thermal energy depends on the volume and heat storage capacity of the phase change
material. The stored thermal energy is released when the ambient temperature around the
liquid decreases and the phase is changed to its previous stage. Paraffin shows crystalline
characteristics due to higher purity and special composition and it gives high heat storage
capacity. It is non toxic, ecologically harmless, easy to handle, has large melting temperature
range and its performance is stable during phase change cycle. The paraffin that is used in this
thesis work is RT 100 [46]. It has melting temperature range of (90-112) °C, typically 100 °C
and flash point is 312°C . The heat storage capacity is 124kJ/Kg. Density of solid paraffin at
15°C is 0.88 kg/l while density of liquid at 115°C: 0.77 kg/l. Heat conductivity is 0.2
W/(m*k) and volume expansion in phase change range is 14%.
51
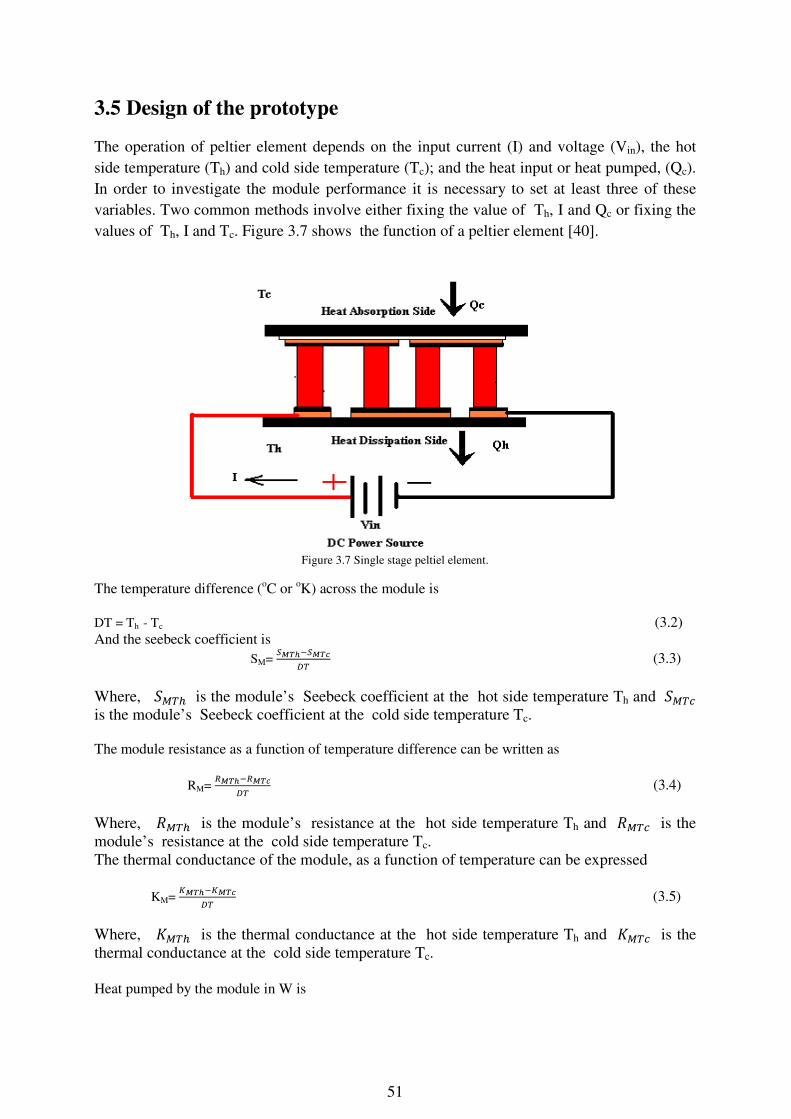
3.5 Design of the prototype
The operation of peltier element depends on the input current (I) and voltage (Vin), the hot
side temperature (Th) and cold side temperature (Tc); and the heat input or heat pumped, (Qc).
In order to investigate the module performance it is necessary to set at least three of these
variables. Two common methods involve either fixing the value of Th, I and Qc or fixing the
values of Th, I and Tc. Figure 3.7 shows the function of a peltier element [40].
Figure 3.7 Single stage peltiel element.
The temperature difference (oC or
oK) across the module is
DT = Th - Tc (3.2)
And the seebeck coefficient is
SM= (3.3)
Where, is the module’s Seebeck coefficient at the hot side temperature Th and #
is the module’s Seebeck coefficient at the cold side temperature Tc.
The module resistance as a function of temperature difference can be written as
RM= (3.4)
Where, is the module’s resistance at the hot side temperature Th and # is the
module’s resistance at the cold side temperature Tc.
The thermal conductance of the module, as a function of temperature can be expressed
KM= (3.5)
Where, is the thermal conductance at the hot side temperature Th and # is the
thermal conductance at the cold side temperature Tc.
Heat pumped by the module in W is
52
Qc = SM x Tc x I - 0.5 x I2 x RM - KM x DT. (3.6)
Qc can be differentiated with respect to input current to maximize the pumped heat
QQ SM Tc - I RM =0 (3.7)
I SMTC RM (3.8)
Qc,max=
- KM x DT (3.9)
The input voltage to the module in volts is
Vin= SM x DT + I x RM. (3.10)
At the optimal current for maximal pumped heat (3.8)
Vin = SM x DT + SMTC RM x RM
= SM DT + SM Tc
= SM ( Th - Tc)+ SM Tc
= SM Th (3.11)
The electrical power to the module in W is
Pin =Vin x I. (3.12)
At the optimal voltage and current for maximal pumped heat it is
Pin = SM Th xSMTC RM
= T¡TC RM (3.13)
The coefficient of performance as a refrigerator is:
COP = ¢£¤ (3.14)
The heat rejected by the module in W is
Qh =Pin +QC. (3.15)
It also can be expressed as
Qh = SM x Th x I - 0.5 x I2 x RM - KM x DT. (3.16)
The coefficient of performance as heater (COPH) is
COPH = ¢£¤ (3.17)
53
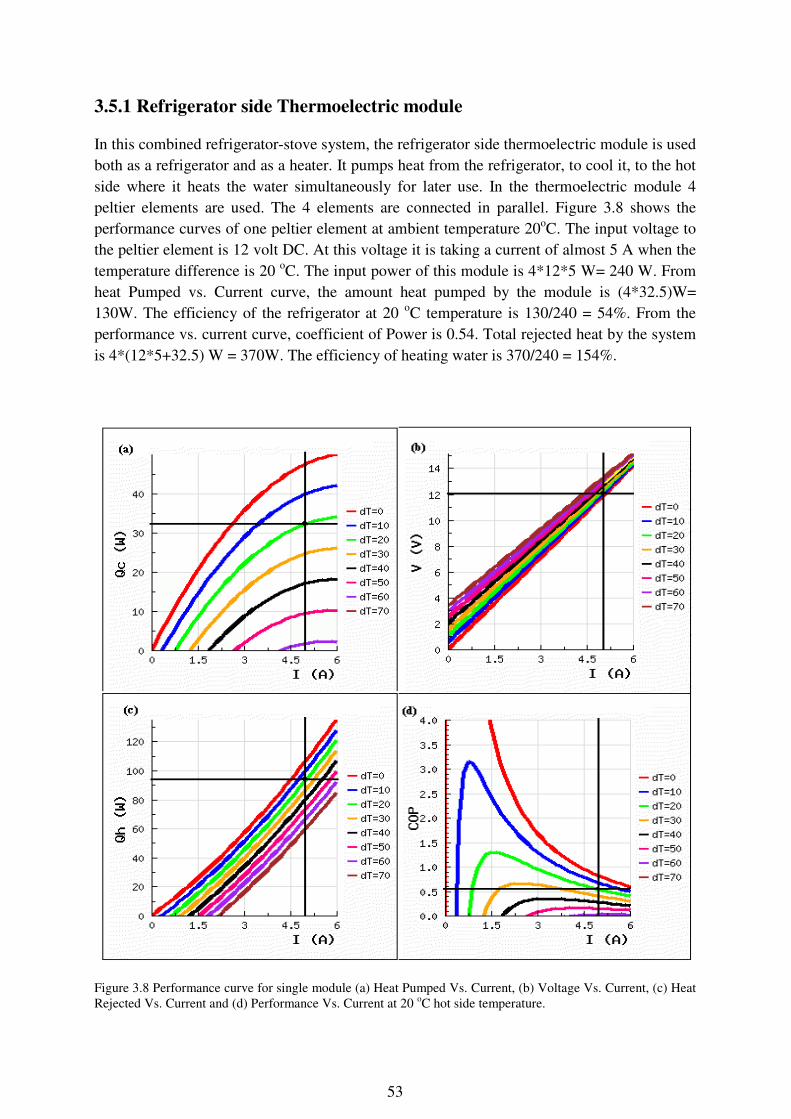
3.5.1 Refrigerator side Thermoelectric module
In this combined refrigerator-stove system, the refrigerator side thermoelectric module is used
both as a refrigerator and as a heater. It pumps heat from the refrigerator, to cool it, to the hot
side where it heats the water simultaneously for later use. In the thermoelectric module 4
peltier elements are used. The 4 elements are connected in parallel. Figure 3.8 shows the
performance curves of one peltier element at ambient temperature 20oC. The input voltage to
the peltier element is 12 volt DC. At this voltage it is taking a current of almost 5 A when the
temperature difference is 20 oC. The input power of this module is 4*12*5 W= 240 W. From
heat Pumped vs. Current curve, the amount heat pumped by the module is (4*32.5)W=
130W. The efficiency of the refrigerator at 20 oC temperature is 130/240 = 54%. From the
performance vs. current curve, coefficient of Power is 0.54. Total rejected heat by the system
is 4*(12*5+32.5) W = 370W. The efficiency of heating water is 370/240 = 154%.
Figure 3.8 Performance curve for single module (a) Heat Pumped Vs. Current, (b) Voltage Vs. Current, (c) Heat
Rejected Vs. Current and (d) Performance Vs. Current at 20 oC hot side temperature.
54
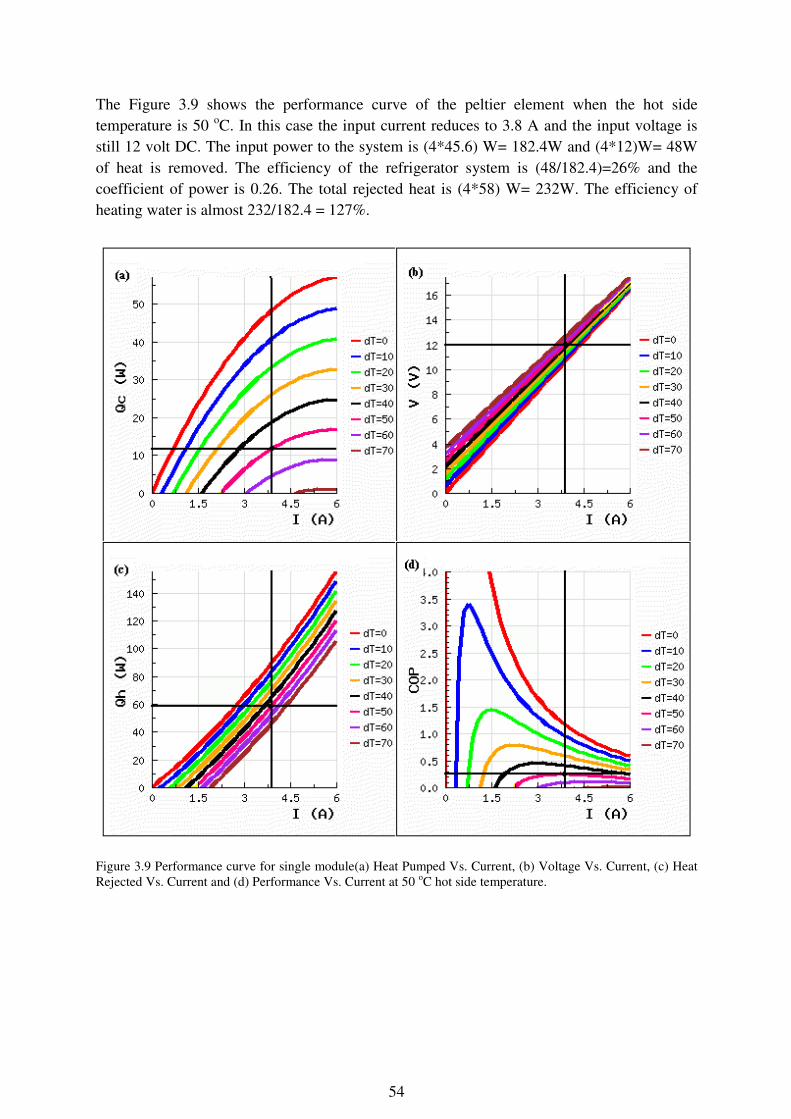
The Figure 3.9 shows the performance curve of the peltier element when the hot side
temperature is 50 oC. In this case the input current reduces to 3.8 A and the input voltage is
still 12 volt DC. The input power to the system is (4*45.6) W= 182.4W and (4*12)W= 48W
of heat is removed. The efficiency of the refrigerator system is (48/182.4)=26% and the
coefficient of power is 0.26. The total rejected heat is (4*58) W= 232W. The efficiency of
heating water is almost 232/182.4 = 127%.
Figure 3.9 Performance curve for single module(a) Heat Pumped Vs. Current, (b) Voltage Vs. Current, (c) Heat
Rejected Vs. Current and (d) Performance Vs. Current at 50 oC hot side temperature.
55
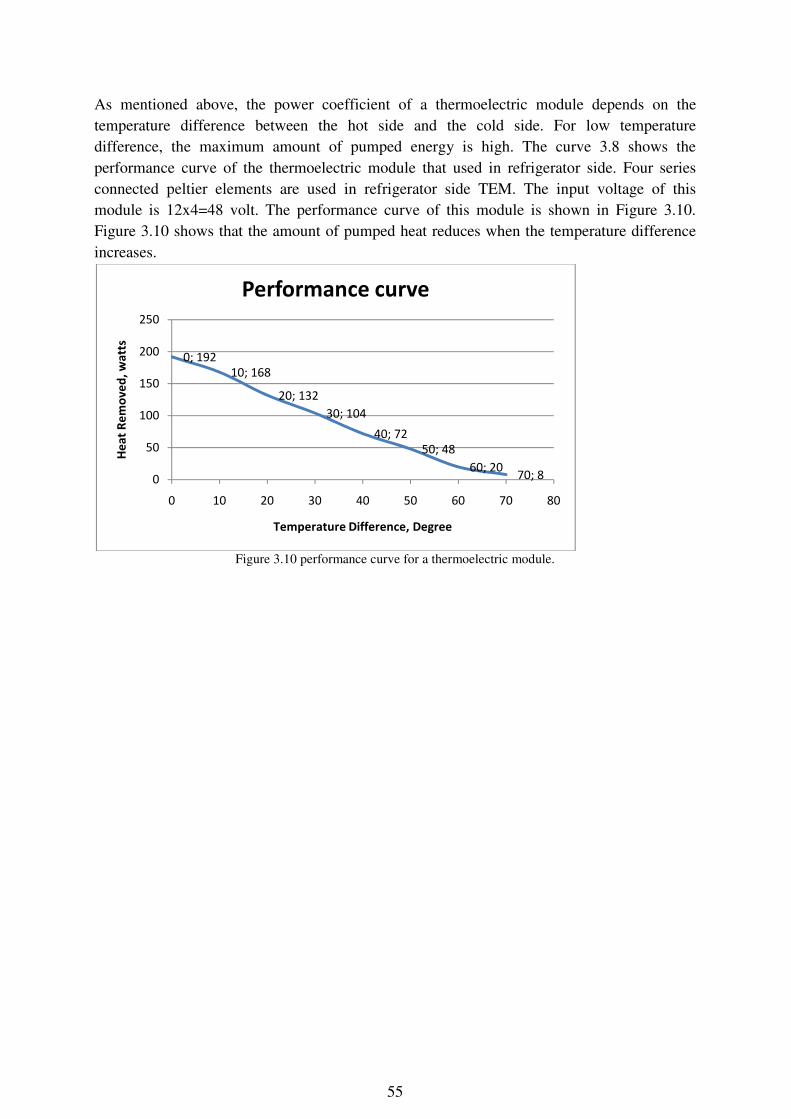
As mentioned above, the power coefficient of a thermoelectric module depends on the
temperature difference between the hot side and the cold side. For low temperature
difference, the maximum amount of pumped energy is high. The curve 3.8 shows the
performance curve of the thermoelectric module that used in refrigerator side. Four series
connected peltier elements are used in refrigerator side TEM. The input voltage of this
module is 12x4=48 volt. The performance curve of this module is shown in Figure 3.10.
Figure 3.10 shows that the amount of pumped heat reduces when the temperature difference
increases.
Figure 3.10 performance curve for a thermoelectric module.
0; 192
10; 168
20; 132
30; 104
40; 72
50; 48
60; 2070; 80
50
100
150
200
250
0 10 20 30 40 50 60 70 80
He
at
Re
mo
ve
d,
wa
tts
Temperature Difference, Degree
Performance curve
56
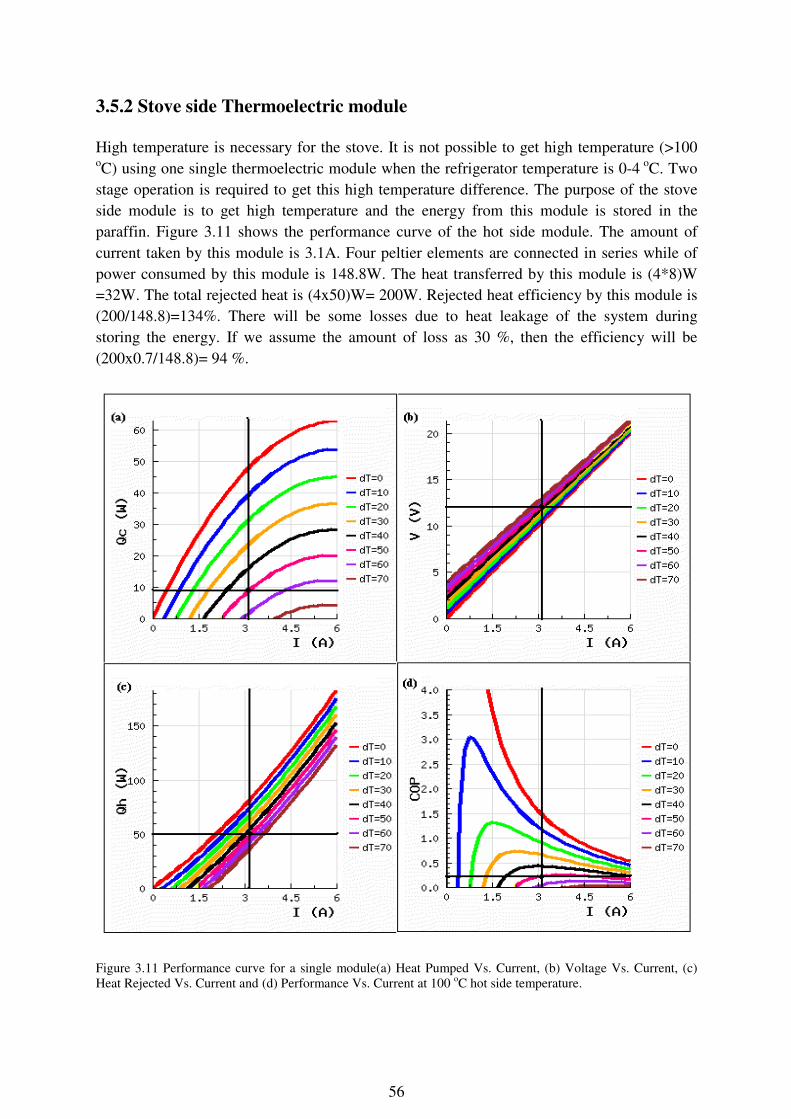
3.5.2 Stove side Thermoelectric module
High temperature is necessary for the stove. It is not possible to get high temperature (>100
oC) using one single thermoelectric module when the refrigerator temperature is 0-4
oC. Two
stage operation is required to get this high temperature difference. The purpose of the stove
side module is to get high temperature and the energy from this module is stored in the
paraffin. Figure 3.11 shows the performance curve of the hot side module. The amount of
current taken by this module is 3.1A. Four peltier elements are connected in series while of
power consumed by this module is 148.8W. The heat transferred by this module is (4*8)W
=32W. The total rejected heat is (4x50)W= 200W. Rejected heat efficiency by this module is
(200/148.8)=134%. There will be some losses due to heat leakage of the system during
storing the energy. If we assume the amount of loss as 30 %, then the efficiency will be
(200x0.7/148.8)= 94 %.
Figure 3.11 Performance curve for a single module(a) Heat Pumped Vs. Current, (b) Voltage Vs. Current, (c)
Heat Rejected Vs. Current and (d) Performance Vs. Current at 100 oC hot side temperature.
57
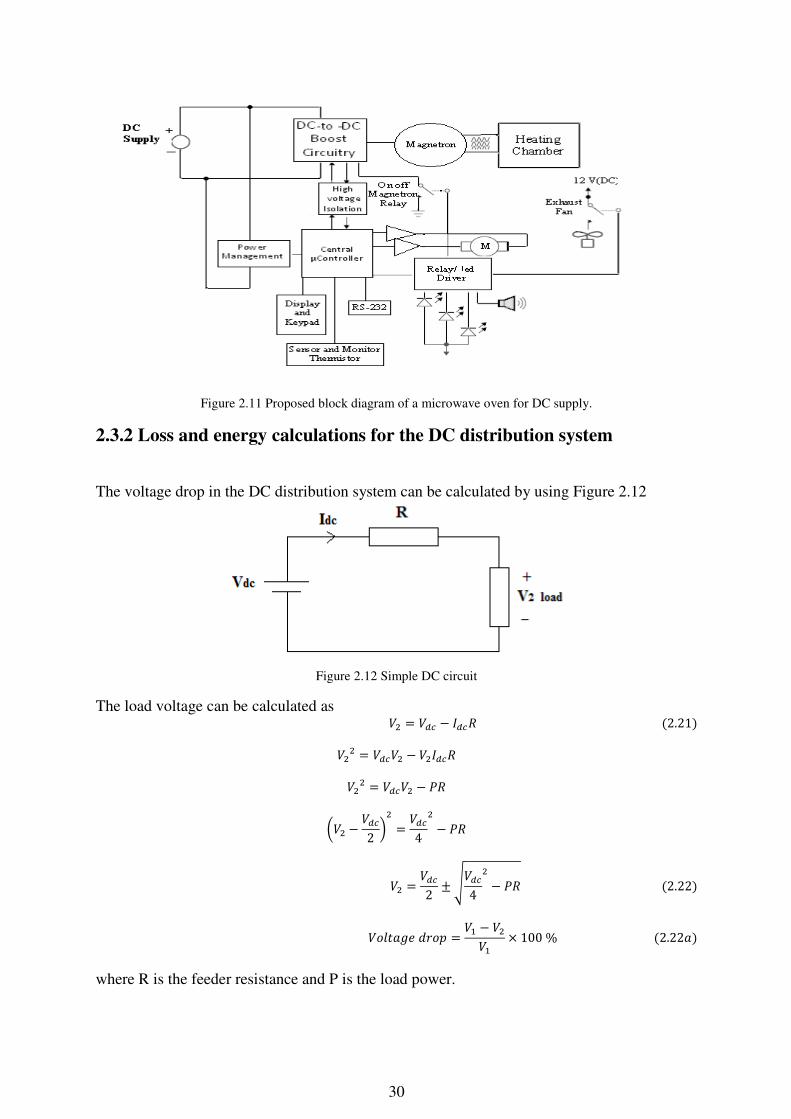
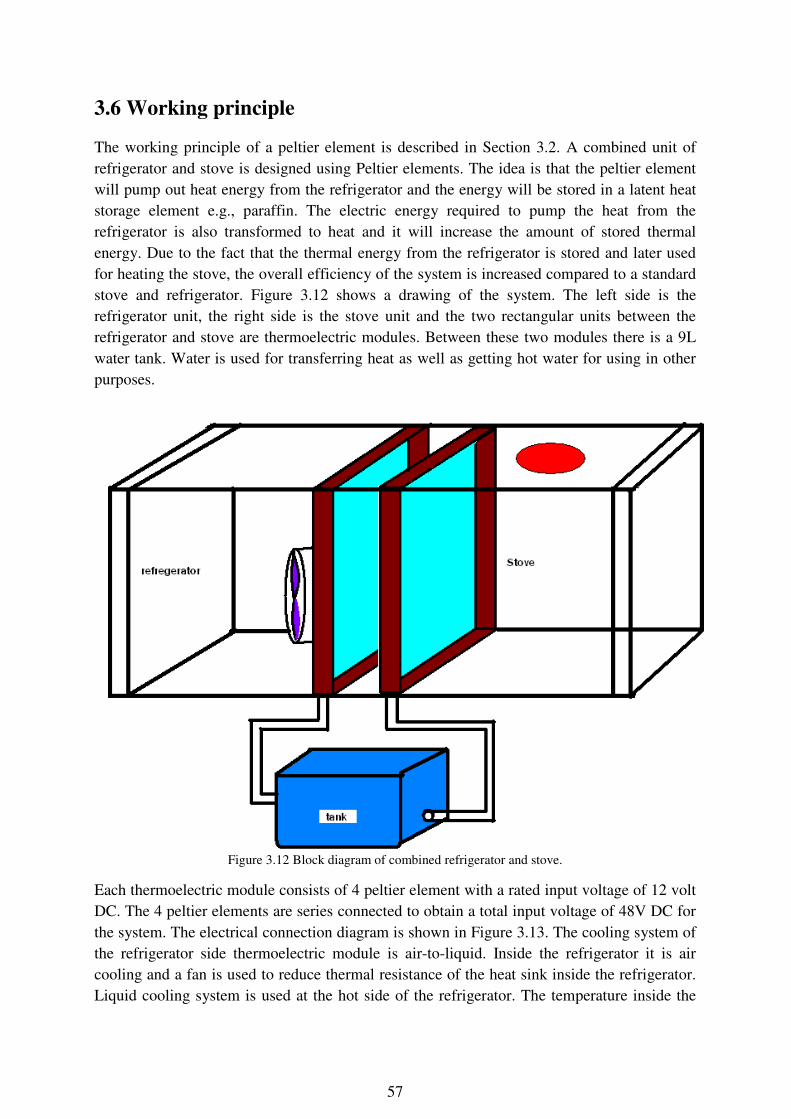
3.6 Working principle
The working principle of a peltier element is described in Section 3.2. A combined unit of
refrigerator and stove is designed using Peltier elements. The idea is that the peltier element
will pump out heat energy from the refrigerator and the energy will be stored in a latent heat
storage element e.g., paraffin. The electric energy required to pump the heat from the
refrigerator is also transformed to heat and it will increase the amount of stored thermal
energy. Due to the fact that the thermal energy from the refrigerator is stored and later used
for heating the stove, the overall efficiency of the system is increased compared to a standard
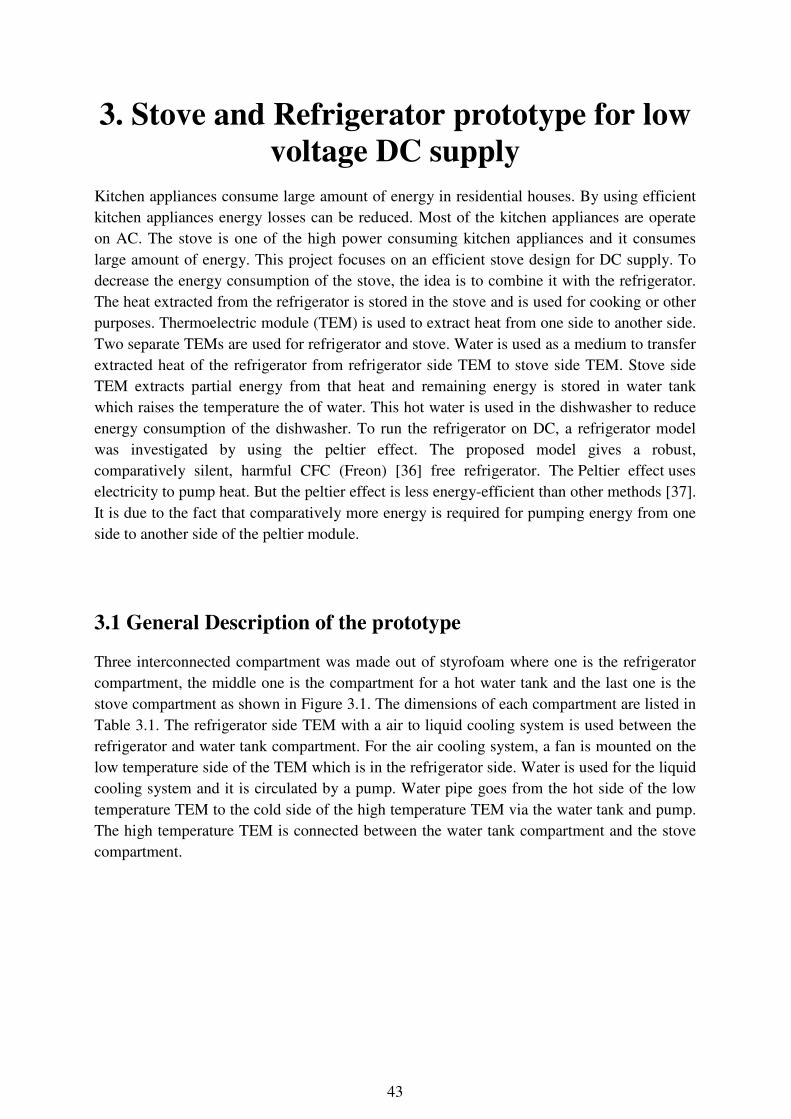
stove and refrigerator. Figure 3.12 shows a drawing of the system. The left side is the
refrigerator unit, the right side is the stove unit and the two rectangular units between the
refrigerator and stove are thermoelectric modules. Between these two modules there is a 9L
water tank. Water is used for transferring heat as well as getting hot water for using in other
purposes.
Figure 3.12 Block diagram of combined refrigerator and stove.
Each thermoelectric module consists of 4 peltier element with a rated input voltage of 12 volt
DC. The 4 peltier elements are series connected to obtain a total input voltage of 48V DC for
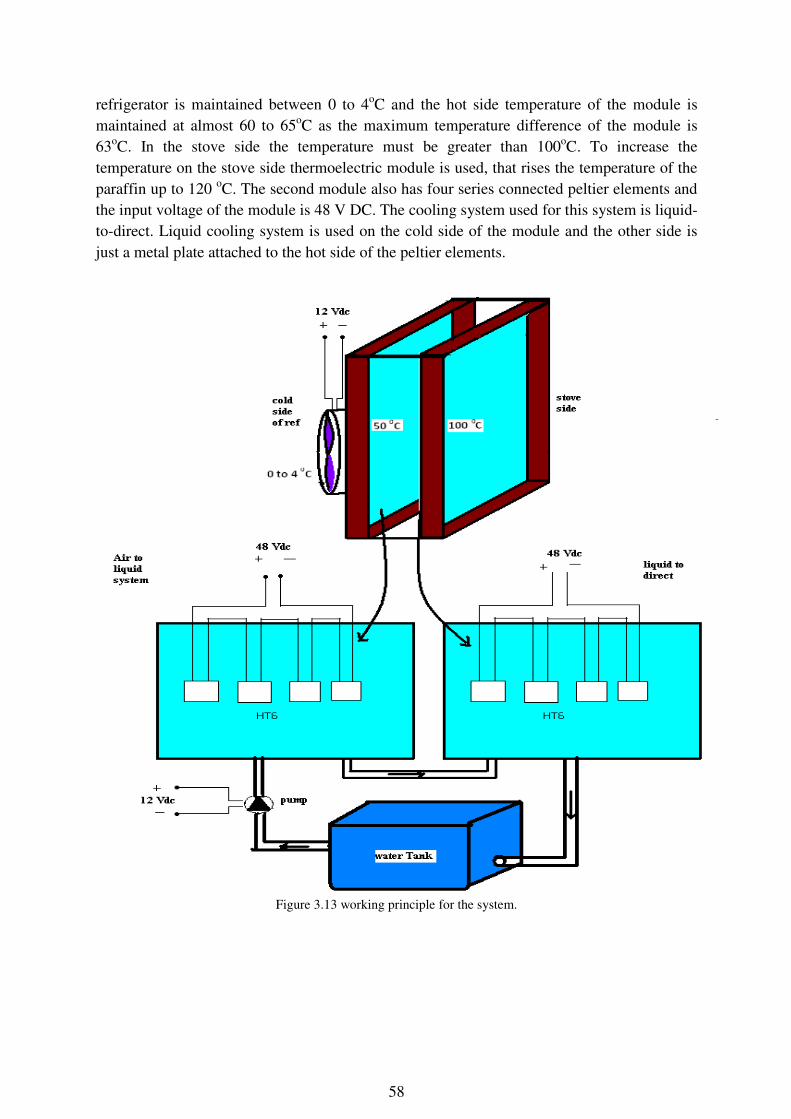
the system. The electrical connection diagram is shown in Figure 3.13. The cooling system of
the refrigerator side thermoelectric module is air-to-liquid. Inside the refrigerator it is air
cooling and a fan is used to reduce thermal resistance of the heat sink inside the refrigerator.
Liquid cooling system is used at the hot side of the refrigerator. The temperature inside the
58
refrigerator is maintained between 0 to 4oC and the hot side temperature of the module is
maintained at almost 60 to 65oC as the maximum temperature difference of the module is
63oC. In the stove side the temperature must be greater than 100
oC. To increase the
temperature on the stove side thermoelectric module is used, that rises the temperature of the
paraffin up to 120 oC. The second module also has four series connected peltier elements and
the input voltage of the module is 48 V DC. The cooling system used for this system is liquid-
to-direct. Liquid cooling system is used on the cold side of the module and the other side is
just a metal plate attached to the hot side of the peltier elements.
Figure 3.13 working principle for the system.
59
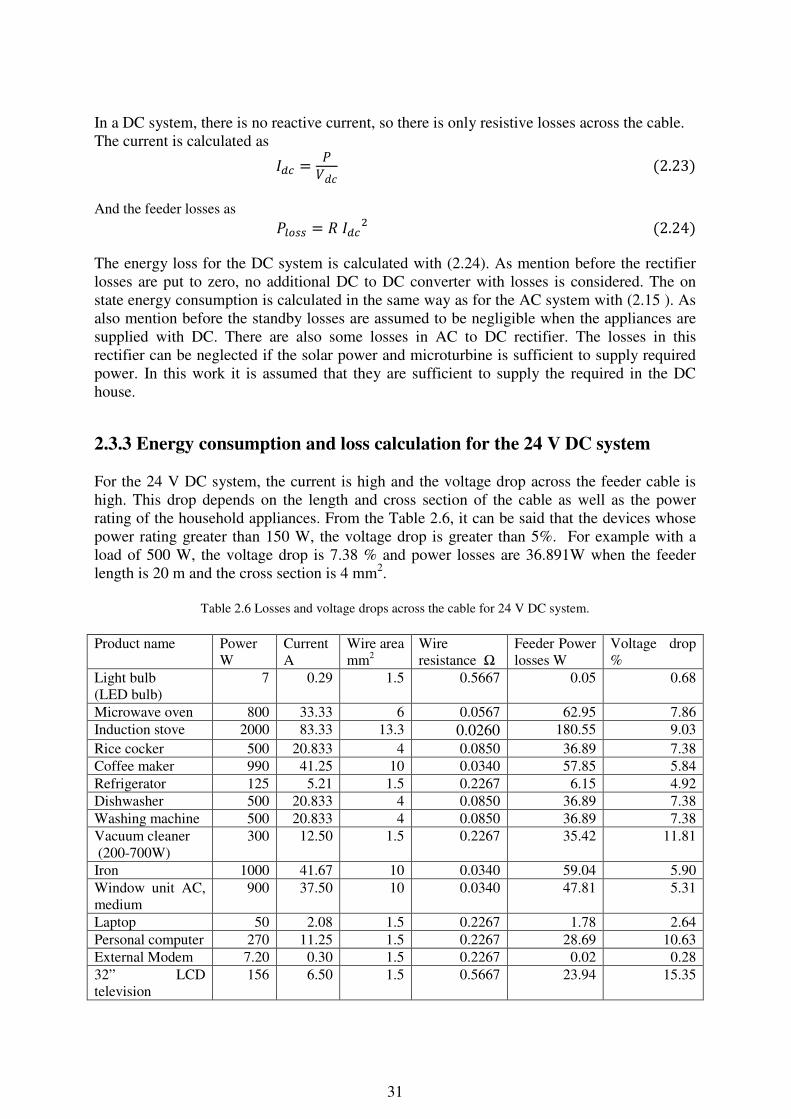
4 Experimental Results In order to analyze the performance of the designed combined stove refrigerator unit, some
experiment was performed. The experiment was done for different purpose such as
controlling the temperature (0-4 oC) of the refrigerator unit, checking the performance of the
stove unit by melting phase change material paraffin (by storing the heat energy into the
paraffin). The input voltage was 48 volt for both thermoelectric module. The total input
power of the two module was always less than 500W. For the first two experiments, 3.5 l of
water was used and later it was increased to 9 l of water as the prototype was tested together
with a dish washer which requires 9 l of water. In this chapter, the results of this experiment
are discussed. Finally, the prototype was tested together with the dishwasher from the other
group working in the same project, that runs on a low DC voltage. The peak power
consumption of the dishwasher was reduced from 2000 W to 50 W by supplying hot water
from the water tank [51]. In the end of this chapter the experiments are compared with the
measurements.
4.1 Experiment
60
4.1.1Experiment 1
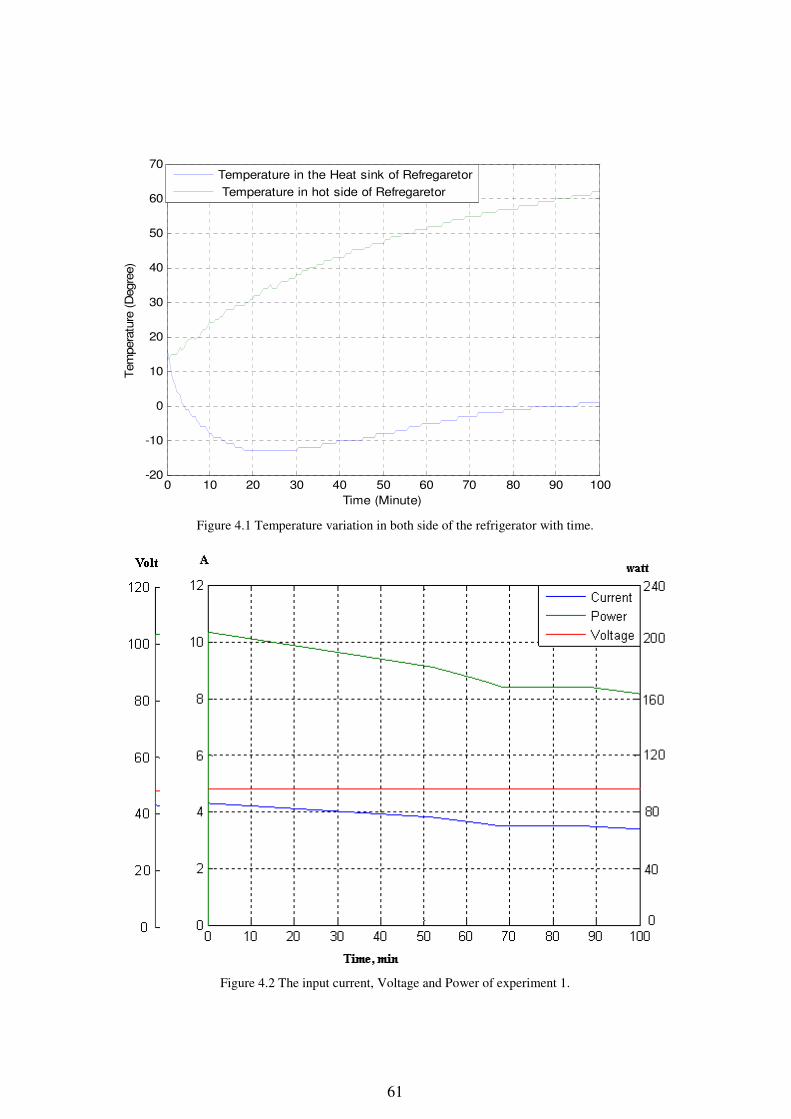
This experiment was performed to evaluate the performance of refrigerator side TEM. The
experiment started with the initial sink temperature of refrigerator side TEM at 16 ⁰C, while
initial temperature of the 3.5 L water in the water tank was 13 ⁰C. Figure 4.1 shows the
temperature of the heat sink of the refrigerator side TEM and the temperature at the hot side
of the same TEM. The sink temperature of the refrigerator side TEM took 4 minutes to go
down from 16 ⁰C to 0 ⁰C as shown in Figure 4.1. After that 18 minutes passed to reach at -13 ⁰C and maintained same temperature for 12 minutes. The sink temperature started to increase
after 30 minutes and it took 54 minutes to reach 0 ⁰C from -13 ⁰C. At the 100th
minute of the
experiment, the sink temperature was at 1 ⁰C. After reaching to a certain temperature, the sink
temperature increased with the increment of the hot side temperature of TEM. It happened to
maintain an almost constant temperature difference between the two plates of TEM. Because
at 50 ⁰C temperature difference, the module can only move almost 10 W of thermal power
and this is the same amount that is leaking into the refrigerator compartment at steady state
operation. The temperature of water increased almost linearly from 13 ⁰C to 62 ⁰C within 100
minutes of the experiment. Figure 4.2 presents the input current, voltage and power of the
thermoelectric module at the refrigerator. Initially TEM took 225 W as it has removed more
energy. The energy removed by the TEM decreased with the increment of the temperature
difference. As a consequence, the power taken by the TEM was reduced e.g., the TEM took
168 W at the instant of the 70th
minute of the experiment.
61
Figure 4.1 Temperature variation in both side of the refrigerator with time.
Figure 4.2 The input current, Voltage and Power of experiment 1.
0 10 20 30 40 50 60 70 80 90 100-20
-10
0
10
20
30
40
50
60
70
Time (Minute)
Tem
pera
ture
(D
egre
e)
Temperature in the Heat sink of Refregaretor
Temperature in hot side of Refregaretor
62
4.1.2 Experiment 2
This experiment was performed to control the temperature of the refrigerator by changing the
water in the tank. In this experiment, A bottle with 1 liter of water was kept inside the
refrigerator while the initial temperature was 15 ⁰C, there was 3.5 L of water in the water
tank which temperature was 18 ⁰C, the temperature inside the refrigerator was 17 ⁰C and the
input voltage to the TEM was 48 volt. Figure 4.3 shows the temperature on the heat sink of
the refrigerator side TEM and temperature at the hot side of the same TEM and Figure 4.4
presents the input current, voltage and power of thermoelectric modules. The temperature of
the air inside the refrigerator decreased from 18 ⁰C to 0 ⁰C within 12 minutes and it remained
between 0 ⁰C to -1 ⁰C for 23 minutes. The module consumed 192 W at the instant of 12
minutes. In the mean time, water temperature in the water increased from 19⁰C to 50 ⁰C. The
Stove side TEM was supplied by 48 V DC at the instant of the 35th
minute of the experiment
when the temperature of tank water reached to 50 ⁰C. At the 61st minute, the hot water of 68 ⁰C temperature in the tank was replaced by cold water. The hot water was taken to be used in
other purposes such as in the dishwasher.
After the high temperature thermoelectric module was supplied with DC power, the air
temperature inside the refrigerator remained within 0 ⁰C to 4 ⁰C for almost 30 minutes. The
temperature of the circulating water increased from 50 ⁰C to 69 ⁰C at the same time. The
water temperature was reduced to 46 ⁰C by pouring cold water from the tap and taking same
amount of water out of the tank. The breaking point in the curve is showing the time instant
of replacing the tank water. The air temperature inside the refrigerator again started to
decrease and maintained its temperature between 0 ⁰C to 4 ⁰C for 35 minutes more. Initial
power taken by the refrigerator side TEM was 225 W at 0 ⁰C temperature difference and
decreased to 190 W while the temperature difference reached to almost 50 ⁰C. After the stove
side TEM was supplied by 48 V DC, the total power taken by the both TEM was 384 W and
it reduced to almost 300 W at 100th
minute with the increment of the temperature difference
and the temperature of the stove module was 131 ⁰C.
63
Figure 4.3 Temperature variation in both the cold side and hot side of the low temperature thermoelectric
module.
Figure 4.4 The input current, Voltage and Power of experiment 2.
0 10 20 30 40 50 60 70 80 90 100-10
0
10
20
30
40
50
60
70
80
Time (Minute)
Tem
pera
ture
(D
egre
e)
Temperature in inside the Refregaretor
Temperature in hot side of Refregaretor
64
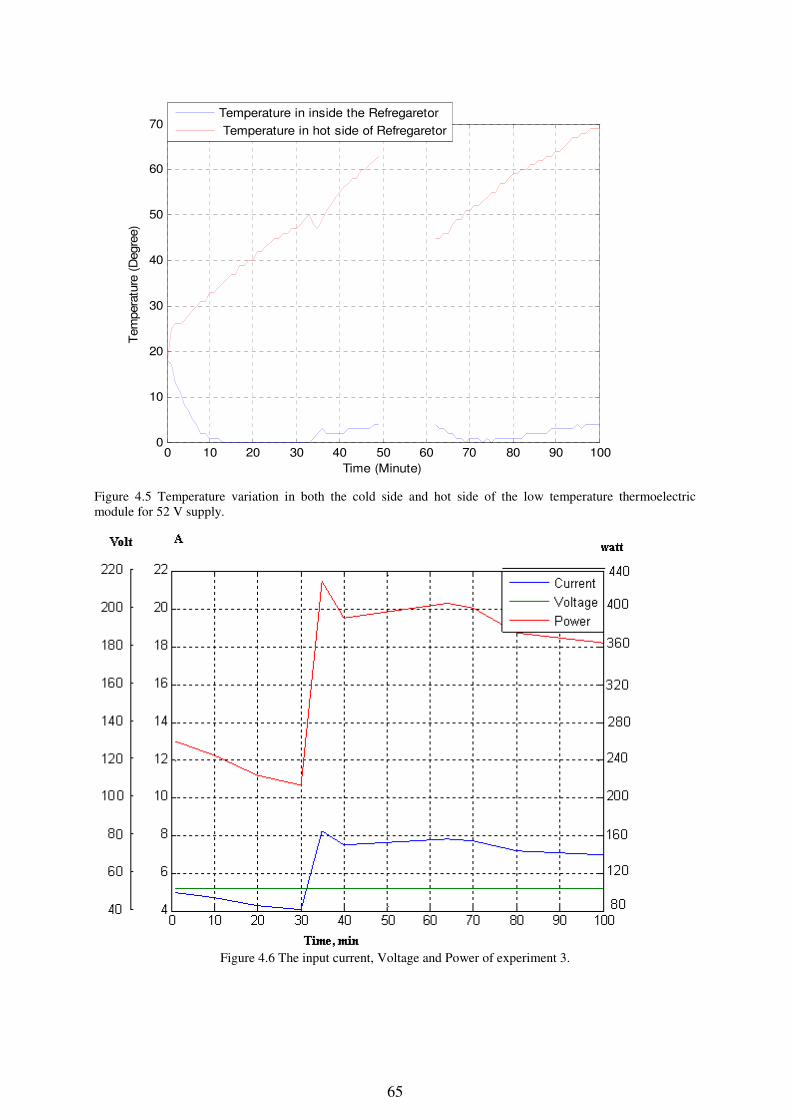
4.1.3 Experiment 3
This experiment was performed to evaluate the performance of both modules when supplied
with 52V DC. In this experiment, two bottles with total 1.5 l of water was kept inside the
refrigerator at an initial temperature of 20⁰C, the initial temperature inside the refrigerator was 18 ⁰C and the temperature of the tank water was 18 ⁰C. Figure 4.5 shows the temperature of the
heat sink in the refrigerator and the temperature at the hot side of the refrigerator side TEM.
Figure 4.6 presents the input current, voltage and power of thermoelectric modules. The
temperature of the air inside the refrigerator felt down from 17 ⁰C to 0 ⁰C within 13 minutes
and it remained at 0 ⁰C for 20 minutes from the instant of the 13th
minute to 33rd
minute. In
the mean time, the water temperature increased from 25⁰C to 50 ⁰C. The stove side TEM was
supplied by 52 V DC supply at the instant of the 33th minute of the experiment, when the
temperature at cold side of that module reached to almost 50 ⁰C. After the high temperature
TEM was supplied with DC power, the air temperature inside the refrigerator started to
increase and reached to 4 ⁰C within almost 19 minutes. It happened due to the fact that the
amount of extracted heat was less than the amount of leakage heat entered into the
refrigerator. In the mean time, the water temperature increased from 50 ⁰C to 63 ⁰C. The hot
water of 62 ⁰C temperature in the tank was replaced by cold water at the instant of 49th minute
and the water temperature inside the tank was reduced to 45 ⁰C. The discontinuous line on the
graph of Figure 4.5 shows the time instant of the water replacement which is from the 49th
minute to the 62nd
minute. The air temperature inside the refrigerator again started to decrease
and maintained its temperature between 0 ⁰C to 4 ⁰C for more 40 minutes. The initial power
taken by the refrigerator side TEM was 260W at 0 ⁰C temperature difference and it decreased
to almost 215W when the temperature difference reached almost 50 ⁰C. The temperature at
the stove side module was 141 ⁰C in steady state. The total power taken by the both TEMs
was 429W initially at 33rd
minute and it reduced to almost 360W at the 100th
minute due to
the increment of the temperature difference.
65
Figure 4.5 Temperature variation in both the cold side and hot side of the low temperature thermoelectric
module for 52 V supply.
Figure 4.6 The input current, Voltage and Power of experiment 3.
0 10 20 30 40 50 60 70 80 90 1000
10
20
30
40
50
60
70
Time (Minute)
Tem
pera
ture
(D
egre
e)
Temperature in inside the Refregaretor
Temperature in hot side of Refregaretor
66
4.1.4 Experiment 4
This experiment was performed to evaluate the performance of the stove side TEM. In this
experiment, there was no water inside the refrigerator. Initially the refrigerator side TEM was
supplied by 48 V DC, stove tank was filled with 7 kg of paraffin, the temperature of the air
inside the refrigerator was 17 ⁰C, the temperature of the heat sink of the refrigerator side
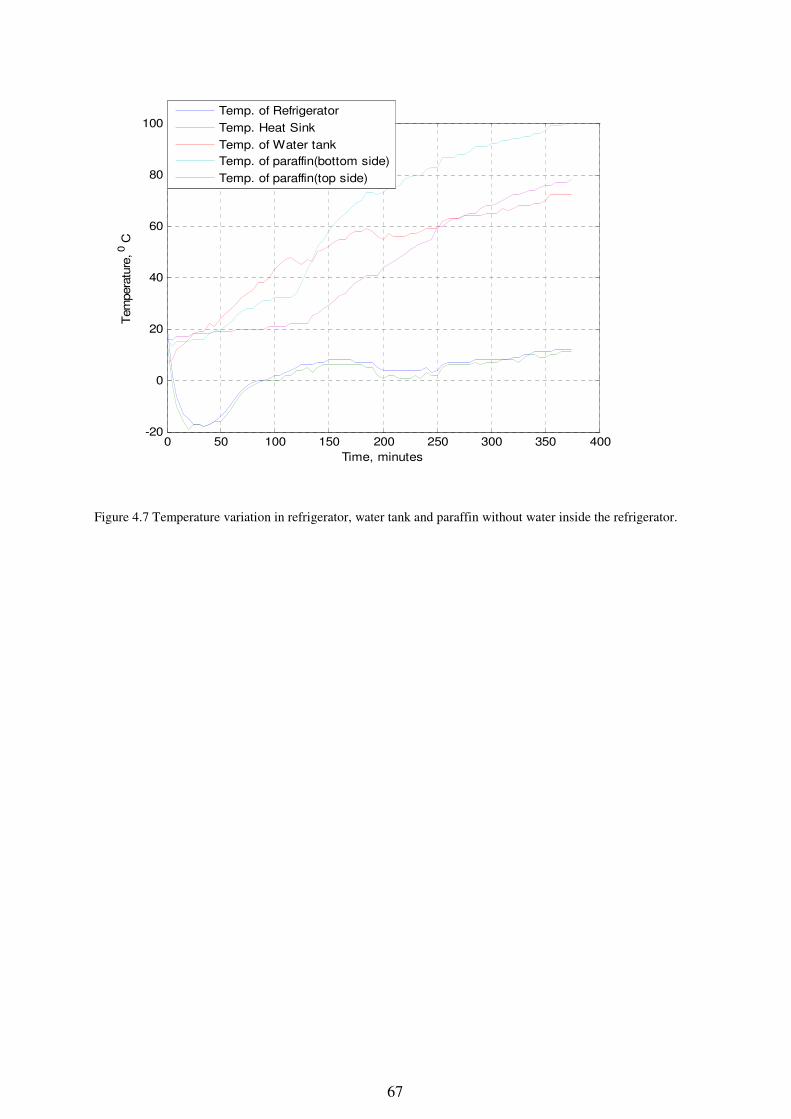
TEM was 15 ⁰C and the temperature of the 9 l tank of water was 7 ⁰C. Figure 4.7 shows the
temperatures of the refrigerator, water tank and paraffin for this experiment. The temperature
of the air inside the refrigerator decreased from 17 ⁰C to 0 ⁰C within 6 minutes and it was
further reduced to -18 ⁰C at the 32nd
minute of the experiment when the temperature of the
water in the water tank was at 31 ⁰C. This means that the hot side temperature of the TEM is
almost 32 ⁰C. After this point, the refrigerator temperature started to increase with the
increment of hot side temperature in order to maintain a constant temperature difference of 50
⁰C between both side of the TEM as it is designed. The refrigerator air temperature reached to
0 ⁰C from -18 ⁰C after 60 minutes and in the mean time, the water tank temperature was
increased to 41 ⁰C. The refrigerator temperature increased faster than the increment of the
water tank temperature. This because of the high temperature difference between the
refrigerator temperature and the surrounding room temperature, the leakage of thermal energy
from the surroundings to the refrigerator was larger. The stove side TEM was supplied by 48
V DC at the 116th
minute of the experiment when the temperature of the water tank reached to
50 ⁰C. As mentioned before, the aluminum stove tank was filled up with 7 kg paraffin for this
experiment. The hot side temperature of the stove TEM took 254 minutes to increase the
temperature from 30 ⁰C to 100 ⁰C and in the mean time the temperature of the water tank
increases from 48 ⁰C to 72 ⁰C. The temperature gradient inside the paraffin is clear from the
two curves of top paraffin temperature and bottom paraffin temperature as shown in Figure
4.7. The curve is showing larger temperature gradient and it is due to the fact that the paraffin
has low heat conductivity of 0.2Wm-1
k-1
.
67
Figure 4.7 Temperature variation in refrigerator, water tank and paraffin without water inside the refrigerator.
0 50 100 150 200 250 300 350 400-20
0
20
40
60
80
100
Time, minutes
Tem
pera
ture
, 0 C
Temp. of Refrigerator
Temp. Heat Sink
Temp. of Water tank
Temp. of paraffin(bottom side)
Temp. of paraffin(top side)
68
4.1.5 Experiment 5
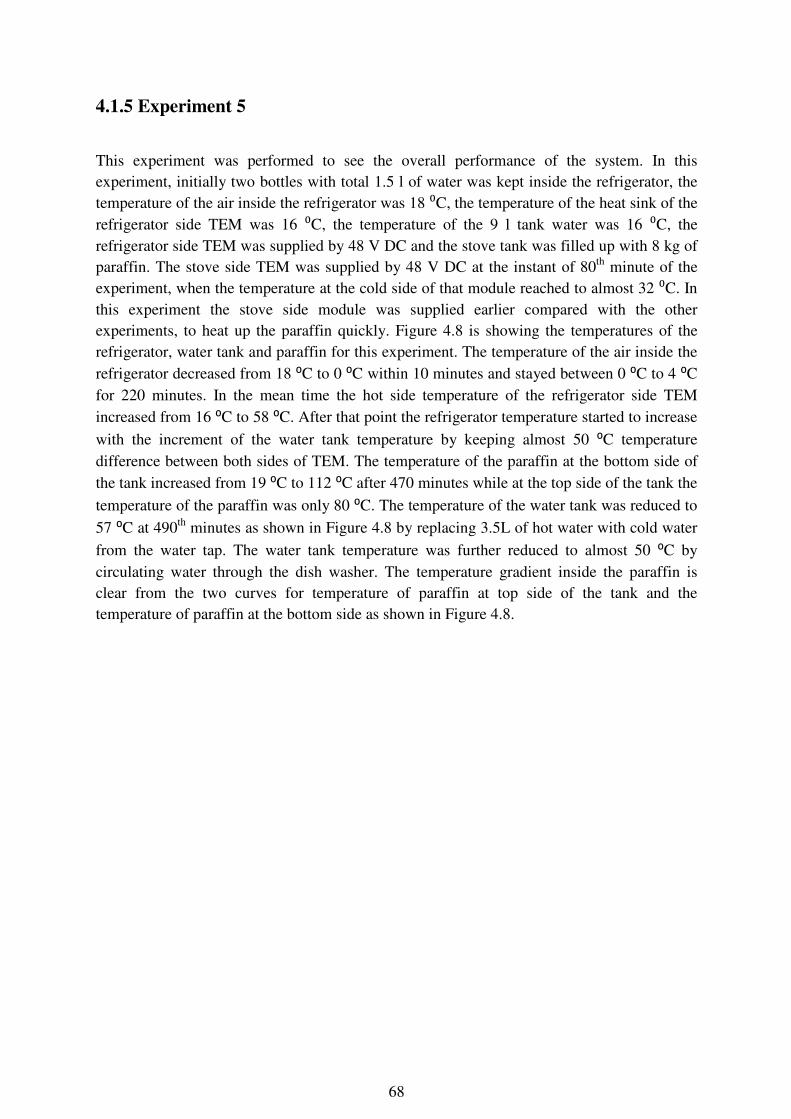
This experiment was performed to see the overall performance of the system. In this
experiment, initially two bottles with total 1.5 l of water was kept inside the refrigerator, the
temperature of the air inside the refrigerator was 18 ⁰C, the temperature of the heat sink of the
refrigerator side TEM was 16 ⁰C, the temperature of the 9 l tank water was 16 ⁰C, the
refrigerator side TEM was supplied by 48 V DC and the stove tank was filled up with 8 kg of
paraffin. The stove side TEM was supplied by 48 V DC at the instant of 80th
minute of the
experiment, when the temperature at the cold side of that module reached to almost 32 ⁰C. In
this experiment the stove side module was supplied earlier compared with the other
experiments, to heat up the paraffin quickly. Figure 4.8 is showing the temperatures of the
refrigerator, water tank and paraffin for this experiment. The temperature of the air inside the
refrigerator decreased from 18 ⁰C to 0 ⁰C within 10 minutes and stayed between 0 ⁰C to 4 ⁰C
for 220 minutes. In the mean time the hot side temperature of the refrigerator side TEM
increased from 16 ⁰C to 58 ⁰C. After that point the refrigerator temperature started to increase
with the increment of the water tank temperature by keeping almost 50 ⁰C temperature
difference between both sides of TEM. The temperature of the paraffin at the bottom side of
the tank increased from 19 ⁰C to 112 ⁰C after 470 minutes while at the top side of the tank the
temperature of the paraffin was only 80 ⁰C. The temperature of the water tank was reduced to
57 ⁰C at 490th
minutes as shown in Figure 4.8 by replacing 3.5L of hot water with cold water
from the water tap. The water tank temperature was further reduced to almost 50 ⁰C by
circulating water through the dish washer. The temperature gradient inside the paraffin is
clear from the two curves for temperature of paraffin at top side of the tank and the
temperature of paraffin at the bottom side as shown in Figure 4.8.
69
Figure 4.8 Temperature variation in refrigerator, water tank and paraffin with water inside the refrigerator.
0 100 200 300 400 500 600-20
0
20
40
60
80
100
120
Time, minutes
Tem
pera
ture
, 0 C
Temp. of Refrigerator
Temp. Heat Sink
Temp. of Water tank
Temp. of paraffin(top side)
Temp. of paraffin(bottom side)
70
4.2 Comparison between theoretical and experimental result
In this section the theoretical calculations for the TEMs, presented in section 3.5 are
compared with the measurements presented in section 4.1. For the refrigerator side TEM
experiment 2 is used and the measured values for this experiment are shown in Figure 4.3
and Figure 4.4.
The inner volume of the refrigerator is 0.26x0.38x0.20=0.01976 m3. From experiment 2, the
temperature of the refrigerator reduces from 18 °C to 0 °C within 12 minutes. And the
temperature of the 1 liter water decreases from 18 °C to 6 °C, see Figure 4.3. At 20 °C and
101.325 kPa, dry air density is 1.2041 kg/m3
[49]. The Specific heat of dry air is 1.012
J·g−1
·K−1
[50]. The amount of air inside the refrigerator is 0.01976 m3
x 1.2041 kg/m3 =
0.023793 Kg = 23.793 g and the removed energy from this air is 23.793 g x 1.012 J·g−1
·K−1
x
(18-0) K = 433.41 J. The specific heat of the water is 4.186 kJ. kg−1
·K−1
[50]. The amount of
energy removed from the water is 1kg x 4.186 kJ. kg
−1·K
−1 x (18-6) K = 50.232 kJ= 50232 J.
The specific heat of the aluminum is 0.91 kJ. kg−1
·K−1
[50]. The weight of the heat sink used
with the refrigerator side TEM is 0.5 kg. The temperature of the heat sink decreases from 18
°C to -2 °C during the same interval of 12 minutes. The amount of energy removed from the
heat sink is 0.5kg x 0.91 kJ. kg−1
·K−1
x (18-(-2)) K = 9.1 kJ = 9100 J. Total amount of heat
removed from the heat sink, air and the water is 9100 J + 433.41 J + 50232 J=59765.41J.
The average input power to the refrigerator TEM is 208W for the first 12 minutes. The input
energy during this period of 12 minutes is 208 J.s-1
x (12 x 60)s = 149760 J.
The efficiency of the refrigerator side TEM as a refrigerator is 59765.41/149460=39.9%.
This module rises the temperature of the tank water from 19°C to 35°C within 12 minutes.
The amount of energy absorbed by the water is 3.5 kg x 4.186 kJ. kg−1
·K−1
x (35-19) K =
234.416 kJ= 234,416 J. This energy higher than the sum of electrical energy and the extracted
energy from the heat sink, air and the water. It is due to the fact that the energy extracted from
the aluminum body of the TEM and the metal part of the mounted fan are not considered.
The efficiency of this module in heating mode is 234,416J/149,760J = 162%.
For the stove side TEM experiment, experiment 5 is used for the comparison with the theory.
The amount of paraffin used in experiment 5 is 7 kg. The temperature rises from 22 °C to 43
°C within 30 minutes as can be seen in Figure 4.8. During this period between 65th
minute
and 95th
minute, the average input power was 233 W. The specific heat of the paraffin is 2.5
kJ·kg−1
·K−1
[50]. The amount of energy stored in the paraffin is 7 x 2.5 kJ·kg−1
·K−1
x(43-22)
= 367 kJ. The amount of energy taken by the stove side TEM within this period is 233 J.s-1
x
(30 x 60) s =419,400 J =419 kJ.
The efficiency of the stove side TEM is 367kJ/419kJ = 87.6%.
71
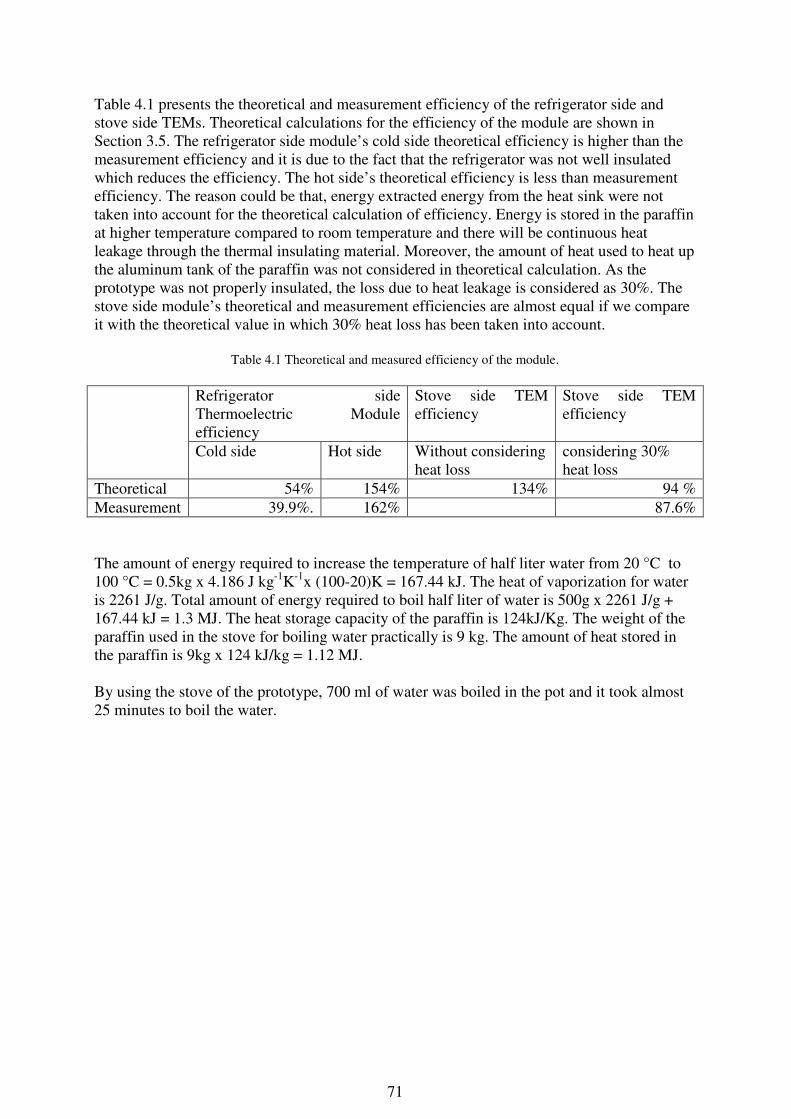
Table 4.1 presents the theoretical and measurement efficiency of the refrigerator side and
stove side TEMs. Theoretical calculations for the efficiency of the module are shown in
Section 3.5. The refrigerator side module’s cold side theoretical efficiency is higher than the
measurement efficiency and it is due to the fact that the refrigerator was not well insulated
which reduces the efficiency. The hot side’s theoretical efficiency is less than measurement
efficiency. The reason could be that, energy extracted energy from the heat sink were not
taken into account for the theoretical calculation of efficiency. Energy is stored in the paraffin
at higher temperature compared to room temperature and there will be continuous heat
leakage through the thermal insulating material. Moreover, the amount of heat used to heat up
the aluminum tank of the paraffin was not considered in theoretical calculation. As the
prototype was not properly insulated, the loss due to heat leakage is considered as 30%. The
stove side module’s theoretical and measurement efficiencies are almost equal if we compare
it with the theoretical value in which 30% heat loss has been taken into account.
Table 4.1 Theoretical and measured efficiency of the module.
Refrigerator side
Thermoelectric Module
efficiency
Stove side TEM
efficiency
Stove side TEM
efficiency
Cold side Hot side Without considering
heat loss
considering 30%
heat loss
Theoretical 54% 154% 134% 94 %
Measurement 39.9%. 162% 87.6%
The amount of energy required to increase the temperature of half liter water from 20 °C to
100 °C = 0.5kg x 4.186 J kg-1
K-1
x (100-20)K = 167.44 kJ. The heat of vaporization for water
is 2261 J/g. Total amount of energy required to boil half liter of water is 500g x 2261 J/g +
167.44 kJ = 1.3 MJ. The heat storage capacity of the paraffin is 124kJ/Kg. The weight of the
paraffin used in the stove for boiling water practically is 9 kg. The amount of heat stored in
the paraffin is 9kg x 124 kJ/kg = 1.12 MJ.
By using the stove of the prototype, 700 ml of water was boiled in the pot and it took almost
25 minutes to boil the water.
72
4.3 Theoretical Calculation for large scale model of refrigerator
For the calculation large scale model, a standard size of refrigerator with 167.6cm height,
83.82cm width and 81.28cm length has been taken into consideration. The inner volume of
the refrigerator = 1.15 m3. The weight of the air inside the refrigerator is 1.15 m
3 * 1.2Kg/m
3
= 1.38Kg = 1380g. To cool down the refrigerator from 18⁰C to 0⁰C, the amount of energy
that needs to be removed from the air is 1380g * 1.012 J·g−1
·K−1
* (18-0) K = 25.1 kJ
If we consider that one water bottle of 1 liter is kept inside the refrigerator, then the amount of
energy required to be removed to cool down it from 18⁰C to 0⁰C is 1kgx4.186 kJ. kg−1
·K−1
x(18-0) K = 75.6 kJ. A heat sink is attached with the refrigerator side TEM. The TEM will
extract heat from the heat sink and the heat sink will cool down from 18⁰C to -2⁰C. The
amount of energy removed from the heat sink is 0.5kg x 0.91 kJ. kg−1
·K−1
x (18-(-2)) K = 9.1
kJ. The total energy that needs to be removed in this case is (25.1+75.6+9.1) kJ =109.8kJ
From the calculation of Section 4.2, we found that the refrigerator side TEM took 12 minutes
to remove 59.8 kJ of energy from the refrigerator. Therefore, the time required to remove
109.8 kJ energy by the same TEM will be = 22 minutes.
The average power taken by the module is 208W in this case and the total energy taken by the
refrigerator side TEM during this 24 minutes is 208J/s * 22 * 60 s = 275kJ
The efficiency of the TEM to work as refrigerator = 109.8kJ/275kJ = 39.9 %.
73
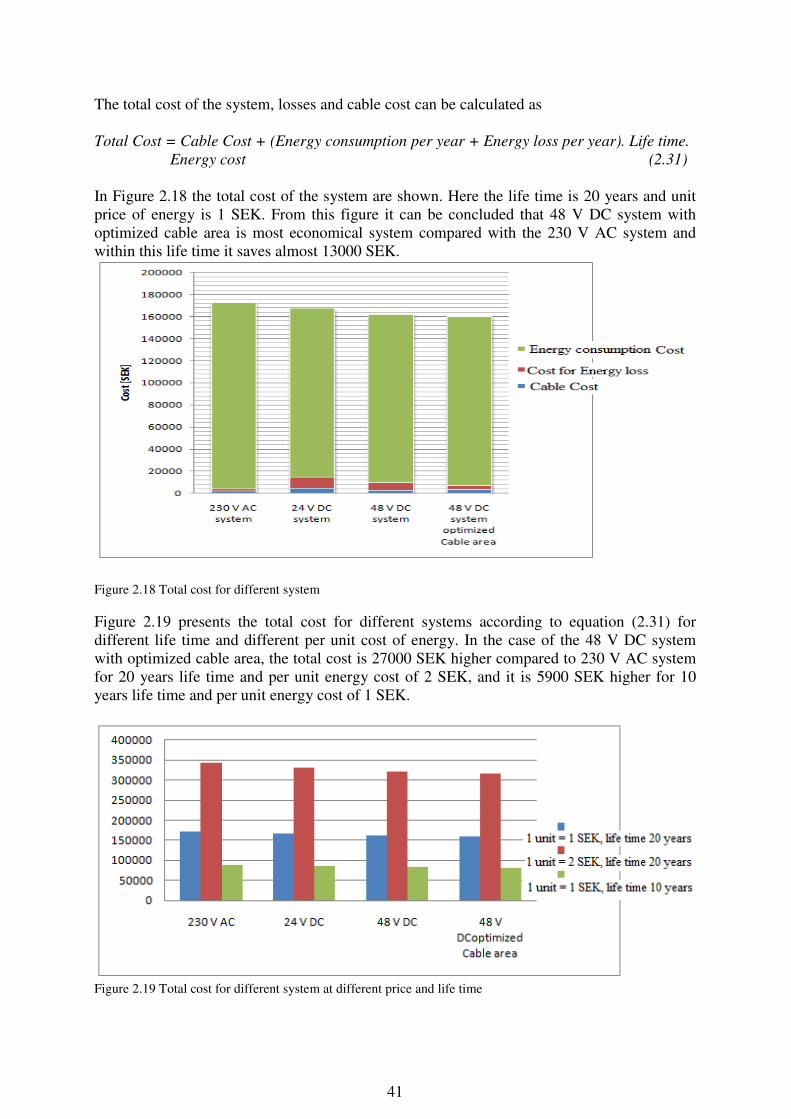
5 Conclusion
This report investigates the alternative for household appliances of using a 48 V DC supply,
instead of the normal 230 V AC voltage. The losses for AC to DC and DC to AC conversion
inside the home appliances can be reduced by using a DC distribution system in the house.
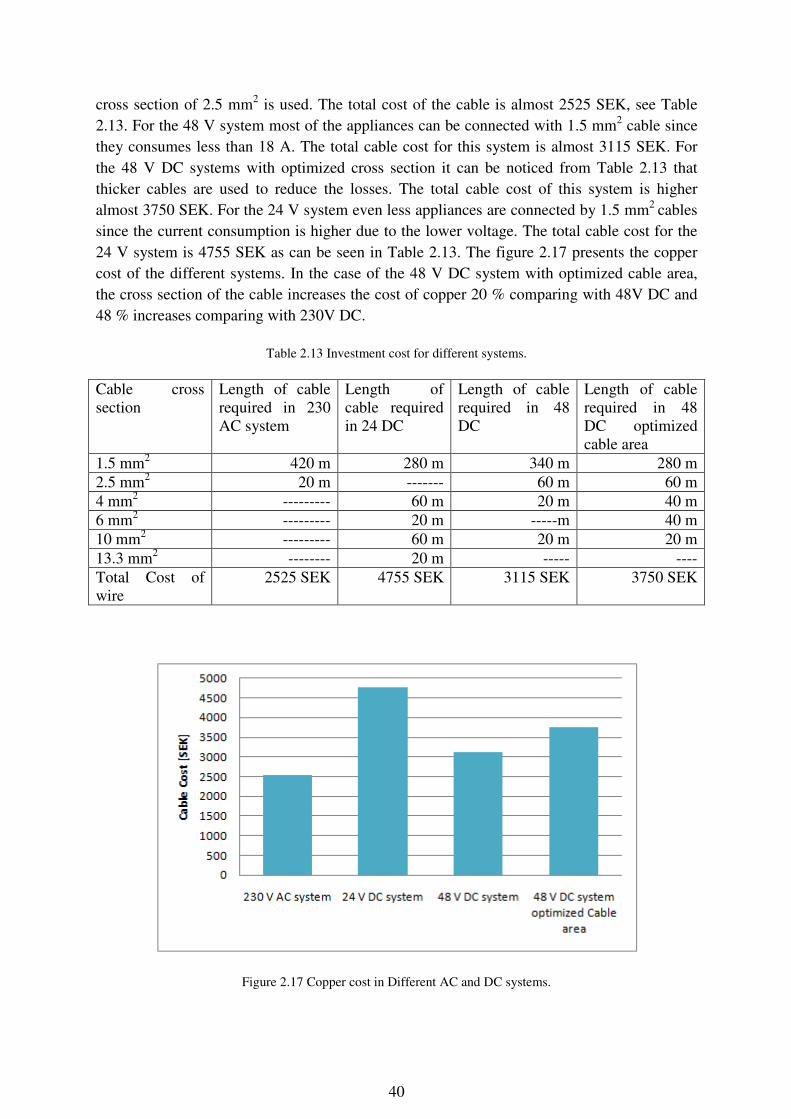
For the wiring of the 48 V DC distribution system with optimized cable area, the cable cost
will increase by 48% compared to the cable cost for 230 V AC distribution system. But the
savings for the 48 V DC system will be higher in the long run due to reduced energy
consumption per year. This work considered a 20 years life span for the calculation of the
total cost for the different distribution systems. The savings in the total cost for the 48 V DC
distribution system with optimized cable area compared to the 230 V AC distribution system,
will be almost 13000 SEK within the 20 years life time.
In case of a low voltage DC distribution system, there is a problem of high power loss in the
cable for the high power consuming loads. The stove is one of the high power consuming
kitchen appliances and it consumes large amount of energy. This project focuses on an
efficient stove design for DC supply. To decrease the energy consumption of the stove, the
idea is to combine it with the refrigerator. The heat extracted from the refrigerator is stored in
the stove and is used for cooking or other purposes. Some portion of the extracted heat is
stored in the water tank which can be used for different purposes such as for a dishwasher.
This technique of storing the extracted heat, increased the overall efficiency of the system.
The practical efficiency of storing the extracted heat in the water is 162 %, where the
theoretical efficiency is 154% and theoretical efficiency was calculated without considering
the heat extracted from the heat sink. The efficiency of storing heat in the paraffin of the
stove is 87.6%, where the theoretical efficiency is 94% after considering a 30% loss in the
system due to weak thermal insulation. The practical efficiency of the refrigerator using TEM
is 39.9%, where the theoretical efficiency is 54%. The average power taken by the
refrigerator side TEM is 208 W. The maximum power taken by the both TEM of the
prototype unit is 384 W. It can be concluded that the practical results from the experiments
are reasonable compared to theoretical results if the losses in the system are taken into
account.
The prototype was tested together with a dishwasher of the other group in the same project
and it runs on 48V DC supply as well. The hot water from the water tank was supplied to the
dishwasher and the energy consumption of the dishwasher was reduced to less than one tenth
of normal power consumption.
Due to the fact that the thermal energy from the refrigerator is stored and later used for
heating the stove, the overall efficiency of the system is increased compared to a standard
stove and refrigerator. To implement the proposed design practically, more research is
recommended for improvement of the insulation system, to improve the efficiency of the
whole system. More analysis is required to make the TEM more efficient for extracting
74
energy and to make the unit cheaper. Design of automatic control system is also
recommended for the proposed system.
75
References
[1] http://eetd.lbl.gov/ea/nordman/docs/lvdc7.pdf (accessed on 25th/07) [2] http://www.powerpulse.net/techPaper.php?paperID=130