6
MOBILE COMMERCE INDEX FEBRUARY 2015 BRANDING BRAND brandingbrand.com
| Date post: | 06-Aug-2015 |
| Category: |
Mobile |
| Upload: | branding-brand |
| View: | 115 times |
| Download: | 0 times |

MOBILE COMMERCE INDEX
FEBRUARY 2015
BRANDING BRAND
brandingbrand.com
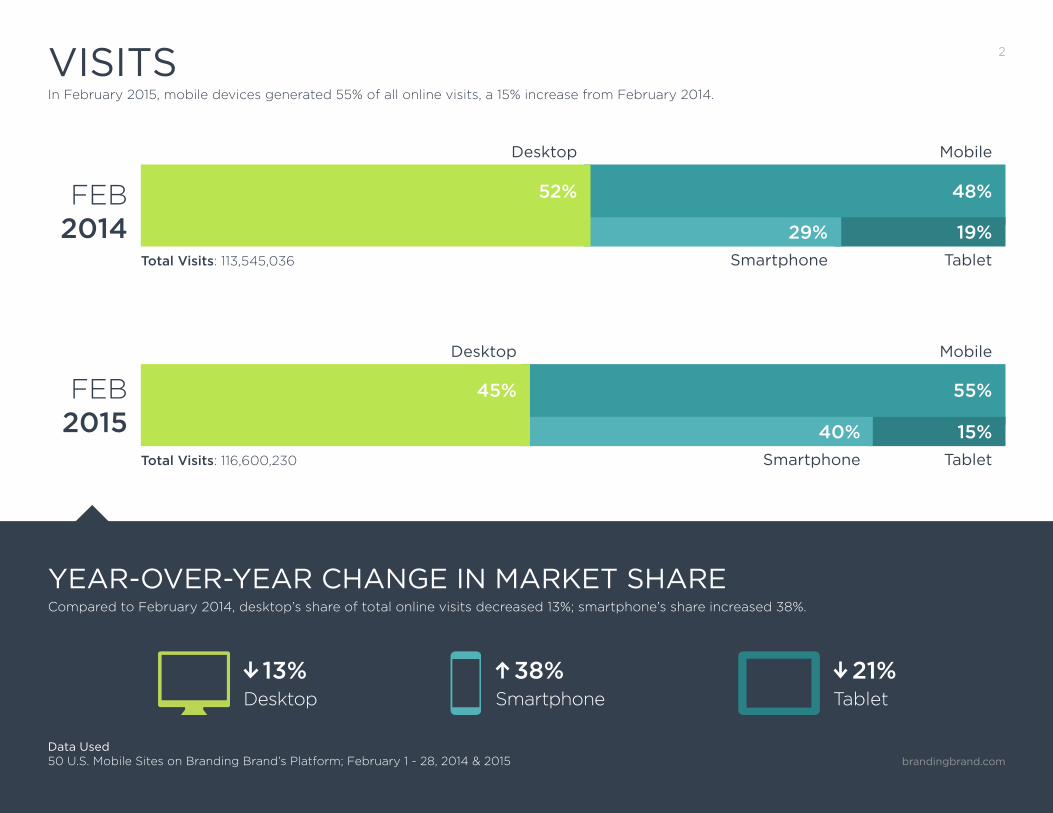
2VISITSIn February 2015, mobile devices generated 55% of all online visits, a 15% increase from February 2014.
FEB2014 29%
48%
19%
Mobile
TabletSmartphoneTotal Visits: 113,545,036
52%
Desktop
40%
55%
15%
Mobile
TabletSmartphoneTotal Visits: 116,600,230
FEB2015
45%
Desktop
Compared to February 2014, desktop’s share of total online visits decreased 13%; smartphone’s share increased 38%.
YEAR-OVER-YEAR CHANGE IN MARKET SHARE
Data Used50 U.S. Mobile Sites on Branding Brand’s Platform; February 1 - 28, 2014 & 2015
Desktop
13%Tablet
21%Smartphone
38%
brandingbrand.com
brandingbrand.com
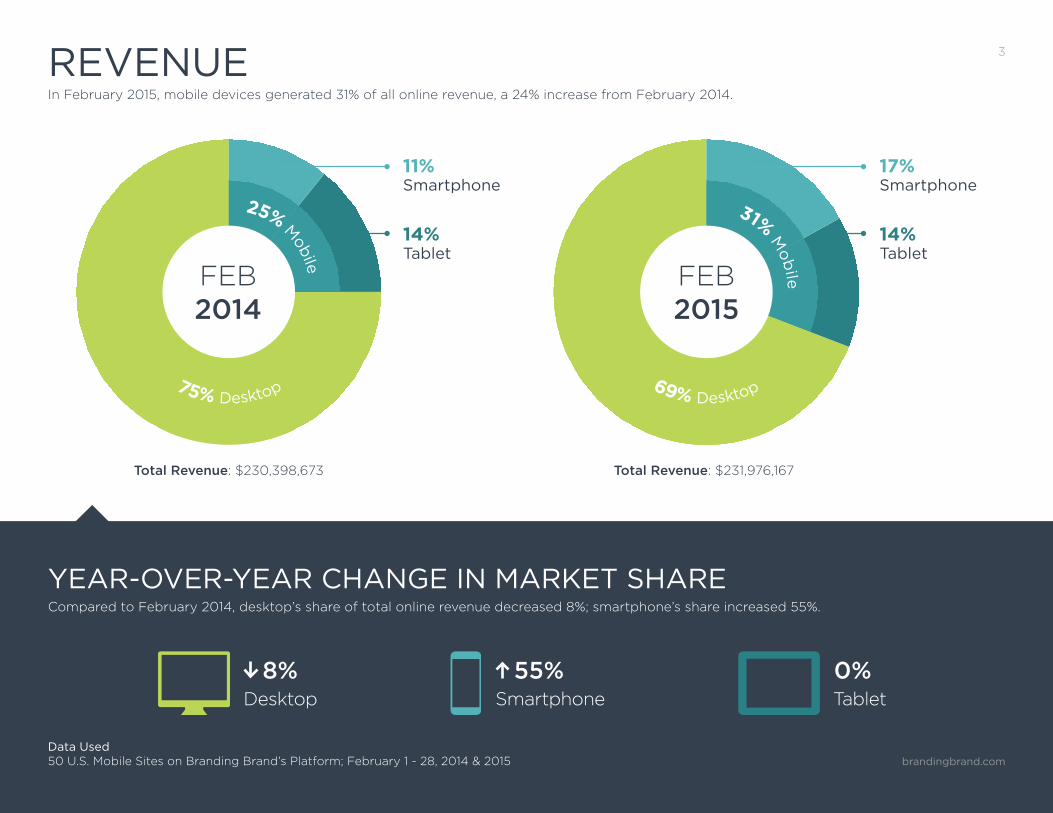
REVENUE 3
In February 2015, mobile devices generated 31% of all online revenue, a 24% increase from February 2014.
Compared to February 2014, desktop’s share of total online revenue decreased 8%; smartphone’s share increased 55%.
YEAR-OVER-YEAR CHANGE IN MARKET SHARE
Desktop
8%Tablet
0%Smartphone
55%
Total Revenue: $230,398,673
75% Desktop
25% M
obile
FEB2014
11%Smartphone
Total Revenue: $231,976,167
69% Desktop
31%
Mob
ileFEB2015
17%Smartphone
Tablet14%
Tablet14%
Data Used50 U.S. Mobile Sites on Branding Brand’s Platform; February 1 - 28, 2014 & 2015 brandingbrand.com
4
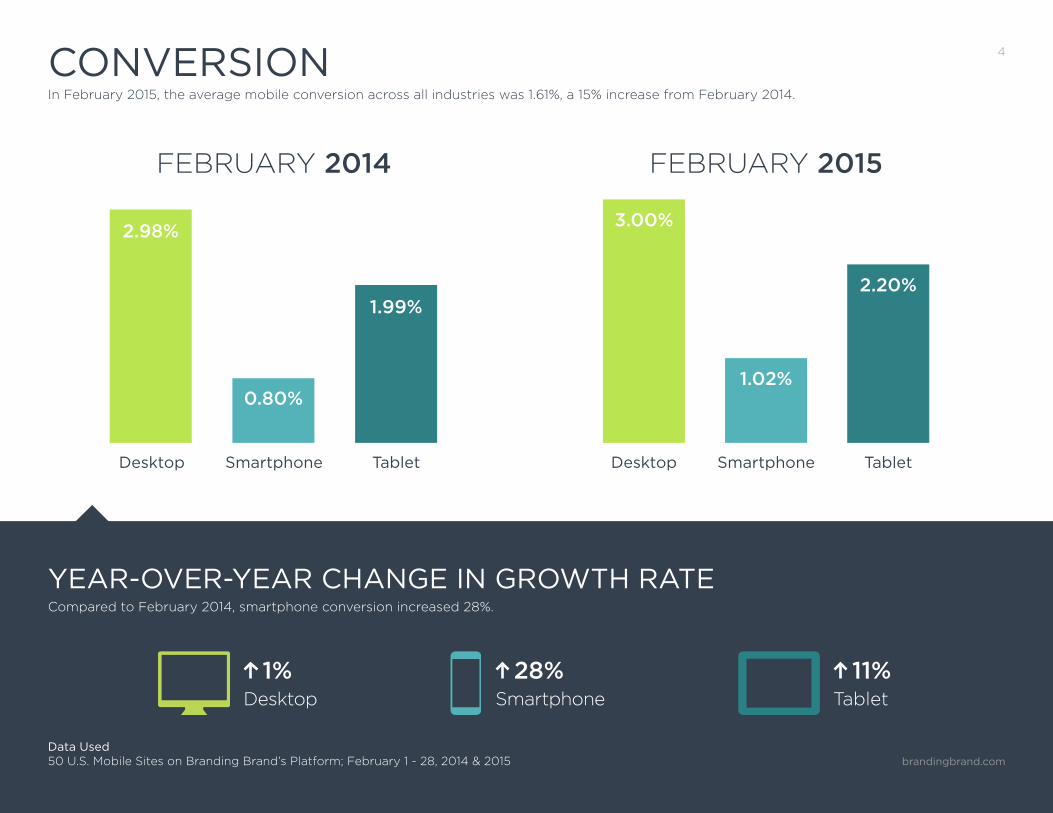
YEAR-OVER-YEAR CHANGE IN GROWTH RATE
Desktop
1%Tablet
11%Smartphone
28%
CONVERSION
FEBRUARY 2014 FEBRUARY 2015
2.98%
Desktop DesktopSmartphone SmartphoneTablet Tablet
3.00%
1.02%
2.20%
0.80%
1.99%
In February 2015, the average mobile conversion across all industries was 1.61%, a 15% increase from February 2014.
Compared to February 2014, smartphone conversion increased 28%.
Data Used50 U.S. Mobile Sites on Branding Brand’s Platform; February 1 - 28, 2014 & 2015 brandingbrand.com
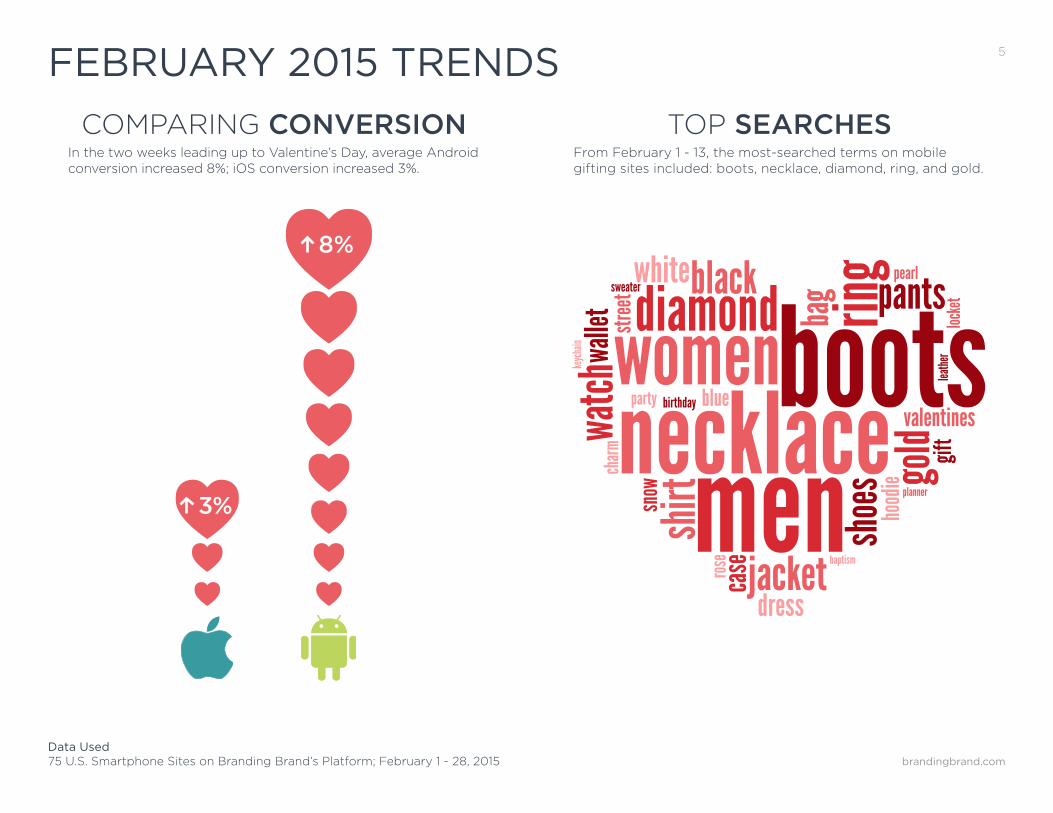
5FEBRUARY 2015 TRENDS
brandingbrand.com
Data Used75 U.S. Smartphone Sites on Branding Brand’s Platform; February 1 - 28, 2015
women
menjacketdress
baptism
necklacediamondblackwhite
sweater
birthdayparty blue
pants
bootsvalentines
pearl
planner
bag rin
gloc
ket
leathe
rgif
tgo
ldho
odie
shoe
s
case
shirtsn
ow
charm
watch
walle
tke
ycha
in
stree
t
rose
From February 1 - 13, the most-searched terms on mobile gifting sites included: boots, necklace, diamond, ring, and gold.
In the two weeks leading up to Valentine’s Day, average Android conversion increased 8%; iOS conversion increased 3%.
COMPARING CONVERSION TOP SEARCHES
NN
N
NN
N
N
NNN8%
N3%
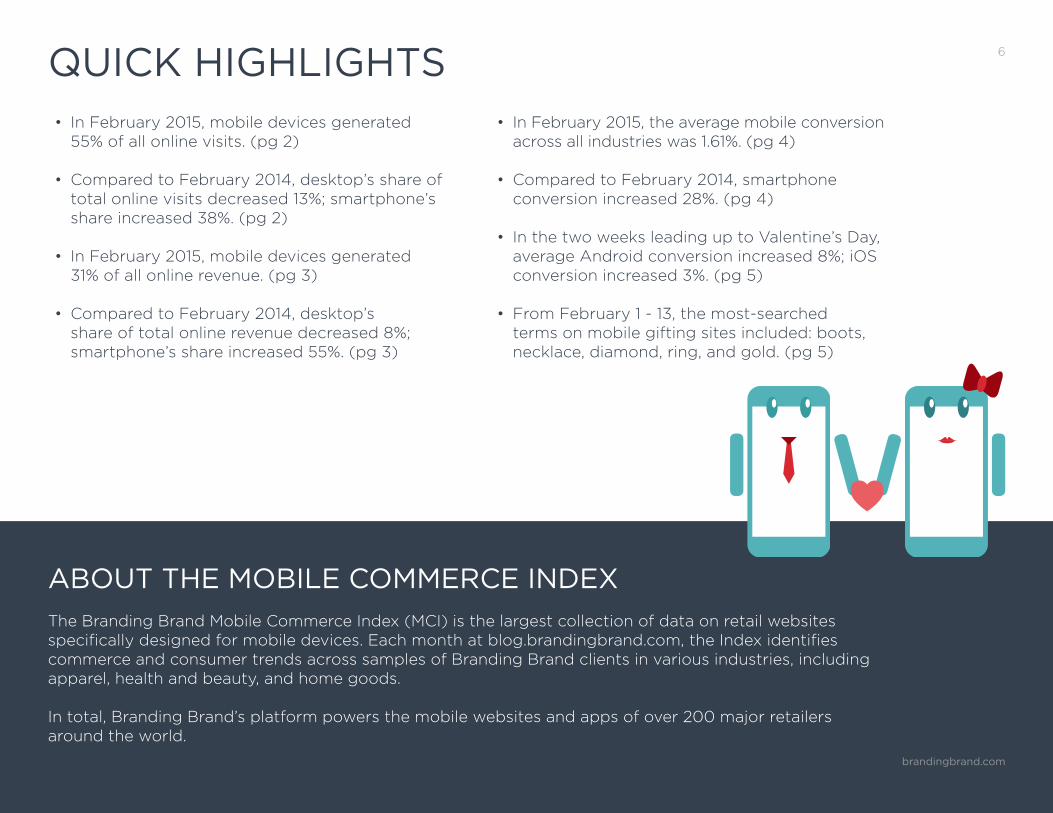
6QUICK HIGHLIGHTS
ABOUT THE MOBILE COMMERCE INDEX
The Branding Brand Mobile Commerce Index (MCI) is the largest collection of data on retail websites specifically designed for mobile devices. Each month at blog.brandingbrand.com, the Index identifies commerce and consumer trends across samples of Branding Brand clients in various industries, including apparel, health and beauty, and home goods.
In total, Branding Brand’s platform powers the mobile websites and apps of over 200 major retailers around the world.
• In February 2015, mobile devices generated 55% of all online visits. (pg 2)
• In February 2015, mobile devices generated 31% of all online revenue. (pg 3)
• Compared to February 2014, smartphone conversion increased 28%. (pg 4)
• Compared to February 2014, desktop’s share of total online visits decreased 13%; smartphone’s share increased 38%. (pg 2)
• Compared to February 2014, desktop’s share of total online revenue decreased 8%; smartphone’s share increased 55%. (pg 3)
• In the two weeks leading up to Valentine’s Day, average Android conversion increased 8%; iOS conversion increased 3%. (pg 5)
• From February 1 - 13, the most-searched terms on mobile gifting sites included: boots, necklace, diamond, ring, and gold. (pg 5)
• In February 2015, the average mobile conversion across all industries was 1.61%. (pg 4)
brandingbrand.com
N


