34
1 February 4, 2008, www.atlascopco.com Atlas Copco Group Q4 Results February 4, 2008
| Date post: | 14-Dec-2015 |
| Category: |
Documents |
| Upload: | misael-rodgers |
| View: | 220 times |
| Download: | 6 times |
1February 4, 2008, www.atlascopco.com
Atlas Copco Group
Q4 Results
February 4, 2008
2February 4, 2008, www.atlascopco.com
Contents
Q4 Business Highlights
Market Development
Business Areas
Financials
2007 Summary
Outlook

3February 4, 2008, www.atlascopco.com
Q4 - Highlights
Growth accelerated– High organic order growth
– Double-digit in all regions
Strong development for both capital equipment and aftermarket
Excellent performance in all Business areas
Record operating profits
Increased dividend and proposed share buy-back mandate

4February 4, 2008, www.atlascopco.com
Q4 - Figures in summary
Orders up 33%; 20% organic growth
Revenues up 29% to MSEK 17 549; 18% organic growth
Operating profit up 36% to MSEK 3 361– Operating margin at record 19.2% (18.1)
Profit before tax at MSEK 2 134 (2 382)– Includes MSEK 864 write-down of right to notes
Earnings per share for continuing operations SEK 1.83 (1.42), excluding non-recurring write-down
Operating cash flow, continuing operations, MSEK 926 (474)
5February 4, 2008, www.atlascopco.com
Contents
Q4 Business Highlights
Market Development
Business Areas
Financials
2007 Summary
Outlook

6February 4, 2008, www.atlascopco.com
Orders received - Local currencyGroup total +29% YTD, +35% last 3 months(Structural change +11% YTD, +15% last 3 months)
December 2007
7 +34 +10
10 +41 +47
18 +33 +30
5 +33 +45
40 +28 +37
20 +25 +37
A B CA = Portion of sales, Year-to-date, %
B = Year-to-date vs. prev. year, %
C = Last 3 months vs. prev. year, %

7February 4, 2008, www.atlascopco.com
Q4 - The Americas
Good growth in North America– Strong demand from mining customers in
Canada and Mexico
– Demand from the motor vehicle industry and parts of the construction market related to housing still on a weaker level
Positive development within most customer segments in South America
December 2007 A = Portion of sales, Year-to-date, %
B = Year-to-date vs. prev. year, %
C = Last 3 months vs. prev. year, %
A B C
7 +34 +10
20 +25 +37

8February 4, 2008, www.atlascopco.com
Q4 - Europe and Africa/Middle East
Solid organic growth in Europe– Strong demand for compressed air
equipment and industrial tools
– Mining segment strong while construction leveled off in Western Europe
– Very strong growth in Russia
High growth continues in the Africa / Middle East region – Increased demand for industrial and
construction equipment in the Middle East
– Strong development in mining in Southern Africa
December 2007
A B CA = Portion of sales, Year-to-date, %
B = Year-to-date vs. prev. year, %
C = Last 3 months vs. prev. year, %
10 +41 +47
40 +28 +37
9February 4, 2008, www.atlascopco.com
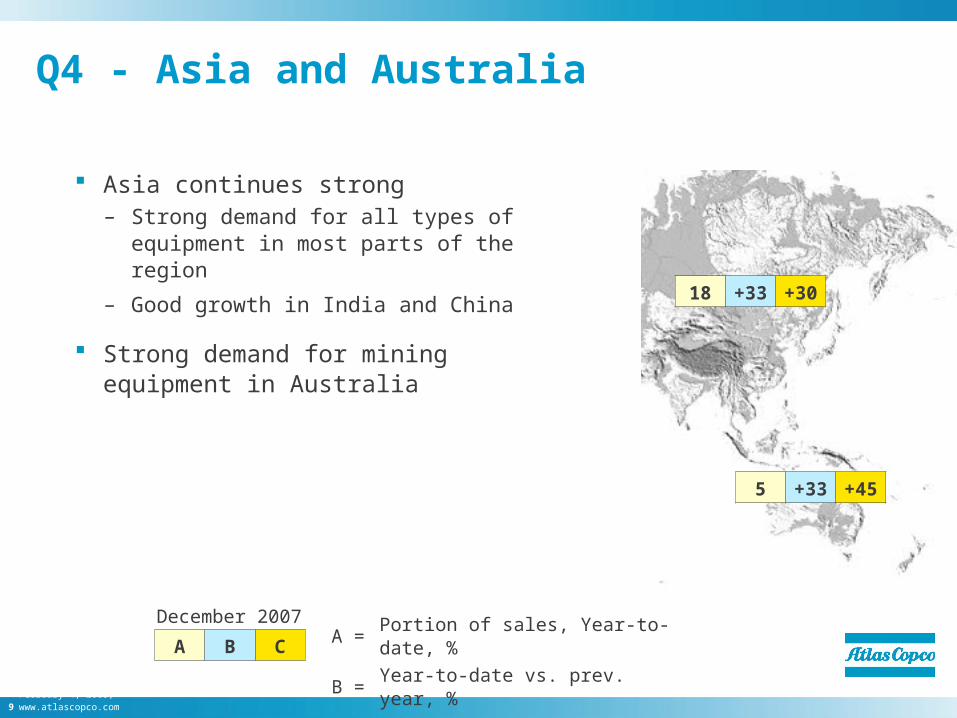
Q4 - Asia and Australia
Asia continues strong– Strong demand for all types of equipment in
most parts of the region
– Good growth in India and China
Strong demand for mining equipment in Australia
December 2007 A = Portion of sales, Year-to-date, %
B = Year-to-date vs. prev. year, %
C = Last 3 months vs. prev. year, %
A B C
18 +33 +30
5 +33 +45
10February 4, 2008, www.atlascopco.com
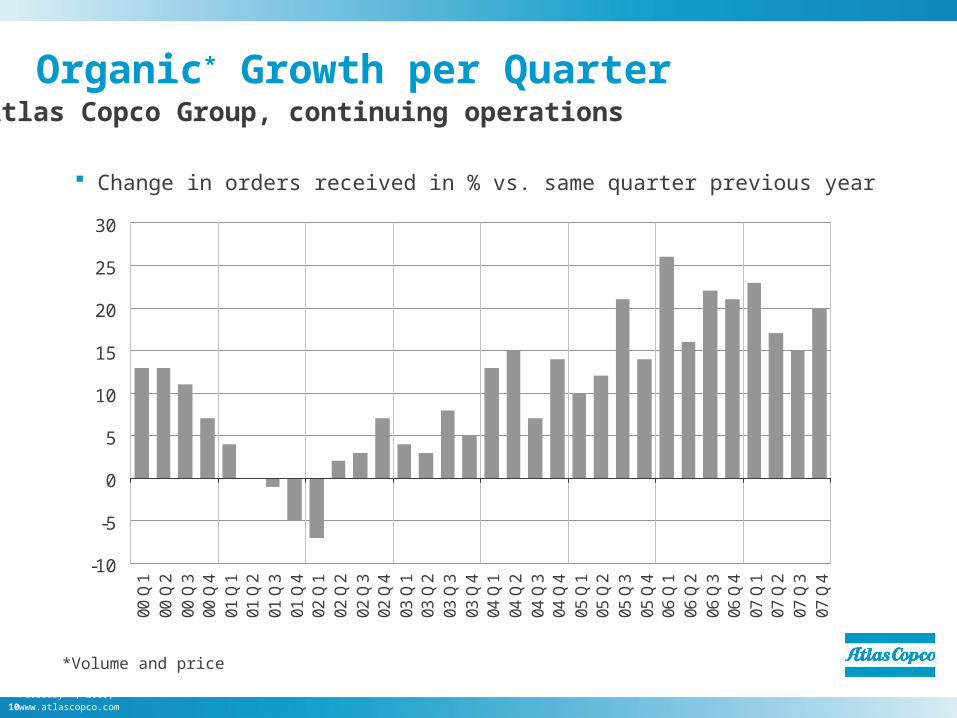
Organic* Growth per Quarter
Change in orders received in % vs. same quarter previous year
Atlas Copco Group, continuing operations
-10
-5
0
5
10
15
20
25
30
00 Q
100
Q2
00 Q
300
Q4
01 Q
101
Q2
01 Q
301
Q4
02 Q
102
Q2
02 Q
302
Q4
03 Q
103
Q2
03 Q
303
Q4
04 Q
104
Q2
04 Q
304
Q4
05 Q
105
Q2
05 Q
305
Q4
06 Q
106
Q2
06 Q
306
Q4
07 Q
107
Q2
07 Q
307
Q4
*Volume and price

11February 4, 2008, www.atlascopco.com
Atlas Copco
15%
21%
0%
10%
20%
30%
2003 2004 2005 2006 2007Organic growth, % Structural changes, %
CAGR, 2003 - 2007, organic growth CAGR, 2003 - 2007, total excl. currency
Growth – Orders receivedContinuing operations (excl. Professional Electric Tools and Rental Service)
12February 4, 2008, www.atlascopco.com
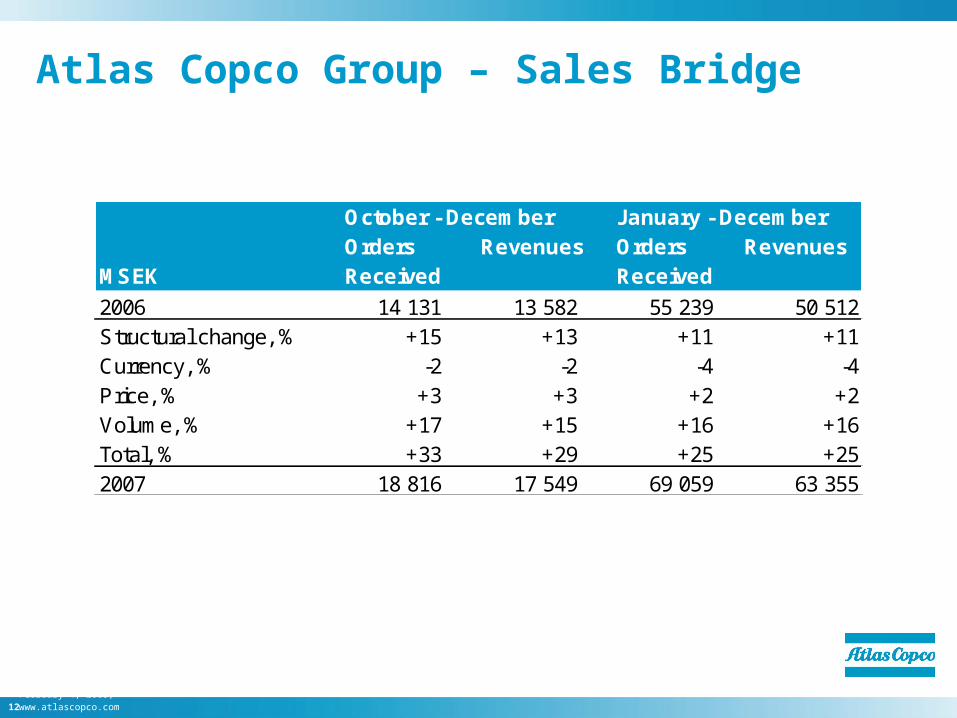
Atlas Copco Group – Sales Bridge
October - December January - DecemberOrders Revenues Orders Revenues
MSEK Received Received
2006 14 131 13 582 55 239 50 512Structural change, % +15 +13 +11 +11Currency, % -2 -2 -4 -4Price, % +3 +3 +2 +2Volume, % +17 +15 +16 +16Total, % +33 +29 +25 +252007 18 816 17 549 69 059 63 355

13February 4, 2008, www.atlascopco.com
Contents
Q4 Business Highlights
Market Development
Business Areas
Financials
2007 Summary
Outlook

14February 4, 2008, www.atlascopco.com
Revenues Operating Operating ROCEMSEK profit margin12 month values, period ending Dec. 2007 Dec. 2007 Dec. 2007 Dec. 2007
Compressor Technique 31 900 6 749 21.2% 65%Construction and Mining Technique 25 140 4 384 17.4% 32%Industrial Technique 6 871 1 539 22.4% 58%Eliminations/Common Group Functions -556 -606Atlas Copco Group 63 355 12 066 19.0% 31%*
Atlas Copco GroupOperating Profit and Return On Capital Employed (ROCE) by Business Area
*excluding non-recurring write-down of RSC notes
15February 4, 2008, www.atlascopco.com
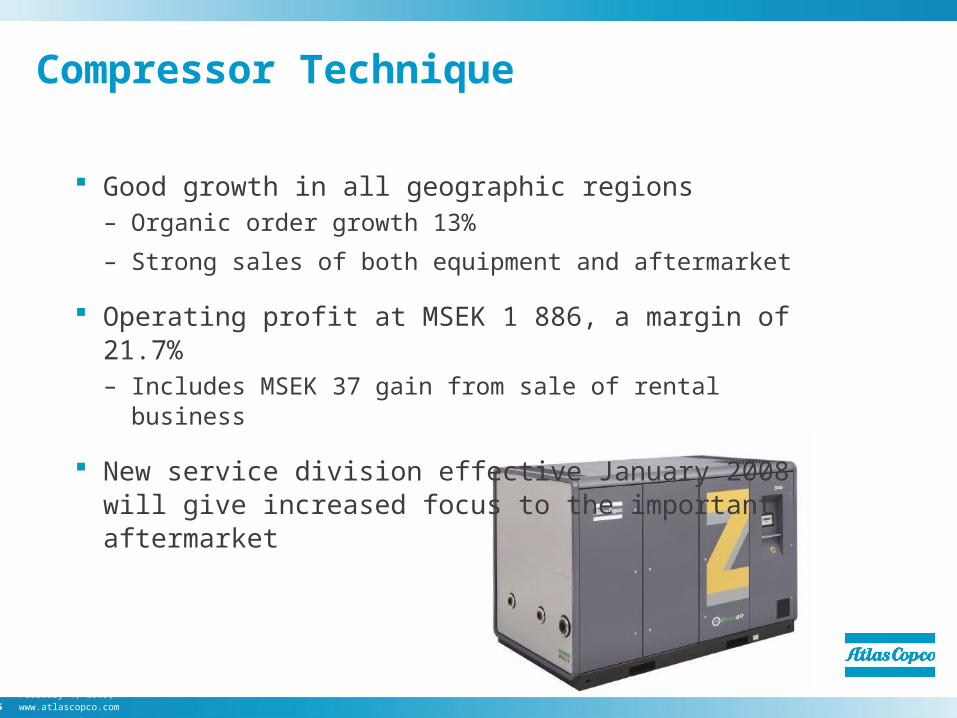
Compressor Technique
Good growth in all geographic regions– Organic order growth 13%
– Strong sales of both equipment and aftermarket
Operating profit at MSEK 1 886, a margin of 21.7%– Includes MSEK 37 gain from sale of rental business
New service division effective January 2008 will give increased focus to the important aftermarket
15February 4, 2008, www.atlascopco.com
16February 4, 2008, www.atlascopco.com
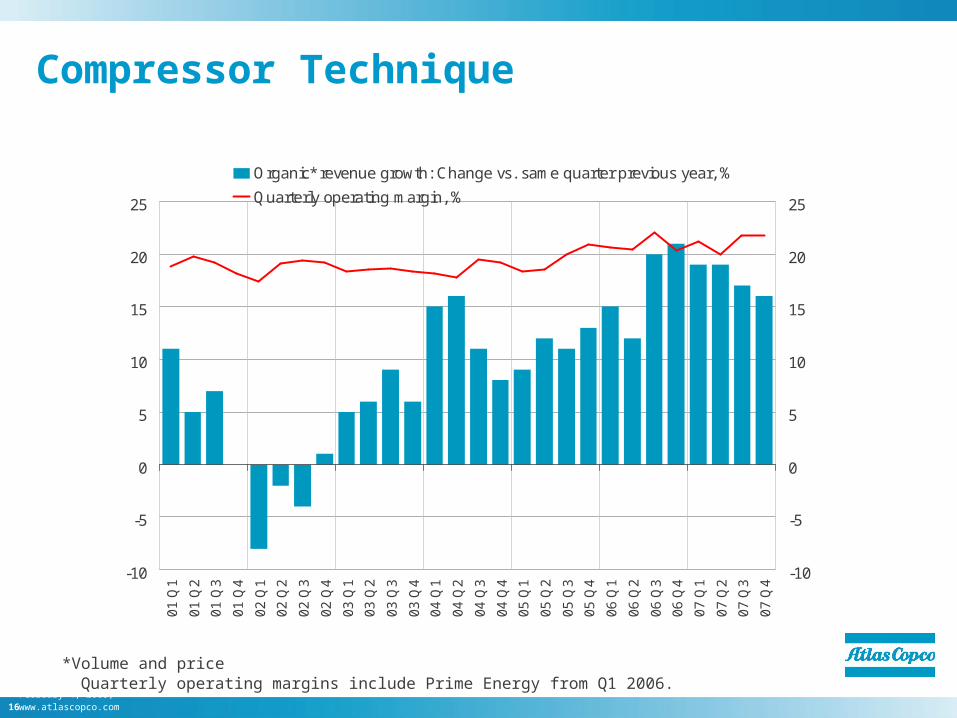
Compressor Technique
-10
-5
0
5
10
15
20
25
-10
-5
0
5
10
15
20
25
01
Q1
01
Q2
01
Q3
01
Q4
02
Q1
02
Q2
02
Q3
02
Q4
03
Q1
03
Q2
03
Q3
03
Q4
04
Q1
04
Q2
04
Q3
04
Q4
05
Q1
05
Q2
05
Q3
05
Q4
06
Q1
06
Q2
06
Q3
06
Q4
07
Q1
07
Q2
07
Q3
07
Q4
Organic* revenue growth: Change vs. same quarter previous year, %
Quarterly operating margin, %
Quarterly operating margins include Prime Energy from Q1 2006.*Volume and price

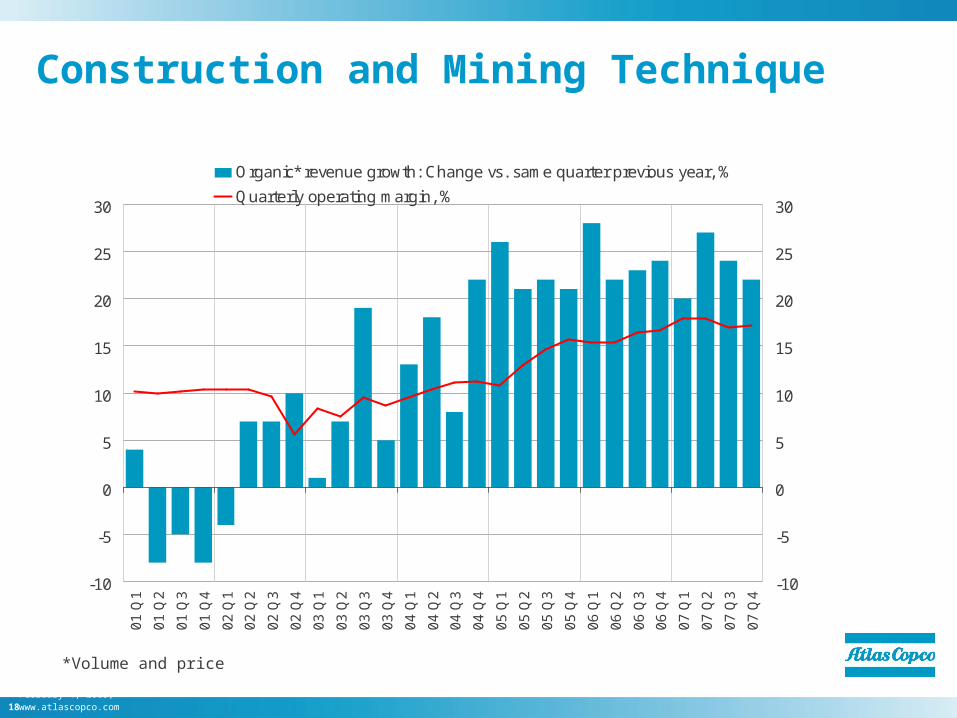
17February 4, 2008, www.atlascopco.com
Very strong increase in demand from the mining segment
Organic order growth 30%– 23rd consecutive quarter with volume
growth
Operating profit up 47%, margin at 17.2%– 20% margin for comparable units
Construction and Mining Technique
18February 4, 2008, www.atlascopco.com
-10
-5
0
5
10
15
20
25
30
-10
-5
0
5
10
15
20
25
30
01
Q1
01
Q2
01
Q3
01
Q4
02
Q1
02
Q2
02
Q3
02
Q4
03
Q1
03
Q2
03
Q3
03
Q4
04
Q1
04
Q2
04
Q3
04
Q4
05
Q1
05
Q2
05
Q3
05
Q4
06
Q1
06
Q2
06
Q3
06
Q4
07
Q1
07
Q2
07
Q3
07
Q4
Organic* revenue growth: Change vs. same quarter previous year, %
Quarterly operating margin, %
Construction and Mining Technique
*Volume and price

19February 4, 2008, www.atlascopco.com
Industrial Technique
Volume growth, both in general industry and motor vehicle industry – 11% organic order growth
– North America still slow for motor vehicle industry
Operating profit-margin at 22.2%, including restructuring costs
Acquisition of Japanese air tools manufacturer, strengthening presence in vehicle service market

20February 4, 2008, www.atlascopco.com
Industrial Technique
-5
0
5
10
15
20
25
-5
0
5
10
15
20
25
03
Q1
03
Q2
03
Q3
03
Q4
04
Q1
04
Q2
04
Q3
04
Q4
05
Q1
05
Q2
05
Q3
05
Q4
06
Q1
06
Q2
06
Q3
06
Q4
07
Q1
07
Q2
07
Q3
07
Q4
Organic* revenue growth: Change vs. same quarter previous year, %
Quarterly operating margin, %
*Volume and price

21February 4, 2008, www.atlascopco.com
Contents
Q4 Business Highlights
Market Development
Business Areas
Financials
2007 Summary
Outlook
22February 4, 2008, www.atlascopco.com
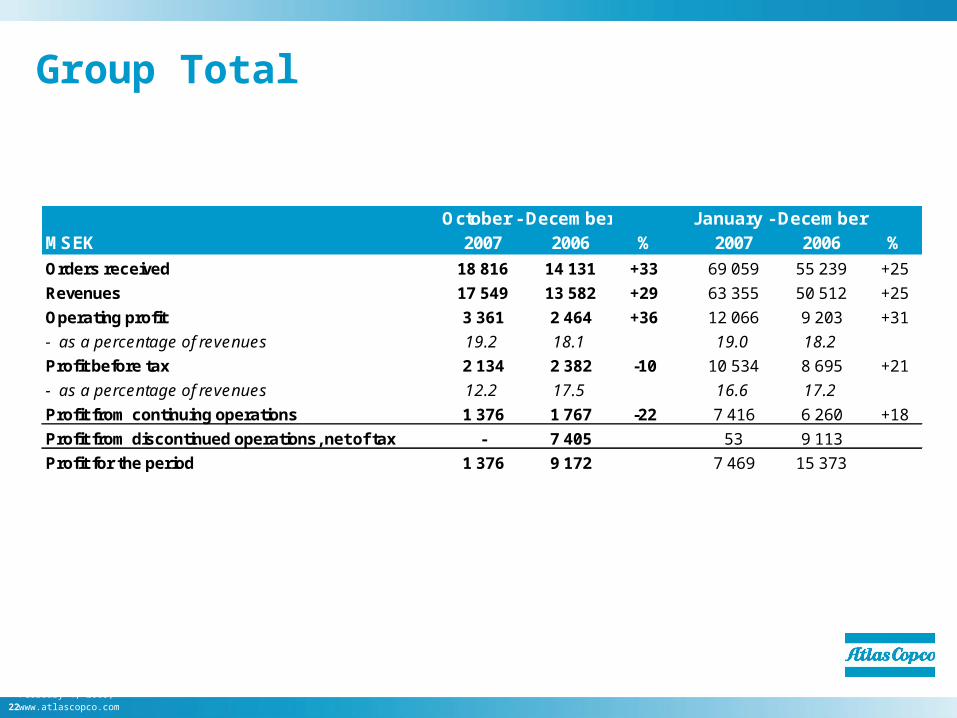
Group Total
October - December January - DecemberMSEK 2007 2006 % 2007 2006 %
Orders received 18 816 14 131 +33 69 059 55 239 +25
Revenues 17 549 13 582 +29 63 355 50 512 +25
Operating profit 3 361 2 464 +36 12 066 9 203 +31
- as a percentage of revenues 19.2 18.1 19.0 18.2
Profit before tax 2 134 2 382 -10 10 534 8 695 +21
- as a percentage of revenues 12.2 17.5 16.6 17.2
Profit from continuing operations 1 376 1 767 -22 7 416 6 260 +18
Profit from discontinued operations, net of tax - 7 405 53 9 113
Profit for the period 1 376 9 172 7 469 15 373

23February 4, 2008, www.atlascopco.com
Profit BridgeOctober – December, 2007 vs 2006
Organic Growth One-time items
MSEK Price/Volume Acq./Div.
Atlas Copco Group
Revenues 17 549 2 427 -270 1 810 13 582
EBIT 3 361 977 -220 140 2 464
% 19.2% 40% - 8% 18.1%
Q4 2007 Currency Q4 2006
One-time items on corporate level include an accounting adjustment related to the personnel stock option program

24February 4, 2008, www.atlascopco.com
Profit Bridge – by Business AreaOctober – December, 2007 vs 2006
Q4 2007 Organic Growth Currency One-time items Q4 2006
MSEK Price/Volume Acq./Div.
Compressor Technique
Revenues 8 676 1 132 -100 700 6 944
EBIT 1 886 430 -130 175 1 411
% 21.7% 38% - 25% 20.3%
Construction & Mining Technique
Revenues 7 121 1 136 -125 1 050 5 060
EBIT 1 228 430 -60 20 838
% 17.2% 38% - 2% 16.6%
Industrial Technique
Revenues 1 920 238 -22 62 1 642
EBIT 426 101 -15 -8 348
% 22.2% 42% - -13% 21.2%
One-time items include a charge related to pension benefits in 2006 and a capital gain for the divestment of a rental company in Compressor Technique and restructuring costs in Industrial Technique

25February 4, 2008, www.atlascopco.com
Balance Sheet
MSEK Dec 31, 2007 Dec 31, 2006
Intangible assets 11 665 21% 4 299 8%
Rental equipment 1 906 3% 1 979 4%
Other property, plant and equipment 4 894 9% 3 777 7%
Other fixed assets 4 245 7% 3 161 6%
Inventories 12 725 22% 8 487 15%
Receivables 16 627 29% 12 401 22%
Current financial assets 1 124 2% 1 016 2%
Cash and cash equivalents 3 473 6% 20 135 36%
TOTAL ASSETS 56 659 55 255
Total equity 14 640 26% 32 708 59%
Interest-bearing liabilities 24 397 43% 8 787 16%
Non-interest-bearing liabilities 17 622 31% 13 760 25%
TOTAL EQUITY AND LIABILITIES 56 659 55 255
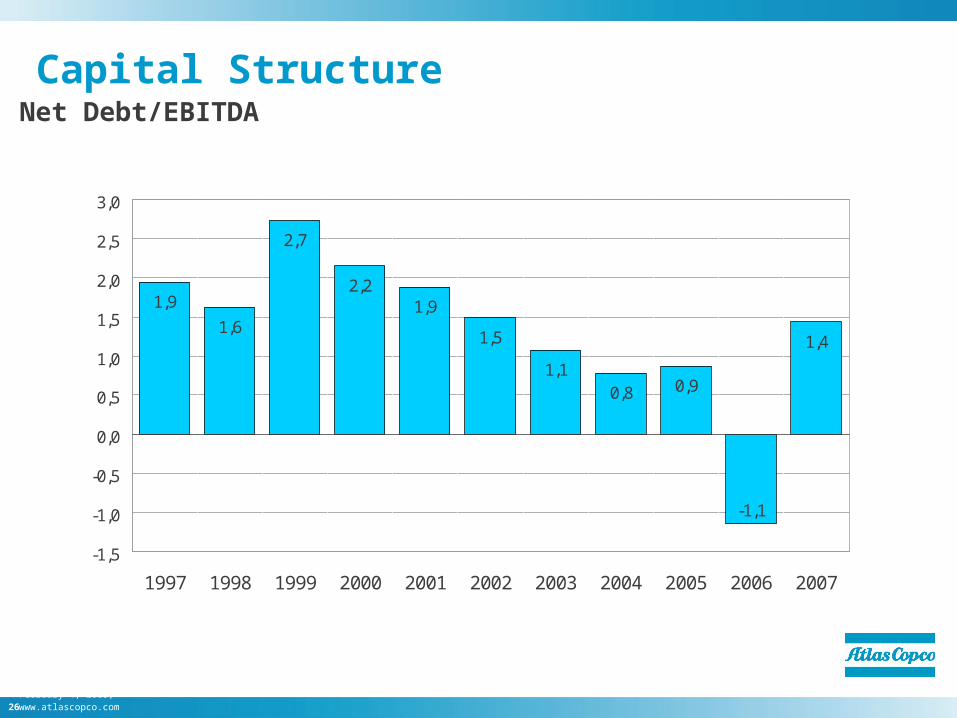
26February 4, 2008, www.atlascopco.com
1,9
1,6
2,7
2,21,9
1,5
1,10,8 0,9
-1,1
1,4
-1,5
-1,0
-0,5
0,0
0,5
1,0
1,5
2,0
2,5
3,0
1997 1998 1999 2000 2001 2002 2003 2004 2005 2006 2007
Capital Structure Net Debt/EBITDA

27February 4, 2008, www.atlascopco.com
Cash FlowContinuing operations
October - December January - DecemberMSEK 2007 2006* 2007 2006*
Operating cash surplus after tax 2 693 1 777 10 005 8 197 of which depreciation added back 498 449 1 800 1 637Change in working capital -865 -462 -2 326 -2 045 Cash flows from operating activities 1 828 1 315 7 679 6 152Investments in tangible fixed assets -652 -543 -2 359 -2 167Sale of tangible fixed assets 180 163 712 586Other investments, net -430 -461 -1 443 -1 506Cash flow from investments -902 -841 -3 090 -3 087 Operating cash flow 926 474 4 589 3 065Company acquisitions/ divestments 32 -282 -5 718 -1 332*Restated, continuing operations
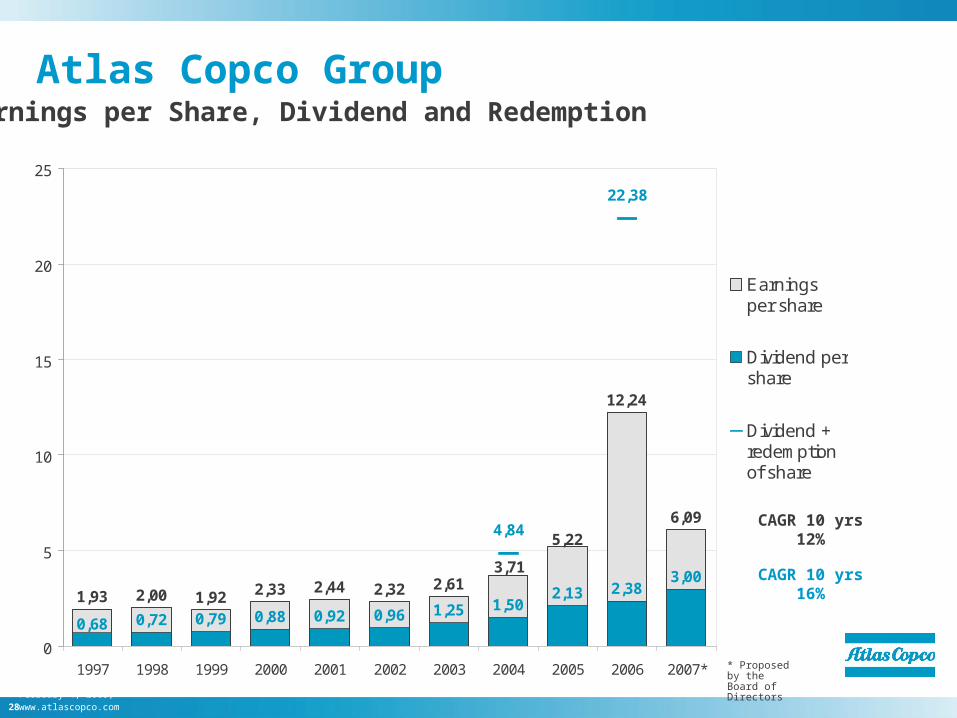
28February 4, 2008, www.atlascopco.com
1,93 2,00 1,92 2,33 2,44 2,32 2,61
12,24
6,09
0,72 0,79 0,88 0,92 0,96 1,25 1,502,13 2,38
3,003,71
5,22
0,68
4,84
22,38
0
5
10
15
20
25
1997 1998 1999 2000 2001 2002 2003 2004 2005 2006 2007*
Earningsper share
Dividend pershare
Dividend +redemptionof share
Atlas Copco GroupEarnings per Share, Dividend and Redemption
* Proposed by the Board of Directors
CAGR 10 yrs 12%
CAGR 10 yrs 16%

29February 4, 2008, www.atlascopco.com
Contents
Q4 Business Highlights
Market Development
Business Areas
Financials
2007 Summary
Outlook
30February 4, 2008, www.atlascopco.com
2007 - Figures in summary
Strong demand from most customer segments and double digit order growth in all regions
Order intake up 25%, 18% organic growth
Revenues up 25% to 63 355, 18% organic growth
Operating profit up 31% to MSEK 12 066, a record margin of 19.0% (18.2)
Profit before tax at MSEK 10 534 (8 695)
Proposed dividend for 2007, SEK 3.00 (2.38) per share and a proposed share buy-back program

31February 4, 2008, www.atlascopco.com
Contents
Q4 Business Highlights
Market Development
Business Areas
Financials
2007 Summary
Outlook

32February 4, 2008, www.atlascopco.com
Near-term Outlook
The demand for Atlas Copco’s products and services from most customer segments and regions is expected to remain at the current high level.
The positive outlook includes the main part of the construction segment, while construction related to housing is expected to remain weak, primarily in North America.

33

34February 4, 2008, www.atlascopco.com
Cautionary Statement
“Some statements herein are forward-looking and the actual outcome could be materially different. In addition to the factors explicitly commented upon, the actual outcome could be materially effected by other factors like for example, the effect of economic conditions, exchange-rate and interest-rate movements, political risks, impact of competing products and their pricing, product development, commercialization and technological difficulties, supply disturbances, and major customer credit losses.”


