UNITED STATES DEPARTMENT OF THE INTERIOR ;_ GEOLOGICAL SURVEY, / > u Federal Center, Denver, Colorado 80225 OIL SHALE-6 HYDRAULIC TESTING AND SAMPLING OF USBM-AEC COLORADO CORE BOLE 3, RIO BLANCO COUNTY, COLORADO By E. H. Cordes December 1969 Open-file Report Prepared by the Geological Survey for the U.S. Atomic Energy Commission.
Transcript
UNITED STATESDEPARTMENT OF THE INTERIOR
;_ GEOLOGICAL SURVEY, / > u
Federal Center, Denver, Colorado 80225
OIL SHALE-6
HYDRAULIC TESTING AND SAMPLING OF USBM-AEC COLORADO CORE BOLE 3, RIO BLANCO COUNTY, COLORADO
By
E. H. Cordes
December 1969
Open-file Report
Prepared by the Geological Survey for the U.S. Atomic Energy Commission.
CONTENTS
Page
Abstract ............................ 1
Introduction .......................... 2
Geohydrology .......................... k
Hydraulic testing and sampling ................. 7
Test 1 .......................... 13
Test 2 .......................... 16
Test 3 .......................... 18
Test k .......................... 21
Chemical analyses of CCH-3 water samples ............. 26
Chimney flooding ........................ 30
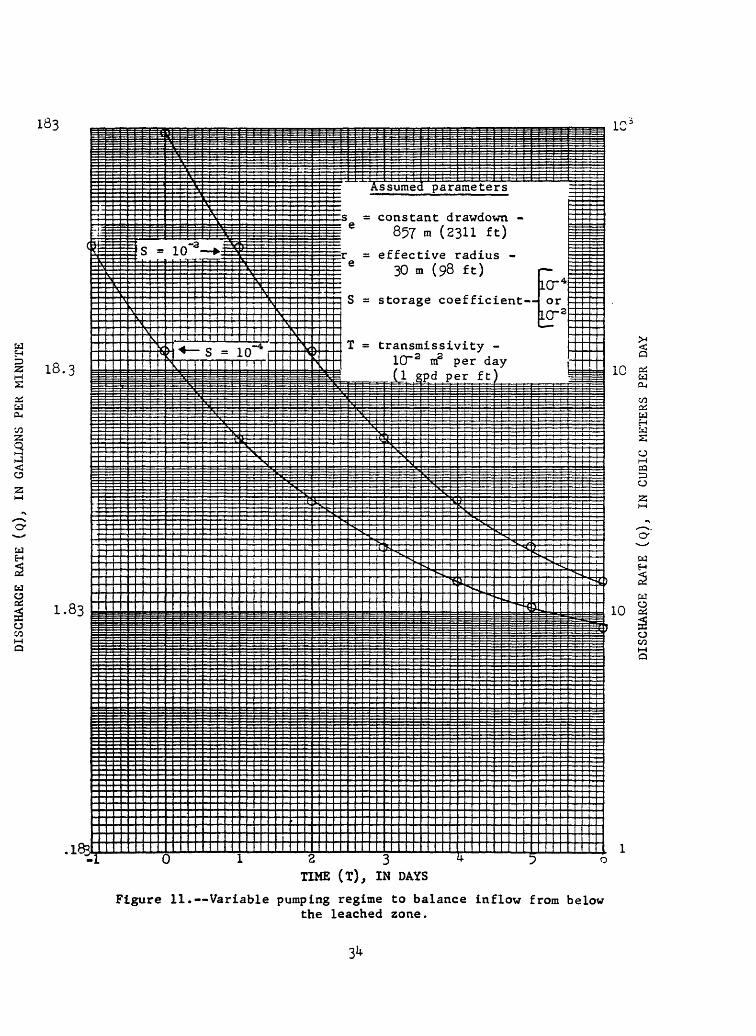
Inflow to the chimney from below the leached zone ..... 30
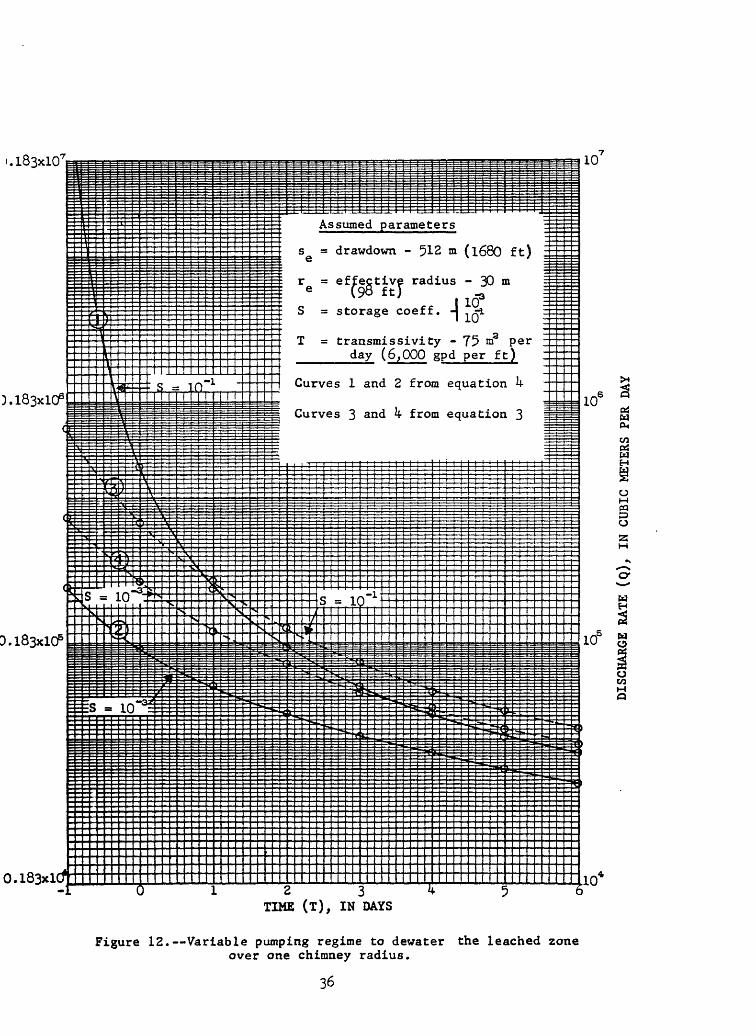
Inflow to the chimney from the leached zone ........ 33
Conclusions .......................... 37
References ........................... U2
ILLUSTRATIONS
Page
Figure 1. Map showing locations of USBM-AEC Colorado
Core Holes 3, 2, and 1 ................ 5
2. Lithology and test intervals, USBM-AEC
Colorado Core Hole 3.................. 6
3. Well mechanics, USBM-AEC Colorado Core Hole 3
upon completion. ................... 8
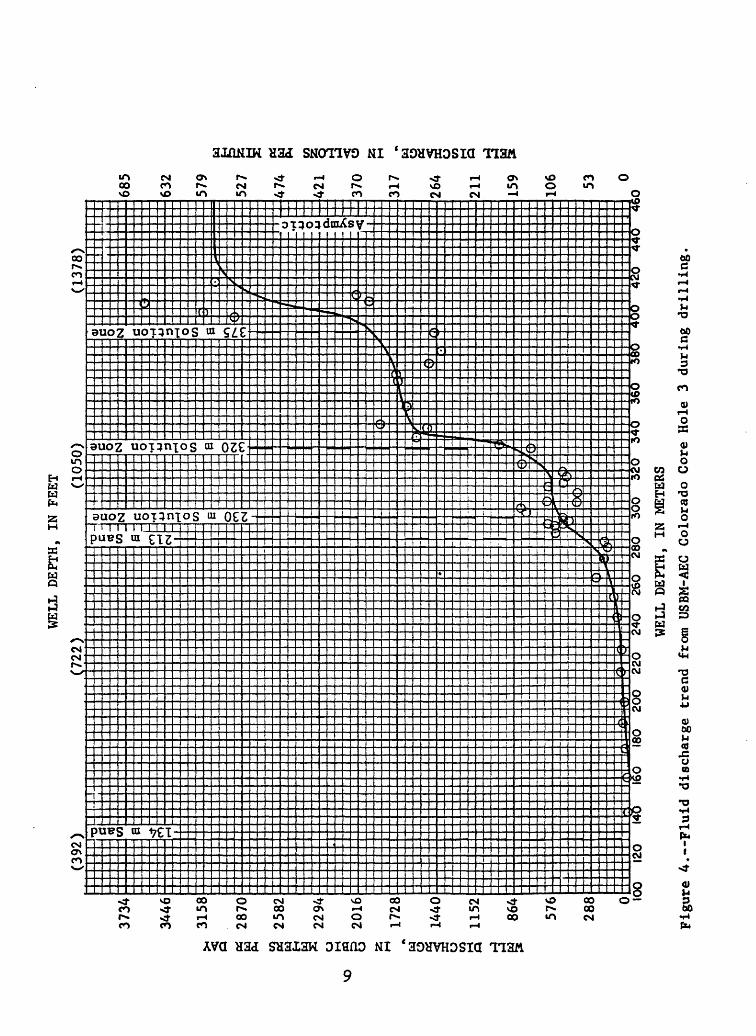
4. Fluid discharge trend from USBM-AEC Colorado Core Hole 3
during drilling ................... 9
5. Specific conductance of discharge fluid during
drilling of USBM-AEC Colorado Core Hole 3 ...... 10
6. Test 1, USBM-AEC .Colorado Core Hole 3. ......... 15
7. Test 2, USBM-AEC Colorado Core Hole 3. ......... 19
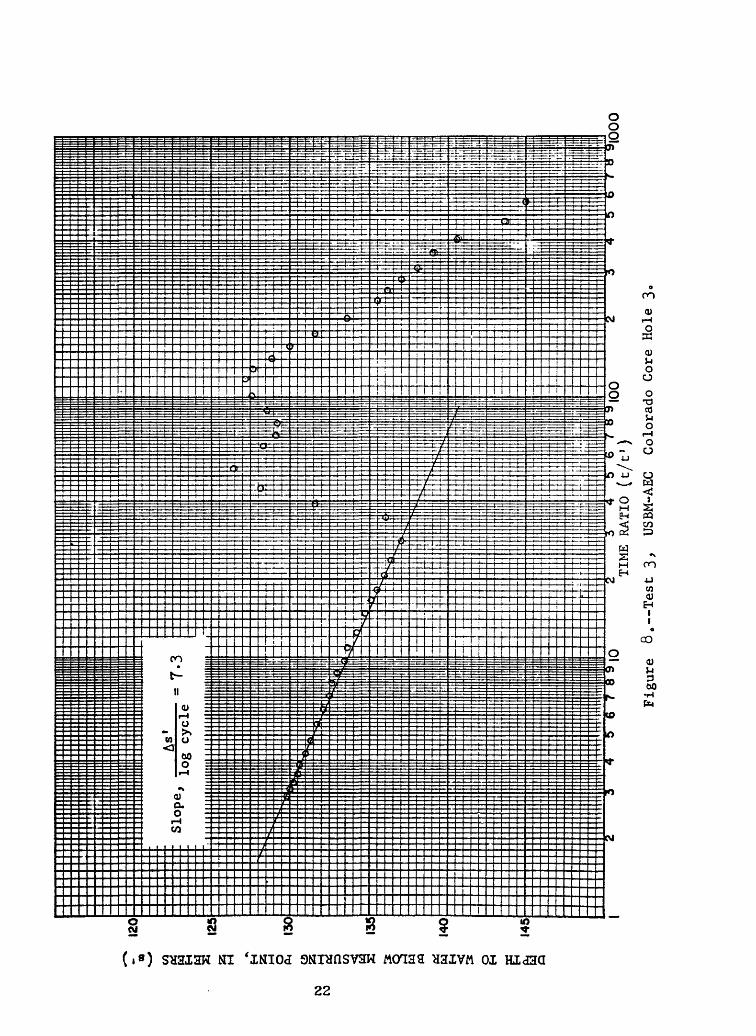
8. Test 3, USBM-AEC Colorado Core Hole 3. ......... 22
9. Test 4, USBM-AEC Colorado Core Hole 3. ......... 25
10. Diagrammatic sketch of Project Bronco rubble
chimney. ....................... 31
11. Variable pumping regime to balance inflow from
below the leached zone. ............... 34
12. Variable pumping regime to dewater the leached zone
over pne chimney radius. .............. 36
ii
TABLES
Page
Table 1. Summary of hydraulic test data, USBM-AEC
Colorado Core Hole 3 ............... 2?
2. Water samples from USBM-AEC Colorado Core
Hole 3 ...................... 28
3. Chemical analyses from USBM-AEC Colorado
Core Hole 3 ................... 29
ill
UNITED STATES DEPARTMENT OF THE INTERIOR Oil Shale-6
GEOLOGICAL SURVEY December 1969 Special Projects Branch
Federal Center, Denver, Colorado 80225
HYDRAULIC TESTING AND SAMPLING OF USBM-AEC COLORADO CORE HOLE 3, RIO BLANCO COUNTY, COLORADO
By
E. H. Cordes
ABSTRACT
On November 21, 1967, the U.S. Geological Survey, in cooperation with the U.S. Bureau of Mines and the U.S. Atomic Energy Commission, completed the hydraulic testing and sampling of USBM-AEC Colorado Core Hole 3 in Rio Blanco County, Colorado. This hole was drilled to explore the site for Project Bronco, a Plowshare experiment to study the feasibility of in situ retorting of oil shale after breaking the rock with a nuclear explosion.
The hydraulic tests indicate the existence of a highly permeable water-bearing zone in the upper and middle parts of the Parachute Creek Member of the Green River Formation of Eocene age. The zone yielded water in excess of 2,700 cubic meters per day (500 gallons per minute). During geologic time and even today, natural ground-water circulation is believed to have dissolved the syngenetic salt deposits from a part of the oil shale formations leaving a highly permeable zone of inter connected vugs and breccia channels. Older rocks underlying the Parachute Creek Member are comparatively impermeable to water flow and yielded less than 16 cubic meters per day (30 gallons per minuted) of highly saline (49,000 parts per million dissolved solids) fluid.
Potential flooding of a rubble chimney is. an important consideration for project feasibility and safety. A first approximation of the magnitude of flooding was calculated from the test data.
INTRODUCTION
The U.S. Geological Survey (USGS), in cooperation with the
U.S, Bureau of Mines (USBM), the U.S. Atomic Energy Commission (AEC),
Lawrence Radiation Laboratory and CER Geonuclear Corporation completed
a program of hydraulic testing and sampling of USBM-AEG Colorado Core
Hole 3 (CCH-3), in Rio Blanco County, Colorado, on November 21, 1968.
The work represents a preliminary phase of a site evaluation study
for Project Bronco, a proposed experiment to study the feasibility
of in-situ retorting of oil shale fractured by an underground nuclear
explosion. Project Bronco is part of the AEC's Plowshare Program,
which has the task of investigating and developing peaceful uses for
nuclear explosives.
The objectives in drilling CCH-3 were:
1) to confirm previous estimates of the thickness of
overburden, oil-shale and salt-bearing deposits and
to quantitatively determine oil yields;
2) to obtain quantitative hydrologic information relative
to project safety and technical feasibility; and
3) to describe the preshot geologic fracture system and
rock competence in the experimental area.
The hydrologic test program closely follows the requirements and
objectives set forth in the AEC "Bronco Oil Shale Study" of
Octpber 13, 1967 They are designed:
1) to determine possible hazard to public safety from circulation
of ground water contaminated by radionuclides; and
2
2) to describe and evaluate the possibility of flooding the rubble
chimney. Uncontrolled ground-water inflow into the rubble
chimney could adversely affect the technological feasibility
of Project Bronco.
A complete understanding of the dynamics of the ground-water flow
system both in and around the experimental area would be required,
to answer these and other questions.
Hydraulic testing in CCH-3 has provided some of the basic data
required to analyze the ground-water flow system. However, these data
are limited to an approximation of the transmissivity and hydrostatic
potential of multiple aquifer units. Reservations must be placed on
quantitative results, particularly if flow characteristics are fracture
controlled. A further drawback of the single-well testing program is
an inability to calculate a resonable storage coefficient. Extrapolation
of these parameters over the regional ground-water basin would require
a more detailed hydrologic investigation.
The physical and chemical properties of water samples taken during
the tests provide additional information to aid in the interpretation
of the flow system.
This report summarizes the methods and procedures used in the
hydraulic testing of CCH-3, It is intended to disseminate the basic
hydraulic data and to present a brief analysis related to Project Bronco
hydrologic objectives.
The author, assisted by Messrs. George Dana and Harold Thomas of
the U.S. Bureau of Mines, supervised the testing program.
GEOHYDROLOGY
Previous experience with hydraulic tests in USBM-AEC Colorado
Core Holes 1 and 2 (Carroll and others, 1967; Ege and others, 1967),
and information from oil and gas wells in the area indicate a copious
supply of water in the Parachute Creek Member of the Green River
Formation. The surface location of Colorado Core Hole 3, with
respect to Colorado Core Holes 1 and 2, is shown in figure 1.
The Green River Formation is a sedimentary sequence of ancient
lake-bed deposits of Eocene age (fig. 2). The near shore deposits
include much sand, whereas accumulation in the depositional center
consists of carbonaceous clay and marIstone. Rocks containing
abundant organic matter comprise the oil-shale deposits.
The Parachute Creek Member of the Green River Formation is com
posed mainly of siltstone and marlstone, and contains a solid hydro
carbon called "kerogen" and various syngenetic salt accumulations in
the form of beds and (or) nodules. Throughout much of the Piceance
Creek Basin, ground-water circulation is believed to have leached the salt
deposits, particularly in the middle and upper part of the Parachute Creek
Member, leaving a cavernous and brecciated dissolution zone.
The geologic origin of the Garden Gulch and the Douglas Creek
Members (fig. 2) is similar to that of the overlying Parachute Creek
Member. However, these older lacustrine sediments do not contain the
salt deposits and generally are almost barren of kerogen. Little is
known of the hydrologic characteristics of these older rocks, yet
they are directly involved in the planning of Project Bronco.
R.99W.
40°OO
I 0 ISCALE I:I25,OOO 234 GMiltt
Figure 1.--Locations of USBM-AEC Colorado Core Holes (CCH) 3, 2, and 1.
EOC
ENE
| t»«U
DOUG
LAS
CREEK
i ME
MBER
1CH
GARD
EN
I GULCH -r
MEMBER
(i
j.vc
.il
runnnij.un -
PARA
CHUT
E CR
EEK MEMBER
EVAC
UATI
ON
I CREEK
MEMB
ER
i
I*
rtn
Ar»
»t
/-N
9
^ 9
r-
+
r~ \
.j (
\n
ro
oo
rovl
01
» £
'j\ .
»-
-v
l (j _
_i>
O
k v
i m
oo
op
!-
*«
^ *
4
I-*
*^ O
\*-S
^ |.:v
-..-
-f .-.
.-:. .
:Hl
l.V/'.
i.l ,i|,
i i.g&
fli^
ife
^d
i i
Jft'l
" '
H H
V
SpS
lW-A
: m
^^^M
- t i
o
nH
- (5
H
M
OM
ft
VJ
i£
£ J
TO
O
n
w
MB
*o
a
^ ?..
?a
I P
-8B
1 ?
8"*
Ou
M
* W
I*
-j
ft »
M
to
5
0
to
W
3 8
! ,»
3o
o I s H- e
o 3* C
ave
d b
efo
re >
test
4
TP
°T
ll
T -
0.0
1(1
)
i-<
V
} at.
VA
:l§ ' i TTu
V
U4 vL
W-^
<#!tR
.
H<
O
SM
o Ir
<o
-
M
5i i00
!-
O9
V>
MU
I >
-»
4>
>""l*
>M
U>
^N
>
!-
§«
j *-N
»i-«
tni-»
i*>
vo
vo
*^
Oi
Q\O
O\U
>O
UtU
tO
*O
vo
vO
* O
O
W
«
N_^
oo
v^
Vn
N-'
O>
N-'
U>
v^ V
/t O
23£^
Sp^
aasi
^Ja^^
>^H
pJ^
hft
HlH
N^
i
^^>
^
NO
Wo
o
S i- f
tg
^^f1
ttfH
tt-1 ^
M t
1 ^V"
*- W
8 ;^
::i W
SaS
vi'i
tl N
tV
W ^
:
i^^ &
t^w
si t
hKifc
tw 5
®£w
tH ^
JlS
^M fl
I i
Mht
i-ti «
J £$*
'>f
^tH
M ^
N*~
-ihP
N r
M i-H
»-Jt
»-».
t J K
i %»v
^.i
k J
S2
fJ
Tg
1B
I-
o> »
nR
o. f
i H»
ID
S
T ft
0)
'ill-*
r^'
^Oi.
i"'*»
4M
-}«
j *
KOv/
'V'I'
CT'
-ti-'
-1 !'
l'-
) iS
ffWS
"' ¥
:rS : ^.i
:--a;'.-
.:' ' :
m
mJw
'''*
*K U
*.«&
! *. %
» .
. .«
.-
.h
yis
1
s?s?
aftn
ay
&
CD
H
«IB
HiP
*
O*
(B
it
Oft
l*O
"ft
>W
0
H
-
M
O
O.O
QO
O
O
O
«J
£T
«S
5>
s-i-i-g
O
M
^ "«
S
a
2
C 3
Q
?S
*K
?t«
H
-fc^m
H
H-r»
^w
r1
^
i*
O
»o
.»2
-^
^
S
bn
»*H
!-
*
C
a
H
a;
ftm
a
1 o-
1 o
^°-M
S
^o.
-|s i
i si
. 1
8a$
q S
^"
1 ogS
«
S ST
'8a|
s S
^ 9
?8
gI'g
lZ
O
OO
OQ
M
»
MO
W
Q
M«
.-»
rtJT
Q
^
H
' »
«
P
C>
H>
a
c
i
i £
«
e n
a f
t h
n
CD 2
* III
> a
Ǥ
I-a
J? <
0
S
**
« N
LITHOLOGY
^7
?
g. no
cro
H»
H»
M
»*
^^"s
ss
ff^8
S
ss
5 S
ig
ft
«fr
-
S.
R
2 J^
gH
.Q
H»
fi «5
To
l»
u>
«'
25
1
g*
i "
*
1» »^
r\n
v
11D
Lf: - - >
SN
O
^
s M § cn
g W
1 «
f»
< T
ES
T-3
T
«
75
(6,0
00)
____
521
" (4
.200)
'
-
ni
TF
""P
i 1
inn
i
n i
i fc
T .
14 (1.1
00)
o« 3
00 Hi
ft
hK
SO
A
M*>
^M
?
>«
»<
S 3 gD
S
u> »
- CO
5P
00M
OO
tn
oo
vO
O
>J
CD
HYDRAULIC TESTING AND SAMPLING
Drilling of CCH-3 began on October 15, 1967. Approximately 67.1 m
(220 ft) of 34,3-cm (13-1/2-in) diameter hole were mud drilled to accom
modate 27.4-cm (10-3/4-in) diameter surface casing (fig. 3). After
cementing the surface casing, the hole was drilled to a total depth
of 1,154.7 m (3,786 ft), using compressed air and foam as circulating
media. For hydraulic testing this circulating media is preferable to
using drilling fluids which contain compounds that plug the fluid con
ducting pores.
The well discharge during drilling and testing was continuously
recorded with a Stevens type-F water-level recorder behind a 90° V-notch
weir, The weir and associated recording equipment was placed about
15.2 m (50 ft) downstream from the discharge sump. Some fluid is
lost from this type of open recording system. Infiltration in the
discharge sump and in the stream channel accounts for some of the loss
but the major loss occurs as water vapor and extraneous surface runoff
during initial discharge of the well. An estimate of these losses was
used to adjust the discharge data.
Temperature and specific conductance of the discharge fluid were
also recorded at the weir. A drilling report (geolograph) was used to
correlate these physical parameters and the fluid discharge rate to
well depth (figures 4 and 5). Significant changes in these parameters
reflect variations in the hydrologic media and an increased efficiency
of jetting with greater submergence. Consideration of the observed
changes help in the interpretation of the geohydrology.
Surface elevation
(220)
H W W fa
Casing diam 2 19. k cmB (7-5/8 in)
CO
Q
W PQ
wQ
, 2127)688.5 (2259)
f
1935 -5 meters (63^6 feet)Hole diam
cm
(3786)
in)
Surface casing diam27.if cm(10-3A
Hole reamed to 2k cm diam (9-7/8 in)
Cement
Hole diam 17.3 cm (6-3A in)
Caved hole
Total depth
Figure 3. Well mechanics, USBM-AEC Colorado Core Hole 3,upon completion.
8
WELL DISCHARGE, IN CUBIC METERS PER DAYtorororou>u»
1ro j>i
*flMIcH« Q.
Cu H« CD O
Q> H
OQ fl)
ft HrcPCL
M» fl
§ &m
& P 01£ 8W H C5 P*
« O
s. s oto ra ou H0 S?3 O COo n(Dffi O
u»Ou
nH* 9
00
0.fl
OQ
00 **J ON v/i 4»* ro H** vO OO J VJi ^* OJ o oo ON -P* ro o oo ON -P* ro o OQ ON -P*8
roO
"Kci
o
cm0
roroO
roO
roO
roCD0
o<oo
0<roO
01
0
.Ot JL
W
^
SiSo«.,jo-
a\
1
3-
fFFi
1Tt4
i\) -V\
1
1L«Jr
ps*J
lyw;
^
^J\S^^JJf L
/Prt fjpn
^
~
^
k
:>-
k^ ^
**^J
_vT/
c)^
i
fe±! K 5
*
Ml
M
C
/
s**
T
\
a*<!
VJ
O t-* t ro ro Ut O Ui t » ON
O U» ON vo (- -P*
\-^ Jy(
4
\
P
.'
^
f-
L
| '
A f-
» fc
^
35n-
M
"I
-
Mi
3
"
:-
»
0
m
t
«;
ich-
* h
«
^
134 ro Sam
213
iri_
ro Sandt i i
230 m Solution Zone
*.
*
^
nJ20 m Solution Zone
175 m SolutionK&
SjV-<
OJ OJ ^* 4»* Wi
"J O »-» -P* "J
1Ji
Zone
Cn ON ON »J OJ 00vo ro v^i
VOro
y-N
roro
i oLn O
/"NH- OJ vj 00
w3
WELL DISCHARGE, IN GALLONS PER MINUTE
4xl(f
W
COQ
§0
H
BOoO M Cm M
04CO
1x10
WELL DEPTH, IN METERS (FEET)
Figure 5« Specific conductance of discharge fluid during drilling of USBM-AEC Colorado Core Hole 3.
10
Four aquifer-performance tests were made during the drilling of
CCH-3. Suites of water samples were collected for chemical analysis.
The collection and method of analysis of data for each of the
four hydraulic tests is as follows. The field procedure is designed
to measure parameters in a hydrologic system, that are described by
a mathematical model. In the prototype system, cause and effect are
related by the characteristics of the porous media. A controlled
stress is imposed on the ground-water system by jetting fluid from
the hole at a constant rate. After quasi equilibrium is reached, the
stress is removed permitting the system to relax. The effect of relaxa
tion (recovery) is carefully monitored.
A mathematical expression, relating cause and effect in a hydro-
logic system, is given by the modified Theis equation, (Ferris and
others, 1962),
0.183Q lo t T « s 1 S 10 -p" ' (1)
where
s » ss residual drawdown after time t', in meters
t * time since jetting started
t 1 « time since jetting stopped
T « transmissivity, in nr per day (square meters per day)
Q « fluid discharge rate, in tn^ per day (cubic meters per day).
This equation is ideally the expression for a line passing through the
origin. A semi-log plot of s f verses log.Q £* is a line of constant
slope.
11
A simplified form of equation 1, using the slope of the line through
the data points, can be used to approximate the aquifer transmissivity,
where
s' 3 depth to water, in meters
Q s discharge rate during jetting, in m3 per day
T =s transmissivity, in ms per day
m = straight-line slope, As 1 per log cycle.
The derivation of the mathematical model, and thus its application,
hinge on satisfying several important assumptions:
(a) uniform, isotropic, and homogeneous media of infinite areal
extent;
(b) two-dimensional flow;
(c) boundary conditions at the well-bore are negligible;
(d) stresses are additive (theory of superposition);
(e) constant coefficient of storage and the instantaneous transfer
of mass with a change in head.
Quite often, conditions in the field depart appreciably from these
assumptions and cause recovery observations that depart from ideality.
The field data will reflect boundary conditions, regional changes in
water level, interaquifer leakage, slow drainage, partial penetration,
and other more localized effects. All of the above criteria alter the
shape and slope of the semi-log curves. Deviation from the ideal solution
of equation 2 does not preclude its use as a first approximation of T.
12
Jacob (1963) showed that hysteresis in the storage coefficient,
during recharge (S 1 ) and discharge (S) cycles, will account for non-
linearity observed in most semi-log plots of the field data, and
furthermore, the ratio of the storage coefficients (-5-7) has a finiteo
value at the intercept for zero drawdown.
Practical considerations during the testing of CCH-3 precluded
the possibility of reaching equilibrium prior to measuring the
recovery and required that pretest static water levels be estimated
or projected from the recovery curves.
Test 1
The first hydraulic test of Colorado Core Hole 3 was made -in the open-
hole saturated interval between 111.5 m (360 ft) and the intermediate depth
of 290.5 m (953 £t). This test came at a time when well discharge
was 600 m3 per day (110 gpm) and coring was to commence. At a depth
of 290.5 m (953 ft), the well had completely penetrated the Evacuation
Creek Member of the Green River Formation and had intersected what
appeared to be oil-bearing shale in the upper part of the Parachute
Creek Member (fig. 2).
The first occurrence of water in the well bore was noted at
approximately 111.5 m (360 ft), where an estimated 22 m3 per day
(k gpm) of soap solution was injected into the compressed air stream.
The discharge of formation water increased with depth, as shown in
figure U. Two criteria working simultaneously explain the gradual
increase in well discharge:
(1) an increase in the aquifer transmissivity; and
(2) increase in jetting efficiency with increased submergence.
13
Geologic variations in the porous media, such as solution cavities,
fracture frequency, and rock type are roughly correlative to abrupt
changes in the slope of the curve in figure k.
The hydraulic test involved a constant-rate withdrawal of fluid
from the well by jetting, and at the end of the jetting period,
measurement of water-level recovery in the well. A string of open-
end drill rod, 283 m (928 ft), was used to inject compressed air
into the well bore. The rising air column in the annul us entrains
fluid, lifting it to the surface. A jetting system is highly
inefficient and permits recirculation of the fluid within the
annulus. Recirculation of the water is likely to affect its
initial chemical quality.
Over a k-hour jetting period that began at 2100 hours on
October 19> 19^7 > the average discharge (Q) recorded at the weir
was 600 m3 per day (110 gpm). Prior to completion of the jetting
period, samples of the well discharge were collected for chemical
analysis.
The recovery period for test 1 started at 0056 hours on
October 20, 196?, and terminated at 0300 hours the same day.
Figure 6 is a semi-log plot of depth to water versus the ratio
of total time (t) divided by recovery time (t 1 )- The S-shaped
curve in figure 6 is typical of tests exhibiting hysteresis in the
storage coefficient..
DEPTH TO WATER BELOW MEASURING POINT, IN METERS (sj)
00
cr>
on rr
OI-1 O»1JSo.O
o o *<A
(ftCO
M O
n rr
OOQ
II-4
-4
8
colco
II
W-
.o .
rr-
The static water level in the well is assumed to be 112 m
(367 ft) below land surface, the depth at which water was first
encountered during drilling. The water level, measured one hour
before the start of the test, was 118 m (387 ft). Sufficient time
could not be allowed for the system to completely recover from the
fluid withdrawals during drilling. Two hours after recovery began,
when "-7- in figure 6 is equal to 2.92, the water level in the well
had nearly recovered to the static level.
Using the line slope from figure 6 and a Q of 600 m3 per day
(110 gpm), the calculation of T from equation 2 is equal to
Ik m3 per day (1,100 gpd per ft). Water density changes during o
the test are neglected. The magnitude of -r equal to 0.56 wasD
also evaluated from figure 6 at the line intercept with the static
5water level. Had r been unity, it would imply an artesian response6
to the applied stress with essentially two-dimensional flow and no
dewatering of the sediments. Actually, the prototype conditions
for this test and the others only begin to satisfy the basic
assumptions, and the quantitative results are, at best, a first
approximation.
Test 2
The second hydraulic test was made when the core hole was
^56.3 m (1,^96 ft) deep. The test interval extended from 111.5 m
(360 ft) to the bottom of the hole, ^56.3 * (1,^96 ft).
16
Two criteria, during drilling, prompted this hydraulic test.
First, well discharge had leveled off to air compressor limitation
(fig. k) and secondly, the core from this interval was highly
fractured and brecciated. All coring below the first test
interval (fig. 2) was in highly fractured and leached oil shale
of the upper Parachute Creek Member of the Green River Formation.
Ground-water circulation dissolved roost of the salt-filled vugs,
leaving a labyrinth of voids in the shale. Stress release in the
formation has resulted in collapse brecciation.
Coring in this interval was slow, with frequent short runs,
due to blocking of the core barrel. Similar lithology and drilling
conditions were encountered- in Colorado Core Holes 1 and 2. In
previous reports (Carrol, Coffin, Ege, and Welder, 196?; and Ege,
Carrol1, and Welder, 1967), this part of the oil shale sequence
is referred to as the incompetent zone or the zone of poor core
recovery.
The procedure for this test was similar to test 1. Air
injection through W; m (1,14-56 ft) of open-end drill stem jetted
the fluid to the surface. The jetting period began at 1300 hours
on October 26, 196? Discharge was continuously recorded at the
weir. At 1830 hours on October 26, water samples were collected
for chemical analysis. Equipment failure during the recovery
part of this test forced its abandonment. A second 6-hour jetting
period was started immediately. It began at 2200 hours on October 26,
1967, and continued until 0355 hours on October 27. Water was jetted
from the well at an average rate of 2,000 m3 per day (360 gpm).
17
Recovery data was measured for 6 hours from 0355 to 0955 hours
on October 27, 1967. For the first 60 minutes of the recovery period,
for -77 greater than 9«6 in figure 7> the response was very erratic.
The premature rise of the water level shown in figure 7 nay be
explained by density variations. Aerated water in the well bore
and drill stem is displaced by denser water from the formation.
The aerated water columns retain anomalous levels until the fluid
densities equilibrate. Additional error and scatter of the data
is introduced by the electrical measuring device. Frothing and
foaming at the water surface made the electrical water-level
indicator difficult to read accurately.
The recovery data in figure 7 began to approximate a straight
line after , reached 9.6. The slope of the line (7.1) and the
jetting rate of Q of 2,000 m3 per day (360 gpm) was used in
equation 2 to calculate T equal to 52 m3 per day (l»-,200 gpd per ft).
Test 3
A third hydraulic test was made at a depth of 633. k m (2,078 ft).
The test interval extended from 111.5 m (3&0 ft) to total depth.
Coring from lj-56-3 m (1,^96 ft) to 633- 1*- m (2,078 ft) penetrated
leached and fractured shale that progressively changed with depth
to dense unleached shale (fig. 2). The bottom of the leached zone
is believed to be the base-level of ground-water circulation. The
areal expanse of the leached zone is geologically restricted to
the massive deposition of salt deposits near the stratigraphic
center of the Piceance Creek Basin.
18
55 H i-l 5 o § a
60 TO 80 90Slope,
loAs
K C'
s/cle
1
- 7.
1
100
w PQ w
I 8
110
mtI
Static w
ater level
120
130
1010
0TI
ME RATIO
(t/t
«)
Figu
re 7» --Test
2,
USBM
-AEC
Colorado Core Hole 3,
1,000
In a report by Carroll, Coffin, Ege, and Welder (1967),
reference is made to the unleached oil shale as the competent zone,
the zone of good core recovery, and they show it correlative to
high resistivity on geophysical logs. The core barrel for the
first time was completely filled while coring the last 15 m
(50 ft) of the coring interval.
The unleached oil shale contains salt deposits as nodules
and beds. Many of the fractures in the shale are filled with salt.
The shale appears dense and impermeable. A solid bed of nahcolite
and halite, 2.5 ni (8 ft) thick, was encountered immediately below
the testr3 interval (fig. 2).
Test 3 is important in the evaluation of the Project Bronco
test site, for both safety and feasibility considerations. To make
the most of this test an additional three-stage Magcobar compressor
was added to the three compressors on location, nearly doubling
the capacity for jetting. The additional air made it possible to
jet the well at 3,000 m3 per day (550 gpm). The increase in
discharge, over test 2, was due to greater total submergence and
to an increase in thickness of the saturated media.
Below the leached zone, at a depth of 580 m (1,900 ft), the
formation is believed to be nearly impermeable to water movement
and not part of the effective aquifer system. Only by packing off
the leached zone, and jetting from below the packer, can the
transmissivity of the competent oil shale be tested. As it was,
the entire interval from 111.5m (360 ft) to 633-k m (2,078 ft)
was open to production.
20
Two suites of chemical samples were taken from the well.
Sample 68-635 was collected after 2^ hours of jetting at an average
rate of 2,700 m3 per day (k$Q gpm) through 630 m (2,066 ft) of open
drill rod. The second sample, 68-636, was collected during the
jetting period for test 3*
Jetting with both compressor units through k2f m (1,^00 ft)
of open drill rod began at 1230 hours on November 3, 1967, and
continued until 1200 hours on November ^, 1967 The average
discharge during the test was 3*000 m3 per day (550 gpm). The
tremendous force of both compressor units running wide open blew
some of the discharge beyond the sump. Most of the blowby was
measured with a 3"inch flume and added to the weir measurements.
The recovery period for this test began at 1700 hours on
November k, 1967* and continued for 12 hours. Figure 8 is a
semi-log plot of the recovery data. The slope of the line in
figure 8 and a Q of 3*000 m3 per day (550 gpm) were used in
equation 2 to calculate T equal to 75 m3 per day (6,000 gpd per ft).
This transmissivity (T) is considered reasonable despite density
effects in the early recovery data and fracture control of the
flow system.
Test k
Test U is perhaps the most important of the four tests for
site evaluation as it relates to Project Bronco feasibility. Rocks
in tho vicinity of the proposed shot point at 1,021 m (3*350 ft)
below land surface must contain the nuclear detonation and isolate
the rubble chimney from flooding and the possible spread of radio
active contamination.
21
120
s H H
a M
O
PM 3 a o C/3 I fxl
W i 8 B
125
Slope, -.
"°
. = T-3
r '
log
cycle
130
I
135
140
'
4
145
M ill9
10
Fig
ure
8
.
100
TIM
E R
ATI
O (t/
t1)
Tes
t 3,
USB
M-A
EC
Colo
rado
Cor
e H
ole
3.
The well was core drilled from 633.4 m (2,078 ft) to 1,011 m
(3,314 ft). The remainder of well was drilled with a rock bit to
total depth of 1,154.7 m (3,786 ft). Caving of the Douglas Creek
Member of the Green River Formation (fig. 2) forced termination of
drilling short of the objective depth of 1,190 m (3,900 ft).
According to the drilling contractor, past drilling experience
in the Piceance Creek Basin indicated that downhole explosions
during drilling occur when the bottom-hole pressure exceeds about 34.5
bars, equivalent to 500 psi (pounds per square inch). Pockets of raw
gas are known to occur in the lower part of the Parachute Creek Member
and in the sandy facies of the Douglas Creek Member of the Green River
Formation. It is highly probable that hydrostatic pressure above 34.5
bars (500 psi) relates to depth and the possible occurrence of gas
pockets, but it is doubtful that pressure alone is the catalyst of
downhole explosions.
In the interest of caution, the drilling contractor set 19.4-cm
(7-5/8-in) casing at a depth of 688.5 m (2,258 ft) (fig. 3), mainly to
relieve the working pressure on the compressors. Below the casing,
core drilling continued with dry air as a circulating medium. At a
depth of 951 m (3,120 ft) a sandstone facies of the Douglas Creek
Member called the Piceance Creek Sand by Ritzma (1956) yielded the first
occurrence of water below the casing. Detergent solution was immediately
added to the circulating system to prevent balling of the cuttings and
reduce rod friction. Other sandy layers interbedded in siltstones and
shale, encountered below 951 m (3,120 ft), also produce water. For test
4 the entire geologic section below 920 m (3,013 ft) to total depth is
assumed to be an effective aquifer unit (fig. 2).
23
Before test k was started, the well had caved-in below 989.1* m
ft) (fig. 2). As a safety precaution, the jetting rod for
the test was set at 975 m (3,200 ft), putting it above the caving
hazard. Jetting from the well began at 1615 hours on November 19,
1967 The recorded discharge rate declined very gradually during
the entire 12-hour jetting period. Since equilibrium was not
attained, it is likely that the well could eventually be blown dry.
The average recorded discharge during the jetting period was
60 m3 per day (ll gpm) with more than 600 m (1,970 ft) of drawdown.
The specific capacity, defined as the ratio of discharge to drawdown,
in consistent units, is less than 0.1. Chemical sample 68-638 was
collected at 0*100 hours on November 20, 1967* just before termination
of the jetting period.
Recovery data were measured for about lj days beginning at
0^30 hours on November 20, 1967. Figure 9 is a semi-log plot of
the recovery data. The slope of line in figure 9 and a Q of
60 m3 per day (ll gpm) were used in equation 2 to calculate T equal
to 0.01 ra2 per day (l gpd per ft). If the well bore had been clean
during this test, the transmissivity (T) might have been one order
of magnitude larger, 0.1 m3 per day (10 gpd per ft).
A water level of 305»5 m (1,002 ft) below land surface was
measured on November 19 j 1967, at 1600 hours. No fluid had been
jetted from the well since 0230 hours on November 18; thus, a partial
return to equilibrium resulted prior to the start of test U. The
water level after jetting was 267.7 m (878 ft) by 1226 hours on
November 21, 1967- Curvilinear projection of the final recovery measurements would place the static water level around 200 m (656 ft) below land surface. The projected static level was used in figure 9to evaluate -7 equal to 1.3. s
2k
200
ro
(0v_x
cn 25 H H
25
M
O
PH O CO H
300
500
600
700
H 80
0
900
-* it-
--
mm
niL
:::*
;1-:
:' :
s_
__
....
...:
::::
::
o i
_
L O
T
it, '
k ('
i 'L
*
1
i j 1 1 i » i
__
_.-
-...
..
,,,,
....
____.............
. i .
.. j , V*j 1 1
___--........,
. ,
, ..
.
Ml
r---- -
---..
..-..
-
f --
.
£>
caci
c w
ate
r ie
vei-
i ii ii
i i
j i j
i tin
i1
.3
...............
...
t i
T I
i J
H H'
-.--
-...}.
.
::::::
:..:.
:] jj
= :::+
_. 4
...:||
...:::
p .
j
r
0 A
s1
t::::
Slo
pe.
- r
=1
OP
f*
Vf*
l P
i ,
^1 '
J_
[ -
J'JI
t _
--.-
-. -.
...I.. ..
......
......
! '
f
- --
----
----
----
--
---
\ ill
-.-
-._.
......
......
.. . - .
n ' i
ij
L '.
' 1
&
1 1
.r
n r
. i
i T
' ii
^ .
. _
j ii_
f.....
. ...
. _
....
..:.
......
.....
i ...-
.::r
' . .
f ....
......
. ..
....
....
....:!
.!i.,,
,
:E;;;;
: EE
EEE::
:::;;;;;;;
:.;::;;:-;
::;!;
:^-^
==
T I u
t r
titt
r7 C
O
= 75
3 !
ri!
I
, " -
i "
r i'
'i
- -
i:::.
..::
::':.
:...
: }
._
.. ......
|In 1 1
__...........
.-1-------- "
' "J
T |
it
'
::::
:.::
:-.:
: j
1....
....
- ^ T
, .
. 0
0*®
o
>
.t-.
- -
)
........
j-
! j
t
II 1
4
1-
- -
- f*
t H
ft
. ....
,
. I
t
" 1L
HI
'::
::..
'. '
f :i
j"I
4 I
!l|
...T.
.+.r
'4
[-:;:
f '!
"" fr
-m-f
-W ii iii'F
r i
L ii]
-"ti'lt llj
I 'i 1
1 il
i .
. J
i 1 1
,00
0
Figure 9, Tes
t k
, US
BM-A
EC
Colo
rado
Core Ho
le 3
A summary of the hydraulic test data is shown in table 1. Results
of chemical analyses are presented in the next section.
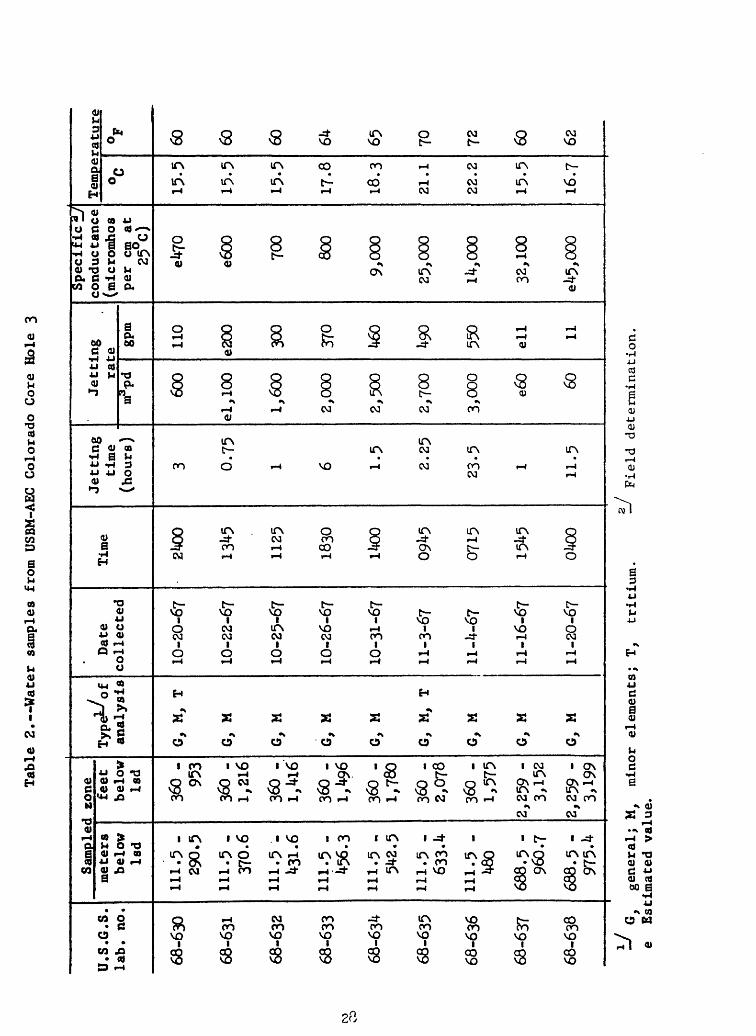
CHEMICAL ANALYSES OF CCH-3 WATER SAMPLES
Water samples were collected from various depths during the drilling
and testing of CCH-3. Table 2 describes the pertinent information relating
these samples to the hydrologic system and to each other.
The results of the general chemical analyses, table 3, show a
significant .increase in dissolved-solids content with depth. The
general trend is recognized even if the magnitude of change is somewhat
affected by recirculation within the well bore during sampling.
Analyses of samples 68-637 and 68-638 are distinctly different and
certainly originate from separate aquifers and lithologies. Water from
the deepest zone, sample 68-638, showed a reversal in the anion concen
tration of carbonate and bicarbonate. Both of these constituents had
been steadily increasing with depth (table 3). The chloride ion concen
tration of sample 68-638 increased five times in relation to the previous
sample (68~637). A sharp change in ionic ratios suggests the presence
of a geologic contact, somewhere between the two sampled intervals. The
bottom-hole water may be fluid derived from the original evaporite en
vironment.
The Denver Hydrogeochemical Laboratory, U.S. Geological Survey,
analyzed samples 68-630 and 68-635 for tritium content and reported
both samples below 400 tritium units. These analyses provide back
ground data to be used in assessing the effects of Project Bronco.
26
Table 1.--Summary of hydraulic-test data for USBM-AEC Colorado Core Hole 3
Interval tested, meters (feat) below Isd1-/
Static water level, meters (feat) below Isd^
Jetting depth, meters (feet) below Isd
Jetting pressure, bars (psi)
Jetting time, rain.
Air volume, m3 per day (cfm)
Average well / discharge,^/ ra3 per day (gpm)
Water level recovery period, min.
Transmissivity (T) n?per day (gpd per ft)
Estimated specific capacity , m3 per day per mdd^ (ffpm per ft dd)
S a/ S f
Test 1
111.5-290.5 ( 360-953)
112 (367)
283 (928)12. ti
(186)
2361*9 x 103 (1,200)
600(no)
123
I**(1,100)a/7.6
(0.1*2)
0.56
Test 2
111.5 -^56. 3 (360-1,1*96)
118 (387)
1*1*1* (1,^56)
20.1* (295)515
1*9 x 103 (1,200)
2,000 (360)
360
52(Moo)
Test 3
111.5 -633.^ (360-2,078)
121* (*07)
1*27 (1,1*00)
20.1 (292)
1,353100 x 10³ (2,500)
3,000 (550)
732
75 (6,000)
Test 4
920-1,15^.7 (3,018-3,786)
200 (656)
975 (3,198)10.3
(150)732
1*9 x 103 (1,200)
60 (11)
1,909
0.01(1)1/0.1
1.3
a/Land surface datum.Projected from recovery curves.Derated estimate.
MI Recorded by weir, corrected for losses.*^y Mdd, meter of drawdown; ft dd, foot of drawdown, ^ y After 1* hours. ^i After 12 hours.*J S, storage coefficient during pumping; S 1 , coefficient during recharge,
27
Table 2. Water sa
mple
s fr
om U
SBM-AEC
Colorado Co
re Hole 3
U.S
.G.S
. la
b.
no.
68-6
30
68-6
31
68-6
32
68-6
33
68-6
3^
68-6
35
68-6
36
68-6
37
68-6
38
Sam
pled
zon
em
eter
s be
low
la
d
111.
5 -
29
0.5
111.
5 -
370.
6
111.
5 -
lf31-
6
111.
5 -
i-56
.3
111.
5 -
5^2.
5
111.
5 -
633
A
111.
5 -
1*80
688.
5 -
960.
7
688.
5 -
975^
feet
belo
w
lad
360
- 95
3
360
- 1,
216
360
- 1,
IU6
360
- 1,
^96
360
- 1,
780
360
- 2,
078
360
- 1,
575
2,25
9 -
3,15
2
2,25
9 -
3,19
9
Ty
pe^of
an
aly
sis
G,
M,
T
G,
M
G,
M
G,
M
G,
M
G,
M,
T
G,
M
G,
M
G,
M
Dat
e coll
ecte
d
10
-20
-67
10
-22
-67
10
-25
-67
10
-26
-67
10
-31
-67
11-3
-67
11-^
-67
11-1
6-67
11-2
0-67
Tim
e
2i*0
0
13^5
1125
1830
itoo
09^5
0715
15^5
0*10
0
Jett
ing
tim
e (h
ou
rs)
3 0.7
5
1 6 1.5
2.2
5
23
.5
1 11.5
Jett
ing
rate
m3-p
d
600
el,
100
1,60
0
2,00
0
2,50
0
2,70
0
3,00
0
e60 60
gpm
110
e200 30
0
370
1*60
U90
550
ell 11
Spec
ific
I/
cond
ucta
nce
(mic
rom
hos
per
cm
at
25°c
)
el*7
0
e600 70
0
800
9,00
0
25,0
00
1^,0
00
32,1
00
e^5,
000
Tem
pera
ture
°C
15
.5
15-5
15-5
17
.8
18.3
21.1
22
.2
15
.5
16.7
°F 60 60 60 6k 65 70 72 60 62
ro
' G,
ge
nera
l; M,
mi
nor
elem
ents
; T,
tr
itiu
m,
e Estimated
valu
e.Fi
eld
determinatio
n.
Tsbie
3.--Chemical antlyset of
water fr
om USBH-ABC Co
lora
do Core
Hole 3
(Res
ults
In
milligrams
per
liter
exce
pt n in
dlcs
ted)
Ub.
no.
66-6
33
6S-6
31
68-6
32
68-6
33
68-6
31*
65-6
36
63-6
35
68-6
37
68-6
38
Si L
ie*
(Si<
fe)
21 21 16 15 17 16 18 21 17
Iron
(F«) 0.0
2
.05
.03
.03
.13
07
.21
10 lt.6
Cal
ci
um (c.)
12 10 5.6
5-2
k.l
i*.l
3.*
8.8
11
Mag
ne
sium (MS)
0.01 .0
2
<.0
1
<.0
i
.01
<.0
1
<.0
1
.12
.17
3o-
diu
a (H
.)
196
225
250
280
3,88
0
7,2
00
10,7
00
16,0
00
18,1
*00
Pota
s
sium U) 0.3 .1 .2 .1*
9.2
28 w 30 71
Lit
h
ium
(L
I)
0.06 .0
7
.06
.08
.6k
.83
1.5
2.5
3-3
Car
bo
n* ta
(C
O,)
16 li* 16 16 It22
118
684
5,10
0
3,21
0
Bic
sr-
bo
nit
e (H
CO
J
386
515
621
655
6,61
*0
18,6
00
26,8
00
31,5
00
i U, lo
o
Sul-
fa
te(s
oj 137
130 5U 1*0 28 25 21* It5 205
Chl
o
ride
(C
l) 6. >t
6.1*
6.3
5.9
29!*
7&0
1,18
0
3,70
0
18,8
00
Flu
o-
rid
e (F
l)
O.U
1.2 9."*
11.0
21*
28 3u 3-»»
2.8
Ni
tr
ate
(N
0a)
0.1 .0 .1 .1 .0 .0 .0 .0 .0
Bor
on
(B)
0.1
8
.25
38
.62
2.1
3-*
>t. 6
3.*
3-1
Ort
ho-
ph
oi-
p
hit
e (P
04)
O.0
1
<.0
1
<.0
1
<.0
1
2.2
»».7
7-3
7.0 .1
6
Str
on
ti
um
(»r)
3-7
3-7
1.6
l.lt .8
8
.86
.60
.08
U.U
Oil
solv
edlO
lld
l(r
esid
ue
st
180°
C)
602
717
718
70«t
8,90
0
17,5
00
26,5
00
37,8
00
1*8,
700
Har
dnes
s ss
CiC
O,
Csl
- ci
um»8g-
nesi
um 75 112 66 55 1*0 It2 32 63 267
Mon
- csr
- bo
n-
ate
0 0 0 0 0 0 0 0 0
Sp
ecif
ic
conduct
an
ce
(lim
bos
st
25°C
)
l.OltO
1,07
0
1,09
0
1,12
0
11,1
*00
20,2
00
27,5
00
39,7
00
50,3
00
PU 8.5 8.5
8.5
8.5
8. It
8.5
8.3
8.9
8.6
Per
ce
nt
lodlu
n
85 81 89 92 99 99 100
100 99
Sodi
um
sbso
rp-
tlon
rati
o
9-9
9-3
13-0
16.0
269.
0
1*86
.0
823.
0
877.
0
U90
.0
CHIMNEY FLOODING
The in-situ method of retorting oil shale, proposed in the Project
Bronco experiment, assumes a dry rubble chimney. Figure 10 illustrates
the anticipated geometry of the proposed chimney (U.S. Atomic Energy
Comm., 1967), and related hydrologic regime. Hydraulic testing of
CCH-3 indicates inflow into the chimney can be expected from below the
leached zone and from the leached zone itself if hydraulic continuity
is established. Each probable source of inflow is analyzed separately
using available mathematical models. In view of the complexity of
the hydrologic regime, the limited amount of available data and the
fact that the basic assumptions of the analytical models vary signifi
cantly from actual conditions, the predictions of chimney flooding should
be regarded only as first approximation. Use of other analytical models
and their application to data from the Piceance Creek Basin is under
consideration by the USGS. As additional knowledge and computation
techniques become available, the approximations can be revised.
Inflow to chimney from below the leached zone
Inflow to the chimney from below the leached zone is imperative.
The most favorable economic criteria for chimney flooding is to assume
complete confinement of both the rubble chimney and its fracture zone,
below 623.6 m (2,045 ft). Chimney development would remain within the
quasi-impermeable oil shales of the competent zone. Under such conditions,
inflow to the chimney would originate from a few porous sandstone lenses
in the Garden Gulch and Douglas Creek Members of the Green River Formation
2 (fig. 2). A transmissivity for this zone of 0.1 nr per day (1 gpd per ft)