Page 1 of 35 Forest Reference Emission Levels) for the Federal Republic of Nigeria: A Jurisdictional Approach focused on Cross River State Forest Reference Emission Levels (FRELs) for the Federal Republic of Nigeria: A Jurisdictional Approach focused on Cross River State (MODIFIED EDITION) Federal Republic of Nigeria Federal Department of Forestry Federal Ministry of Environment Federal Republic of Nigeria May 2018
Transcript
Page 1 of 35
Forest Reference Emission Levels) for the Federal Republic of Nigeria: A Jurisdictional Approach focused on Cross River State
Forest Reference Emission Levels (FRELs) for the Federal Republic of Nigeria: A Jurisdictional Approach focused on Cross River State
(MODIFIED EDITION)
Federal Republic of Nigeria
Federal Department of Forestry Federal Ministry of Environment
Federal Republic of Nigeria
May 2018
Page 2 of 35
Forest Reference Emission Levels) for the Federal Republic of Nigeria: A Jurisdictional Approach focused on Cross River State
CONTACT INFORMATION
National Coordinator, Nigeria REDD+ Programme
Federal Department of Forestry, Federal Ministry of Environment
Plot 393/394, Augustus Aikhomu way, Utako District, Abuja, Nigeria.
Forest Reference Emission Levels) for the Federal Republic of Nigeria: A Jurisdictional Approach focused on Cross River State
Table of Contents List of Figures ................................................................................................................................................................................................................. 4
List of Tables .................................................................................................................................................................................................................. 4
List of Acronyms ............................................................................................................................................................................................................. 4
2. FREL development process .................................................................................................................................................................................... 6
3. Scale of FREL: Area covered ................................................................................................................................................................................... 6
3.1 Geographical location and Vegetation of Cross River State .......................................................................................................................... 7
4. Scope: Activities, Pools and gases included ........................................................................................................................................................... 9
4.1 Activities included .......................................................................................................................................................................................... 9
4.2 Pools included .............................................................................................................................................................................................. 10
4.3 Gases included ............................................................................................................................................................................................ 10
5 Estimation of Historical Emissions ....................................................................................................................................................................... 11
5.1 Activity Data ................................................................................................................................................................................................. 11
5.2.2. Sample plots layout and data collection .................................................................................................................................................... 16
5.2.3 Data Analysis ........................................................................................................................................................................................ 17
5.2.4 Estimation of Carbon content .............................................................................................................................................................. 18
7. Transparent, complete, consistent and accurate information ............................................................................................................................... 21
7.1. Transparent information ................................................................................................................................................................................... 21
7.2. Complete information ....................................................................................................................................................................................... 21
7.3. Consistent information ..................................................................................................................................................................................... 21
7.4. Accurate information ........................................................................................................................................................................................ 21
7.4.1 Accuracy of the estimated activity data ..................................................................................................................................................... 21
7.4.2. Uncertainty of the estimated emission factor ........................................................................................................................................... 22
8. FREL/FRL Construction ............................................................................................................................................................................................. 22
8.1. Reference Period ............................................................................................................................................................................................... 22
8.2. Average Method ............................................................................................................................................................................................... 22
9. Areas for future improvement ................................................................................................................................................................................. 23
12. List of annexures .................................................................................................................................................................................................... 35
Page 4 of 35
Forest Reference Emission Levels) for the Federal Republic of Nigeria: A Jurisdictional Approach focused on Cross River State
List of Figures
Figure 1. Map of Nigeria showing the location of Cross River State (CRS) .................................................................................................................... 7
Figure 2. Landuse/Landcover Map of Cross River State (Adapted from NASRDA) ........................................................................................................ 8
Figure 4. Screenshots of Collect Earth Platform with High Resolution Image of a Reference Point ........................................................................... 14
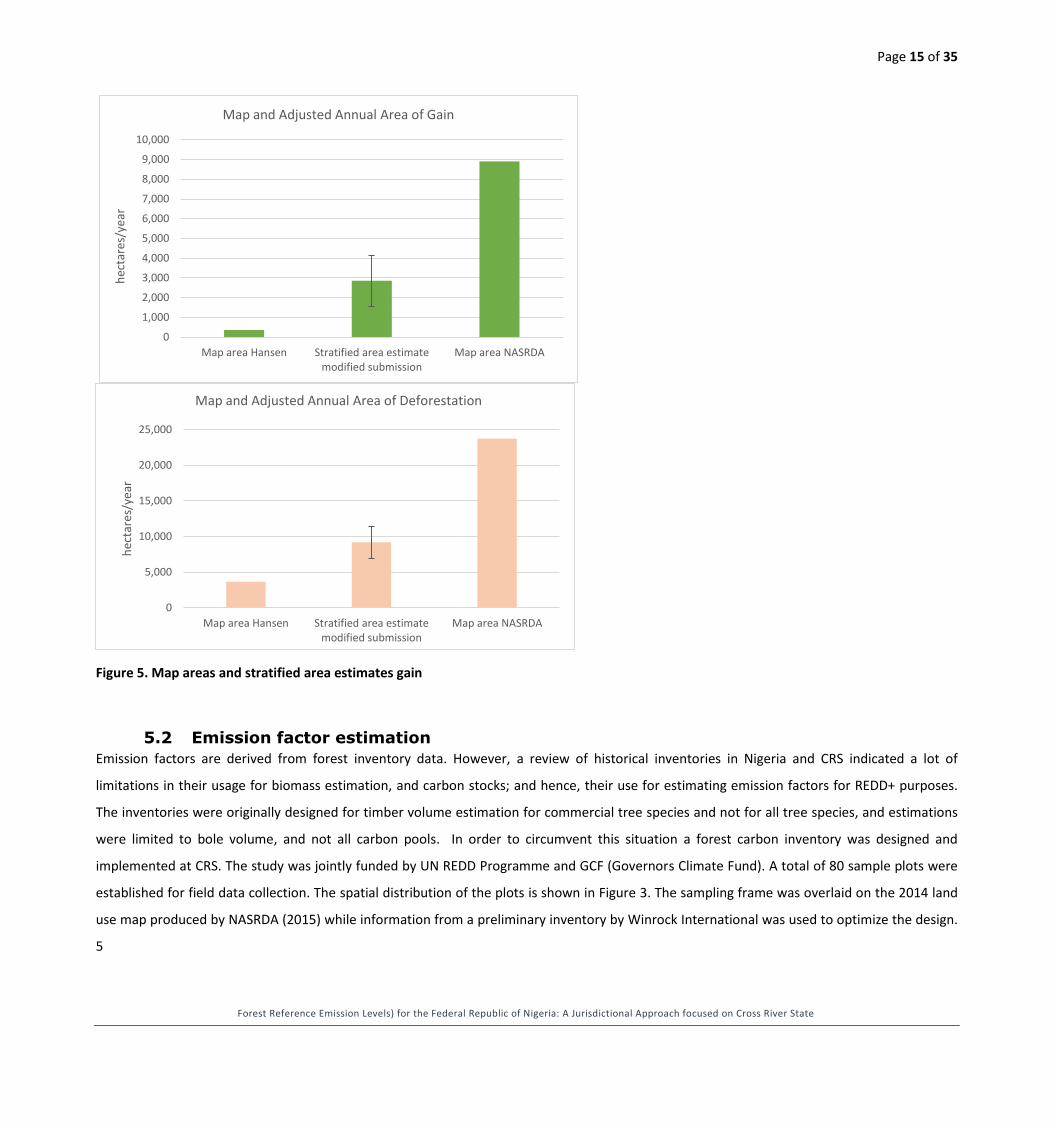
Figure 5. Map areas and stratified area estimates gain .............................................................................................................................................. 15
Figure 6. Spatial distribution of stratified sample plots used in estimating emission factors ..................................................................................... 16
Figure 7. Nested plot design for data collection .......................................................................................................................................................... 17
Figure 8. Transect sample plots for mangroves data collection .................................................................................................................................. 17
List of Tables
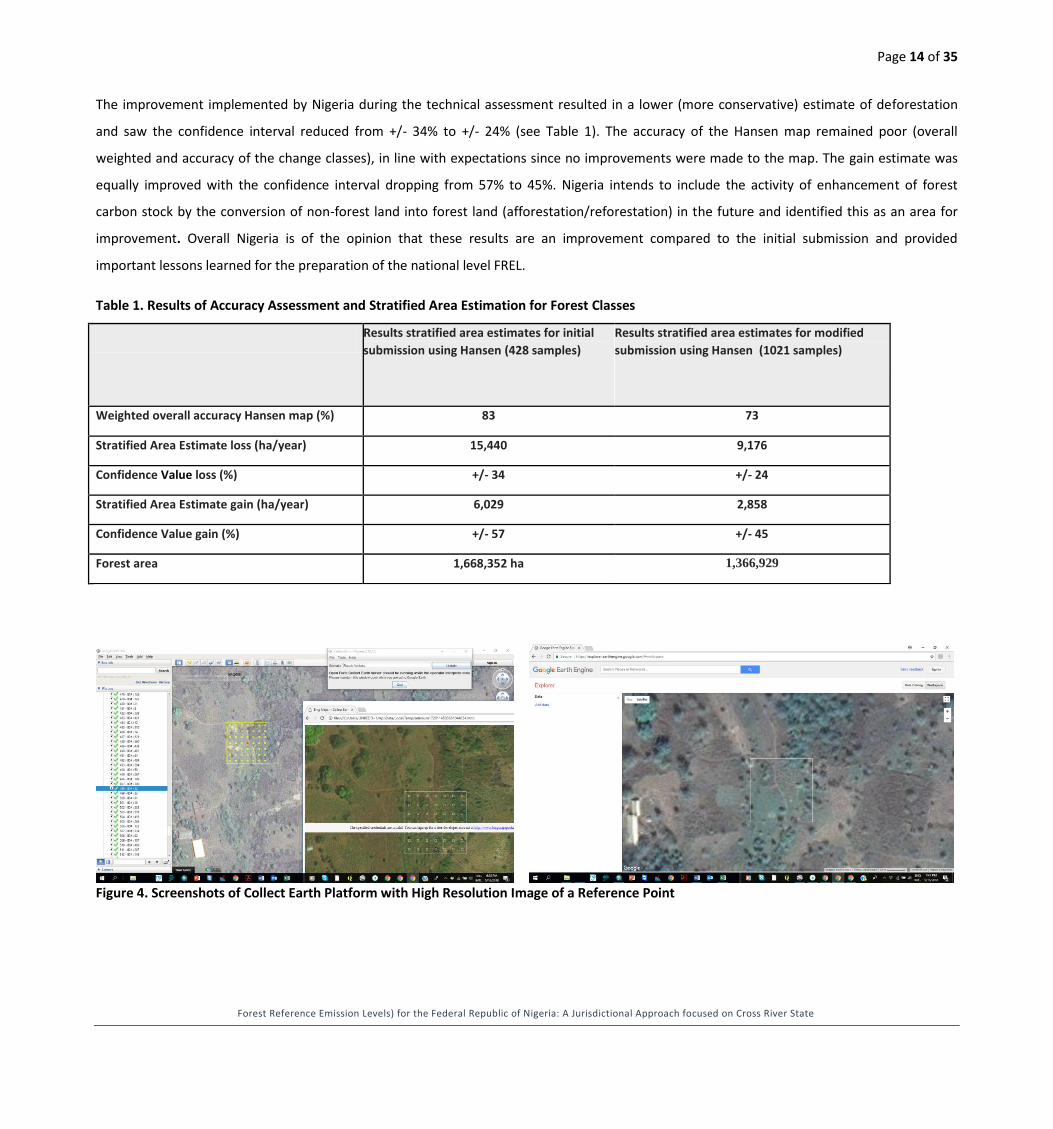
Table 1. Results of Accuracy Assessment and Stratified Area Estimation for Forest Classes ...................................................................................... 14
Table 2. Summary results for above ground biomass (AGB), below ground biomass (BGB) and carbon stocks for different forest types at Cross
River State .................................................................................................................................................................................................................... 18
Table 3. CRS Ecological zones and their Tree species .................................................................................................................................................. 20
Table 4. Uncertainty estimates (95% confidence intervals) for carbon pools by land use types ................................................................................ 22
Table 5. Summary of Total Annual Emissions .............................................................................................................................................................. 22
List of Appendices
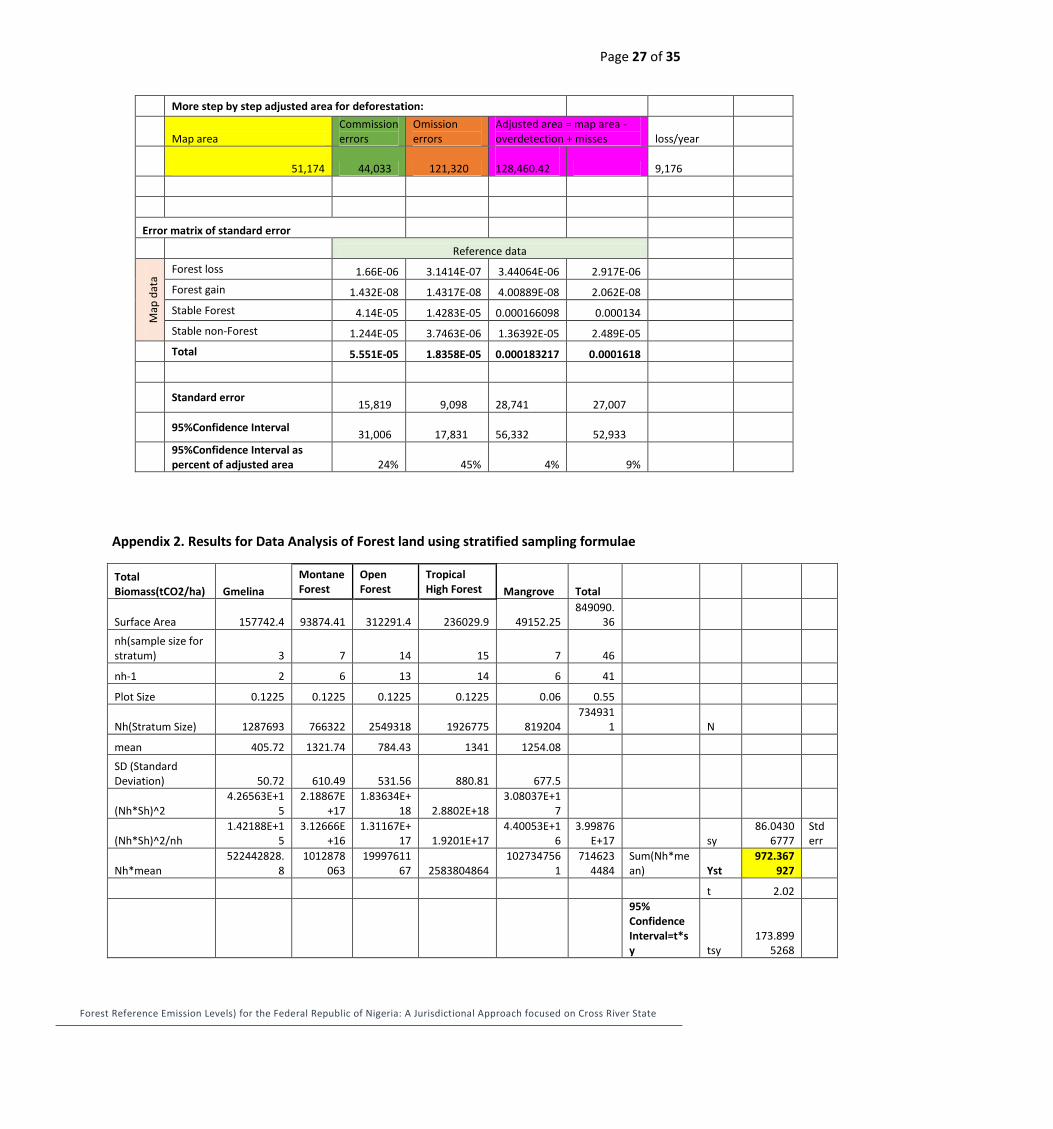
Appendix 1. Statistical details of the Stratified Area Estimation for Forest Gain and Forest Loss .............................................................................. 26
Appendix 2. Results for Data Analysis of Forest land using stratified sampling formulae .......................................................................................... 27
Appendix 3. Summary of FREL Development Process ................................................................................................................................................. 29
Appendix 4. List of participants at the drafting of the FREL ........................................................................................................................................ 31
Appendix 5. List of participants at the validation of the Draft FREL and Draft NFMS documents .............................................................................. 33
List of Acronyms AD Activity Data
CRS Cross River State
CRSFC Cross River State Forestry Commission
CRSMCCF Cross River State Ministry of Climate Change and Forestry
DCC Department of Climate Change
EFs Emission Factors
FAO Food and Agriculture Organisation of the United Nations
FME Federal Ministry of Environment FORMECU Forestry Monitoring and Evaluation Coordinating Unit
Forest Reference Emission Levels) for the Federal Republic of Nigeria: A Jurisdictional Approach focused on Cross River State
MCCF Ministry of Climate Change and Forestry
MRV Measurement, Reporting and Verification
NAGIS Nasarawa State Geographic Information Services
NASRDA Nigerian Airspace Research and Development Agency
NESREA National Environmental Standards & Regulations Enforcement Agency
NFI National Forest Inventory
NFMS National Forest Monitoring System
R-PP REDD+ Preparatory Proposal
SLMS Satellite Land Monitoring System
SPC State Planning Commission
UNFCCC United Nations Convention on Climate Change
Page 6 of 35
Forest Reference Emission Levels) for the Federal Republic of Nigeria: A Jurisdictional Approach focused on Cross River State
1. Introduction
The Federal Republic of Nigeria welcomes the invitation to submit a Forest Reference Emission Levels (FREL) on a voluntary basis as expressed in
Decision 12/CP.17, paragraph 13. This FREL submission is in the context of results-based payments for the implementation of reducing emissions
from deforestation and forest degradation, and the role of conservation, sustainable management of forests and enhancement of
forest carbon stocks (REDD+) under the United Nations Framework Convention on Climate Change (UNFCCC).
The government has followed the guidance provided by the UNFCCC through the decisions taken at the Conference of the Parties (CP), notably
the modalities for forest reference emission levels and forest reference levels in Decision 12/CP.17 and the guidelines for submission of
information on reference levels in the Annex of Decision 12/CP.17. This submission does not prejudge or modify any of Nigeria’s Nationally
Determined Contributions (NDCs) or Nationally Appropriate Mitigation Actions (NAMAs) pursuant to the Bali Action Plan.
The Government intends to take a step-wise approach to its national FREL development as stated in Decision 12/CP.17, paragraph 10. As such,
the current FRL reflects the best available information at the time of submission at sub-national level. The scope and methodologies applied can
be modified whenever improved data becomes available. The historical period considered, and/or the construction approach could also be
revised.
2. FREL development process The construction of the FREL was initiated during a workshop under the auspices and coordination of the Federal Ministry of Environment’s
Federal Department of Forestry from 24th to 26th May 2016, with support from the FAO-UN REDD Programme. The process was chaired by the
National Secretariat of REDD+ hosted within the Federal Department of Forestry. Stakeholders drawn from various ministerial departments,
universities and research institutions, NGOs, and CSOs from States and Federal Government participated in the workshop. Details of those
involved can be consulted in Appendices 5 and 6. The technical team for the construction of the FREL is composed of national foresters, natural
and environmental scientists, GIS and remote sensing experts drawn from relevant sectors and the mapping agencies of the Government, with
technical support from a team of experts and consultants from FAO.
The entire FREL process was also subjected to a wider stakeholder consultation and review to ensure that it reflects the expectations of all
stakeholders, and to also consider technical inputs from this broader group.
3. Scale of FREL: Area covered
While recommending that countries develop national FREL, the UNFCCC Conference of the Parties also decided that countries may start at sub-
national level as an interim measure, depending on national circumstances. Nigeria opted for a REDD+ programme in which the Cross River State
was selected as pilot State. Nigeria’s REDD+ Programme envisioned a two-track approach to achieve REDD+ readiness, based on: (i) the
development of institutional and technical capacities at Federal level, and (ii) consolidating four key UNFCCC requirements for REDD+ Readiness
Page 7 of 35
Forest Reference Emission Levels) for the Federal Republic of Nigeria: A Jurisdictional Approach focused on Cross River State
(Warsaw Framework for REDD+ elements) on a pilot basis in Cross River State: REDD+ Strategy, Safeguards Information System, Forest
Monitoring System, and Forest Reference Levels. The FREL has therefore been developed at CRS level as an interim measure.
The choice of CRS as pilot State was guided by the fact that it contains almost; 50% of the remaining tropical high forest in Nigeria, and secondly,
the forest policies and governance favoured forest conservation and management, with CRS Forestry Commission playing a crucial role.
3.1 Geographical location and Vegetation of Cross River State
Cross River State is situated between latitudes 5° 32'N and 4° 27'N and longitudes 7° 50’E and 9° 28'E (Figure 1) and occupies about 20,156 km2.
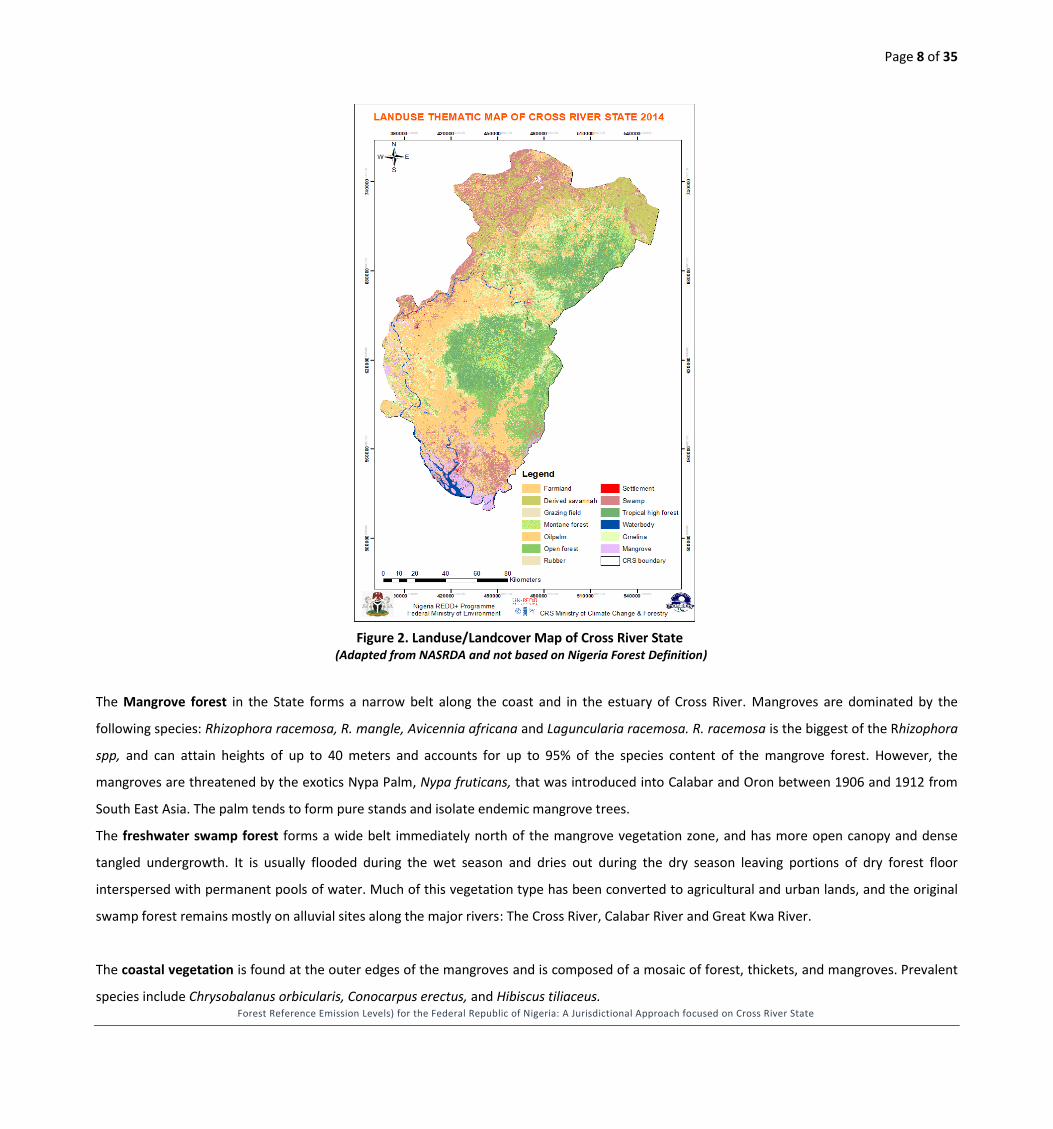
The ecological zones present in Cross River State (CRS) as documented by Oyebo et al. (2010) include: lowland rainforest, freshwater swamp
forest, the mangrove vegetation, coastal vegetation, montane vegetation, savanna like vegetation, and wetlands (Figure 2).
The lowland rain forest covers extensive areas in the centre, north and east of Cross River State, and is contiguous with the forests of South
West Cameroon. Although significant areas have been converted into agricultural farmlands and natural forests have been disturbed by
indiscriminate felling and wood removal, the State is still home to the largest contiguous and well-preserved fragments of natural forest in
Nigeria.
Figure 1. Map of Nigeria showing the location of Cross River State (CRS)
Page 8 of 35
Forest Reference Emission Levels) for the Federal Republic of Nigeria: A Jurisdictional Approach focused on Cross River State
Figure 2. Landuse/Landcover Map of Cross River State
(Adapted from NASRDA and not based on Nigeria Forest Definition)
The Mangrove forest in the State forms a narrow belt along the coast and in the estuary of Cross River. Mangroves are dominated by the
following species: Rhizophora racemosa, R. mangle, Avicennia africana and Laguncularia racemosa. R. racemosa is the biggest of the Rhizophora
spp, and can attain heights of up to 40 meters and accounts for up to 95% of the species content of the mangrove forest. However, the
mangroves are threatened by the exotics Nypa Palm, Nypa fruticans, that was introduced into Calabar and Oron between 1906 and 1912 from
South East Asia. The palm tends to form pure stands and isolate endemic mangrove trees.
The freshwater swamp forest forms a wide belt immediately north of the mangrove vegetation zone, and has more open canopy and dense
tangled undergrowth. It is usually flooded during the wet season and dries out during the dry season leaving portions of dry forest floor
interspersed with permanent pools of water. Much of this vegetation type has been converted to agricultural and urban lands, and the original
swamp forest remains mostly on alluvial sites along the major rivers: The Cross River, Calabar River and Great Kwa River.
The coastal vegetation is found at the outer edges of the mangroves and is composed of a mosaic of forest, thickets, and mangroves. Prevalent
species include Chrysobalanus orbicularis, Conocarpus erectus, and Hibiscus tiliaceus.
Page 9 of 35
Forest Reference Emission Levels) for the Federal Republic of Nigeria: A Jurisdictional Approach focused on Cross River State
The montane vegetation is predominant in the north eastern parts of the State on the Oshie Ridge of the Obudu Plateau around the border with
Cameroon to the east and Benue State to the north. The highest peak is about 1,819 m above sea level. The vegetation type includes the
lowland rain forest in the low lying areas progressively enriched with montane elements. The common woody plant species include Xylopia
Africana, Rauvolfia vomitoria, Tabernaemontana ventricosa, and Voacanga trouarsii.
The savanna-like vegetation, probably attenuated variants of degraded rainforest occurs in the central (Yakurr) and northern (Obudu) areas of
the State. These formations are characterized by relic rain forest species such as Celtis zenkeri, Cola gigantea, Anthonotha macrophylla and
Treculia africana.
The wetlands in Cross River State are found at the Cross River Estuary, the Cross River Flood Plains at Obubra as well as scattered swamps or
flood plains. They are made up of a mixture of seasonally flooded riparian lowland forests and tall grass swamps in the catchments of Cross River
and its Enyong creek tributary. Some of the plant species found in these wetland areas include: Nymphaea lotus, Vossia cuspidata, Echinochloa
pyramidalis, E. stagnina, Ragmites sp, Leersia hexandra, Ipomoea asarifolia and Mimosa pigra.
4. Scope: Activities, Pools and gases included
4.1 Activities included
The Cancun Agreement defines REDD+ activities as follows: reduction of emissions from deforestation, reduction of emissions from forest
degradation, sustainable management of forests, enhancement of forest carbon stocks, and conservation of forest carbon stocks. Deforestation
is the conversion of forest land to non-forest land (cropland, grassland, settlement, wetlands and other lands). Forestland is considered as in the
forest definition adopted for Nigeria (see section 6), and any conversion below the threshold of forest definition is considered deforestation.
Forest degradation results in the loss of carbon stocks and biodiversity in the forest remaining forests category, while enhancement is the
enrichment in carbon stocks and biodiversity in forest remaining forest. While forest degradation (from logging, fuel wood extraction, charcoal
production, forest fires, etc.) constitute a significant source of emissions, it has not been included in the present FREL due to lack of reliable,
accurate and consistent data at state and federal levels. However, it is envisaged that forest degradation will eventually be included in a
stepwise manner, as data becomes available. Nigeria considers the REDD+ activity “enhancement of forest carbon stocks” to be both enrichment
in carbon stocks in forest remaining forest, as well as enrichment in carbon stocks through afforestation/reforestation and natural regeneration
of forest.
The country has promoted natural forest restoration and plantation silviculture that leads to reduction in emissions from deforestation and
forest degradation. However, no reliable data on forest degradation is available, so this REDD+ activity has not been included in the present FREL
submission. There is also no reliable data for sustainable management of forests to be included. The area of afforestation (enhancement of
forest carbon stocks in forest land remaining forest land) was also assessed by Nigeria but the confidence value is currently very large and it still
needs to be investigated how to assess the associated removal factor from the NFI data. Hence, only deforestation has been considered in the
present FREL submission. Nigeria admits the fact that significant pools and/or activities should not be excluded from the FREL/FRL.
Page 10 of 35
Forest Reference Emission Levels) for the Federal Republic of Nigeria: A Jurisdictional Approach focused on Cross River State
4.2 Pools included
While IPCC recognises five carbon pools: above ground (live tree) biomass, belowground (live tree) biomass, deadwood (standing and
lying/down), litter, and soil organic carbon; only significant pools need to be included (cf. SBSTA Decision from COP17). Key category analysis is
needed to determine which carbon pools should be included to capture significant emissions and removals from changes in forest cover, taking
into account their magnitude and cost-effectiveness to monitor the pools. The above-ground biomass constitutes the main component/largest
pool and has been included in the FRELs/FRLs. Belowground biomass constitutes a significant pool however, its estimation is expensive and was
indirectly undertaken using IPCC default root-to-shoot (R/S) ratio. Deadwood may also constitute a significant pool to be included, however, the
deadwood pool was not consistently estimated during the inventory. The inventory undertaken measured standing deadwood but the
categories were not noted so it was difficult to analyze the data. Data for coarse woody debris (down deadwood) was collected but since
standing deadwood data was incomplete, the deadwood pool was left out of this submission see section 5.2. With the present inventory design
for national FRLs, data will be collected to estimate deadwood pool.
The 2006 IPCC Guidelines do not provide default values for deadwood (see Table 2.2: Chapter 2, IPCC 2006).
For tropical forests litter pools are usually small except for peatlands. According to the 2006 IPCC Guidelines, litter pool can be estimated at a
tier 1 level for deforestation. The 2006 IPCC Guidelines provide a default value of 2.1 tC/ha for tropical broadleaf deciduous forests (see Table
2.2: Chapter 2, IPCC 2006). This is barely about 1.2% of the above ground biomass (175tC/ha: see updated Table 2) or 0.8% of total above and
below ground biomass; and can be considered negligible or insignificant.
Soil organic carbon (SOC) is an important carbon pool, however major changes only occur when forest is converted to non-forest, and after a
long time.. The conversion of Forest Land to Cropland or other non-forest land uses as a result of deforestation can result in significant emissions
from the soil (IPCC 2006). According to the 2006 IPCC guidelines soil organic carbon should be estimated at a tier 1 level for all considered REDD+
activities; however this was not considered in this submission due to the data demands on the replacing landuse, its management and inputs on
which Nigeria would have to make major assumptions. According to the harmonized world soil database (HWSD: Batjes, 2009) Cross River has
mainly low activity clay (LAC) soils with some wetland soils in the coastal region and montane soils in the north east meaning emissions from
drainage of organic soils may be negligible.
Litter and non-herbaceous biomass pools constitute a small proportion of biomass and has not been included. For tropical forests litter pools are
usually small except for peatlands. According to the 2006 IPCC Guidelines, litter pool can be estimated at a tier 1 level for deforestation. The
2006 IPCC Guidelines provides a default value of 2.1 tC/ha for tropical broadleaf deciduous forests (see Table 2.2: Chapter 2, IPCC 2006). This is
barely about 1.2% of the above ground biomass (175 tC/ha: see updated Table 2) or 0.8% of total above and below ground biomass; and can be
considered negligible or insignificant.
4.3 Gases included
Among the three greenhouse gases associated with land use change emissions, namely carbon dioxide (CO2), methane (CH4), and nitrous oxide
(N2O), CO2 is the main gas emitted in the forest sector. However, significant non-CO2 gases (CH4 and N2O) can also be emitted when land use
Page 11 of 35
Forest Reference Emission Levels) for the Federal Republic of Nigeria: A Jurisdictional Approach focused on Cross River State
change is as a result of fire incidences. Unfortunately no data exist on forest fire. However, based on our knowledge of the region we can
conclude that fires are relatively controlled and not very frequent, as such emissions from fire are not expected to be significant. Methane is also
produced when mangroves are disturbed, but no data exist in Nigeria at the moment. Therefore, only CO2 emissions have been considered in
the present submission.
5 Estimation of Historical Emissions
IPCC (GPG 2003 and Guidelines for National GHG Inventories in AFOLU, 2006) provides the framework for estimating emissions and removals of
CO2 in the AFOLU sector. Two basic inputs needed are: Activity data (AD: i.e. changes in areal extent of forest land (ha/year)) and emission
factors (EF: that is, emissions/removals of GHG per unit area: tCO2/ha of deforestation). The product of AD by EF produces an estimate of the
amount of emissions/removals in a given year as a result of the activity.
IPCC present three approaches (1-3) for estimating AD and three Tiers (1-3) for estimating EF. The estimation of historical emissions therefore
requires estimates of historical activity data and emission factors.
5.1 Activity Data
Activity data is mostly obtained from land use change studies using satellite imagery. Several land use studies have been undertaken in Nigeria;
however, their use is limited due to the fact that they were sample-based (not ‘wall-to-wall’), and used different methodologies and
classification systems. The only study that produced wall-to-wall estimates of land use change was the 1976/78 and 1993/95 Vegetation and
Landuse Assessment by FORMECU, Federal Department of Forestry. The study also produced a national classification system for Nigeria that is
being used for reporting of global forest assessment (e.g. FRA2015 for Nigeria). In the absence of consistent datasets, the National Space
Research and Development Agency (NASRDA) of Nigeria was contracted by FAO to design and undertake a “wall-to-wall” spatially-explicit study
at Cross River State. The study led to the production of land use and land use change data and maps for 2000-2007-2014 time periods or epochs
(NASRDA 2015). The national classes were also aggregated into the six IPCC classes. However, change in the NASRDA map was assessed through
post-classification which risks to result in high uncertainties for the change assessed (Tewkesbury et al 2015). Initially accuracy assessment was
done only for each time period and not between time periods or for transitions. An initial verification of the change assessed by the map was
done comparing the loss found by NASRDA between 2000-2014 with loss found by the Global Forest Change product from the University of
Maryland (Hansen et al 2013) between 2000-2014. NASRDA assessed deforestation between 2000-2014 at 332,338 ha (or 23,738 ha/yr), while
the GFC map assesses 51,174 ha (or 3,655 ha/yr) for the same period. The large discrepancy between these two assessments suggested the
need for an accuracy assessment of change (loss) as assessed by both maps. The method proposed by Olofsson et al 2014 is applied to evaluate
whether one of the two maps could form an appropriate input for AD. The Olofsson method is described in the proceeding paragraphs.
For its January 2018 FREL submission, Nigeria performed an accuracy assessment on the NASRDA and global forest change map (also referred to
as Hansen map) for the classes stable forest, stable non forest, forest loss and forest gain. The overall weighted accuracy of both the NASRDA
map and the Hansen map, were 33% and 83% respectively. However, user and producer accuracy for loss and gain were low (<20%) for both
Page 12 of 35
Forest Reference Emission Levels) for the Federal Republic of Nigeria: A Jurisdictional Approach focused on Cross River State
maps providing an indication that neither of the map areas (or pixel counts) are sufficiently accurate to directly translate into AD. For this
reason, Nigeria proposes to use area statistics based on reference data following the procedure described in Olofsson et al 2014 which can be
considered a combination of a wall-to-wall map including change classes and sample-based reference data. In this method, one of the maps is
used to stratify the reference data points to be collected to ensure sufficient representation in the rare classes of change (forest loss and forest
gain). The resulting area statistics are referred to as stratified area estimations. Reference data concerns interpretations of satellite data of
greater quality with respect to both resolution and accuracy than remote sensing-based map data. GFOI (2016) suggests for accuracy assessment
and estimation to be valid for an area of interest using the familiar design or probability-based framework (McRoberts, 2014), the reference data
must be collected using a probability sampling design, regardless of how the training data used to classify for example a satellite image are
collected. Probability sampling designs to consider are simple random (SRS), systematic (SYS), stratified random (simple random sampling within
strata) or systematic sampling within strata (STR), and two-stage and cluster sampling. Nigeria used stratified random sampling using the Hansen
map for stratification into forest loss, forest gain, stable forest and stable non-forest. The minimum number of reference data points to be
collected per stratum were assessed following the formulas by Cochran (1977 in Olofsson et al 2014). This method assesses the accuracy of the
map and stratified area estimates based on the reference data with associated confidence intervals.
For the initial FREL submission in January 2018, Nigeria considered the period 2004-2014 in the submission seeking to be in line with the FCPF
methodological framework which suggests 10 years as the preferred historical period for a FREL. During the technical assessment of the initial
FREL submission, Nigeria decided to submit a modified FREL as an improvement on the initial submission. Since Nigeria found the accuracy of the
change classes in both the NASRDA and Hansen maps to be poor, it started to create a new and improved direct change detection for a more
accurate map. As the country was creating mosaics for the two years marking this period, it was discovered that no sufficient good quality
imagery was available around the year 2004. As such, due to technical constraints, the period 2000-2014 was selected instead. The direct change
detection was started by Nigeria in the SEPAL platform (https://sepal.io) but has not been finalized in time for the modified FREL submission,
reason why currently Nigeria used the Hansen map for stratification for its modified FREL submission. Creating a more accurate map of forest
area change is identified by Nigeria as an area for improvement and the country intends to continue to work on this.
Nigeria created a map with stable forest, stable non-forest, forest loss and forest gain based on the Hansen map with a tree cover threshold of
15% and a loss period from 2000-2014 (Figure 4). The AD is however derived from the reference data, the Hansen map is only used for
stratification and the final estimates do not correspond to the areas in the Hansen map. The map in Figure 4 most likely included loss of forest
cover where trees grow back and the use remains forest, i.e. it will likely include temporary destocked forest lands (unless the forest was lost
shortly after the year 2000 and cover was restored in the year 2014). As there’s quite some oil palm plantations, including older stands, in Cross
River State, harvesting of these (i.e. cropland remaining cropland) could result in false detection of forest loss in the map since oil palm could be
incorrectly detected as forest. This necessitates the use of visual interpretation to ensure a land use classification rather than a land cover
classification. As explained, for the collection of its AD, Nigeria used the stratified area estimator approach, a methodology which is explained in
Olofsson et al 2014. In this approach, the actual data collection was based on reference data which was stratified along the classes in the map.
For the collection of reference data, Nigeria used all available imagery including 2016 imagery, if available of high resolution. In case the imagery
Page 13 of 35
Forest Reference Emission Levels) for the Federal Republic of Nigeria: A Jurisdictional Approach focused on Cross River State
revealed replanting or restoration with tree sapling establishment the reference samples are interpreted as stable forest. Therefore, we expect
the deforestation estimate not to include temporarily destocked forest or to a minimal extent.
Forest Reference Emission Levels) for the Federal Republic of Nigeria: A Jurisdictional Approach focused on Cross River State
*Forest Land values were calculated as a weighted average of the means from the different forest type estimates.
6. Forest Definition
When submitting a FRELs/FRLs to the United Nations Framework Convention on Climate Change (UNFCCC), countries are expected to provide a
definition of what they mean by forest in their FREL/FRL construction and, demonstrate how the definition is in line with the definition used in
the national GHG inventory or in other international reporting. Forest definition in the context of REDD+ has to take into account UNFCCC
thresholds which are currently defined as follows:
- Minimum tree crown cover between 10 and 30%
- Minimum land area between 0.05 and 1 hectare
- Minimum tree height between 2 and 5 meters (at maturity in situ)
Nigeria had no country-specific forest definition, but had been using the FAO FRA default definition for forests, which is defined as follows:
“Land spanning more than 0.5 hectares with trees higher than 5 meters and a canopy cover of more than 10 percent or trees able to reach these
thresholds in situ. It does not include land that is predominantly under agricultural or urban land use”.
During the workshop of 24th to 26th May 2016, participants went through brain storming sessions in order to craft a forest definition for FREL
purposes. An initial stage involved an appraisal of existing definitions and/or descriptions of forest in the forest laws, policies and Acts and other
documents. After general heated discussions, a technical working group was tasked to work on the draft version (see Appendix 5). They
explored and reviewed some policy documents, at Federal and State levels, in order to have an in-depth understanding of what the law and
policies documents consider as forest across the different States. Based on the above background information, participants arrived at the
following functional forest definition for FREL/FRL in Nigeria.
An ecological community predominated by trees and other layers of woody plants with a minimum area of 0.5ha, a minimum tree height of
3metres, and a minimum tree canopy cover of 15%, or stands with potentials to reach the above thresholds in situ.
The above Forest Definition applies to the entire country and was provided after due consideration for the ecological variations including the
characteristic strong latitudinal zones which become progressively drier as one moves north from the coast. In other words, the definition
has to a large extent, taken care of the progressive variations from the Mangrove Swamp and Coastal Vegetation in the south to the Sahel
Savanna in the north. It is important to note that, the definition would be used in future GHG inventory reporting such as national
communications and the Biennial Update Reports (BUR).
Page 20 of 35
Forest Reference Emission Levels) for the Federal Republic of Nigeria: A Jurisdictional Approach focused on Cross River State
Table 3. CRS Ecological zones and their Tree species
S/N Ecological zones
Area (Km2)
Description
1 Lowland
Rain Forest
8,307 Characteristically stratified into three layers: 1) the upper or emergent layer ( 40 to 50 m high) consists of scattered, very tall
trees that do not form a continuous canopy, 2) the middle layer (16 to 40 m high) is also discontinuous, but taken together
with the upper layer forms a continuous canopy, and 3) the lower tree layer (10 to 16 m high) forms a more or less
continuous canopy below the tree layers are the shrub and herb layers that contain more young trees and seedlings than
mature shrubs the drier northern areas are characterised by the presence of the Sterculiaceae family (e.g.,
Triplochitonscleroxylon, Sterculia tragacantha, S. rhinopetala, S. oblonga, Nesogordonia papaverifera, Mansonia altissima,
Cola gigantea, C. millenii, Pterygota macrocarpa,Hildegardia barteri) and Terminalia superba, Ricinodendron heudelotii,
Aubrevillea kerstingii and Khaya grandifoliola • the families Ulmaceae and Moraceae are also well represented by Celtis
brownii, C. mildbraedii, C. zenkeri, Holoptelea grandis, Trema guineensis, Morus mesozygia, Chlorophora excelsa, Antiaris
a.fricana, Ficus spp. and Bosqueia angolensis
• some species (i.e., Triplochiton scleroxylon and Terminalia superba) also extend into the wetter parts of the Lowland Rain
Forest where they usually behave as serval species colonizing open abandoned farmland
• in the wetter, more southern areas of the Lowland Rain Forest Ecological Zone, the families Meliaceae and Leguminosae
are predominant
• common species are the valuable mahogany timbers (Khaya ivorensis, Entandrophragma spp., Lovoa trichilioides, Guarea
cedrata and G. thompsonii) and leguminous trees such as Cy/icodiscus gabunensis, Gossweilerodendron balsamiferum,
Hylodendron gabunense, Distemonanthus benthamianus and Piptadeniastrum a.fricanum
• in wetter coastal areas the family Sapotaceae (i.e., Mimusops spp., Omphalocarpum spp.) assumes an important place, and
the timber trees Lophira alata and Nauclea diderrichii are often abundant
2 Freshwater
Swamp
Forest
438 • most extensive freshwater wetland type found in Nigeria
• consist entirely of slender trees (30 to 50 m high) many of which have stilted roots typically, the main canopy is rather open
and in the gaps, dense tangles of shrubs and lianes form an almost impenetrable undergrowth • climbing palms
(Ancistrophyllum, Eremospatha and Calamus) with hooked spines are particularly characteristic as are clumps of aroids such
as Cyrtosperma senegalense
• large trees (up to 45 m tall) such as Mitragyna ci/iata, Spondianthus preussii, Lophira alata, (on better drained parts only),
Anthostema aubryanum, and Alstonia congensis occur together with smaller trees (up to 20 m tall) such as Nauc/ea gilletii,
Berlinia auriculata, Grewia coriacea, Uapaca spp. and Carapa procera
• a number of the trees have stilt roots
• the outer fringe vegetation is less than 14 m high and is composed mostly of Raphia palm with Lonchocarpus griffonianus
• :in creeks and lagoons the waterlily Nymphaea lotus is often abundant, so too are floating
communities of Pistia stratiotes, Lemna, Salvinia (a tiny water fern), Jussiaea repens vardiffusa, species of Ipomoea and
Impatiens, and grasses
3 Montane
Forest
113 • located above altitudes of 1000 m
• characterised by a tree canopy that is often irregular and discontinuous
• composed of such species as Polyscias ferruginea, Entandrophragma angolense,
Turraeanthus africanus and at higher altitudes Schejjlera hookeriana, and species of Ficus and Conopharyngia
• may be referred to as "mist forest" because it is commonly enveloped in mist for long
periods of time which results in a profusion of mosses and various kinds of epiphytes such as orchids and begonias
• tree fern (Cyathea manniana) is abundant especially in more open areas
• at 1500 to 1800 m the forest is drier and more stunted - Syzygium staudtii, Schejjlera abyssinica, S. mannii, Lachnopylis
mannii and Pittosporum mannii are typical trees • lichens beard the tree branches
• tall, shrubby Acanthaceousplant Mimulopsis violacea, plus one or two other Acanthaceae, form an extensive understorey
• this class also includes the transition area between true forest and montane grasslands, where marginal forest and thickets
are more dominant than grassland
• marginal forest occurs in clumps and along old lava streams
• in marginal forest Lasiosiphon, Hypericum and Agauria cover considerable areas - all trees are covered with masses of
white lichen.
• the shrub Mimulopsis is often dominant in the marginal forest
• dense 2 m high thickets of Adenocarpus mannii are extremely common and are associated with lndigofera atriceps,
Hypericum, Philippia and Myrica
• thickets of Philippia, up to 3 m high, mixed with stunted Hypericum, Agauria and Myrica also occur along old lava streams
4. Mangrove
Swamp
and
383 • occurs on the muddy banks of creeks and in tidal channels in the upper portion of the zone of saltwater influence where the
water is brackish
• three species of Rhizophora (red mangrove) with their stilted roots are dominant and include:
R. mangle, R. racemosa and R. harrisonii
Page 21 of 35
Forest Reference Emission Levels) for the Federal Republic of Nigeria: A Jurisdictional Approach focused on Cross River State
Coastal
Vegetatio
n
• white mangrove (Avicennia nitida) and the shrub Laguncularia racemosa are much less abundant
• each species requires different growing conditions to thrive, thus forming separate communities
• Rhizophora racemosa is the most common species, it is usually found at the edge of the alluvial salt swamp and may reach
a height of 45 m
• often cut for fuel wood, R. racemosa rarely reaches maturity and forms a dense tangle, up to 9 min height
• R. harrisonii prefers the wetter areas of the mangrove forest
• R. mangle is found only on the drier, inner limit of the Rhizophora zone and grows as a healthy shrub, up to 5 m high
5. Derived Savanna
167 The northern limit of the Derived Savanna Ecological Zone is the probable climatic limit of the Lowland Rain Forest
Ecological Zone. The impact of man has been so intense in this area that areas left to regrow tend to grow savanna type
grasses that are susceptible to fire and therefore they limit the lowland species that can regenerate in this area, creating a
"derived savanna". Remnants of the high forest may be present in upland or rocky areas that are not suitable for agriculture.
This zone is found in a densely populated east-west band between the Guinea Savanna and the Lowland Rain
Forest ecological zones.
Source: The Assessment of Vegetation and Landuse Changes in Nigeria (FORMECU/FDF, 1995)
7. Transparent, complete, consistent and accurate information
7.1. Transparent information
During the development of the FREL document, all processes followed and methodologies used for the estimation of activity data and emission
factors were documented in a transparent manner. Some information is provided in the appendices to this document. All maps used for
estimating activity data have been referenced, and both metadata and spatial datasets are available in a spatial database. Also for the
estimation of emission factors, based on forest inventory data, all calculations have been done in a transparent manner. The spreadsheets are
available, and some detail results have been included in the Appendix to this document.
7.2. Complete information
Annex I in Decision 12/CP.17 indicates that complete information means information provided that allows for the reconstruction of forest
reference emission levels and/or forest reference levels. All information used in the context of the construction of the present FREL has been
developed by Nigeria, and allows for the reconstruction of the FREL and is publicly available. Nigeria also ascertains that all information used for
the construction of Nigeria’s FREL will be uploaded to the website and is available for download.
7.3. Consistent information
Consistency with the national greenhouse gas inventory paragraph 8 in Decision 12/CP.17 establishes that FRELs and/or FRLs shall maintain
consistency with anthropogenic forest related greenhouse gas emissions by sources and removals by sinks as contained in the country’s national
greenhouse gas inventory. Compared to the second National GHG Inventory (NGHGI) submitted by Nigeria in its Second National
Communication, there was no clear forest definition used. The second NGHGI did not include a forest definition and was using data available at
the time which concerning forests is likely to have been focussed on tropical high forest only.
7.4. Accurate information
7.4.1 Accuracy of the estimated activity data
The qualitative assessment of land use maps for the years 2014 produced from the spatially explicit study by NASRDA (2015) was done. Same
process was repeated for Hansen maps for the purpose of comparison. The results of the comparative analysis informed the decision to opt for
Page 22 of 35
Forest Reference Emission Levels) for the Federal Republic of Nigeria: A Jurisdictional Approach focused on Cross River State
Hansen datasets for the creation of new change layer through direct change assessment using FAO-SEPAL platform at FAO Rome. Reference data
were generated by Nigeria REDD+ technical team for the accuracy assessment using NASRDA and Hansen maps stratifications. (Appendix 1)
7.4.2. Uncertainty of the estimated emission factor
The estimation of emission factors is associated to many sources of uncertainty, including the use of default values, sampling errors and bias
from field measurements, etc. All biomass estimates (Table 2) from the inventory were reported with 95% uncertainty values associated with
the estimates (Appendix 2). Also, Table 3 gives 95% uncertainty estimates for above and below biomass carbon pools for different land use
types. The Derived savannah has a very high uncertainty values (> 100%), followed by farmland
(>70%), Swamp (>60%) and mangroves (>40%). The high uncertainties are also linked to the small sample sizes for those land uses. However, the
weighted average for all forest land estimates has an uncertainty value of 17.2%.
Table 4. Uncertainty estimates (95% confidence intervals) for carbon pools by land use types
Land use Type ABG tCO2/ha
BGB tCO2/ha
Total Biomass tCO2/ha
Derived Savanna 133.0% 135.9%
133.9%
Farmland 70.5% 70.5%
70.5%
Gmelina 33.4% 26.3% 31.1%
Montane 34.6% 34.6% 34.6%
Open Forest 38.4% 40.6% 39.1%
Swamp 68.0% 68.0% 68.0
Tropical High Forest 35.8% 37.7% 36.4%
Mangroves 55.3% 44.3% 50.0%
Forest Land (Weighted Average) 17.2% 17.2% 17.2%
8. FREL/FRL Construction
8.1. Reference Period
The initial reference period will include data from 2000 to 2014, and annual historical deforestation rates will be considered during this period.
8.2. Average Method
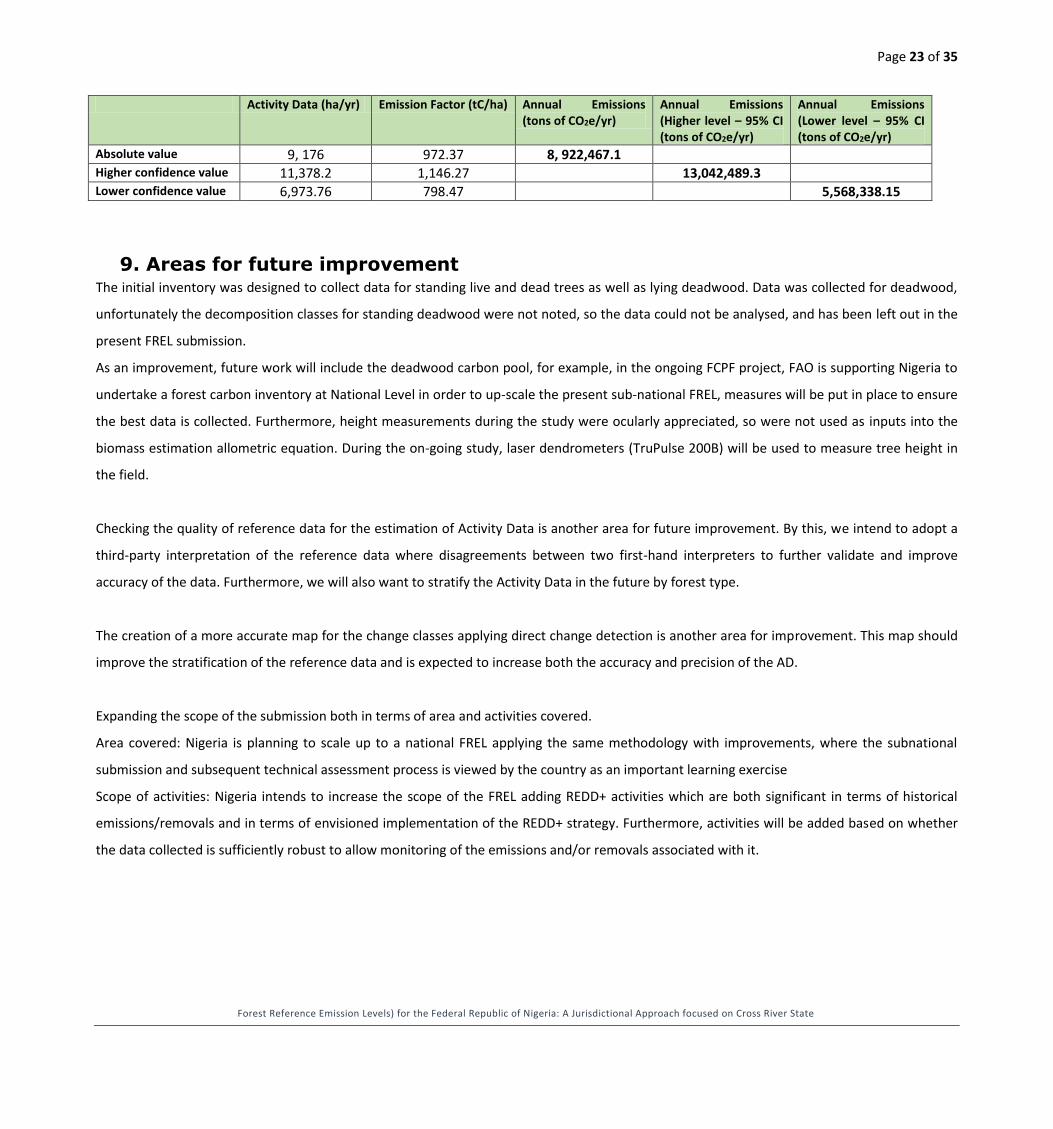
The calculations gave a weighted average CO2 equivalent of 972.37±173.9 tons of CO2e/ha (Se=17.9%=Uncertainty); and the GFC estimated
annual deforestation rate for the period 2000-2014 was 9,176 ± 24% ha/yr (Activity Data).
Therefore, the annual emissions for the period 2000-2014 was estimated as the product of the average annual deforestation (Activity Data: AD)
and the estimated CO2 e per hectare (Emission Factor) as follows:
Annual Emissions [Total Biomass] = AD x EF = (9,176 x 972.37 = 8, 922,467.1± tons CO2e/yr; and the 95% confidence interval is [13,042,489.3 or
5,568,338.15] tons CO2e/year.
Table 5. Summary of Total Annual Emissions
Page 23 of 35
Forest Reference Emission Levels) for the Federal Republic of Nigeria: A Jurisdictional Approach focused on Cross River State
Activity Data (ha/yr) Emission Factor (tC/ha) Annual Emissions (tons of CO2e/yr)
Annual Emissions (Higher level – 95% CI (tons of CO2e/yr)
Annual Emissions (Lower level – 95% CI (tons of CO2e/yr)
Absolute value 9, 176 972.37 8, 922,467.1 Higher confidence value 11,378.2 1,146.27 13,042,489.3 Lower confidence value 6,973.76 798.47 5,568,338.15
9. Areas for future improvement The initial inventory was designed to collect data for standing live and dead trees as well as lying deadwood. Data was collected for deadwood,
unfortunately the decomposition classes for standing deadwood were not noted, so the data could not be analysed, and has been left out in the
present FREL submission.
As an improvement, future work will include the deadwood carbon pool, for example, in the ongoing FCPF project, FAO is supporting Nigeria to
undertake a forest carbon inventory at National Level in order to up-scale the present sub-national FREL, measures will be put in place to ensure
the best data is collected. Furthermore, height measurements during the study were ocularly appreciated, so were not used as inputs into the
biomass estimation allometric equation. During the on-going study, laser dendrometers (TruPulse 200B) will be used to measure tree height in
the field.
Checking the quality of reference data for the estimation of Activity Data is another area for future improvement. By this, we intend to adopt a
third-party interpretation of the reference data where disagreements between two first-hand interpreters to further validate and improve
accuracy of the data. Furthermore, we will also want to stratify the Activity Data in the future by forest type.
The creation of a more accurate map for the change classes applying direct change detection is another area for improvement. This map should
improve the stratification of the reference data and is expected to increase both the accuracy and precision of the AD.
Expanding the scope of the submission both in terms of area and activities covered.
Area covered: Nigeria is planning to scale up to a national FREL applying the same methodology with improvements, where the subnational
submission and subsequent technical assessment process is viewed by the country as an important learning exercise
Scope of activities: Nigeria intends to increase the scope of the FREL adding REDD+ activities which are both significant in terms of historical
emissions/removals and in terms of envisioned implementation of the REDD+ strategy. Furthermore, activities will be added based on whether
the data collected is sufficiently robust to allow monitoring of the emissions and/or removals associated with it.
Page 24 of 35
Forest Reference Emission Levels) for the Federal Republic of Nigeria: A Jurisdictional Approach focused on Cross River State
10. References Ajonia G.N. 2008. Inventory and Modelling Mangrove Forest Stand Dynamics following different levels of wood exploitation
pressures in the Douala-Edea Atlantic Coast of Cameroon. PhD Thesis. Albert-Ludwig-Univers sitat Freiburg im Breisgau, Germany.
Alemayehu, F., Richard O., Mwangi J. K., and Wasonga O. 2014. Assessment of Mangrove Covers Change and Biomass in Mida Creek, Kenya.
Open Journal of Forestry, 2014, 4, 398-413
Avery, T.E. and Burkhart, H. 2002 Forest Measurements. Mcgraw-Hill Ryerson, pp. 1 –480.
Chao K-J, Phillips O.L., and Baker T.R. 2008. Wood density and stocks of coarse woody debris in a northwestern Amazonian landscape. Chave, J., Andalo, C., Brown, S., Cairns, M.A., Chambers, J.Q., Eamus, D., Fölster, H., Fromard, F., Higuchi, N., Kira, T. et al. 2005. Tree
allometry and improved estimation of carbon stocks and balance in tropical forests. Oecologia 145 : 87-99.
Chave, J., Réjou-Méchain, M., Búrquez, A., et al., 2014. Improved allometric models to estimate the aboveground biomass of tropical trees.
Glob. Change Biol. 20, 3177–3190. Feldpausch, T.R., Lloyd, J., Lewis, S.L., Brienen, R.J.W. et al. 2012. Tree height integrated into pantropical forest biomass estimates.
Biogeosciences 9, 3381–3403. Freese F. 1976. Elementary Forest Sampling. Agriculture Handbook No. 232. U.S. Department of Agriculture. Southern Forest Experiment
Station, Forest Service. USA. 95 Pages. FORMECU, 1998. The Assessment of Vegetation and Landuse Changes in Nigeria. Geomatics International Inc. for Federal Department of
Forestry, Abuja, Nigeria Hansen M. C., Potapov P. V., et al., Moore R., 2013. High-Resolution Global Maps of 21st-Century
Forest Cover Change. Department of Geographical Sciences, University of Maryland, College Park, MD 20742, USA. Google,
Mountain View, CA, USA. IPCC 2006, 2006 IPCC Guidelines for National Greenhouse Gas Inventories, Prepared by the National Greenhouse Gas Inventories Programme,
Eggleston H.S., Buendia L., Miwa K., Ngara T. and Tanabe K. (eds). Published: IGES, Japan. Kauffman J.B. and Donato D.C. 2012. Protocols for the measurement, monitoring and reporting of structure, biomass and carbon
stocks in mangrove forests. Working Paper 86, CIFOR, Bogor, Indonesia. 50 pages.
Keay, R. W .J. 1949. An outline of Nigerian vegetation; Nigerian Forestry Department, Government Printer, Lagos, 52p.
Komiyama, A., Poungparn, S., Kato, S. 2005 Common allometric equations for estimating the tree weight of mangroves. Journal of Tropical Ecology 21: 471-477.
Komiyama, A., Ong, J.E., Poungparn, S. 2008 Allometry, biomass, and productivity of mangrove forests: A review. Aquatic Botany 89: 128-137.
Mokany, K., Raison, R.J., Prokushkin, A.S., 2006. Critical analysis of root: shoot ratios in terrestrial biomes. Global Change Biol. 12, 84–96.
Olofsson P., Giles M. Foody, et al., 2014. Good practices for estimating area and assessing accuracy of land change Tewkesbury, A.P., Comber, A.J., Tate, N.J., Lamb, A. & Fisher, P.F. 2015. A critical synthesis of remotely sensed optical image change detection
techniques. Remote Sensing and Environment, 160 (2015): 1–14.
Page 25 of 35
Forest Reference Emission Levels) for the Federal Republic of Nigeria: A Jurisdictional Approach focused on Cross River State
Zanne, A.E., Lopez-Gonzalez, G., Coomes, D.A., Ilic, J., Jansen, S., Lewis, S.L., Miller, R. B., Swenson, N.G., Wiemann, M.C., Chave, J., 2009. Towards a worldwide wood economics spectrum.
Page 26 of 35
Forest Reference Emission Levels) for the Federal Republic of Nigeria: A Jurisdictional Approach focused on Cross River State
11. Appendices
Appendix 1. Statistical details of the Stratified Area Estimation for Forest Gain and Forest Loss
Error matrix (values in matrix are samples)
2000-2014 Reference data
Total samples in map class User's accuracy Forest loss
Forest gain Stable Forest
Stable non-forest
Map
dat
a
Forest loss 6 1 23 13 43 14%
Forest gain 2 2 20 3 27 7%
Stable Forest 39 13 579 148 779 74%
Stable non-Forest 18 5 20 129 172 75%
Total reference samples per class 65 21 642 293 1021
Forest Reference Emission Levels) for the Federal Republic of Nigeria: A Jurisdictional Approach focused on Cross River State
95% CI_Lower 798.47
95% CI_Upper 1146.27
Uncertainty=(CI/mean)*100 17.9%
Coeficient of variation (CV) 8.8%
Page 29 of 35
Forest Reference Emission Levels) for the Federal Republic of Nigeria: A Jurisdictional Approach focused on Cross River State
Appendix 3. Summary of FREL Development Process
S/N Activities Remarks
1 Stakeholders workshops chaired by the National Secretariat of REDD+ hosted within the Federal Department of Forestry. Stakeholders drawn from various ministerial departments, universities and research institutions, NGOs, and CSOs from States and Federal Government participated in the workshop. The technical team for the construction of the FREL is composed of national foresters, natural and environmental scientists, GIS and remote sensing experts drawn from relevant sectors and the mapping agencies of the Government, with technical support from a team of experts and consultants from FAO
2. Crafting of functional Definition of Forest
3. Activiities included: The only activity included in the present FREL submission is deforestation. There is also no reliable data include any other REDD+ activities.
Other activiites to be considered in future submission
4 Pools and Gases included: The above-ground biomass constitutes the main component/largest pool and has been included in the FRELs/FRLs. Belowground biomass constitutes a significant pool; however, its estimation is expensive and was indirectly undertaken using IPCC default root-to-shoot (R/S) ratio. Deadwood also constitutes a significant pool to be included. Of the three greenhouse gases associated with land use change emissions, namely
carbon dioxide (CO2), methane (CH4), and nitrous oxide (N2O), CO2 is the main gas
emitted in the forest sector. Therefore, only CO2 emissions have been considered in the present submission.
Acitivity in line with relevant IPCC guidelines
5. Analysis of historical data: Activity Data (AD) Estimation – Decision on reference years representative of future deforestation; Development fo methodology for AD analysis, collection and procesing of imagery for forest cover change assessemnts ; development of training data for image classification; Collection and interpretation of reference data for accuracy assessment of available maps and for stratified area estimates analysis including staistical information on annual deforestation values and confidence values, error matrices, etc. Emission Factors Estimation – Composition of forest inventory teams, Design of sampling protocol and technical training in sampling techniques, sample plot lay-out, data collection, analysis and estimation of carbon content. Computation of above ground biomass and belowground biomass; quality assurance/control; computation of carbon-dioxide equivalent and confidence values per forest class
Acitivity in line with relevant IPCC guidelines
6. FREL construction: Taking into account reference period and calculation of annual emissions – Estimation of emission factors per hectare for deforestation; estimation of annual forest loss per hectare (activity data); combination of emission factors for deforestation and activity data to estimate annual emissions.
Acitivity in line with relevant IPCC guidelines
7. Areas for future improvement: As an improvement, future work will include the deadwood carbon pool, for example, in the ongoing FCPF project, FAO is supporting Nigeria to undertake a forest carbon inventory at National Level in order to up-scale the present sub-national FREL, measures will be put in place to ensure the best data is collected. Furthermore, height measurements during the study were ocularly appreciated, so were not used as inputs into the biomass estimation allometric equation. During the on-going study, laser dendrometers (TruPulse 200B) will be used to measure tree height in the field.
Acitivity in line with relevant IPCC guidelines
Page 30 of 35
Forest Reference Emission Levels) for the Federal Republic of Nigeria: A Jurisdictional Approach focused on Cross River State
Checking the quality of reference data for the estimation of Activity Data is another area for future improvement. By this, we intend to adopt a third-party interpretation of the reference data where disagreements between two first-hand interpreters to further validate and improve accuracy of the data. Furthermore, we will also want to stratify the Activity Data in the future by forest type.
8. Technical Assessment by UNFCCC Assessment Team jointly develop timetable and agree on channel of communication with Nigeria REDD+ team for technical assessment; Interactive and question and answer sessions with the assessment team; provision of required materials and documentation as necessary; Assessmnet appraisal b Nigeria.
9. Implementation of UNFFCC TA team recomemndations and submission of modified FREL. Implementation of recommendations, improvement of data and FREL construction process as well as redratfing and submission of modified FREL.
10 Endorsement and publication of the Nigeria FREL on UNFCCC official website
Page 31 of 35
Forest Reference Emission Levels) for the Federal Republic of Nigeria: A Jurisdictional Approach focused on Cross River State
Appendix 4. List of participants at the drafting of the FREL
Page 32 of 35
Forest Reference Emission Levels) for the Federal Republic of Nigeria: A Jurisdictional Approach focused on Cross River State
Page 33 of 35
Forest Reference Emission Levels) for the Federal Republic of Nigeria: A Jurisdictional Approach focused on Cross River State
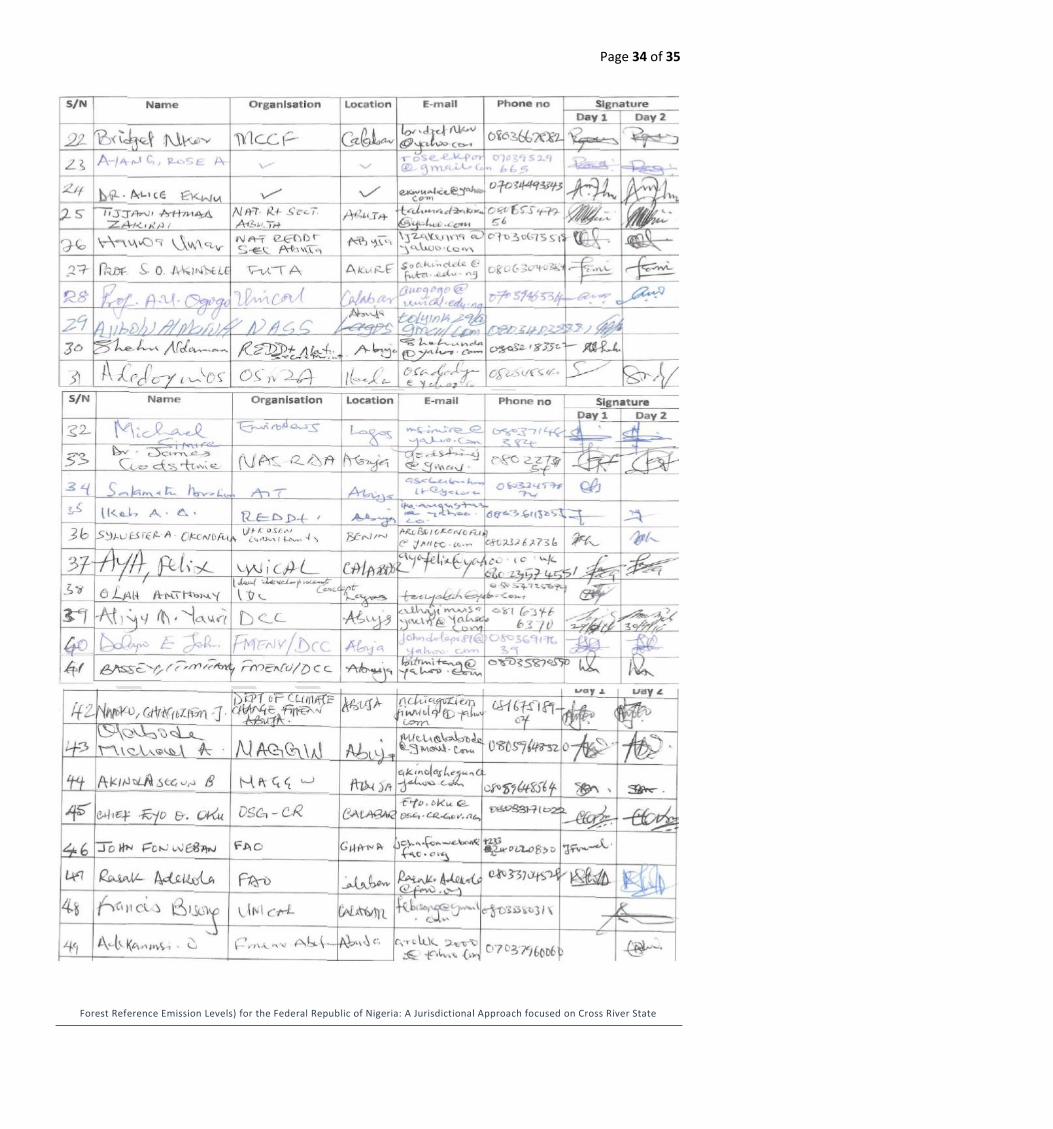
Appendix 5. List of participants at the validation of the Draft FREL and Draft NFMS documents
Page 34 of 35
Forest Reference Emission Levels) for the Federal Republic of Nigeria: A Jurisdictional Approach focused on Cross River State
Page 35 of 35
Forest Reference Emission Levels) for the Federal Republic of Nigeria: A Jurisdictional Approach focused on Cross River State
List of annexures
1. Harmonised AT’s question/answers and recommendations
2. Stratified Area Estimate Excel sheets
3. Stratified carbon estimate calculations in Excel
4. Uncertainty calculations for emission factor and annual emissions