53
FEDERAL UNIVERSITY OF PELOTAS POST-GRADUATE PROGRAM IN EPIDEMIOLOGY PLATINO SURVEY – BRAZILIAN SAMPLE REPORT This report was prepared by ANA MARIA BAPTISTA MENEZES CESAR GOMES VICTORA 1
| Date post: | 02-Dec-2018 |
| Category: |
Documents |
| Upload: | phungthien |
| View: | 213 times |
| Download: | 0 times |

FEDERAL UNIVERSITY OF PELOTAS
POST-GRADUATE PROGRAM IN EPIDEMIOLOGY
PLATINO SURVEY – BRAZILIAN SAMPL
REPORT
This report was prepared by
ANA MARIA BAPTISTA MENEZES CESAR GOMES VICTORA
E
1

FEDERAL UNIVERSITY OF PELOTAS
POST-GRADUATE PROGRAM IN EPIDEMIOLOGY
PLATINO SURVEY – BRAZILIAN SAMPL
REPORT
This report was prepared by
ANA MARIA BAPTISTA MENEZES CESAR GOMES VICTORA
On behalf of the Brazil Platino Study Team
JOSÉ ROBERTO JARDIM (Principal Investigator)
Aquiles Camelier (PhD student) Fernanda Rosa (PhD student)
Oliver Nascimento (PhD student)
Statistical analyses were carried out by Pedro Curi Hallal, MSc. Sampling advice: Nilza Nunes da Silva and Aluísio Barros Anthropometry team : Wolney Conde and Carlos Monteiro
Field supervisors: Isabel Freitas, Renata Levy Costa, Clarissa Nazar
Finally, we would like to thank the support provided by ALAT and BIwell as the continued participation of the PLATINO Steering Commit
Advisory Committee and Executive Committee.
PELOTAS, BRAZIL
2003
E
io
, as tee,
2
1. INTRODUCTION
The prevalence of Chronic Obstructive Pulmonary Disease (COPD) in many
developed countries appears to be increasing (Hurd, 2000; Pauwels, 2000; Petty, 2000).
There is also some evidence from Latin America that COPD is a growing cause of
death, but information on prevalence is scant (Brasil, Datasus). To obtain a detailed
picture of the global distribution of this severe condition, it is necessary to know its
prevalence in less developed countries. It is possible that, due to the high frequency of
smoking - the main risk factor for COPD - in these countries, this disease may represent
a major public health problem that has not yet been recognized as such.
The PLATINO study is aimed at measuring COPD prevalence in major cities in
Latin America. So far, studies have been launched in São Paulo, Mexico City,
Montevideo and Santiago. One more city will be included in the near future.
The main objective of the Platino study is to measure COPD prevalence in 5 Latin
American metropolitan areas. The specific objectives are:
To measure and compare COPD prevalence using different definitions,
including ATS, ERS, GOLD, FIXED RATIO AND SYMPTOMS;
To measure the prevalence of known risk factors for COPD including socio-
economic status, smoking, type of cigarette smoked, indoor biomass
pollution, work exposure, environmental pollution, genetic factors and
history of severe respiratory disease in childhood;
To describe the distribution of COPD according to age, sex, smoking and the
presence of other risk factors;
To describe the main clinical symptoms reported by subjects diagnosed with
COPD;
To assess the sensitivity and specificity of COPD clinical findings, using
lung function as the “gold standard”;
To compare COPD prevalence in Latin America with that reported from
other countries (mainly developed ones);
clinical and laboratory investigations, and other relevant aspects;
To correlate the subject’s awareness of suffering from COPD with actual
diagnosis;
3
To describe how this disease is being managed in terms of drug therapy,
To describe the social and economic consequences of COPD, in terms of
work limitations, absenteeism and other relevant issues.
A full description of the rationale and methodology of the study is available in
the original study proposal (Menezes, 2002, Platino Project).
This report describes the main results of the São Paulo study, the first site where
the project has been completed.
2. METHODOLOGY
2.1. Design of the study A cross sectional design was used in order to provide a representative sample of
adults aged ≥ 40 years living in the metropolitan area of São Paulo, through multi-stage
cluster sampling.
2.2. Sampling The sample size calculations required 800 subjects to estimate a prevalence of
up to 30% with a margin of error of less than 4 percent points (Menezes, 2002, Platino
Project). To allow for non-response we aimed at obtaining 68 census tracts in larger
metropolitan area of Sao Paulo, and to select 15 households, on average, from each
tract. We expected approximately an average of one person aged 40 years or more per
household.
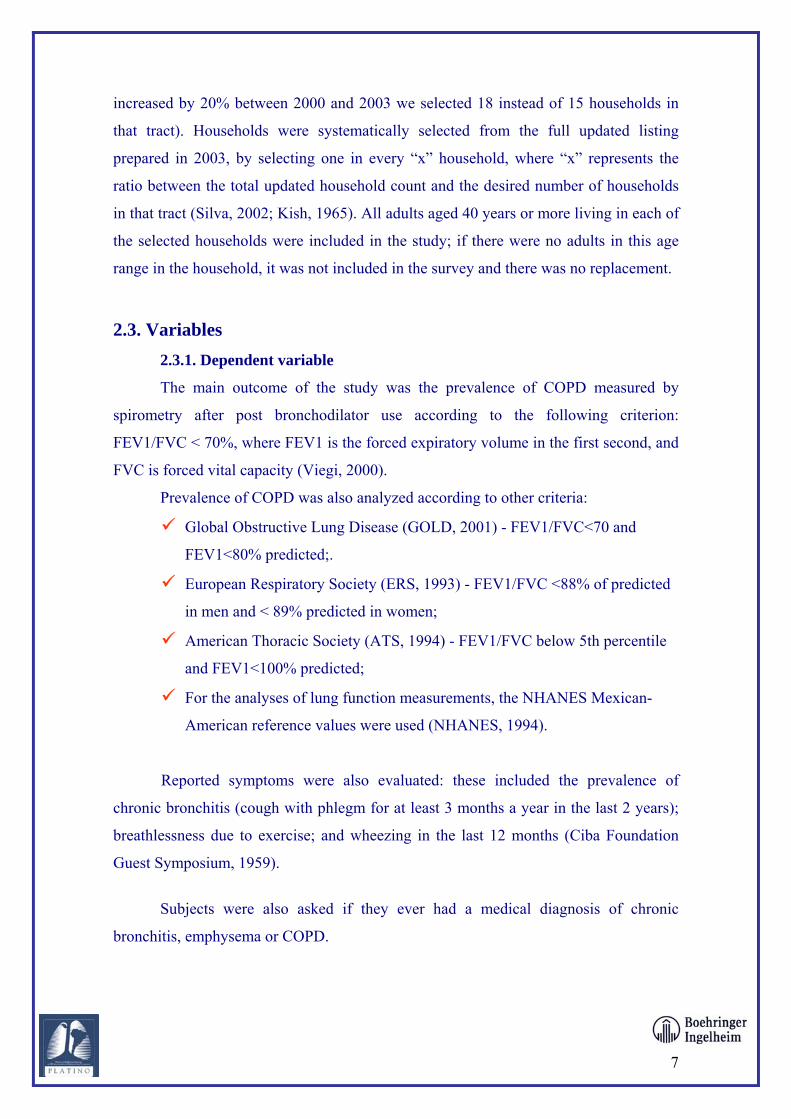
The metropolitan area was divided into two strata: the city of SP, and its suburbs
(comprising all other municipalities around SP). Table 1 shows the population of each
stratum and the proportion of the sample expected in each area, with the respective size
sample.
4
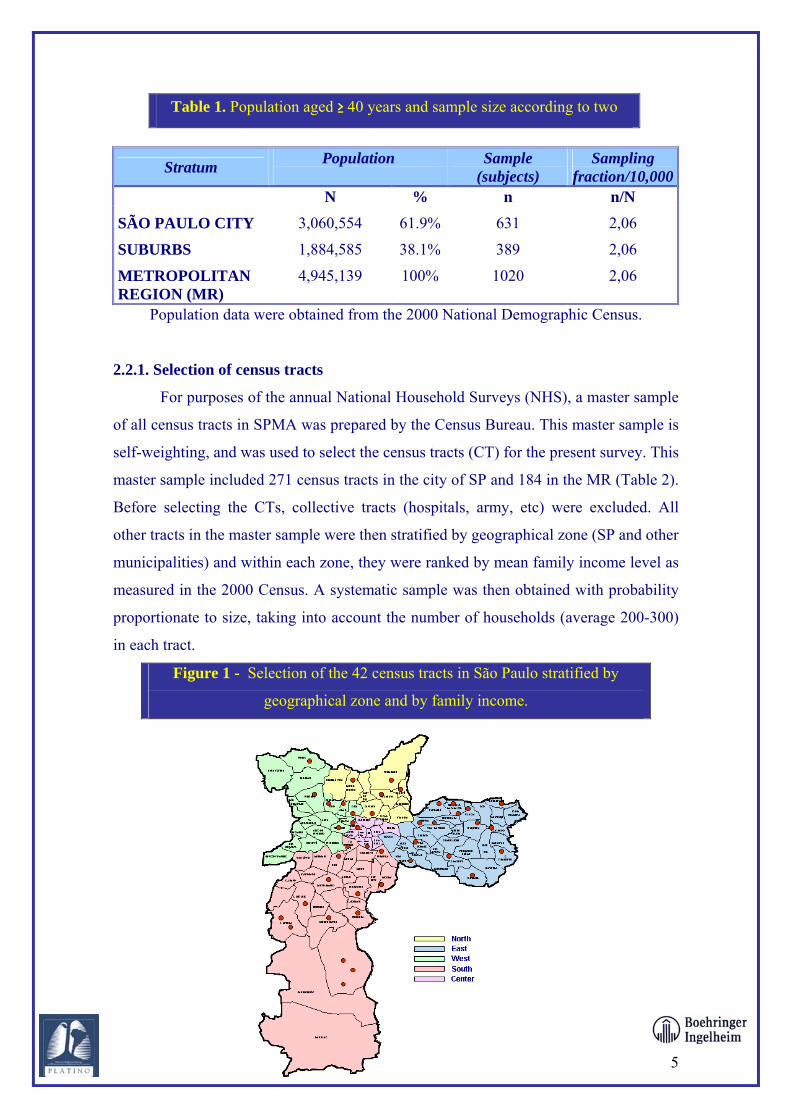
Table 1. Population aged ≥ 40 years and sample size according to two
Stratum Population
Sample (subjects)
Sampling fraction/10,000
N % n n/N
SÃO PAULO CITY 3,060,554 61.9% 631 2,06
SUBURBS 1,884,585 38.1% 389 2,06
METROPOLITAN REGION (MR)
4,945,139 100% 1020 2,06
Population data were obtained from the 2000 National Demographic Census.
2.2.1. Selection of census tracts
For purposes of the annual National Household Surveys (NHS), a master sample
of all census tracts in SPMA was prepared by the Census Bureau. This master sample is
self-weighting, and was used to select the census tracts (CT) for the present survey. This
master sample included 271 census tracts in the city of SP and 184 in the MR (Table 2).
Before selecting the CTs, collective tracts (hospitals, army, etc) were excluded. All
other tracts in the master sample were then stratified by geographical zone (SP and other
municipalities) and within each zone, they were ranked by mean family income level as
measured in the 2000 Census. A systematic sample was then obtained with probability
proportionate to size, taking into account the number of households (average 200-300)
in each tract.
Figure 1 - Selection of the 42 census tracts in São Paulo stratified by
geographical zone and by family income.
5

Figure 2 - Selection of the 26 census tracts in São Paulo stratified by geographical zone and by family income.
Table 2. Sampling of census tracts by stratum
Stratum
N
B
Census tracts
a = (n/b)
SÃO PAULO CITY 631 15 42
SUBURBS 389 15 26
METROPOLITAN REGION (MR)
1020 -- 68
2.2.2. Sampling of the households
6
All selected tracts were visited, and all inhabited households in each of these
tracts were enumerated in early 2003. These total numbers were divided by the number
of households counted in 2000 during the National Census. The ratio of households
counted in 2003 over those counted in 2000 represented a correction factor for
population growth. This ratio was multiplied by 15 households to find out how many
households should be selected in each tract (for example if the number of households
increased by 20% between 2000 and 2003 we selected 18 instead of 15 households in
that tract). Households were systematically selected from the full updated listing
prepared in 2003, by selecting one in every “x” household, where “x” represents the
ratio between the total updated household count and the desired number of households
in that tract (Silva, 2002; Kish, 1965). All adults aged 40 years or more living in each of
the selected households were included in the study; if there were no adults in this age
range in the household, it was not included in the survey and there was no replacement.
2.3. Variables 2.3.1. Dependent variable
The main outcome of the study was the prevalence of COPD measured by
spirometry after post bronchodilator use according to the following criterion:
FEV1/FVC < 70%, where FEV1 is the forced expiratory volume in the first second, and
FVC is forced vital capacity (Viegi, 2000).
Prevalence of COPD was also analyzed according to other criteria:
Global Obstructive Lung Disease (GOLD, 2001) - FEV1/FVC<70 and
FEV1<80% predicted;.
European Respiratory Society (ERS, 1993) - FEV1/FVC <88% of predicted
in men and < 89% predicted in women;
American Thoracic Society (ATS, 1994) - FEV1/FVC below 5th percentile
and FEV1<100% predicted;
For the analyses of lung function measurements, the NHANES Mexican-
American reference values were used (NHANES, 1994).
Reported symptoms were also evaluated: these included the prevalence of
chronic bronchitis (cough with phlegm for at least 3 months a year in the last 2 years);
breathlessness due to exercise; and wheezing in the last 12 months (Ciba Foundation
Guest Symposium, 1959).
Subjects were also asked if they ever had a medical diagnosis of chronic
bronchitis, emphysema or COPD.
7

2.3.2. Risk factors
The following risk factors were investigated:
sex - dichotomous variable: male or female;
age - discrete variable: years completed until the interview date;
skin color – categorical variable: white, black, mulatto, Asian, Native
al level - discrete variable: completed years of schooling of the
ount, age at beginning and stopping, type of
e;
eight, height, and abdominal
ircumference) were measured using standardized methods and the instruments
index was calculated.
neral exclusion criteria for the study were mental disease and
American;
education
subject;
father’s education – as above, for the subject’s father;
occupational exposure to dust: duration of exposure, intensity of contact,
frequency of contact and type of work;
smoking history – daily am
cigarette, etc;
passive smoking – intensity and duration of exposure at hom
domestic exposure to coal and biomass smoke – exposure to smoke from
cooking and heating;
hospital admissions – whether or not the subject was hospitalized due to a
respiratory illness during childhood;
family history of lung disease - chronic bronchitis, emphysema, or COPD.
The subject’s anthropometric status (w
c
described below. Body mass
2.4. Exclusion criteria The ge
institutionalization. In the São Paulo study, no subjects fulfilled these criteria.
Exclusion criteria for spirometry – presence in the last three months of thoracic
or abdominal surgery, heart attack, eye surgery (or retinal detachment), hospitalization
for any heart problem, current treatment for tuberculosis, self reported pregnancy or
ulse rate above 120 beats/minute. Sixteen subjects were excluded due to these criteria.
8
p
2.5. Instruments and examinations
I, Lung Health
tudy (LHS) and SF-12 were also added to assess overall health status.
and to keep their heads straight in the Francfort plane
hile their height was checked.
ion 200 g) was used.
ubjects were weighted without shoes and wearing light clothes.
y around the waist over the midpoint;
e tape should neither be too tight nor too loose.
roducible to 150 ml. A
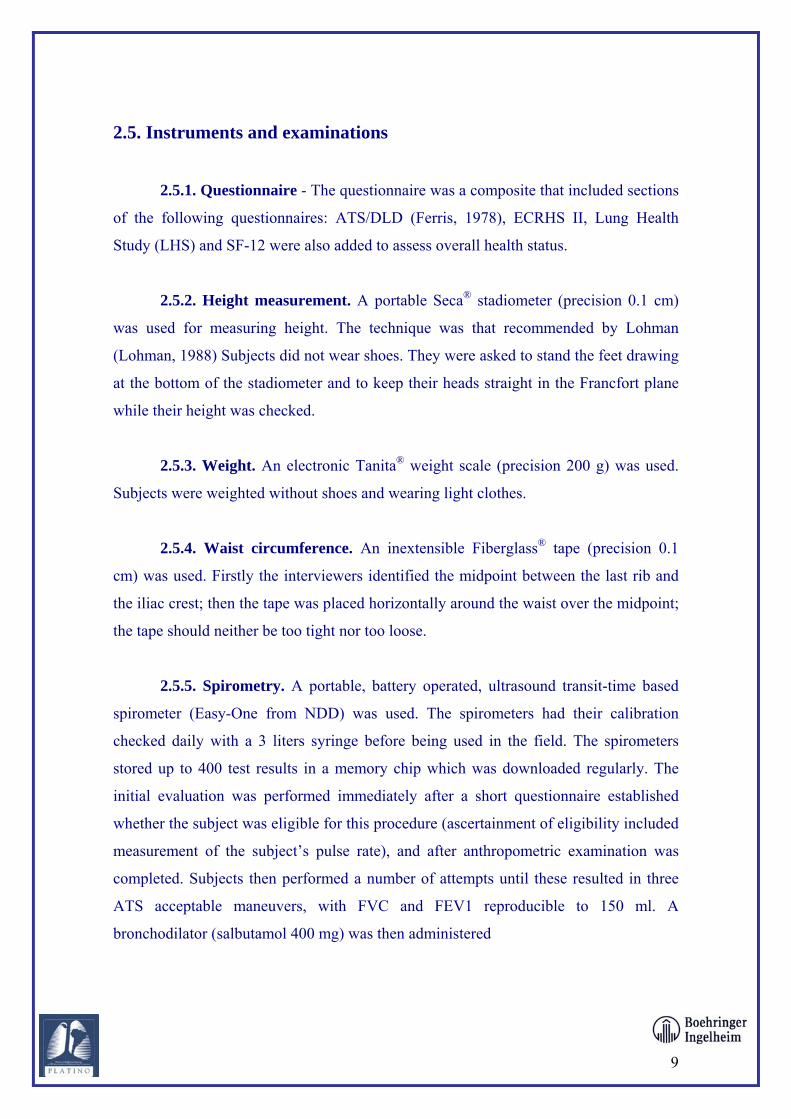
2.5.1. Questionnaire - The questionnaire was a composite that included sections
of the following questionnaires: ATS/DLD (Ferris, 1978), ECRHS I
S
2.5.2. Height measurement. A portable Seca® stadiometer (precision 0.1 cm)
was used for measuring height. The technique was that recommended by Lohman
(Lohman, 1988) Subjects did not wear shoes. They were asked to stand the feet drawing
at the bottom of the stadiometer
w
2.5.3. Weight. An electronic Tanita® weight scale (precis
S
2.5.4. Waist circumference. An inextensible Fiberglass® tape (precision 0.1
cm) was used. Firstly the interviewers identified the midpoint between the last rib and
the iliac crest; then the tape was placed horizontall
th
2.5.5. Spirometry. A portable, battery operated, ultrasound transit-time based
spirometer (Easy-One from NDD) was used. The spirometers had their calibration
checked daily with a 3 liters syringe before being used in the field. The spirometers
stored up to 400 test results in a memory chip which was downloaded regularly. The
initial evaluation was performed immediately after a short questionnaire established
whether the subject was eligible for this procedure (ascertainment of eligibility included
measurement of the subject’s pulse rate), and after anthropometric examination was
completed. Subjects then performed a number of attempts until these resulted in three
ATS acceptable maneuvers, with FVC and FEV1 rep
9
bronchodilator (salbutamol 400 mg) was then administered
by inhalation, and the test was repeated 15 minutes later, with the same criteria. All
spirometric examinations were carried out with the subject seated, wearing a nose clip
and a disposable mouthpiece.
ht, height and waist circumference were carried out
the initial training sessions, the local supervisors continued to train
raining was
Anthropom waist circu
s: after having carried out several interviews with both health
and diseased subjects, interviewers had to carry out an interview in the
r and were approved if their performance was
irs (all of whom were physiotherapists), three field
superv
a
households with subjects
The measurements of weig
twice on each subject, and the average value was used.
2.6. Personnel and training The team for carrying out the training was composed by the main coordinator of
the study, two experts in spirometry from Mexico, the local principal investigator, three
field work supervisors, a nutritionist, and 17 interviewers. Training lasted one week. In
addition to
interviewers whose performance in the standardization sessions was not optimal, until it
became satisfactory. The following criteria were used to ensure that t
adequate:
etry: the intra and inter observed variability accepted for the measurement of
mference was 1.0 cm and for height was 0.2 cm (Habicht, 1974).
Spirometry: interviewers performed several measurements on different
subjects and were then submitted to a formal examination including two
complete tests. If they succeeded in these tests they were certified.
Questionnaire
presence of a superviso
satisfactory.
2.7. Logistics of field work The field work lasted from 13/01 to 31/05/2003. The study team included three
scouts, 17 interviewers working in pa
isors, two local spirometry supervisors and a secretary. All field methods were tested in a pilot study carried out in December 2002 in
10
middle-class area in São Paulo city.
The logistic of the field work included several steps. The first visit to the
selected households was carried out by the “scouts” who, in
aged 4
the interviewers visited the study headquarters early in the morning to
check
Each interviewer carried a backpack containing all the equipment. Depending on
headquarters and the census tract to be visited, interviewers
travele
0 years or more, delivered an official letter explaining the aim of the study.
Eligible subjects were informed that the study supervisors would contact them in order
to arrange the best time for the interview and examination.
Daily,
the calibration of the equipment and to receive a list of the households to be
visited. At the same time, spirometry results obtained in the previous day were
downloaded.
the distance between the
d by subway, bus, car or in a rented van.
2.8. Quality control Spirometry – After each test, the automated spirometer provides an evaluation of
the quality of readings, based on the repeatability of the three “best” curves (on average
each subject performed 6.2 maneuvers pre-bronchodilator (BD) and 5.2 post-BD). The
aim was to obtain a grade “A” test according to this on-the-spot evaluation. During data
collection, the spirometries were sent weekly to Mexico by email. The Mexican team
analyzed their quality and provided weekly quality control reports with assessments of
each individual interviewer. At the same time the local PI of the study was also
checking the spirometries daily and working with the interviewers to correct any
inaccuracies detected by him or by the Mexican team. Results of the regular quality
control
Interviews
procedures, which confirmed that average measurement quality was 80% or
higher throughout the study period, can be obtained from our homepage.
– 10% of the interviews were repeated by the supervisors. Two to
three w
nthropometry
eeks after the interview, the supervisors contacted the subject interviewed and
repeated six questions from the main questionnaire to assess reliability.
A – Half way through the field work (end of second month), all the
terviewers underwent refresher training in anthropometry, followed by a second round
f standardization sessions.
in
o
11

2.10. E
were sent to
each subject and for those who had COPD or any abnormality in the spirometry was
seen by a doctor in a rehabilitation centre.
nt to the
CC and linked to the questionnaire database. A full copy of the clean dataset was sent to
o Paulo, and the original database was analyzed in the CC.
d
r lower in the likelihood ratio test; the 0.05 P level was used for
identifying significant risk factors. Tests for linear trend were used when appropriate.
thical considerations
Ethical approval was obtained from the ethical committee of the Paulista School
of Medicine in SP. Only subjects who signed the informed consent participated in the
study. The disposable mouthpieces and spacers were given to each subject interviewed
and also a T-shirt with the logo of the study. The results of spirometries
offered the possibility of being
2.11. Processing of data All questionnaires were photocopied, and the originals were sent to the
Coordinating Centre (CC), while the copy remained in São Paulo. In the CC, all
questionnaires were revised, open answers were coded and data were entered twice in a
Epi-Info database. The spirometry results were sent to Mexico and entered in a STATA
database. After spirometry results were cleaned and edited, the database was se
the study site in Sã
2.12. Analysis
Analyses were carried out using the STATA program. These included
descriptive analyses of the outcome variables and of risk factor prevalence, bivariate
analyses and multivariate analyses. For the multivariate analyses, Poisson regression
(Barros, 2003) was used to provide estimates of prevalence ratios and their 95%
confidence intervals. Analyses were carried out according to a previously defined
conceptual model which took into account the hierarchical relationships between risk
factors (Victora, 1997. For example, demographic and social factors were considered as
distal determinants while smoking and exposure to pollution were considered as
proximate determinants (see Results section). All analyses took into account the cluster
sampling procedure. Confounding variables were kept in the model if they had reache
12
a P level of 0.20 o

3. RESULTS
0 subjects
were interviewed, of whom 963 also completed the spirometric examination.
3.1. Response rates and number of individuals included Figure 3 shows the number of households and subjects included in the different
phases of the study. Non-response rates were 0.5% at the household level, 13.0% at the
individual questionnaire level, and 2.1% for spirometry. The overall rate of non-
response was 15.3%, obtained by multiplying the response rates. Exactly 1,00
Figure 3. Number of households and individuals included in the different phases of the study.
13
1113 households selected
1039 eligible households
74 households excluded
1150 eligible individuals
1000 individuals interviewed
984 eligible spirometries
16 individuals excluded
963 spirometries
21 refusals or contact failures
150 refusals or contact
failures
6 contact failures
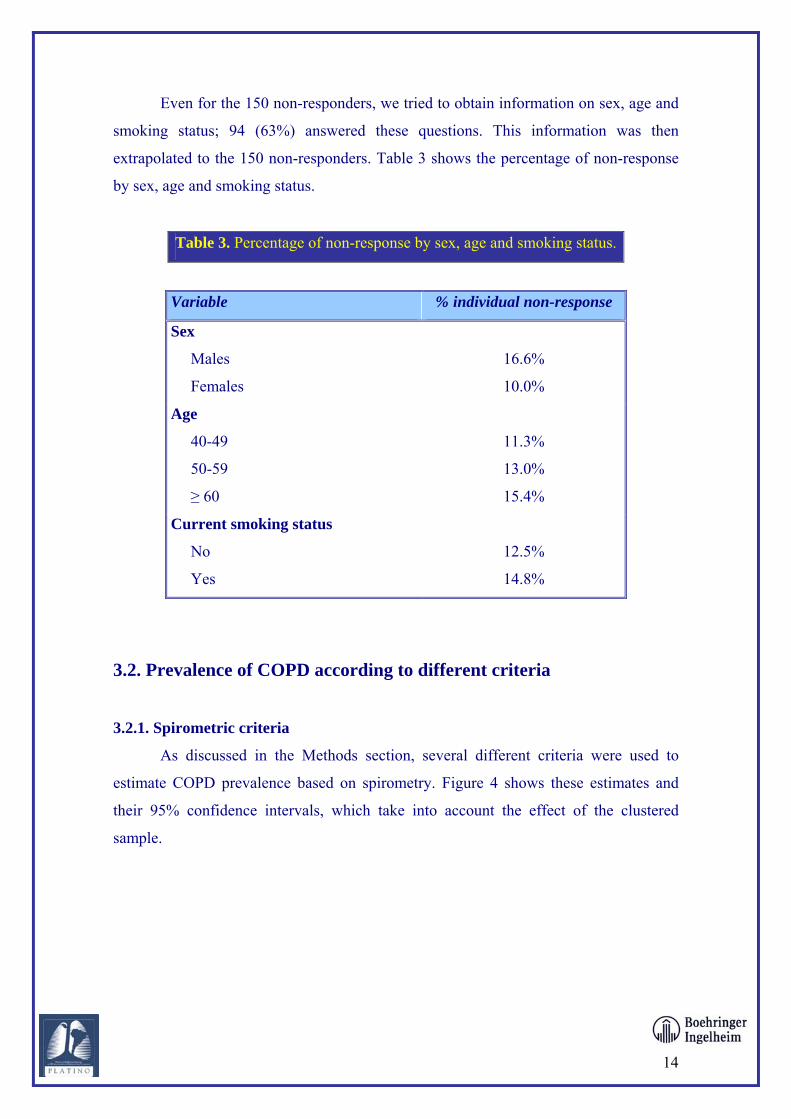
Even for the 150 non-responders, we tried to obtain information on sex, age and
smoking status; 94 (63%) answered these questions. This information was then
xtrapolated to the 150 non-responders. Table 3 shows the percentage of non-response
by sex, ag
e
e and smoking status.
Table 3. Percentage of non-response by sex, age and smoking status.
Variable % individual non-response
Sex
Males
s
16.6%
Female
10.0%
Age
40-49
13.0% 50-59
≥ 60
11.3%
15.4%
Current smoking status
No
Yes
12.5%
14.8%
3.2. Prevalence of COPD according to different criteria
OPD prevalence based on spirometry. Figure 4 shows these estimates and
eir 95% confidence intervals, which take into account the effect of the clustered
mple.
3.2.1. Spirometric criteria
As discussed in the Methods section, several different criteria were used to
estimate C
th
14
sa
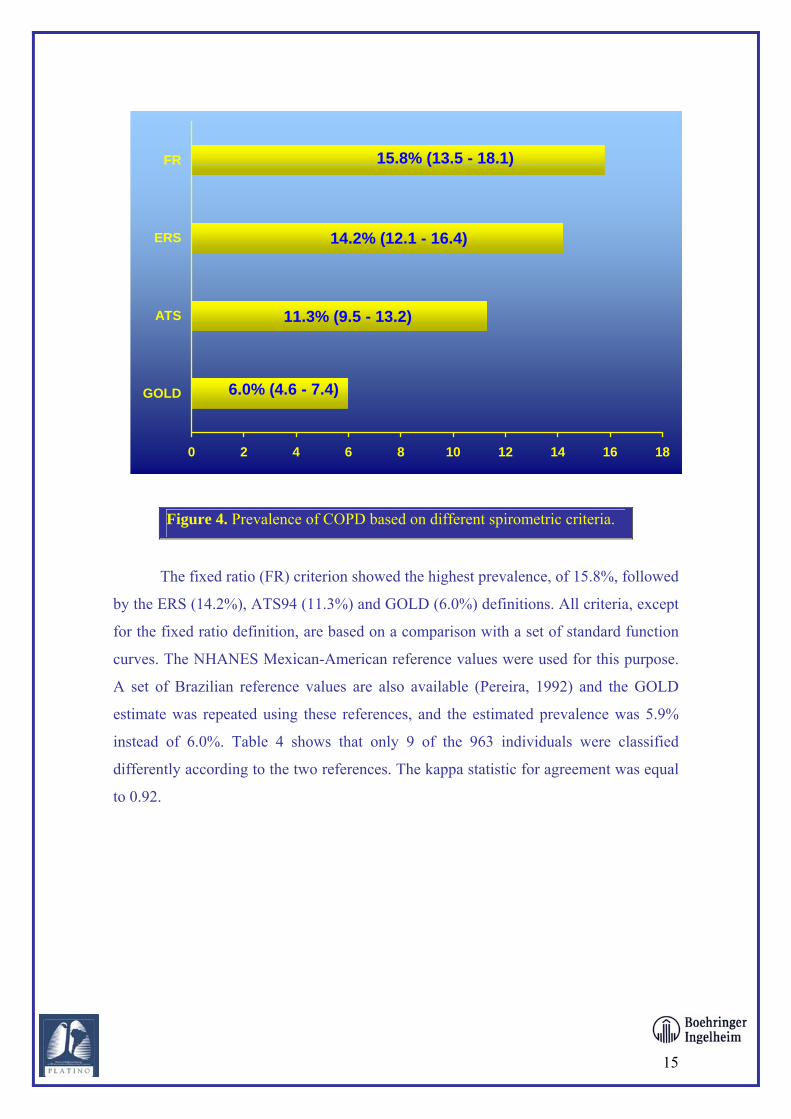
Figure 4. Prevalence of COPD based on different spirometric criteria.
The fixed ratio (FR) criterion showed the highest prevalence, of 15.8%, followed
by the ERS (14.2%), ATS94 (11.3%) and GOLD (6.0%) definitions. All criteria, except
for the fixed ratio definition, are based on a comparison with a set of standard function
curves. The NHANES Mexican-American reference values were used for this purpose.
A set of Brazilian reference values are also available (Pereira, 1992) and the GOLD
estimate was repeated using these references, and the estimated prevalence was 5.9%
instead of 6.0%. Table 4 shows that only 9 of the 963 individuals were classified
differently according to the two references. The kappa statistic for agreement was equal
to 0.92.
15
0 2 4 6 8 10 12 14 16 18
GOLD
ATS
ERS
FR 15.8% (13.5 - 18.1)
14.2% (12.1 - 16.4)
11.3% (9.5 - 13.2)
6.0% (4.6 - 7.4)

Table 4. Comparison of COPD classification (GOLD criterion) using the NHANES and Brazilian reference curves for lung function.
Prevalence of COPD
(GOLD – NHANES reference)
Prevalence of COPD
(GOLD – Brazilian reference) Present Absent
Total
Present 53 4 57
Absent 5 901 906
Total 58 905 963
The design effect (deff) - an estimate of how much the cluster sample affected
the variability of the measures – was calculated for the fixed ratio and GOLD estimates.
The values obtained were 0.97 and 0.87, respectively. Design effects substantially
greater than 1.0 are of concern, but was not the case for these outcome measures.
3.2.2 Clinical criteria
Symptoms related to COPD were also studied (Figure 5).
Figure 5. Prevalence of reported respiratory symptoms.
16
0 5 10 15 20 25 30 35 40
Breathlessness
Wheezing
Chronic Bronchitis
23.5% (20.7 - 26.3)
36.9% (33.4 - 40.4)
3.1% (1.9 - 4.3)

The prevalence of chronic bronchitis according to reported symptoms - cough
with phlegm for at least 3 months a year in the last 2 years – was equal to 3.1%.
Breathlessness due to exercise, and wheezing in the last 12 months were reported,
respectively, by 36.9% and 23.5% of all subjects (Figure 5).
When 10% of the sample subjects were re-interviewed within 2-3 weeks of the
original interview, it was possible to estimate the reliability of the information provided
on symptoms. Kappa statistics were equal to 0.45 for cough and 0.39 for sputum,
showing that agreement was intermediate to poor.
Figure 6 shows the prevalence of reported medical diagnoses of bronchitis,
emphysema, asthma and COPD. Except for asthma which reached 10% of the subjects,
each of the other conditions were reported by fewer than 4% of those interviewed. A
medical diagnosis of either chronic bronchitis, emphysema or COPD was reported by
5.3% of all subjects.
Figure 6. Prevalence of reported medical diagnoses of lung conditions.
17
0 2 4 6 8 10 1
Asthma
Chronic Bronchitis
Enphysema
COPD
10.1% (8.3 - 11.9)
0.8% (0.3 - 1.3)
1.2% (0.6 - 1.8)
3.9% (2.7 - 5.1)
2

3.3. Comparison of clinical and spirometric criteria The availability of clinical and spirometric results for the same subjects allowed
us to compare how these diagnoses relate to one another. Using the FR result as the gold
standard, table 5 shows that the sensitivity of the symptoms of bronchitis was 7.9% and
its specificity 97.9%. Positive and negative predictive values were 41.4% and 85.0%,
respectively.
Table 5. Comparison of COPD classification (fixed ratio criterion) and symptoms of chronic bronchitis (cough plus sputum for at least 3 months a year, for at least 2
years).
Prevalence of COPD
(fixed ratio) Prevalence of symptoms of chronic
bronchitis through questionnaire Present Absent
Total
Present 12 17 29
Absent 140 794 934
Total 152 811 963
Similar results were obtained when clinical symptoms were compared to the
GOLD criterion (Table 6). Sensitivity was 10.3% and specificity 97.5%; positive and
negative predictive values were 20.7% and 94.4%, respectively.
Table 6. Comparison of the spirometric COPD classification (GOLD criterion) and the symptoms of chronic bronchitis (cough plus sputum for at least 3 months a year,
for at least 2 years).
Prevalence of COPD
(GOLD - NHANES reference) Prevalence of symptoms of chronic
bronchitis through questionnaire Present Absent
Total
Present 6 23 29
Absent 52 882 934
Total 58 905 963
18

These analyses were repeated for self-reported COPD, defined as either chronic
bronchitis or breathlessness, or both. Sensitivity increased from 7.9% to 46.1%, but
specificity decreased from 97.9% to 63.8% (Table 7). The positive predictive value was
19.3% and the negative predictive value 86.2%.
Table 7. Comparison of the spirometric COPD classification (FR criterion) and reported symptoms of chronic bronchitis (cough plus sputum for at least 3 months a
year, for at least 2 years) and/or breathlessness.
Prevalence of COPD
(FR criterion)
Prevalence of symptoms of chronic
bronchitis and/or breathlessness
through questionnaire Present Absent
Total
Present 70 292 362
Absent 82 514 596
Total 152 806 958
For the GOLD criterion, the sensitivity of self-reported COPD was 53.4% and
its specificity 63.2% (Table 8). The positive and negative predictive values were
respectively 8.6% and 95.5%.
Table 8. Comparison of the spirometric COPD classification (GOLD criterion) and reported symptoms of chronic bronchitis (cough plus sputum for at least 3 months a
year, for at least 2 years) and/or breathlessness.
19
Prevalence of COPD
(GOLD – NHANES reference)
Prevalence of symptoms of chronic
bronchitis and/or breathlessness
through questionnaire Present Absent
Total
Present 31 331 362
Absent 27 569 596
Total 58 900 958
Therefore, diagnoses based on clinical symptoms evidently fail to identify the
vast majority of subjects on whom COPD is present according to spirometry. On the
other hand, most subjects with normal spirometry do not report any symptoms.
Considering both symptoms of chronic bronchitis and breathlessness, sensitivity
increased but specificity decreased. The drop in specificity was partly due to the fact
that breathlessness is often reported by asthmatic subjects, who performed well in the
spirometry test after the use of bronchodilators.
Of 366 subjects who reported breathlessness, 101 (27.6%) presented a change in
FEV1 post-bronchodilator use greater or equal than 12% (or 200 ml) test, thus
suggesting the presence of asthma. This explains why the specificity of the combined
diagnosis (Tables 7 and 8) was reduced sharply.
3.4. Risk factors for COPD
3.4.1. Distribution of the sample according to risk factors
Information was collected on several risk factors for COPD. Table 9 shows the
demographic and socioeconomic risk factors, while Table 10 shows all the remaining
independent variables.
Slightly more than half of all subjects were female, as was expected given the
greater longevity of women. Subjects were concentrated in the 40-49 year age group.
The average age was 55.2 years (SD 11.3). Most subjects classified themselves as
white, followed by mulatto and blacks. Native Brazilians and Asians were rare.
Approximately 15% reported a family history (parents, siblings or children) of
bronchitis, emphysema or COPD.
Two socioeconomic variables were investigated: schooling of the interviewed
subjects and of their father, as a proxy for the social class of their family. The average
length of schooling of the studied subjects was 5.9 years (SD 4.9). About one in four
subjects were unable to inform about their fathers’ schooling level, and about one half
reported that their fathers had never attended school.
20

About one in four (24%) of the subjects contacted were smokers, and a further
third (33.1%) were ex-smokers; 42.9% had never smoked. Current smokers accounted
for 30.2% of the men and 19.0% of the women. When 10% of the sample were re-
interviewed for quality control, the Kappa statistic for smoking was equal to 0.95,
showing a very high degree of repeatability. The lifetime exposure to active smoking
was also assessed; 19% of all subjects informed having smoked more that 10 pack-
years. The prevalence of reported passive smoking in the subject’s home in the previous
two weeks was 30.1%.
Almost half of the sample (45.1%) presented values of waist circumference
above the proposed cut-off (88 cm for females and 102 cm for males). Overweight and
obese subjects (BMI ≥ 25 kg/m2) comprised almost two thirds of the sample (62.7%).
The prevalence for males was 58.1% and for females 66.3%. Only 2.9% of all subjects
reported having been admitted to a hospital due to a respiratory illness during
childhood. Exposure to dust in the work-place for 10 years or more was reported by
33.7%.
Four sources of domestic smoke were studied: coal was used for cooking by
14.4% of all subjects and for heating by 1.7%; the corresponding exposures to biomass
(mainly wood) were 47.5% and 6.4%. Due to the low frequency of exposure to heating
fuels, these variables were collapsed into two: exposure to coal and exposure to
domestic biomass fuels.
21

Table 9. Description of the sample according to demographic and socioeconomic variables.
Variable Percentage Sex Men Women
44.2% 55.8%
Age 40-49 50-59 ≥ 60
39.0% 32.0% 29.0%
Skin color / ethnicity White Mulatto Black Native Brazilians Asian
57.5% 27.6% 10.4% 2.3% 2.2%
Family history of CODP, bronchitis or emphysema No Yes
14.7% 85.3%
Schooling level (years) 0-2 3-4 5-8 ≥ 9
23.4% 30.9% 22.7% 23.0%
Schooling of the father None Some Do not know
46.6% 26.2% 27.2%
22
a. There were up to 4 missing values in the variables listed in the table, among 1000 subjects.
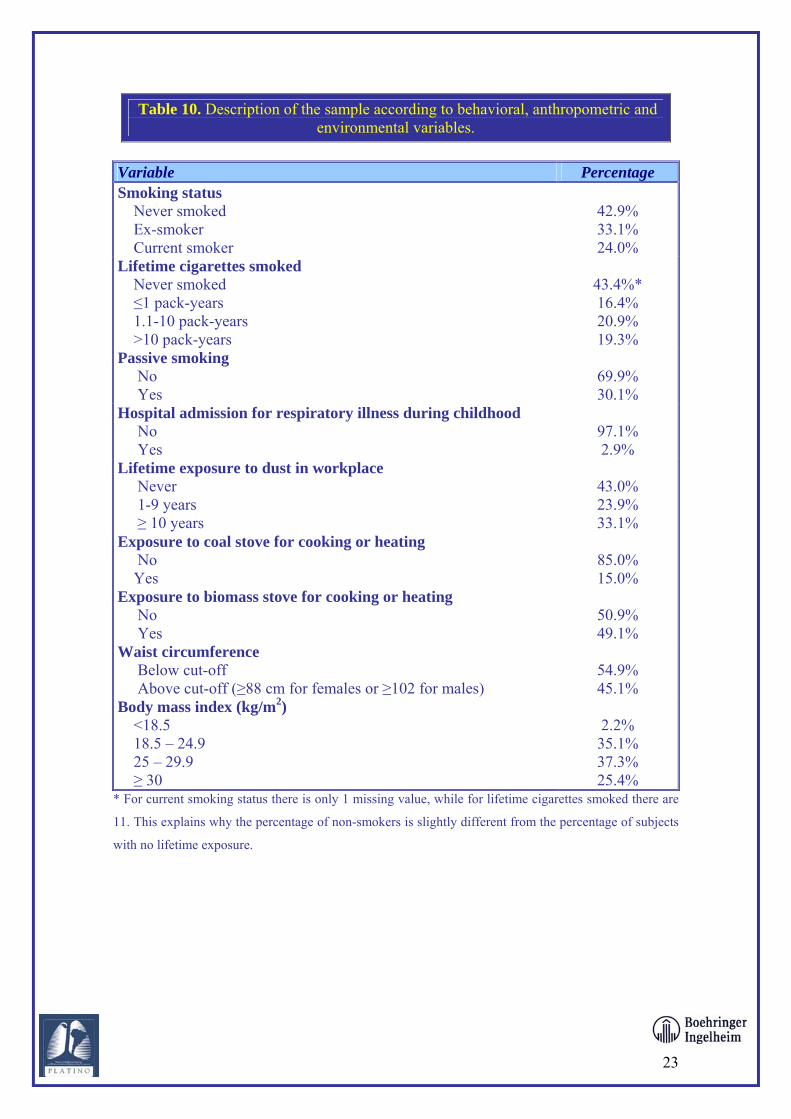
Table 10. Description of the sample according to behavioral, anthropometric and environmental variables.
Variable Percentage Smoking status Never smoked Ex-smoker Current smoker
42.9% 33.1% 24.0%
Lifetime cigarettes smoked Never smoked ≤1 pack-years 1.1-10 pack-years >10 pack-years
43.4%* 16.4% 20.9% 19.3%
Passive smoking No Yes
69.9% 30.1%
Hospital admission for respiratory illness during childhood No Yes
97.1% 2.9%
Lifetime exposure to dust in workplace Never 1-9 years ≥ 10 years
43.0% 23.9% 33.1%
Exposure to coal stove for cooking or heating No Yes
85.0% 15.0%
Exposure to biomass stove for cooking or heating No Yes
50.9% 49.1%
Waist circumference Below cut-off Above cut-off (≥88 cm for females or ≥102 for males)
54.9% 45.1%
Body mass index (kg/m2) <18.5 18.5 – 24.9 25 – 29.9 ≥ 30
2.2% 35.1% 37.3% 25.4%
* For current smoking status there is only 1 missing value, while for lifetime cigarettes smoked there are
11. This explains why the percentage of non-smokers is slightly different from the percentage of subjects
with no lifetime exposure.
23
3.4.2. Crude analyses of main risk factors
Table 11 shows the prevalence of 11 outcomes related to pulmonary conditions,
according to the categories of the four main risk factors under study: gender, age,
smoking and schooling. All analyses took the clustering of the sample into account.
It is important to bear in mind that, as stated in the original proposal of the study,
analyses of risk factors for COPD were planned for the pooled dataset including results
from the other participating centers. The statistical power of the comparisons that are
reported below is therefore quite low, and some important effects may fail to reach
significant levels. For this reason, we have opted to highlight in the next section not
only statistically significant results with a P<0.05 but also results with P levels from
0.05 to 0.2, because the latter may well become significant when data from all
participating sites are pooled in the final analyses. The current results, therefore, must
be interpreted with caution.
Gender
Men tended to perform less well than women according to spirometric criteria,
except for ERS (Table 11). One should bear in mind that the equations used for
assessing spirometric results were already stratified by sex.
In terms of symptoms, men were slightly more likely to fulfill the criteria for
chronic bronchitis but the difference was not significant (P=0.19). Women, on the other
hand were more likely to report breathlessness (P<0.001), and wheezing prevalence was
similar in both sexes (P=0.7). Conditions requiring a medical diagnosis tended to be
more often reported by women, but the difference was only significant for asthma.
COPD was seldom reported.
Therefore, males tended to have higher prevalence of spirometric diagnoses, but
conditions with a medical diagnosis did not show a clear gender pattern, except for
asthma which was more common among women. This difference may be explained by
different care-seeking patterns by gender.
Age
24
As expected, prevalence of spirometric conditions increased with age (Table 11),
despite the fact that the reference curves already took age into account. Reported
symptoms of chronic bronchitis also tended to increase with age, but the differences
were not significant. No clear age patterns were found for breathlessness or wheezing.
In terms of medical diagnoses, only emphysema showed an increase with age.
Smoking
Table 11 shows that, also as expected, smoking was strongly associated with all
spirometric outcomes. Prevalence among smokers were increased by two to threefold
among smokers relative to non-smokers, while ex-smokers tended to present
intermediate levels. All associations were significant. Smokers were also more likely to
report wheezing symptoms (P<0.001) but not breathlessness or chronic bronchitis.
There was no clear association between smoking and medically diagnosed conditions,
rather surprisingly, but this may be explained by careseeking patterns.
Schooling
The number of years of formal education was inversely associated with all
spirometric diagnoses (Table 11), although the association with ERS was of borderline
significance (P=0.07). Low education was also associated with a significantly higher
prevalence of symptoms of breathlessness and wheezing, while the association with
symptomatic chronic bronchitis was nearly significant (P=0.08). On the other hand, no
associations were found with medically diagnosed conditions.
25
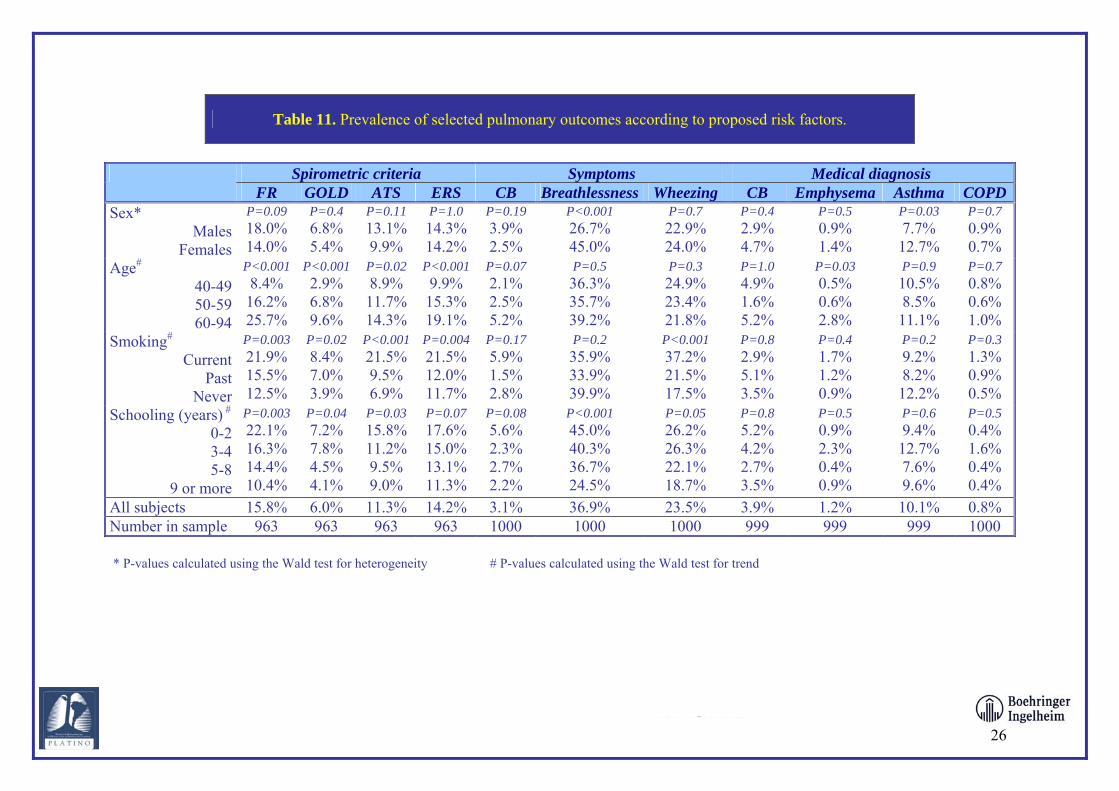
Table 11. Prevalence of selected pulmonary outcomes according to proposed risk factors.
Spirometric criteria Symptoms Medical diagnosis
FR GOLD ATS ERS CB Breathlessness Wheezing CB Emphysema Asthma COPD Sex*
MalesFemales
P=0.09 18.0% 14.0%
P=0.4 6.8% 5.4%
P=0.11 13.1% 9.9%
P=1.0 14.3% 14.2%
P=0.19 3.9% 2.5%
P<0.001 26.7% 45.0%
P=0.7 22.9% 24.0%
P=0.4 2.9% 4.7%
P=0.5 0.9% 1.4%
P=0.03 7.7% 12.7%
P=0.7 0.9% 0.7%
Age#
40-4950-5960-94
P<0.001 8.4% 16.2% 25.7%
P<0.0012.9% 6.8% 9.6%
P=0.02 8.9% 11.7% 14.3%
P<0.0019.9% 15.3% 19.1%
P=0.07 2.1% 2.5% 5.2%
P=0.5 36.3% 35.7% 39.2%
P=0.3 24.9% 23.4% 21.8%
P=1.0 4.9% 1.6% 5.2%
P=0.03 0.5% 0.6% 2.8%
P=0.9 10.5% 8.5% 11.1%
P=0.7 0.8% 0.6% 1.0%
Smoking#
CurrentPast
Never
P=0.003 21.9% 15.5% 12.5%
P=0.02 8.4% 7.0% 3.9%
P<0.00121.5% 9.5% 6.9%
P=0.00421.5% 12.0% 11.7%
P=0.17 5.9% 1.5% 2.8%
P=0.2 35.9% 33.9% 39.9%
P<0.001 37.2% 21.5% 17.5%
P=0.8 2.9% 5.1% 3.5%
P=0.4 1.7% 1.2% 0.9%
P=0.2 9.2% 8.2% 12.2%
P=0.3 1.3% 0.9% 0.5%
Schooling (years) #
0-23-45-8
9 or more
P=0.003 22.1% 16.3% 14.4% 10.4%
P=0.04 7.2% 7.8% 4.5% 4.1%
P=0.03 15.8% 11.2% 9.5% 9.0%
P=0.07 17.6% 15.0% 13.1% 11.3%
P=0.08 5.6% 2.3% 2.7% 2.2%
P<0.001 45.0% 40.3% 36.7% 24.5%
P=0.05 26.2% 26.3% 22.1% 18.7%
P=0.8 5.2% 4.2% 2.7% 3.5%
P=0.5 0.9% 2.3% 0.4% 0.9%
P=0.6 9.4% 12.7% 7.6% 9.6%
P=0.5 0.4% 1.6% 0.4% 0.4%
All subjects 15.8% 6.0% 11.3% 14.2% 3.1% 36.9% 23.5% 3.9% 1.2% 10.1% 0.8%Number in sample 963 963 963 963 1000 1000 1000 999 999 999 1000 * P-values calculated using the Wald test for heterogeneity # P-values calculated using the Wald test for trend
26
3.4.3. Additional crude analyses
The analyses shown in the preceding sections demonstrated that reported
symptoms and medical diagnoses were not reliable and failed to show associations with
well-known determinants of poor lung function. Thus, the detailed analyses of other risk
factors were restricted to two spirometric outcomes: GOLD and FR. The GOLD criteria
are used because they are the most frequently employed in the international literature,
and FR has the advantage of not requiring the use of reference curves. Results according
to the ATS and ERS criteria are shown in Annex 1.
FR criteria
Table 12 shows the unadjusted prevalence of COPD according to FR criteria
(COPD/FR), as well as the corresponding prevalence ratios and confidence intervals, for
the demographic and socioeconomic risk factors. Table 13 shows the same information
for the behavioral and environmental risk factors.
Men were 29% more likely than women to present with COPD/FR, but the
difference was not quite significant (P=0.09). Individuals aged 60 or over were three
times more likely to present with COPD/FR than those aged 40-49 years. There were no
significant associations with skin color. There was no association between a family
history of bronchitis, emphysema or COPD and the spirometric results.
Subjects with up to two years of formal education were twice as likely to present
COPD/FR as those with nine or more years of schooling. Schooling of the father, on the
other hand, was not significantly associated with COPD/FR.
Smoking was also strongly associated with COPD/FR. Ex-smokers had 24%
higher risk, and current smokers showed an increase of 76%. A strong dose-response
association was also found with lifetime consumption of cigarettes. Reported passive
smoking in the past two weeks was not significantly associated with the outcome.
Hospital admissions due to respiratory disease did not show any association with
COPD/FR. Reported exposure to dust in the workplace for 10 years or more was
associated with a 52% increase in the risk of COPD. Exposure to coal smoke in the
home also increased the prevalence of COPD/FR by 50%, while exposure to domestic
biomass smoke was not associated with the outcome.
27

GOLD criteria
The unadjusted analyses of risk factors for COPD using the GOLD criteria
(COPD/GOLD) are presented in Tables 14 and 15. Most results were very similar to
those obtained with COPD/FR, although P levels in Tables 14 and 15 tended to be
higher than those in Tables 12 and 13 because prevalence of COPD/GOLD is lower
than that of COPD/FR and therefore statistical power is reduced.
A possible difference was observed for only one exposure. Subjects reporting a
respiratory disease admission in childhood showed a 75% higher prevalence of
COPD/GOLD, but this difference was not significant (P=0.3).
Table 12. Crude analysis between COPD (fixed ratio criteria) and the demographic and socioeconomic independent variables
Variable % COPD Fixed Ratio Criteria PR (CI95%) P-value
Sex Men Women
18.0% 14.0%
1.29 (0.96; 1.73)
1.00
0.09*
Age 40-49 50-59 ≥ 60
8.4% 16.2% 25.7%
1.00
1.94 (1.40; 2.69) 3.08 (2.22; 4.27)
<0.001#
Skin color / ethnicity White Mulatto Black Native Brazilians Asian
16.2% 12.8% 18.6% 21.7% 22.7%
1.00
0.79 (0.55; 1.15) 1.15 (0.74; 1.77) 1.34 (0.60; 3.01) 1.40 (0.61; 3.23)
0.4*
Family history of COPD, bronchitis or emphysema No Yes
15.7% 16.3%
1.00 1.04 (0.65; 1.66)
0.9*
Schooling level 0-2 3-4 5-8 ≥ 9
22.1% 16.3% 14.4% 10.4%
2.13 (1.28; 3.55) 1.58 (0.97; 2.57) 1.39 (0.80; 2.43)
1.00
0.003#
Schooling of the father None Some Do not know
16.0% 13.9% 17.1%
1.00
0.87 (0.61; 1.25) 1.10 (0.72; 1.58)
0.7*
* Wald test for heterogeneity # Wald test for trend
28
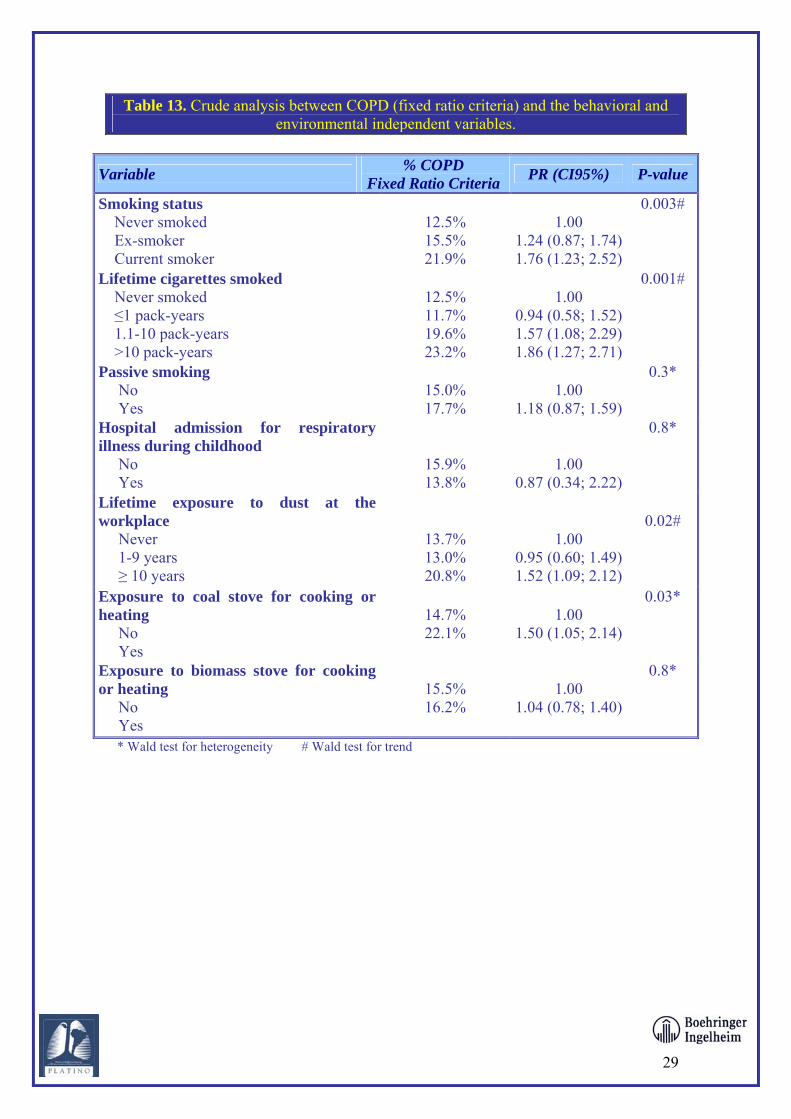
Table 13. Crude analysis between COPD (fixed ratio criteria) and the behavioral and environmental independent variables.
Variable % COPD Fixed Ratio Criteria PR (CI95%) P-value
Smoking status Never smoked Ex-smoker Current smoker
12.5% 15.5% 21.9%
1.00
1.24 (0.87; 1.74) 1.76 (1.23; 2.52)
0.003#
Lifetime cigarettes smoked Never smoked ≤1 pack-years 1.1-10 pack-years >10 pack-years
12.5% 11.7% 19.6% 23.2%
1.00
0.94 (0.58; 1.52) 1.57 (1.08; 2.29) 1.86 (1.27; 2.71)
0.001#
Passive smoking No Yes
15.0% 17.7%
1.00
1.18 (0.87; 1.59)
0.3*
Hospital admission for respiratory illness during childhood No Yes
15.9% 13.8%
1.00 0.87 (0.34; 2.22)
0.8*
Lifetime exposure to dust at the workplace Never 1-9 years ≥ 10 years
13.7% 13.0% 20.8%
1.00 0.95 (0.60; 1.49) 1.52 (1.09; 2.12)
0.02#
Exposure to coal stove for cooking or heating No Yes
14.7% 22.1%
1.00
1.50 (1.05; 2.14)
0.03*
Exposure to biomass stove for cooking or heating No Yes
15.5% 16.2%
1.00
1.04 (0.78; 1.40)
0.8*
* Wald test for heterogeneity # Wald test for trend
29

Table 14. Crude analysis between COPD (GOLD criteria) and the demographic and socioeconomic independent variables.
Variable % COPD Gold Criteria PR (CI95%) P-value
Sex Men Women
6.8% 5.4%
1.26 (0.75; 2.10)
1.00
0.4*
Age 40-49 50-59 ≥ 60
2.9% 6.8% 9.6%
1.00
2.37 (1.21; 4.66) 3.33 (1.73; 6.39)
<0.001#
Skin color / ethnicity White Mulatto Black Native Brazilians Asian
5.8% 5.3% 9.3% 4.4% 9.1%
1.00
0.92 (0.49; 1.70) 1.61 (0.83; 3.15) 0.76 (0.10; 5.88) 1.58 (0.41; 6.05)
0.6*
Family history of COPD, bronchitis or emphysema No Yes
5.6% 8.5%
1.00 1.52 (0.84; 1.75)
0.16*
Schooling level 0-2 3-4 5-8 ≥ 9
7.2% 7.8% 4.5% 4.1%
1.78 (0.82; 3.85) 1.93 (0.93; 3.99) 1.11 (0.45; 2.77)
1.00
0.04#
Schooling of the father None Some Do not know
6.7% 5.6% 5.3%
1.00
0.83 (0.46; 1.52) 0.80 (0.39; 1.62)
0.8*
* Wald test for heterogeneity # Wald test for trend
30

Table 15. Crude analysis between COPD (GOLD criteria) and the behavioral and environmental independent variables.
Variable % COPD Gold Criteria PR (CI95%) P-value
Smoking status Never smoked Ex-smoker Current smoker
3.9% 7.0% 8.4%
1.00
1.78 (0.90; 3.53) 2.16 (1.07; 4.35)
0.02#
Lifetime cigarettes smoked Never smoked ≤1 pack-years 1.1-10 pack-years >10 pack-years
3.9% 2.6% 10.1% 9.5%
1.00
0.66 (0.22; 2.04) 2.57 (1.24; 5.34) 2.42 (1.21; 4.84)
0.003#
Passive smoking No Yes
5.8% 6.6%
1.00
1.13 (0.71; 1.82)
0.6*
Hospital admission for respiratory illness during childhood No Yes
5.9% 10.3%
1.00 1.75 (0.56; 5.54)
0.3*
Lifetime exposure to dust at the workplace Never 1-9 years ≥ 10 years
4.6% 6.1% 8.0%
1.00 1.33 (0.67; 1.61) 1.75 (1.00; 3.07)
0.05#
Exposure to coal stove for heating No Yes
5.1% 11.0%
1.00
2.15 (1.24; 3.71)
0.007*
Exposure to biomass stove for heating No Yes
6.3% 5.7%
1.00
0.91 (0.56; 1.98)
0.7*
31
* Wald test for heterogeneity # Wald test for trend
3.4.4. Multivariable analyses
The multivariable analyses took into account three levels of determination of the
outcome (Victora, 1997) (Figure 7). The most distal level included sex, age, skin color
and a family history of bronchitis, emphysema or COPD, which are biological
characteristics that may influence other determinants of CODP. The second level
includes schooling, which is mostly determined in childhood and adolescence. The third
level incorporates exposures that refer to the subjects’ earlier life: hospital admissions,
exposure to dust in the workplace, exposure to domestic smoke. The current exposure is
smoking (level 4).
32
Due to the high level of co linearity between smoking status (non, ex, current
smoker), passive smoking and lifetime exposure (pack-years), it was not possible to
have all these variables in the model and thus we opted for retaining smoking status.
Paternal schooling was also not included in these analyses because of the high number
of unknown answers.

Figure 7. Conceptual framework for guiding the multivariable analyses.
These analyses are presented separately for the FR and GOLD criteria.
FR criteria
Table 16 shows the results of the GOLD/FR outcome. The effects of sex, age,
skin color and family history were very similar to those obtained in the unadjusted
analyses. Because skin color and family history had P levels greater than 0.20, they
were excluded from the model because they cannot confound the effect of other
exposures due to their lack of association with the outcome.
In the second level of analyses, schooling for up to two years was associated
with a 51% increase in COPD/FR, a marked reduction from the crude analyses in which
there was a 113% increase; this variable was not quite significant (P=0.14). The crude
33
SEX AGE
SKIN COLOR FAMILY HISTORY OF BRONCHITIS, EMPHYSEMA OR COPD
RESPIRATORY ADMISSION IN CHILDHOOD EXPOSURE TO COAL STOVE FOR COOKING OR HEATING
EXPOSURE TO BIOMASS STOVE FOR COOKING OR HEATING WORKPLACE EXPOSURE TO DUST
SMOKING STATUS
COPD
SCHOOLING

association of schooling with COPD was being confounded by age, because older
subjects had both lower schooling and poor lung function.
History of respiratory admission and exposure to biomass smoke were not
significant. Workplace dust exposure, which had been associated in the crude analyses,
showed a borderline level of association (P=0.08) after adjustment. The same P level as
observed for domestic exposure to coal smoke, which was associated with a 40%
increase in the prevalence of COPD/FR.
Smoking and continued to be significantly associated with the outcome.
Smokers had a 104% increase relative to non-smokers, compared to a 76% increase in
the crude analyses.
Therefore, the adjusted analyses showed significant effects of age and smoking.
Sex, schooling, workplace exposure to dust and domestic exposure to coal smoke
showed associations with P levels between 0.06 and 0.14.
34

Table 16. Adjusted analysis between COPD (fixed ratio criteria) and the independent
variables.
Level¨ Variable PR (CI95%) P-value 1 Sex
Men Women
1.32 (0.99; 1.76)
1.00
0.06*
1
Age 40-49 50-59 ≥ 60
1.00
1.94 (1.40; 2.67) 3.11 (2.24; 4.31)
<0.001#
1 Skin color / ethnicity White Mulatto Black Native Brazilians Asian
1.00
0.87 (0.61; 1.25) 1.21 (0.79; 1.87) 1.32 (0.60; 2.86) 1.35 (0.65; 2.80)
0.6*
1 Family history of COPD, bronchitis or emphysema No Yes
1.00
1.05 (0.66; 1.66)
0.9*
2 Schooling level 0-2 3-4 5-8 ≥ 9
1.51 (0.91; 2.50) 1.20 (0.73; 1.97) 1.27 (0.73; 2.20)
1.00
0.14#
3 Hospital admission for respiratory illness during childhood No Yes
1.00 1.18 (0.49; 2.89)
0.7*
3 Lifetime exposure to dust at the work-place Never 1-9 years ≥ 10 years
1.00
1.04 (0.66; 1.64) 1.36 (0.96; 1.93)
0.08#
3 Exposure to biomass stove for heating or cooking No Yes
1.00
0.88 (0.66; 1.17)
0.4*
3 Exposure to coal stove for heating or cooking No Yes
1.00
1.40 (0.96; 2.03)
0.08*
4 Smoking status Never smoked Ex-smoker Current smoker
1.00
1.23 (0.88; 1.72) 2.04 (1.41; 2.95)
<0.001#
35
* Wald test for heterogeneity # Wald test for trend ¨ Level of the variable in the hierarchical model
GOLD criteria
Table 17 shows the results of the multivariable analyses for the COPD/GOLD
outcome. Although men had a 28% higher prevalence, the difference was not significant
(P=0.3). Age was positively associated with the outcome, with a 233% increase for
those aged 60 years or more. Skin color was not associated with COPD/GOLD.
Subjects with a family history of CODP shows a 54% increase in prevalence, but this
was not significant (P=0.16).
In the second level of analyses, schooling for up to two years was associated
with a 25% increase in COPD/GOLD, a non-significant difference (P=0.4). The crude
effect of schooling was being confounded by age again.
Subjects exposed for 10 years or more to dust at the workplace had a 75%
increase in prevalence (P=0.05). Domestic exposure to coal smoke led to a 106%
increase in prevalence (P=0.02), while hospital admission due to respiratory disease in
childhood was associated with a 116% increase (P=0.19). Exposure to biomass smoke
was not associated with COPD.
Smoking continued to be significantly associated with the outcome. Smokers
had a 157% increase relative to non-smokers, compared to an 81% increase for ex-
smokers.
In short, the adjusted analyses showed significant effects of age, exposure to
dust and coal, and smoking. Family history (P=0.16), schooling (P=0.4) and hospital
admission due to respiratory disease in childhood (P=0.19) showed associations in the
expected direction but that were not significant. These results were quite comparable
with those observed in the multivariable analyses of COPD/FR, as shown by the
prevalence ratios in Tables 9 and 10. P levels for GOLD tended to be less significant
because prevalence and therefore statistical power were smaller.
36

Table 17. Adjusted analysis between COPD (GOLD criteria) and the independent variables.
Level¨ Variable PR (CI95%) P-value
1 Sex Men Women
1.28 (0.77; 2.12)
1.00
0.3*
1
Age 40-49 50-59 ≥ 60
1.00
2.37 (1.21; 4.66) 3.33 (1.73; 6.39)
<0.001#
1 Skin color / ethnicity White Mulatto Black Native Brazilians Asian
1.00
1.00 (0.54; 1.85) 1.70 (0.87; 3.30) 0.74 (0.10; 5.52) 1.51 (0.43; 5.27)
0.5*
1 Family history of COPD, bronchitis or emphysema No Yes
1.00
1.54 (0.84; 2.81)
0.16*
2 Schooling level 0-2 3-4 5-8 ≥ 9
1.25 (0.57; 2.74) 1.46 (0.67; 3.19) 1.01 (0.42; 2.47)
1.00
0.4#
3 Lifetime exposure to dust at the work-place Never 1-9 years ≥ 10 years
1.00
1.65 (0.81; 3.35) 1.75 (0.99; 3.09)
0.05#
3 Hospital admission for respiratory illness during childhood No Yes
1.00 2.16 (0.67; 6.90)
0.19*
3 Exposure to biomass stove for heating or cooking No Yes
1.00
0.88 (0.66; 1.17)
0.4*
3 Exposure to coal stove for heating or cooking No Yes
1.00
2.06 (1.16; 3.65)
0.02*
4 Smoking status Never smoked Ex-smoker Current smoker
1.00
1.81 (0.89; 3.65) 2.57 (1.19; 5.53)
0.01#
* Wald test for heterogeneity # Wald test for trend ¨ Level of the variable in the hierarchical model
37
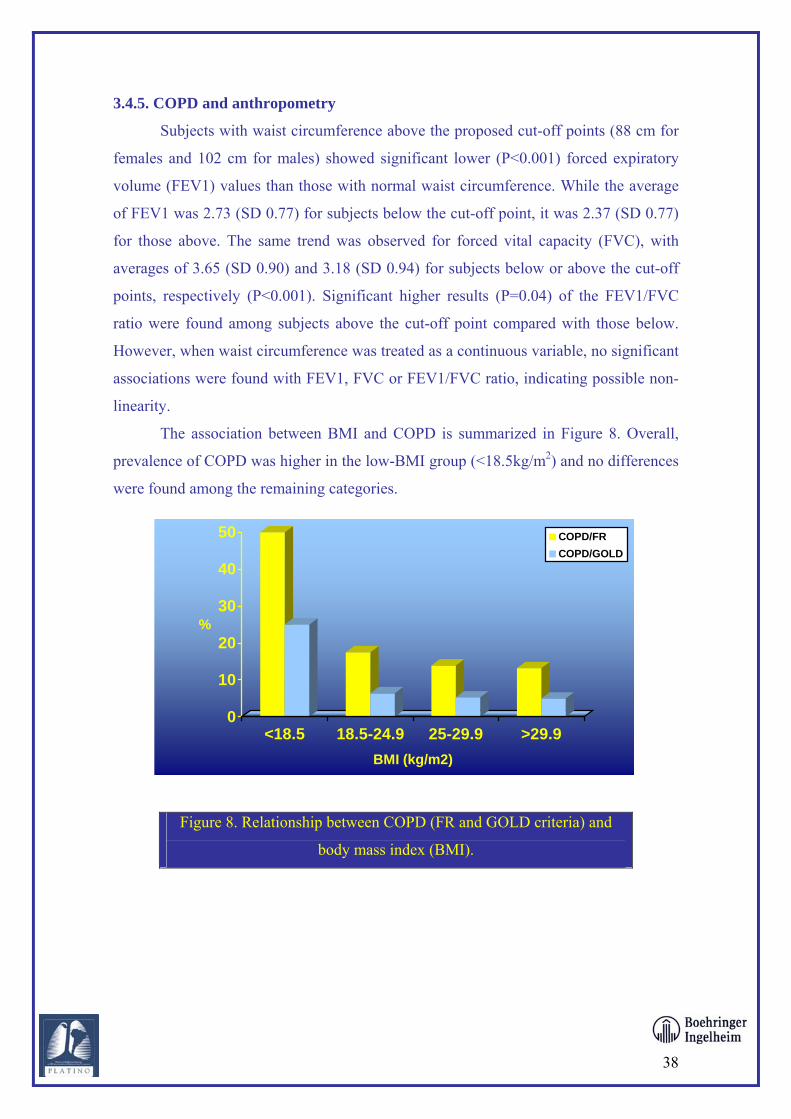
3.4.5. COPD and anthropometry
Subjects with waist circumference above the proposed cut-off points (88 cm for
females and 102 cm for males) showed significant lower (P<0.001) forced expiratory
volume (FEV1) values than those with normal waist circumference. While the average
of FEV1 was 2.73 (SD 0.77) for subjects below the cut-off point, it was 2.37 (SD 0.77)
for those above. The same trend was observed for forced vital capacity (FVC), with
averages of 3.65 (SD 0.90) and 3.18 (SD 0.94) for subjects below or above the cut-off
points, respectively (P<0.001). Significant higher results (P=0.04) of the FEV1/FVC
ratio were found among subjects above the cut-off point compared with those below.
However, when waist circumference was treated as a continuous variable, no significant
associations were found with FEV1, FVC or FEV1/FVC ratio, indicating possible non-
linearity.
The association between BMI and COPD is summarized in Figure 8. Overall,
prevalence of COPD was higher in the low-BMI group (<18.5kg/m2) and no differences
were found among the remaining categories.
Figure 8. Relationship between COPD (FR and GOLD criteria) and
body mass index (BMI).
38
0
10
20
30
40
50
%
<18.5 18.5-24.9 25-29.9 >29.9BMI (kg/m2)
COPD/FRCOPD/GOLD

3.5. Additional analyses
3.5.1. Co-morbidity
Table 18 shows the lifetime prevalence of medical diagnoses for some key
conditions. Hypertension and “gastritis” were reported by over 30% of all subjects.
Diabetes and heart problems were reported by 10-15%, and other conditions were less
frequently reported. Given the subjective nature of this information, these variables
should be interpreted with due caution.
One variable from this subset was chosen for the repeatability analyses. Lifetime
history of a diagnosis of tuberculosis, when checked by a supervisor on a later occasion,
resulted in a kappa coefficient of 1.0, showing perfect agreement between the original
interview and the re-interview. The kappa statistic was not calculated for the other
conditions.
Table 18. Lifetime prevalence of selected medical diagnoses.
Condition Prevalence Hypertension 40.6% Gastritis 31.2% Heart problem 15.3% Diabetes 11.7% Stroke 3.3% Tuberculosis 2.8% Lung cancer 0.8%
Table 19 shows the associations between these reported diagnoses and COPD.
Except for a significant association between lung cancer and the FR result, all other
associations were non-significant.
39
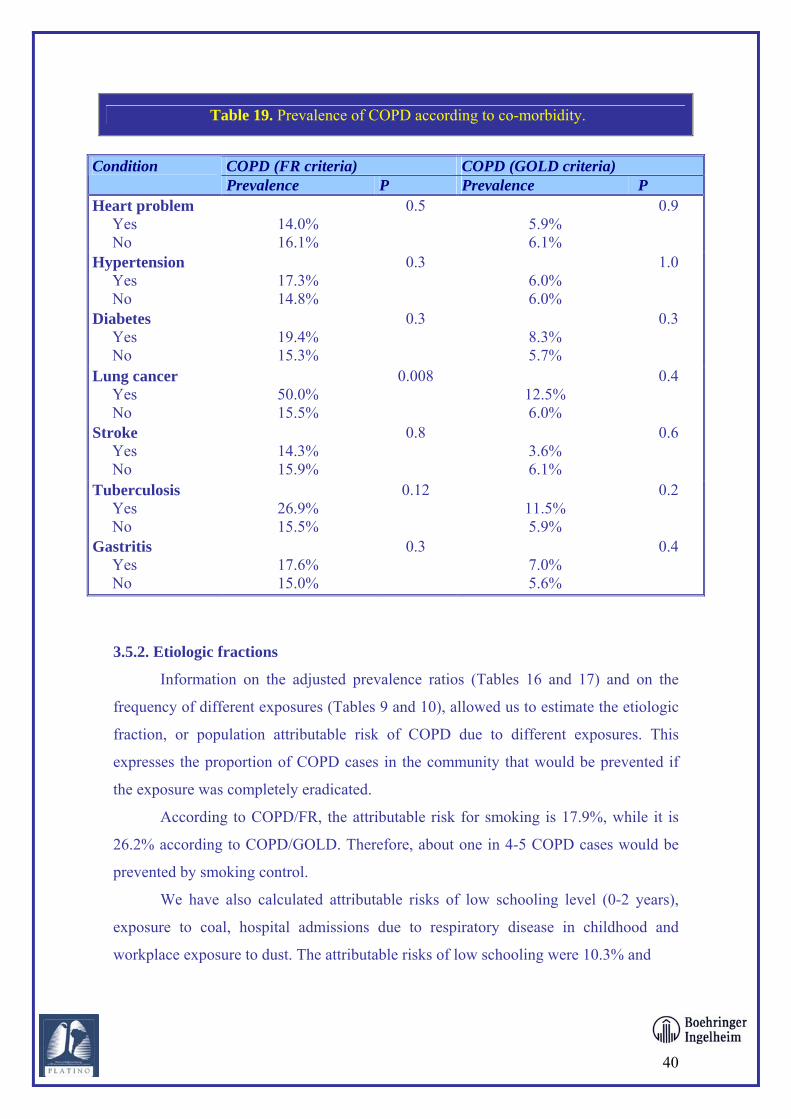
Table 19. Prevalence of COPD according to co-morbidity.
COPD (FR criteria) COPD (GOLD criteria) Condition Prevalence P Prevalence P
Heart problem Yes No
14.0% 16.1%
0.5 5.9% 6.1%
0.9
Hypertension Yes No
17.3% 14.8%
0.3 6.0% 6.0%
1.0
Diabetes Yes No
19.4% 15.3%
0.3 8.3% 5.7%
0.3
Lung cancer Yes No
50.0% 15.5%
0.008 12.5% 6.0%
0.4
Stroke Yes No
14.3% 15.9%
0.8 3.6% 6.1%
0.6
Tuberculosis Yes No
26.9% 15.5%
0.12 11.5% 5.9%
0.2
Gastritis Yes No
17.6% 15.0%
0.3 7.0% 5.6%
0.4
3.5.2. Etiologic fractions
Information on the adjusted prevalence ratios (Tables 16 and 17) and on the
frequency of different exposures (Tables 9 and 10), allowed us to estimate the etiologic
fraction, or population attributable risk of COPD due to different exposures. This
expresses the proportion of COPD cases in the community that would be prevented if
the exposure was completely eradicated.
According to COPD/FR, the attributable risk for smoking is 17.9%, while it is
26.2% according to COPD/GOLD. Therefore, about one in 4-5 COPD cases would be
prevented by smoking control.
We have also calculated attributable risks of low schooling level (0-2 years),
exposure to coal, hospital admissions due to respiratory disease in childhood and
workplace exposure to dust. The attributable risks of low schooling were 10.3% and
40

7.4% for the COPD/FR and COPD/GOLD criteria, respectively. For exposure to coal,
the same values were 5.7% and 13.7%. Hospital admissions due to respiratory disease in
childhood presented attributable risks of 0.5% and 3.3% for COPD/FR and
COPD/GGOLD, respectively. Finally, the corresponding figures for workplace
exposure to dust for 10 years or more were 10.6% and 19.8%.
3.5.3. Role of smoking in the gender differential in COPD
Male sex was associated with a higher risk of COPD with borderline
significance, according to three of the four spirometric criteria used. However, these
associations were greatly reduced after controlling for smoking status. The male/female
prevalence ratio was 1.32 for COPD/FR, but when we control for smoking, the value is
1.13. For the COPD/GOLD indicator, the value decreased from 1.28 to 1.11. For the
ATS criteria, these values were 1.33 and 1.07. This shows that most of the excess in
COPD among males is due to the fact that they smoke more often.
3.6. Medical management Overall, 7.9% of the individuals reported having used medicines for lung or
respiratory problems in the previous 12 months (Table 20). The prevalence rates for
COPD/FR positive and negative were, respectively, 18.4% and 5.9% (P<0.001). The
most frequently used drugs were salbutamol, fenoterol, aminophylline and ipratropium
(Table 20). Among salbutamol users, 62.5% used it via syrup, which is not
recommended, while only 37.5% used sprays or inhalation. Most subjects (84.6%)
reported using this drug only for symptomatic relief, which is also inadequate.
Although influenza immunization is recommended for all COPD patients, only
30.9% of those who were COPD/FR positive reported being vaccinated in the previous
year, compared to 20.9% of the remainder (P<0.001).
Subjects were asked if they had ever been submitted to spirometry. The lifetime
frequency was 10.1%, almost the same for COPD/FR positive (10.5%) and negative
(9.5%). On the other hand, this prevalence was strongly associated with schooling level;
4.3% among subjects with 0-2 years of formal education; 9.1% in the 3-4 years group;
9.3% of the 5-8 years group; and 17.8% of the 9 years or more.
41
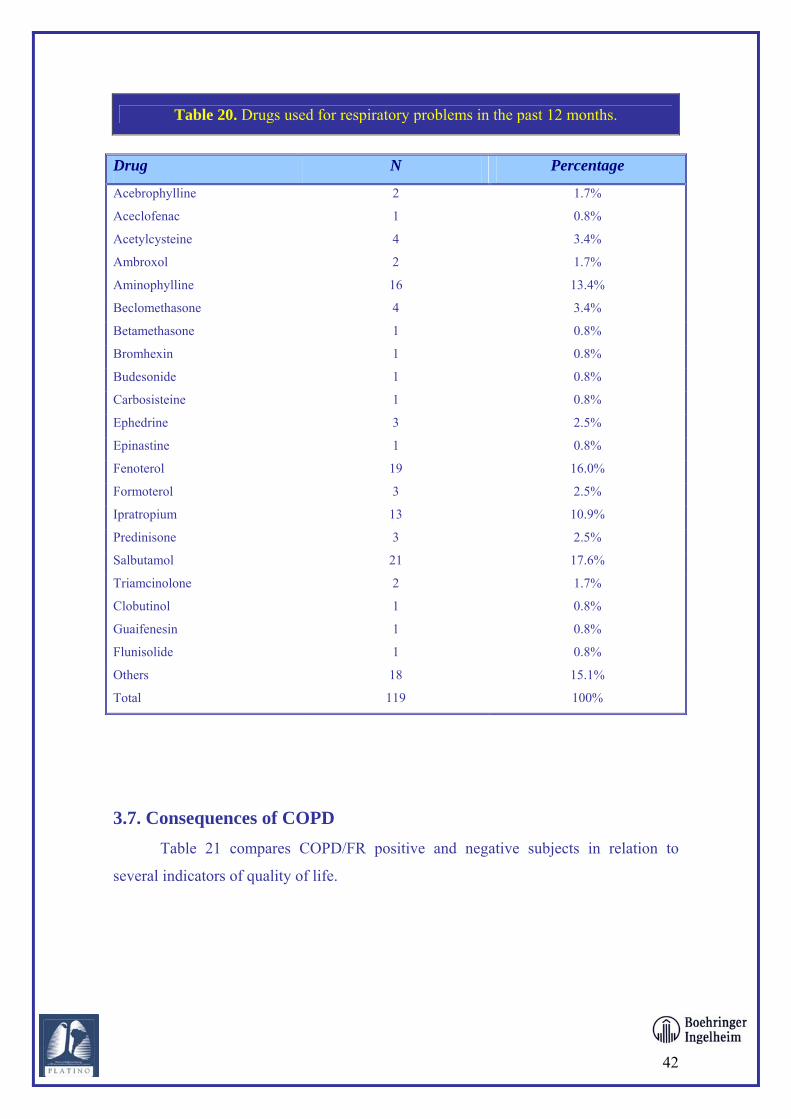
Table 20. Drugs used for respiratory problems in the past 12 months.
Drug N Percentage
Acebrophylline 2 1.7%
Aceclofenac 1 0.8%
Acetylcysteine 4 3.4%
Ambroxol 2 1.7%
Aminophylline 16 13.4%
Beclomethasone 4 3.4%
Betamethasone 1 0.8%
Bromhexin 1 0.8%
Budesonide 1 0.8%
Carbosisteine 1 0.8%
Ephedrine 3 2.5%
Epinastine 1 0.8%
Fenoterol 19 16.0%
Formoterol 3 2.5%
Ipratropium 13 10.9%
Predinisone 3 2.5%
Salbutamol 21 17.6%
Triamcinolone 2 1.7%
Clobutinol 1 0.8%
Guaifenesin 1 0.8%
Flunisolide 1 0.8%
Others
Total
18
119
15.1%
100%
3.7. Consequences of COPD Table 21 compares COPD/FR positive and negative subjects in relation to
several indicators of quality of life.
42

Table 21. Association between COPD/FR status and quality of life indicators.
Prevalence according to
COPD/FR status Quality of life indicator
Positive Negative
P
Difficulty in carrying out moderate physical activities 9.9% 5.7% 0.06
Difficulty in carrying out intense physical activities 13.2% 5.9% <0.001
Any limitation due to physical health in the past year 21.7% 14.3% 0.02
Any limitation in the workplace due to physical health 17.1% 16.1% 0.7
Any limitation due to mental health in the past year 23.0% 16.3% 0.05
Any limitation in the workplace due to mental health 18.4% 14.2% 0.16
An additional question inquired whether lung disease affected daily activities in
the past year. Of COPD/FR positive subjects, 17.1% answered affirmatively, while
8.5% of the remainder did so (P=0.002).
3.8. Economic impact of COPD Formal employment in the previous 12 months was reported by 57.1%
individuals (47.4% among COPD/FR positive and 60.0% among the negative;
P=0.004). This difference disappeared, however, after adjustment for age, because both
COPD and unemployment were more common among older subjects.
Among the 429 individuals who did not work in the previous years, 2.1%
reported that this was due to lung disease.
43
Approximately one in ten individuals (10.2%) reported having limited leisure
activities due to health problems. The percentages were 13.8% and 8.5% among
COPD/FR positive and negative subjects, respectively (P=0.04).

4. DISCUSSION This is the final report from the first site of the PLATINO study. As such, the
present results have to be interpreted with caution because, for most comparisons being
made, the required sample size will only be reached after data from the four other
centers become available in the near future. Therefore, the present Discussion section
will be limited to an outline of the main results and recommendations for other study
sites. A full discussion of the implications of the study will be prepared after data
collection in all sites is completed.
4.1 Discussion of methodological issues The positive aspects of the study include the relatively high response rate of
84.7%. Given the size of the study area and the high levels of violence, with the
consequent reluctance of the population to welcome strangers, the response rate is
remarkable. Men, however, were more likely to refuse participation than women.
Response rates among smokers and non-smokers were similar.
The study demonstrated that the spirometric examinations were acceptable to a
vast majority of the sample, and only 2% of those eligible accepted to undergo the
exam. Other positive aspects included the strong quality control and standardization
protocols.
4.2. Discussion of main results Prevalence estimates for COPD varied markedly according to the criteria used.
When the study was designed it was agreed that the COPD/FR criterion would be used
as the main outcome of the study. This showed that 15.8% of all subjects were affected,
that is, about one in every six individuals.
As expected, when the GOLD criteria were used, prevalence was markedly
lower (6.0%) because these criteria are more specific. Also as expected, clinical
symptoms showed wide variability and low validity. Medical diagnoses related to
COPD (either chronic bronchitis, emphysema or COPD diagnoses) were reported by
5.3% of all subjects.
44

The analyses of risk factors were affected by the low statistical power of the
study, which was designed as a collaborative study for which final analyses will await
data from other sites. Our preliminary analyses showed that age, smoking and exposure
to coal smoke were significantly associated with COPD. Possible associations were also
detected with sex, schooling, and exposure to dust in the workplace. A comparison of
our results with the medical literature will be carried out after the final analyses.
COPD was also associated with anthropometric variables (BMI and abdominal
circumference), but this association must be interpreted with caution due to the
possibility of reverse causality, that is, that pulmonary illness may have led to weight
loss.
Regarding case-management, important problems were identified. Most subjects
with COPD do not take medication that could substantially improve their condition, and
those who take such medication often do it inappropriately, both in terms of the route of
administration and of its frequency. Preventive interventions are also inadequate; only
one in three of the diseased, for example, receive flu vaccination in the previous year.
Finally, diagnostic procedures were poor; the percentages of subjects who ever
underwent spirometry were similar among the COPD positive and negative.
We have also shown that presence of COPD has important consequences on the
daily activities and quality of life of those affected.
4.3. Conclusions The São Paulo survey showed that the study protocol was adequate, having
resulted in a representative sample of a large metropolitan area with a high response
rate. Standardization and quality control procedures ensured that data quality was
appropriate. The study was carried out in a timely fashion. Field work lasted four
months, as planned, and the present final report has been concluded ten months after
interviewer training was started.
The experience gained in São Paulo was already employed in the
implementation of the study in Mexico City and Montevideo, and will be used in the
next sites to be added to the study.
45
Finally, we would like to thank the support provided by ALAT and BI, as well
as the continued participation of the PLATINO Steering Committee.
5. REFERENCES
Anthropometric Standardization Reference Manual. Lohman, Roche, Martorell, 1988.
ATS (American Thoracic Society). Standards for the diagnosis and care of patients with
chronic obstructive pulmonary disease. Am J Resp Crit Care Med 1995; 152: Suppl.5,
77-121.
Barros AJD, Hirakata VN. Alternatives for logistic regression in cross-sectional studies:
an empirical comparison of models that directly estimate the prevalence ratio. BMC
Medical Research Methodology 2003, 3:21.
BC Cancer Research Centre. Lung Health Study – Questionnaire. Vancouver: BCCA.
Disponível em: http://www.bccrc.ca/ci/lc02_title.html; 2003
Brasil. Ministério da Saúde. Informações de saúde on-line. Disponível em:
http://www.datasus.gov.br; 2003
Cyba Foundation Guest Symposium. Terminology, definition and classification of
chronic pulmonary emphysema and related conditions. Thorax 1959; 14:286-99.
ECRHS(European Community Respiratory Health Survey). European Community
Respiratory Health Survey II. Disponível em: http://www.ecrhs.org; 2003.
Ferris BG. Epidemiology standardization project. Am Rev Respir Dis 1978; 118:1-120.
Habicht JP. Estandarizacion de metodos epidemiologicos cuantitativos sobre el terreno.
Bol Of Sanit. Panam., 1974; Mayo: 375-84Hurd S. The impact of DPOC on lung health
worldwide. Chest 2000;117(2):1-4.
Kish L. Survey sampling. New York: John Wiley & Sons; 1965.
46

Menezes, AMB. Platino Project, 2002: multi-center survey of COPD in five major
Latin-American cities; 2002. (The “PLATINO” Survey; Proposal by Ana Menezes - on
behalf of ALAT with support by Boehringer-Ingelheim); 2002.
Pauwels R. DPOC. the scope of the problem in Europe. Chest 2000;117(5):332-335.
Pereira CAC, Barreto SP, Simões JG, Pereira FWL, Gerstler JG, Nakatani, J.Valores de
referencia para espirometria em uma amostra da população brasileira adulta. J Pneumol
1992; 18:10-22).
Petty TL. Scope of the DPOC problem in North America. Chest 2000;117(5):326-331.
Quanjer PH, Tammeling GJ, Cotes JE, Pedersen OF, Peslin R, Yernault JC. Lung
volumes and forced ventilatory flows. Report Working Party Standardization of Lung
Function Tests, European Community for Steel and Coal. Official Statement of the
European Respiratory Society. Eur Respir J 1993;6(Suppl 16):5-40.
Silva NN. Amostragem probabilística. 2 ed. São Paulo: EDUSP; 2002.
U.S. Department of Health and Human Services, National Center for Health Statistics.
Plan and operation of the Third National Health and Nutrition Examination Survey,
1988-94. Disponível em: http://www.cdc.gov; 2003.
Victora CG, Huttly SR, Fuchs SC, Olinto MTA. The role of conceptual frameworks in
epidemiological analysis: a hierarchical approach. Int J Epidemiol 1997; 26:224-7.
Viegi G, Pedreschi M, Pistelli F, Di Pede F, Baldacci S, Carrozzi L, Giuntini C.
Prevalence of airways obstruction in a general population: European Respiratory
Society vs American Thoracic Society definition. Chest 2000;117(5 Suppl 2):339S-
345S.
47
Ware JE, Kosinski M, Keller SD. SF-12: how to score the SF12 physical and mental
health summary scales. 2 ed. Boston: The Health Institute, New England Medical
Center; 1995.
48
WHO (World Health Organization). GOLD 2001: global strategy for the diagnosis,
management, and prevention of chronic obstructive pulmonary disease. Bethesda,
National Heart, Lung, and Blood Institute. Disponível em: http://www.goldcopd.com;
2001

49
ANNEX 1. TABLES OF COPD PREVALENCE ACCORDING ATS AND ERS CRITERIA
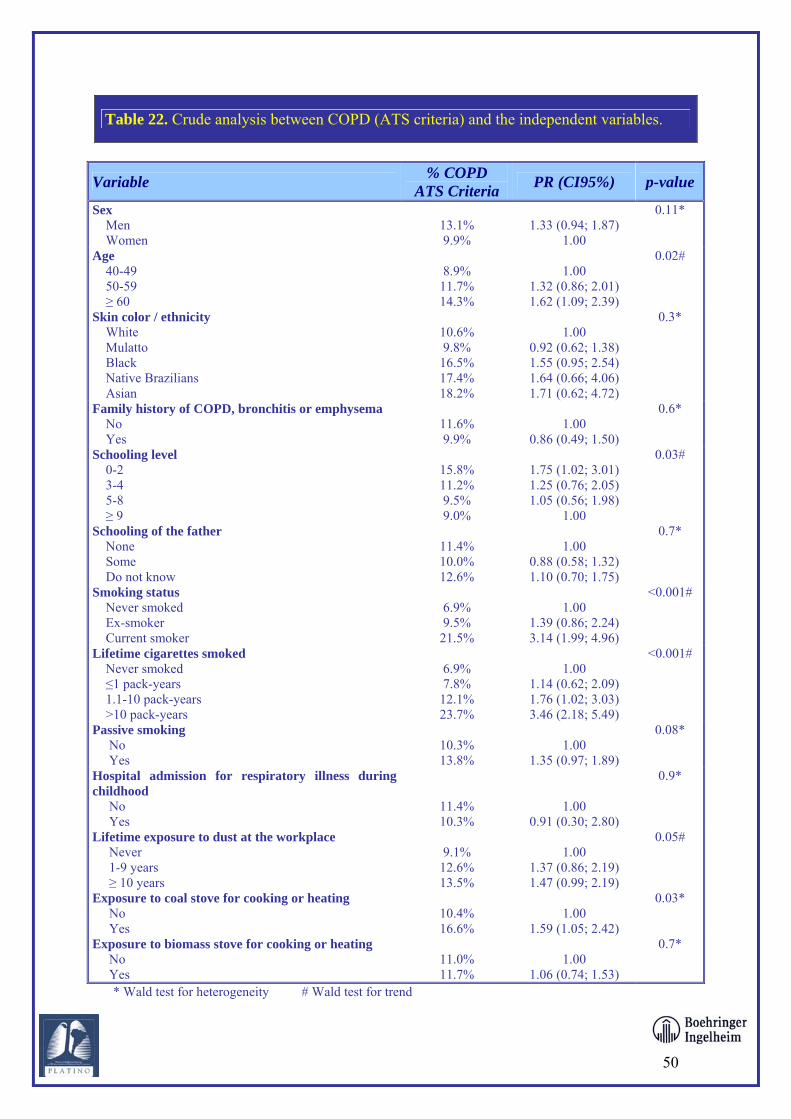
Table 22. Crude analysis between COPD (ATS criteria) and the independent variables.
Variable % COPD ATS Criteria PR (CI95%) p-value
Sex Men Women
13.1% 9.9%
1.33 (0.94; 1.87)
1.00
0.11*
Age 40-49 50-59 ≥ 60
8.9%
11.7% 14.3%
1.00
1.32 (0.86; 2.01) 1.62 (1.09; 2.39)
0.02#
Skin color / ethnicity White Mulatto Black Native Brazilians Asian
10.6% 9.8%
16.5% 17.4% 18.2%
1.00
0.92 (0.62; 1.38) 1.55 (0.95; 2.54) 1.64 (0.66; 4.06) 1.71 (0.62; 4.72)
0.3*
Family history of COPD, bronchitis or emphysema No Yes
11.6% 9.9%
1.00
0.86 (0.49; 1.50)
0.6*
Schooling level 0-2 3-4 5-8 ≥ 9
15.8% 11.2% 9.5% 9.0%
1.75 (1.02; 3.01) 1.25 (0.76; 2.05) 1.05 (0.56; 1.98)
1.00
0.03#
Schooling of the father None Some Do not know
11.4% 10.0% 12.6%
1.00
0.88 (0.58; 1.32) 1.10 (0.70; 1.75)
0.7*
Smoking status Never smoked Ex-smoker Current smoker
6.9% 9.5%
21.5%
1.00
1.39 (0.86; 2.24) 3.14 (1.99; 4.96)
<0.001#
Lifetime cigarettes smoked Never smoked ≤1 pack-years 1.1-10 pack-years >10 pack-years
6.9% 7.8%
12.1% 23.7%
1.00
1.14 (0.62; 2.09) 1.76 (1.02; 3.03) 3.46 (2.18; 5.49)
<0.001#
Passive smoking No Yes
10.3% 13.8%
1.00
1.35 (0.97; 1.89)
0.08*
Hospital admission for respiratory illness during childhood No Yes
11.4% 10.3%
1.00 0.91 (0.30; 2.80)
0.9*
Lifetime exposure to dust at the workplace Never 1-9 years ≥ 10 years
9.1%
12.6% 13.5%
1.00
1.37 (0.86; 2.19) 1.47 (0.99; 2.19)
0.05#
Exposure to coal stove for cooking or heating No Yes
10.4% 16.6%
1.00
1.59 (1.05; 2.42)
0.03*
Exposure to biomass stove for cooking or heating No Yes
11.0% 11.7%
1.00
1.06 (0.74; 1.53)
0.7*
* Wald test for heterogeneity # Wald test for trend
50
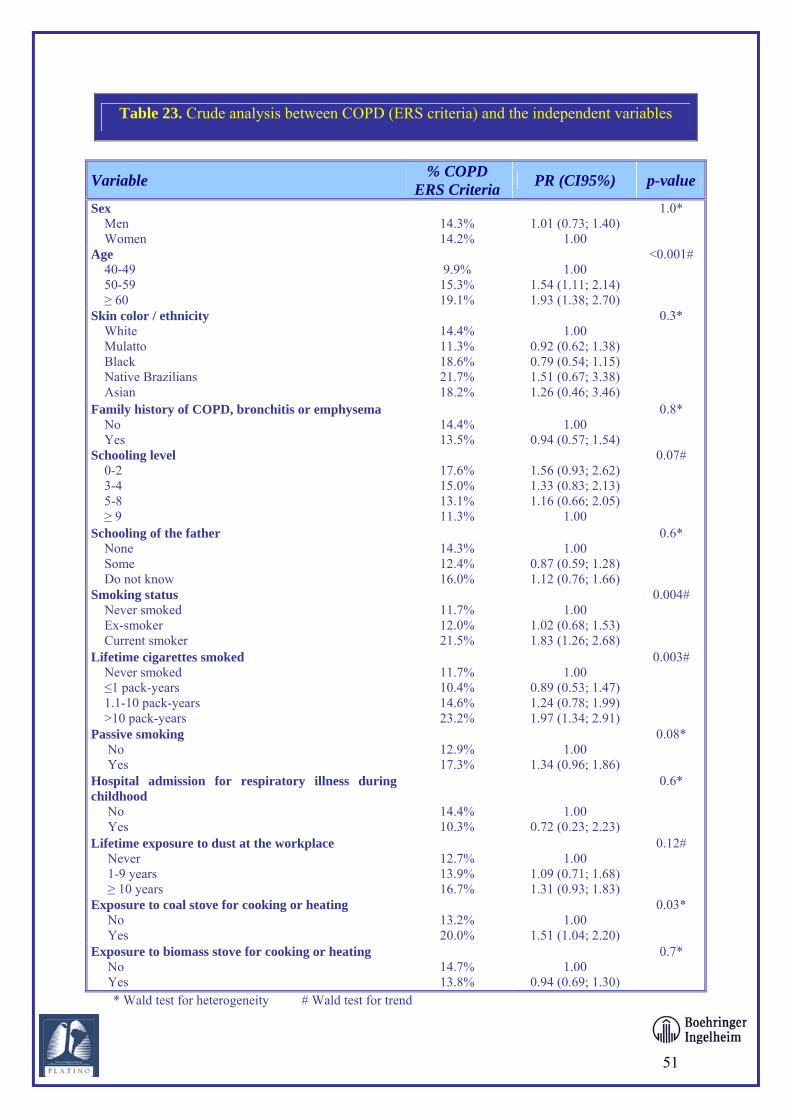
Table 23. Crude analysis between COPD (ERS criteria) and the independent variables
Variable % COPD ERS Criteria PR (CI95%) p-value
Sex Men Women
14.3% 14.2%
1.01 (0.73; 1.40)
1.00
1.0*
Age 40-49 50-59 ≥ 60
9.9%
15.3% 19.1%
1.00
1.54 (1.11; 2.14) 1.93 (1.38; 2.70)
<0.001#
Skin color / ethnicity White Mulatto Black Native Brazilians Asian
14.4% 11.3% 18.6% 21.7% 18.2%
1.00
0.92 (0.62; 1.38) 0.79 (0.54; 1.15) 1.51 (0.67; 3.38) 1.26 (0.46; 3.46)
0.3*
Family history of COPD, bronchitis or emphysema No Yes
14.4% 13.5%
1.00
0.94 (0.57; 1.54)
0.8*
Schooling level 0-2 3-4 5-8 ≥ 9
17.6% 15.0% 13.1% 11.3%
1.56 (0.93; 2.62) 1.33 (0.83; 2.13) 1.16 (0.66; 2.05)
1.00
0.07#
Schooling of the father None Some Do not know
14.3% 12.4% 16.0%
1.00
0.87 (0.59; 1.28) 1.12 (0.76; 1.66)
0.6*
Smoking status Never smoked Ex-smoker Current smoker
11.7% 12.0% 21.5%
1.00
1.02 (0.68; 1.53) 1.83 (1.26; 2.68)
0.004#
Lifetime cigarettes smoked Never smoked ≤1 pack-years 1.1-10 pack-years >10 pack-years
11.7% 10.4% 14.6% 23.2%
1.00
0.89 (0.53; 1.47) 1.24 (0.78; 1.99) 1.97 (1.34; 2.91)
0.003#
Passive smoking No Yes
12.9% 17.3%
1.00
1.34 (0.96; 1.86)
0.08*
Hospital admission for respiratory illness during childhood No Yes
14.4% 10.3%
1.00 0.72 (0.23; 2.23)
0.6*
Lifetime exposure to dust at the workplace Never 1-9 years ≥ 10 years
12.7% 13.9% 16.7%
1.00
1.09 (0.71; 1.68) 1.31 (0.93; 1.83)
0.12#
Exposure to coal stove for cooking or heating No Yes
13.2% 20.0%
1.00
1.51 (1.04; 2.20)
0.03*
Exposure to biomass stove for cooking or heating No Yes
14.7% 13.8%
1.00
0.94 (0.69; 1.30)
0.7*
* Wald test for heterogeneity # Wald test for trend
51
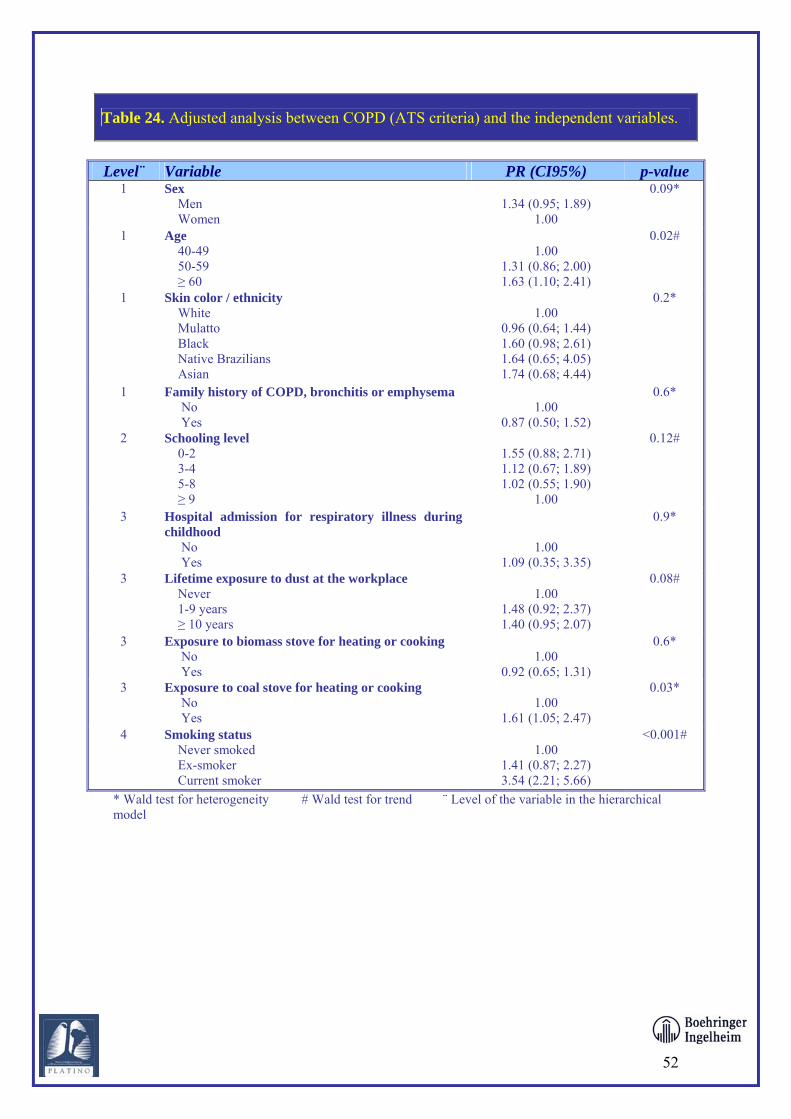
Table 24. Adjusted analysis between COPD (ATS criteria) and the independent variables.
Level¨ Variable PR (CI95%) p-value
1 Sex Men Women
1.34 (0.95; 1.89)
1.00
0.09*
1
Age 40-49 50-59 ≥ 60
1.00
1.31 (0.86; 2.00) 1.63 (1.10; 2.41)
0.02#
1 Skin color / ethnicity White Mulatto Black Native Brazilians Asian
1.00
0.96 (0.64; 1.44) 1.60 (0.98; 2.61) 1.64 (0.65; 4.05) 1.74 (0.68; 4.44)
0.2*
1 Family history of COPD, bronchitis or emphysema No Yes
1.00
0.87 (0.50; 1.52)
0.6*
2 Schooling level 0-2 3-4 5-8 ≥ 9
1.55 (0.88; 2.71) 1.12 (0.67; 1.89) 1.02 (0.55; 1.90)
1.00
0.12#
3 Hospital admission for respiratory illness during childhood No Yes
1.00 1.09 (0.35; 3.35)
0.9*
3 Lifetime exposure to dust at the workplace Never 1-9 years ≥ 10 years
1.00
1.48 (0.92; 2.37) 1.40 (0.95; 2.07)
0.08#
3 Exposure to biomass stove for heating or cooking No Yes
1.00
0.92 (0.65; 1.31)
0.6*
3 Exposure to coal stove for heating or cooking No Yes
1.00
1.61 (1.05; 2.47)
0.03*
4 Smoking status Never smoked Ex-smoker Current smoker
1.00
1.41 (0.87; 2.27) 3.54 (2.21; 5.66)
<0.001#
* Wald test for heterogeneity # Wald test for trend ¨ Level of the variable in the hierarchical model
52

Table 25. Adjusted analysis between COPD (ERS criteria) and the independent variables.
Level*** Variable PR (CI95%) p-value
1 Sex Men Women
1.03 (0.74; 1.44)
1.00
0.9*
1
Age 40-49 50-59 ≥ 60
1.00
1.54 (1.11; 2.14) 1.93 (1.37; 2.70)
<0.001#
1 Skin color / ethnicity White Mulatto Black Native Brazilians Asian
1.00
0.82 (0.56; 1.20) 1.33 (0.86; 2.04) 1.47 (0.68; 3.16) 1.21 (0.48; 3.05)
0.3*
1 Family history of COPD, bronchitis or emphysema No Yes
1.00
0.94 (0.57; 1.54)
0.8*
2 Schooling level 0-2 3-4 5-8 ≥ 9
1.28 (0.75; 2.16) 1.12 (0.69; 1.82) 1.10 (0.63; 1.93)
1.00
0.4#
3 Hospital admission for respiratory illness during childhood No Yes
1.00
0.86 (0.27; 2.73)
0.8*
3 Lifetime exposure to dust at the workplace Never 1-9 years ≥ 10 years
1.00
1.20 (0.78; 1.85) 1.32 (0.95; 1.82)
0.10#
3 Exposure to biomass stove for heating or cooking No Yes
1.00
0.85 (0.62; 1.17)
0.3*
3 Exposure to coal stove for heating or cooking No Yes
1.00
1.39 (0.94; 2.06)
0.10*
4 Smoking status Never smoked Ex-smoker Current smoker
1.00
1.06 (0.72; 1.57) 2.11 (1.45; 3.08)
0.001#
* Wald test for heterogeneity ** Wald test for trend *** Level of the variable in the hierarchical model
53


