The project “PVprog” (11410 UEP II/2) is funded by the Environmental Relief Program (UEP II) that is co-financed by the European Union through the European Regional Development Fund (ERDF) and the state of Berlin. Feed-in Power Limitation of Grid-Connected PV Battery Systems with Autonomous Forecast-Based Operation Strategies Joseph Bergner, Johannes Weniger, Tjarko Tjaden, Volker Quaschning HTW Berlin - University of Applied Sciences, Germany 29th European PV Solar Energy Conference and Exhibition 24th September 2014, Amsterdam, The Netherlands
Transcript
The project “PVprog” (11410 UEP II/2) is funded by the
Environmental Relief Program (UEP II) that is co-financed
by the European Union through the European Regional
Development Fund (ERDF) and the state of Berlin.
Feed-in Power Limitation of Grid-Connected PV Battery Systems
with Autonomous Forecast-Based Operation Strategies
Joseph Bergner, Johannes Weniger, Tjarko Tjaden, Volker Quaschning
HTW Berlin - University of Applied Sciences, Germany
29th European PV Solar Energy Conference and Exhibition
24th September 2014, Amsterdam, The Netherlands
2
100 %PV-Leistung
100 %PV-Leistung
133 %PV-Leistung
160 %PV-Leistung
200 %PV-Leistung
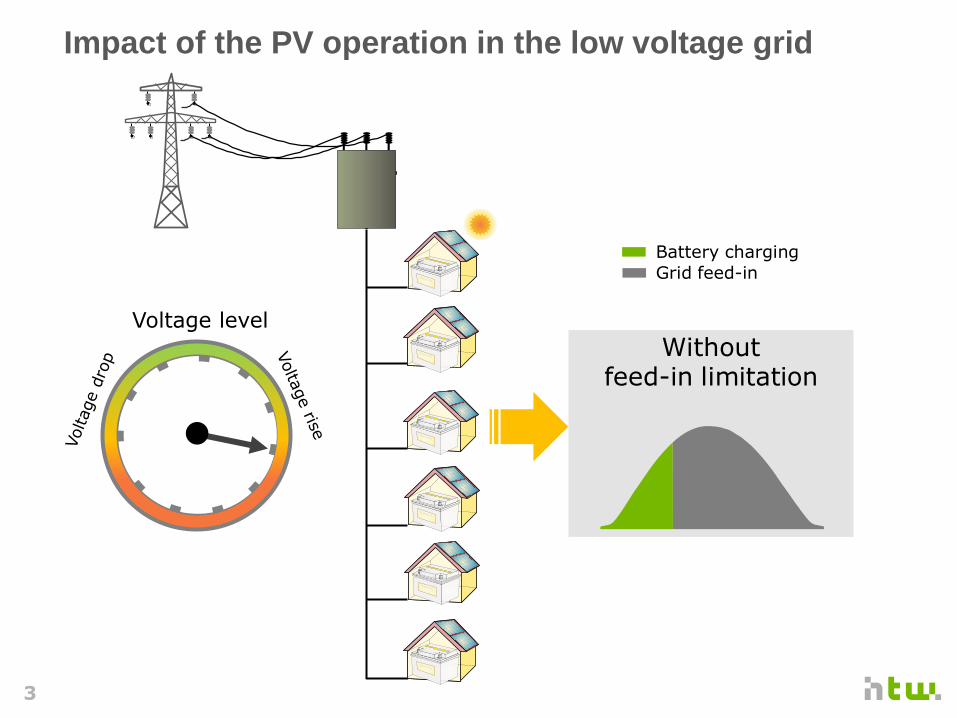
Impact of the PV operation in the low voltage grid
Voltage level
Self-consumption and feed-in
Withoutfeed-in limitation
Fixedfeed-in limitation
through curtailmentBattery charging
Grid feed-in
Curtailment
Feed-in limit
Max. self-consumption
Relieving the grid
Forecast-based
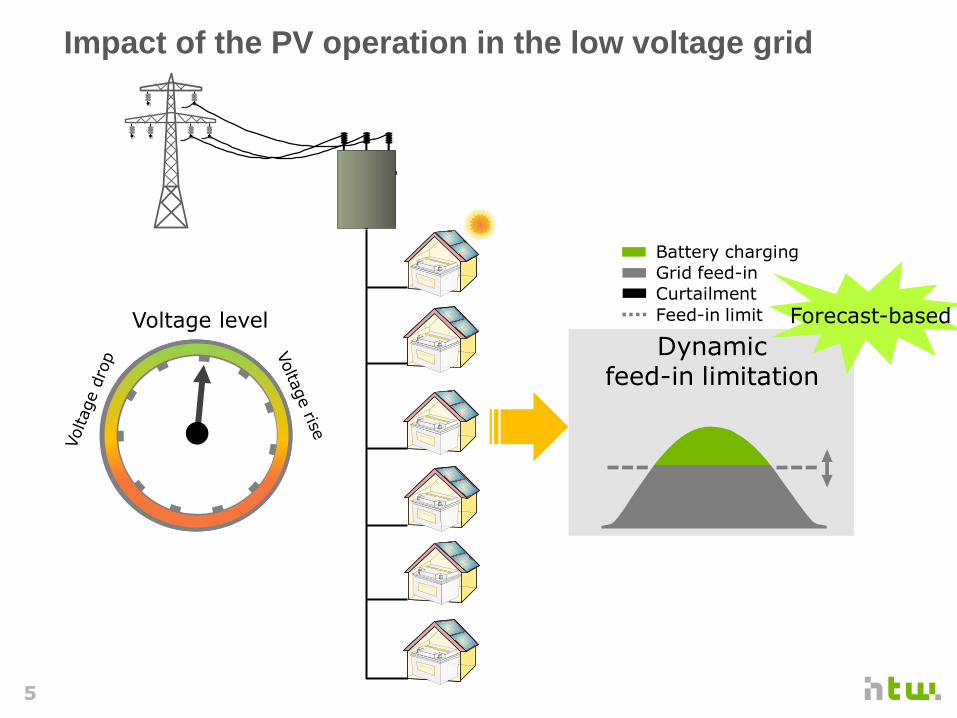
Dynamicfeed-in limitation
3
100 %PV-Leistung
100 %PV-Leistung
133 %PV-Leistung
160 %PV-Leistung
200 %PV-Leistung
Impact of the PV operation in the low voltage grid
Voltage level
Withoutfeed-in limitation
Fixedfeed-in limitation
through curtailmentBattery charging
Grid feed-in
Curtailment
Feed-in limit
Max. self-consumption
Relieving the grid
Forecast-based
Dynamicfeed-in limitation
Withoutfeed-in limitation
Fixedfeed-in limitation
through curtailmentBattery charging
Grid feed-in
Curtailment
Feed-in limit
Max. self-consumption
Relieving the grid
Forecast-based
Dynamicfeed-in limitation
4
Withoutfeed-in limitation
Fixedfeed-in limitation
through curtailmentBattery charging
Grid feed-in
Curtailment
Feed-in limit
Max. self-consumption
Relieving the grid
Forecast-based
Dynamicfeed-in limitation
Impact of the PV operation in the low voltage grid
Voltage level
Withoutfeed-in limitation
Fixedfeed-in limitation
through curtailmentBattery charging
Grid feed-in
Curtailment
Feed-in limit
Max. self-consumption
Relieving the grid
Forecast-based
Dynamicfeed-in limitation
100 %PV-Leistung
100 %PV-Leistung
133 %PV-Leistung
160 %PV-Leistung
200 %PV-Leistung
5
Withoutfeed-in limitation
Fixedfeed-in limitation
through curtailmentBattery charging
Grid feed-in
Curtailment
Feed-in limit
Max. self-consumption
Relieving the grid
Forecast-based
Dynamicfeed-in limitation
Impact of the PV operation in the low voltage grid
Voltage level
100 %PV-Leistung
100 %PV-Leistung
133 %PV-Leistung
160 %PV-Leistung
200 %PV-Leistung
Withoutfeed-in limitation
Fixedfeed-in limitation
through curtailmentBattery charging
Grid feed-in
Curtailment
Feed-in limit
Max. self-consumption
Relieving the grid
Forecast-based
Dynamicfeed-in limitation
Forecast-based
6
Implementation of forecast-based operation strategies
Optimization
Real time correction
Optimal
charge power
Forecast values
Current state of charge
System
Measured values
Corrected
charge power
7
0.0
0.1
0.2
0.3
0.4
0.5
0.6
0.7
0.8
0 6 12 18 0 6 12 18
PV-p
ow
er
in k
W/k
Wp
Time in h
0.0
0.1
0.2
0.3
0.4
0.5
0.6
0.7
0.8
0 6 12 18 0 6 12 18
PV-p
ow
er
in k
W/k
Wp
Time in h
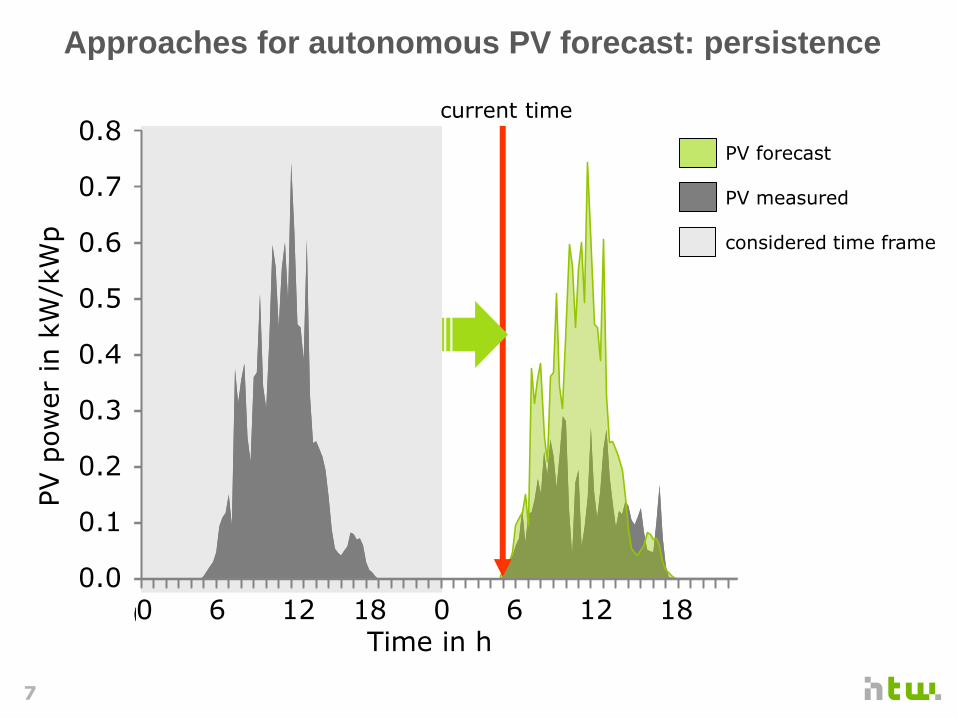
Approaches for autonomous PV forecast: persistence
current time
PV forecast
PV measured
considered time frame
PV p
ow
er
in k
W/k
Wp
0.8
0.7
0.6
0.5
0.4
0.3
0.2
0.1
0.0 0 6 12 18 0 6 12 18
Time in h
8
Approaches for autonomous PV forecast: adaptive
0.0
0.1
0.2
0.3
0.4
0.5
0.6
0.7
0.8
0 6 12 18 0 6 12 18
PV-p
ow
er
in k
W/k
Wp
Time in h
0.0
0.1
0.2
0.3
0.4
0.5
0.6
0.7
0.8
0 6 12 18 0 6 12 18
PV-p
ow
er
in k
W/k
Wp
Time in h
0.0
0.1
0.2
0.3
0.4
0.5
0.6
0.7
0.8
0 6 12 18 0 6 12 18
PV-p
ow
er
in k
W/k
Wp
Time in h
0.0
0.1
0.2
0.3
0.4
0.5
0.6
0.7
0.8
0 6 12 18 0 6 12 18
PV-p
ow
er
in k
W/k
Wp
Time in h
0.0
0.1
0.2
0.3
0.4
0.5
0.6
0.7
0.8
0 6 12 18 0 6 12 18
PV-p
ow
er
in k
W/k
Wp
Time in h
0.0
0.1
0.2
0.3
0.4
0.5
0.6
0.7
0.8
0 6 12 18 0 6 12 18
PV-p
ow
er
in k
W/k
Wp
Time in h
0.0
0.1
0.2
0.3
0.4
0.5
0.6
0.7
0.8
0 6 12 18 0 6 12 18
PV-p
ow
er
in k
W/k
Wp
Time in h
0.0
0.1
0.2
0.3
0.4
0.5
0.6
0.7
0.8
0 6 12 18 0 6 12 18
PV-p
ow
er
in k
W/k
Wp
Time in h
0.0
0.1
0.2
0.3
0.4
0.5
0.6
0.7
0.8
0 6 12 18 0 6 12 18
PV-p
ow
er
in k
W/k
Wp
Time in h
0.0
0.1
0.2
0.3
0.4
0.5
0.6
0.7
0.8
0 6 12 18 0 6 12 18
PV-p
ow
er
in k
W/k
Wp
Time in h
current time
PV p
ow
er
in k
W/k
Wp
0.8
0.7
0.6
0.5
0.4
0.3
0.2
0.1
0.0 0 6 12 18 0 6 12 18
Time in h
considered time frame
PV forecast
PV measured
considered time frame
9
0.0
0.1
0.2
0.3
0.4
0.5
0.6
0.7
0.8
0 6 12 18 0 6 12 18
PV-p
ow
er
in k
W/k
Wp
Time in h
Approaches for autonomous PV forecast: adaptive
0.0
0.1
0.2
0.3
0.4
0.5
0.6
0.7
0.8
0 6 12 18 0 6 12 18
PV-p
ow
er
in k
W/k
Wp
Time in h
0.0
0.1
0.2
0.3
0.4
0.5
0.6
0.7
0.8
0 6 12 18 0 6 12 18
PV-p
ow
er
in k
W/k
Wp
Time in h
0.0
0.1
0.2
0.3
0.4
0.5
0.6
0.7
0.8
0 6 12 18 0 6 12 18
PV-p
ow
er
in k
W/k
Wp
Time in h
0.0
0.1
0.2
0.3
0.4
0.5
0.6
0.7
0.8
0 6 12 18 0 6 12 18
PV-p
ow
er
in k
W/k
Wp
Time in h
0.0
0.1
0.2
0.3
0.4
0.5
0.6
0.7
0.8
0 6 12 18 0 6 12 18
PV-p
ow
er
in k
W/k
Wp
Time in h
0.0
0.1
0.2
0.3
0.4
0.5
0.6
0.7
0.8
0 6 12 18 0 6 12 18
PV-p
ow
er
in k
W/k
Wp
Time in h
0.0
0.1
0.2
0.3
0.4
0.5
0.6
0.7
0.8
0 6 12 18 0 6 12 18
PV-p
ow
er
in k
W/k
Wp
Time in h
0.0
0.1
0.2
0.3
0.4
0.5
0.6
0.7
0.8
0 6 12 18 0 6 12 18
PV-p
ow
er
in k
W/k
Wp
Time in h
current time
0.0
0.1
0.2
0.3
0.4
0.5
0.6
0.7
0.8
0 6 12 18 0 6 12 18
PV-p
ow
er
in k
W/k
Wp
Time in h
current time
PV p
ow
er
in k
W/k
Wp
0.8
0.7
0.6
0.5
0.4
0.3
0.2
0.1
0.0 0 6 12 18 0 6 12 18
Time in h
PV forecast
PV measured
considered time frame
10
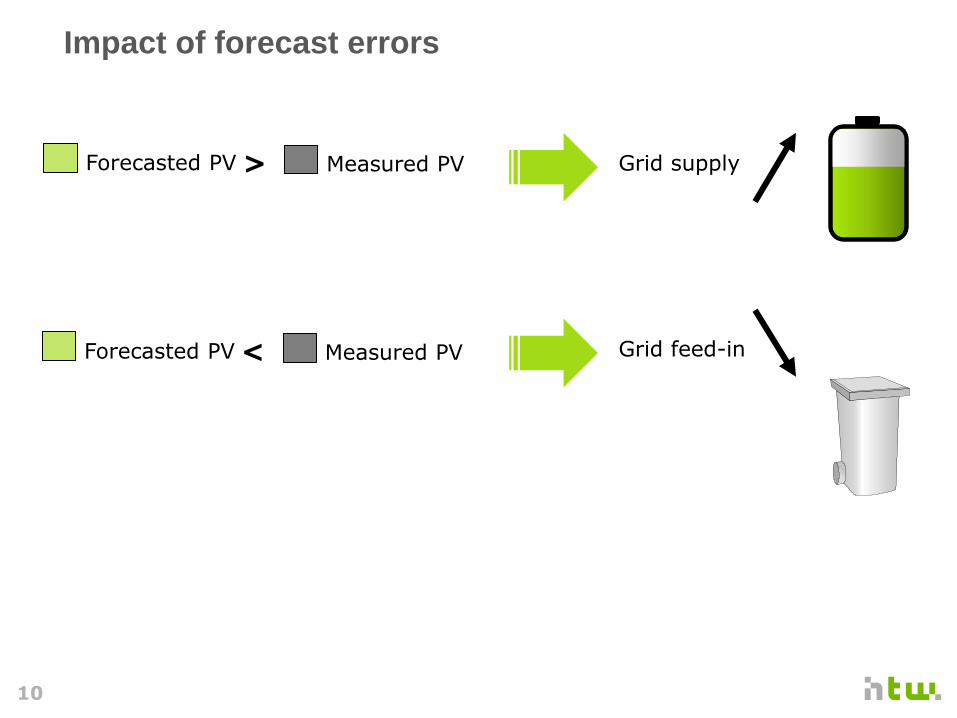
Impact of forecast errors
Forecasted PV Measured PV > Grid supply
Grid feed-in Forecasted PV Measured PV <
11
2200
2250
2300
2350
2400
2450
2500
2550
2600
1500 1600 1700 1800 1900
grid s
upply
in k
Wh/a
grid feed-in in kWh/a
2200
2250
2300
2350
2400
2450
2500
2550
2600
1500 1600 1700 1800 1900
grid s
upply
in k
Wh/a
grid feed-in in kWh/a
2200
2250
2300
2350
2400
2450
2500
2550
2600
1500 1600 1700 1800 1900
grid s
upply
in k
Wh/a
grid feed-in in kWh/a
2200
2250
2300
2350
2400
2450
2500
2550
2600
1500 1600 1700 1800 1900
grid s
upply
in k
Wh/a
grid feed-in in kWh/a
Energetic performance with different PV forecasts
Single family household: Load demand 5.3 MWh/a, PV system 5.3 kWp, Max. feed-in power 0.5 kW/kWp, battery capacity 5.3 kWh, persistence load forecast
280 kWh
Withoutfeed-in limitation
Fixedfeed-in limitation
through curtailmentBattery charging
Grid feed-in
Curtailment
Feed-in limit
Max. self-consumption
Relieving the grid
Forecast-based
Dynamicfeed-in limitation
Withoutfeed-in limitation
Fixedfeed-in limitation
through curtailmentBattery charging
Grid feed-in
Curtailment
Feed-in limit
Max. self-consumption
Relieving the grid
Forecast-based
Dynamicfeed-in limitation
fixed feed-in limitation through curtailment
perfect PV forecast
persistence PV forecast
adaptive PV forecast
dynamic feed-in limitation with:
60 kWh
12
0 5 10 15 20
profit through dynamic feed-in limitation in €/a
perfect PV forecast
persistence PV forecast
adaptive PV forecast
Economic performance with different PV forecasts
Single family household: Load demand 5.3 MWh/a, PV system 5.3 kWp, maximum feed-in 0.5 kW/kWp, battery capacity 5.3 kWh, feed-in tariff 10 ct/kWh, retail el. price 30 ct/kWh persistence load forecast
Withoutfeed-in limitation
Fixedfeed-in limitation
through curtailmentBattery charging
Grid feed-in
Curtailment
Feed-in limit
Max. self-consumption
Relieving the grid
Forecast-based
Dynamicfeed-in limitation
Withoutfeed-in limitation
Fixedfeed-in limitation
through curtailmentBattery charging
Grid feed-in
Curtailment
Feed-in limit
Max. self-consumption
Relieving the grid
Forecast-based
Dynamicfeed-in limitation
0 5 10 15 20
profit through dynamic feed-in limitation in €/a
perfect PV forecast
persistence PV forecast
adaptive PV forecast 5 €/a
13
Conclusions
pvspeicher.htw-berlin.de
• A lower mandatory feed-in limit is decisive for improved grid
integration of PV battery systems.
• The benefit for the system’s owner could be obtained by additional
feed-in which needs to be remunerated.
• For economic and technical reasons PV battery systems should
be operated with dynamic feed-in limitation.
• Simple forecast approaches are sufficient to realize a peak
shaving operation of PV battery systems as basis for further PV


![KNOL Remko [Mode de compatibilit ] · Rooftop and Building Integrated PV PV-facades and canopies 1996: ... BUT; feed-in tariff is guaranteed by law for 15-20 years and limited O&M](https://static.documents.pub/doc/80x56/5ec6689d03fbe15f90107d69/knol-remko-mode-de-compatibilit-rooftop-and-building-integrated-pv-pv-facades.jpg)


