32
Feedback on road budgets RPF November 2001
| Date post: | 31-Dec-2015 |
| Category: |
Documents |
| Upload: | stewart-velazquez |
| View: | 32 times |
| Download: | 10 times |

Feedback on road budgets
RPF November 2001
ContentsBackgroundProcess Information requested Information obtained IssuesCurrent dataRoad forward

BackgroundResolution at RPF May 2001
Data on budgets be adopted as basis and be expanded for future reports
Funded by Gautrans, Sabita and C&CIFocused on provincial and national data
in this presentation
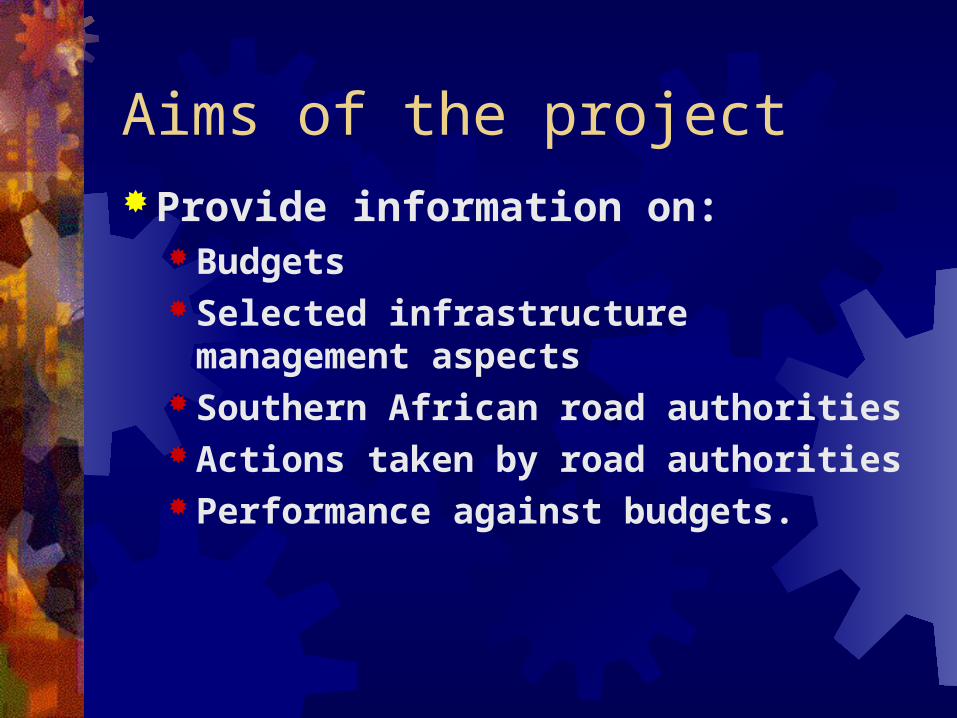
Aims of the projectProvide information on:
Budgets Selected infrastructure management
aspects Southern African road authorities Actions taken by road authorities Performance against budgets.

Process followedContacted road authorities – chief
engineers etcSlow response – regular
communicationsOther sources identifiedAttempted to paint full pictureVerified with different sources

Responses Positive responses re participation from
9 provinces NRA 5/6 metros 2/5 toll concessionaires
Data for 8 provinces / NPRA NRA 2 metros 1 toll concessionaire SADC – appears positive – needs overall approval

Information required Total budgets for department Total road authority budgets Breakdown of road budgets Budgets for specific items (i.e. bitumen and
cement) Grants and transfers and non-treasury expenditure Audited figures previous years Changes to budgets Quarterly performance against budget Construction and rehabilitation programmes

Information obtained Sources
Contacts in authorities Budget speeches Web-published data Auditor-General reports Treasury reports
Problems encountered Response time Manpower
Validity of data – only Auditor-General figures are final

Issues Manpower – skills match problem PFMA (Public Finance Management Act) – public information
More effective and efficient delivery, better value for money, improved public services
Develop capacity 2001/2002 Internal control and audit units
Departmental structures Availability of information
Budget and management systems Progress against budget
Discrepancies in road network lengths and budget figures from different sources
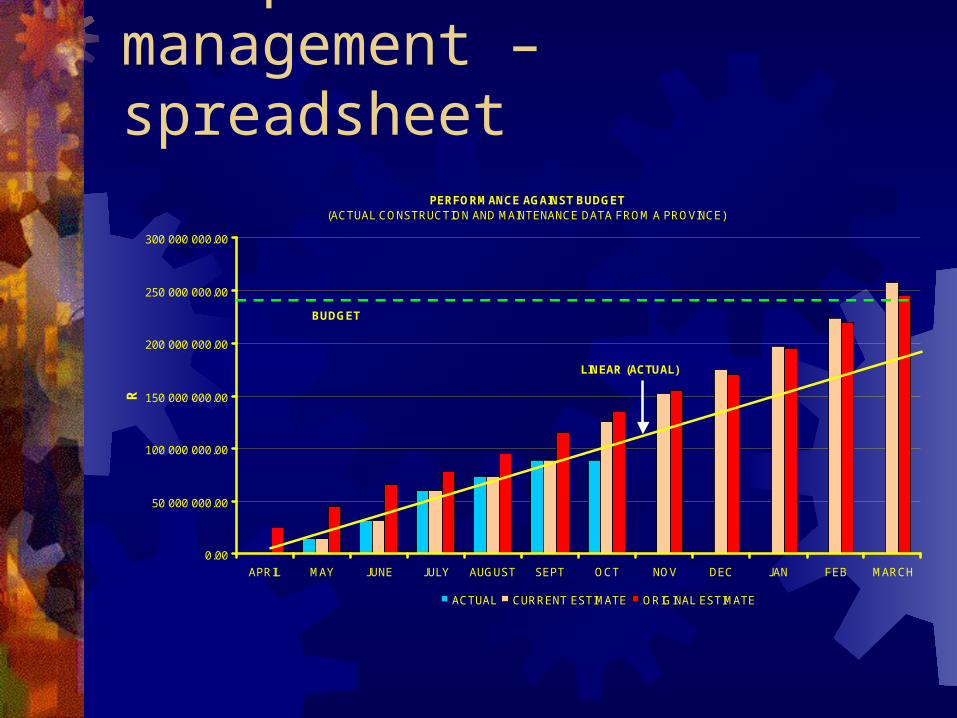
Example of contracts management – spreadsheet
PERFORMANCE AGAINST BUDGET(ACTUAL CONSTRUCTION AND MAINTENANCE DATA FROM A PROVINCE)
0.00
50 000 000.00
100 000 000.00
150 000 000.00
200 000 000.00
250 000 000.00
300 000 000.00
APRIL MAY JUNE JULY AUGUST SEPT OCT NOV DEC JAN FEB MARCH
R
ACTUAL CURRENT ESTIMATE ORIGINAL ESTIMATE
BUDGET
LINEAR (ACTUAL)

Backlog cost estimates
0
200000
400000
600000
800000
1000000
1200000
1400000
1600000
1800000
Rehabilitation Reseal / fogspray
Paved roadsType of backlog
Co
st p
er k
m
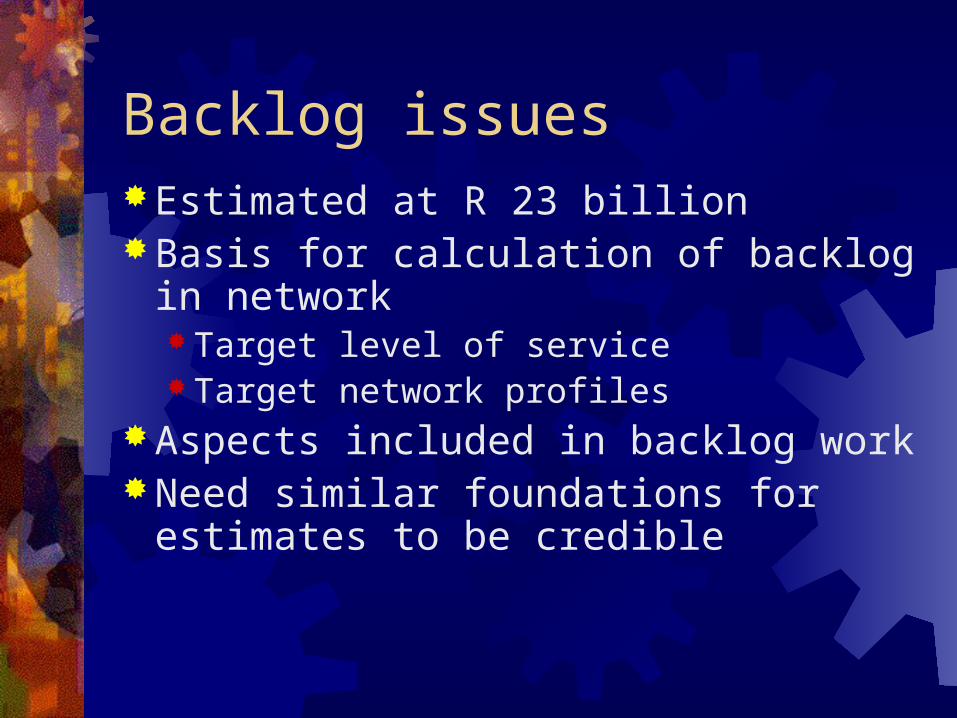
Backlog issuesEstimated at R 23 billionBasis for calculation of backlog in
network Target level of service Target network profiles
Aspects included in backlog workNeed similar foundations for estimates
to be credible

Current informationBudgetsProgress against budgetsLonger term budget trendsAuditsGrantsPlanned expenditureRoad networks

“Transport” Department Budgets
Transport Budget allocations 2001/2002
R 0
R 200 000 000
R 400 000 000
R 600 000 000
R 800 000 000
R 1 000 000 000
R 1 200 000 000
Easte
rn C
ape
Free
State
Gaute
ng
KwaZulu
-Nat
al
Mpu
mal
anga
North
ern
Cape
North
ern
Provin
ce
North
Wes
t
Wes
tern
Cap
e
SANRAL
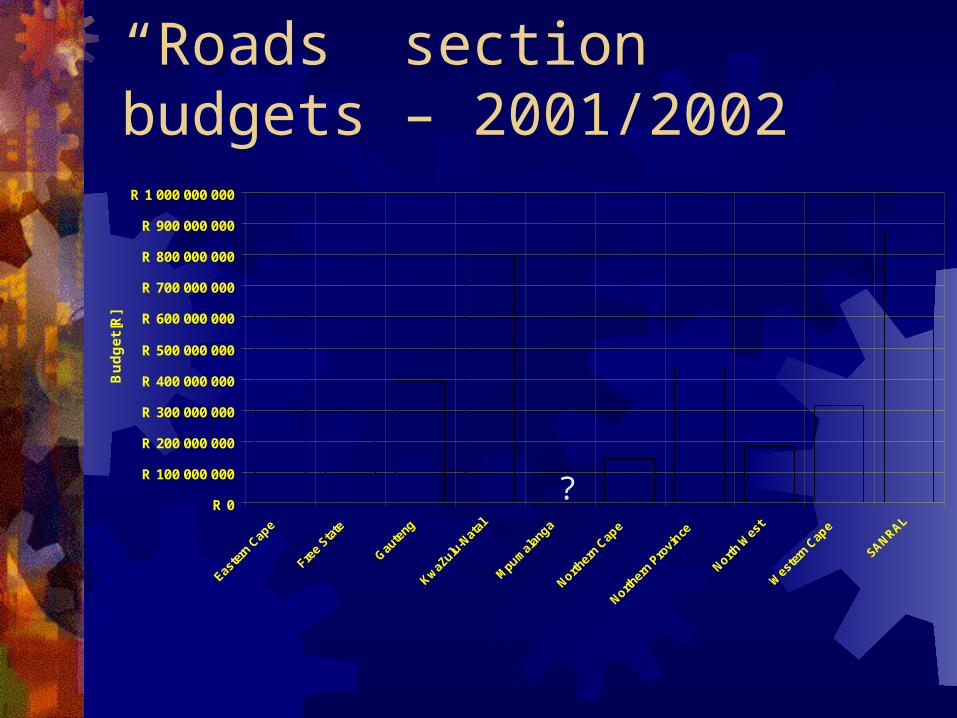
“Roads” section budgets – 2001/2002
R 0
R 100 000 000
R 200 000 000
R 300 000 000
R 400 000 000
R 500 000 000
R 600 000 000
R 700 000 000
R 800 000 000
R 900 000 000
R 1 000 000 000
Easte
rn C
ape
Free
State
Gaute
ng
KwaZulu
-Nat
al
Mpu
mal
anga
Norther
n Cap
e
Norther
n Pro
vince
North W
est
Wes
tern
Cap
e
SANRAL
Bu
dg
et
[R]
?
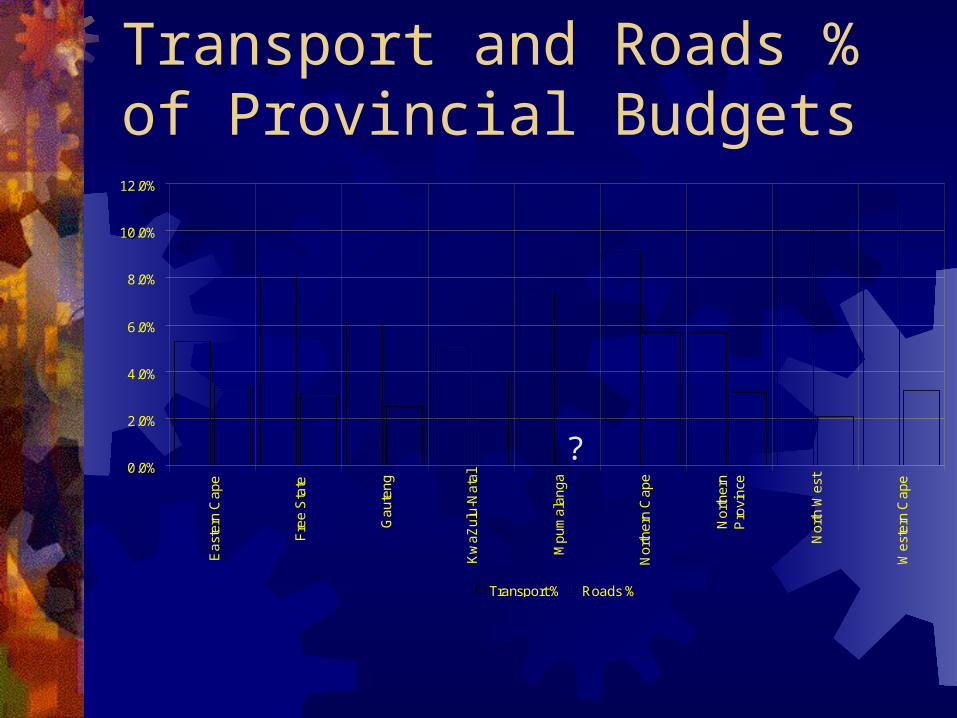
Transport and Roads % of Provincial Budgets
0.0%
2.0%
4.0%
6.0%
8.0%
10.0%
12.0%
Ea
ste
rn C
ap
e
Fre
e S
tate
Ga
ute
ng
Kw
aZ
ulu
-Na
tal
Mp
um
ala
ng
a
No
rth
ern
Ca
pe
No
rth
ern
Pro
vin
ce
No
rth
We
st
We
ste
rn C
ap
e
Transport % Roads %
?

Progress against budgets - departmental
0.0%
10.0%
20.0%
30.0%
40.0%
50.0%
60.0%
70.0%
Ea
ste
rn C
ap
e
Fre
e S
tate
Ga
ute
ng
Kw
aZ
ulu
-Na
tal
Mp
um
ala
ng
a
No
rth
ern
Ca
pe
No
rth
ern
Pro
vin
ce
No
rth
We
st
We
ste
rn C
ap
e
Province
Pe
rce
nta
ge
pro
gre
ss
ag
ain
st
tota
l bu
dg
et
[%]
First quarter (June 2001) Second quarter (September 2001)

Progress against budgets (capital) - departmental
0.0%
10.0%
20.0%
30.0%
40.0%
50.0%
60.0%
70.0%
80.0%
90.0%
Ea
ste
rn C
ap
e
Fre
e S
tate
Ga
ute
ng
Kw
aZ
ulu
-Na
tal
Mp
um
ala
ng
a
No
rth
ern
Ca
pe
No
rth
ern
Pro
vin
ce
No
rth
We
st
We
ste
rn C
ap
e
Province
Ca
pit
al p
rog
res
s a
ga
ins
t b
ud
ge
t [%
]
Capital budget First quarter (June 2001) Capital budget Second quarter (September 2001)
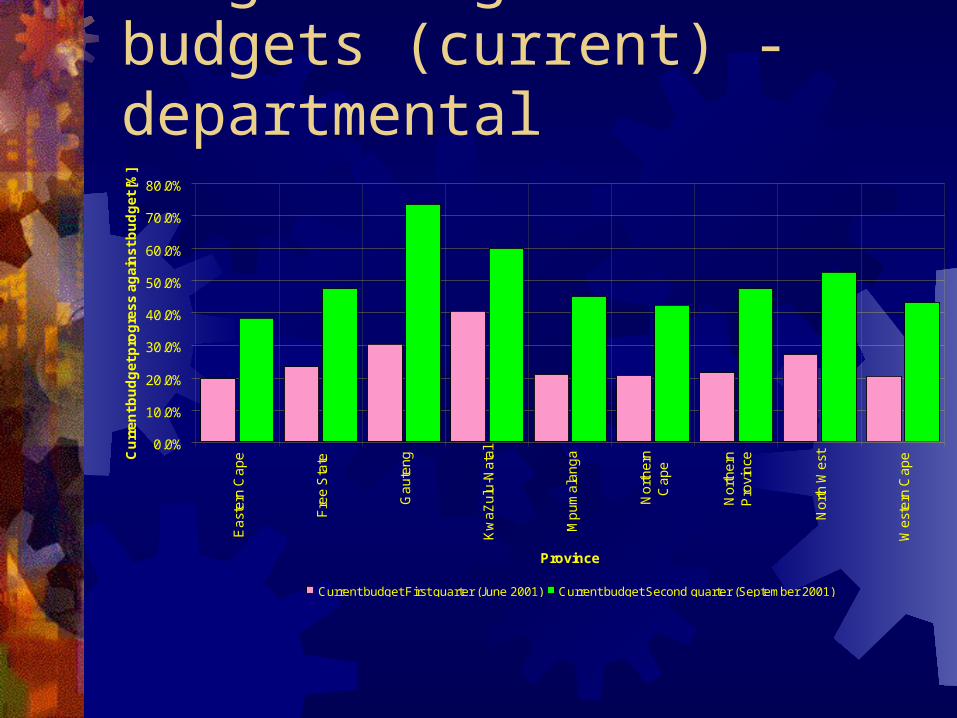
Progress against budgets (current) - departmental
0.0%
10.0%
20.0%
30.0%
40.0%
50.0%
60.0%
70.0%
80.0%
Ea
ste
rn C
ap
e
Fre
e S
tate
Ga
ute
ng
Kw
aZ
ulu
-Na
tal
Mp
um
ala
ng
a
No
rth
ern
Ca
pe
No
rth
ern
Pro
vin
ce
No
rth
We
st
We
ste
rn C
ap
e
Province
Cu
rre
nt
bu
dg
et
pro
gre
ss
ag
ain
st
bu
dg
et
[%]
Current budget First quarter (June 2001) Current budget Second quarter (September 2001)

Progress against budgetsData for the whole departmentCapital progress not necessarily shown
when funds are allocated and not yet spent
Need to ensure that similar figures are reported
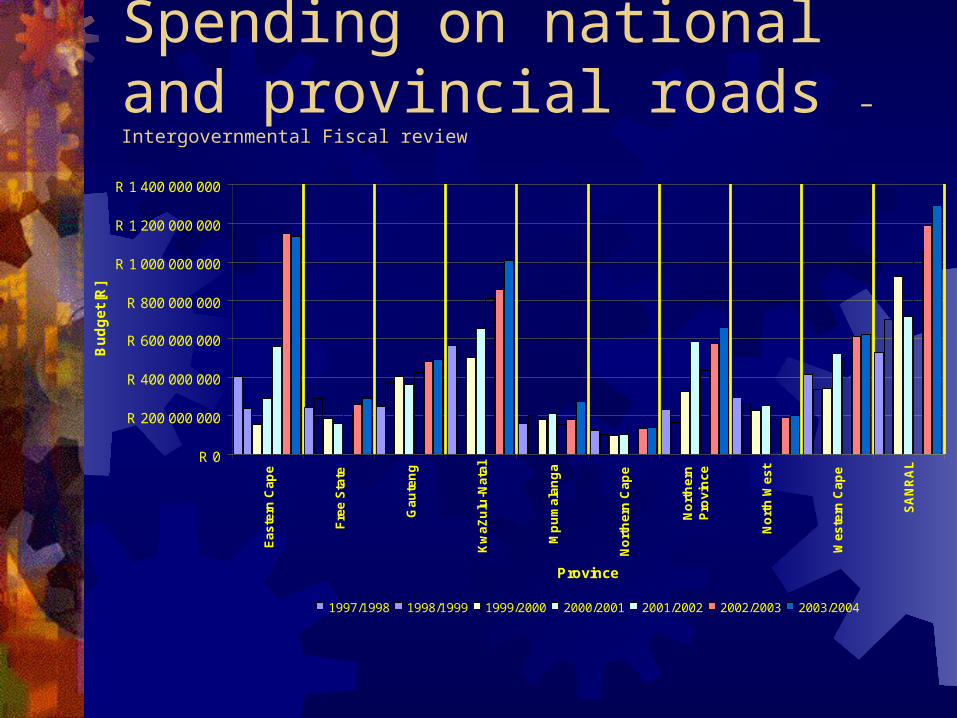
Spending on national and provincial roads – Intergovernmental Fiscal review
R 0
R 200 000 000
R 400 000 000
R 600 000 000
R 800 000 000
R 1 000 000 000
R 1 200 000 000
R 1 400 000 000
Ea
ste
rn C
ap
e
Fre
e S
tate
Ga
ute
ng
Kw
aZ
ulu
-Na
tal
Mp
um
ala
ng
a
No
rth
ern
Ca
pe
No
rth
ern
Pro
vin
ce
No
rth
We
st
We
ste
rn C
ap
e
SA
NR
AL
Province
Bu
dg
et
[R]
1997/1998 1998/1999 1999/2000 2000/2001 2001/2002 2002/2003 2003/2004

Auditor-General informationAverage Distribution of items in Audit reports
0.00%
5.00%
10.00%
15.00%
20.00%
25.00%
30.00%
35.00%
40.00%
45.00%P
ers
on
ne
l
Ad
min
istr
atio
n
Sto
res
an
dliv
est
ock
Eq
uip
me
nt
La
nd
an
db
uid
ling
s
Pro
fess
ion
al
serv
ice
s
Tra
nsf
er
pa
yme
nts
Mis
cella
ne
ou
s
Item
Pe
rce
nta
ge
allo
ca
tio
n [
%]

Grants Supplementary Allocation grant
Ensure credible provincial budgets and adequate provision for infrastructure and social sectors
Ensure progress in implementing budget and financial management reforms
Provincial Infrastructure grant Fund provincial infrastructure (roads, schools,
health buildings) Fund reconstruction of 2000 flood damage

Grants – 2001/2002
R 0
R 100 000 000
R 200 000 000
R 300 000 000
R 400 000 000
R 500 000 000
R 600 000 000
R 700 000 000
Ea
ste
rn C
ap
e
Fre
e S
tate
Ga
ute
ng
Kw
aZ
ulu
-Na
tal
Mp
um
ala
ng
a
No
rth
ern
Ca
pe
No
rth
ern
Pro
vin
ce
No
rth
We
st
We
ste
rn C
ap
e
Gra
nt
tota
l [R
]
Provincial infrastructure rehabilitation Supplementary Total

Grants progress – 2001/2002
0.0%
5.0%
10.0%
15.0%
20.0%
25.0%
30.0%
35.0%
40.0%
45.0%
50.0%
Ea
ste
rn C
ap
e
Fre
e S
tate
Ga
ute
ng
Kw
aZ
ulu
-N
ata
l
Mp
um
ala
ng
a
No
rth
ern
Ca
pe
No
rth
ern
Pro
vin
ce
No
rth
We
st
We
ste
rn C
ap
e
Gra
nt
tota
l [R
]
2nd Quarter Transferred 2nd Quarter Spent
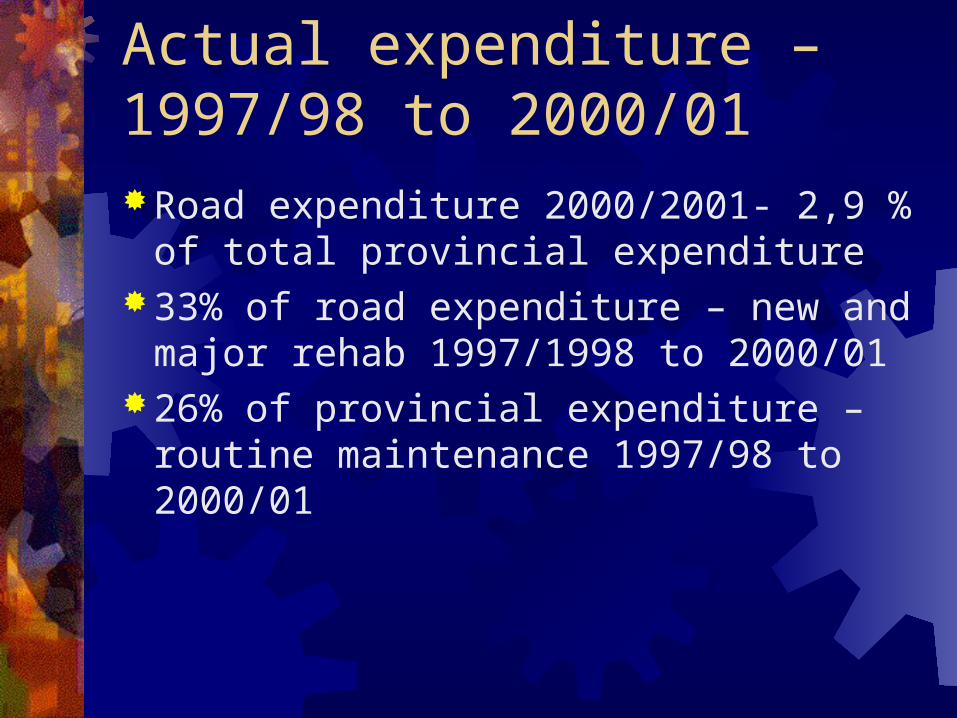
Actual expenditure – 1997/98 to 2000/01Road expenditure 2000/2001- 2,9 % of
total provincial expenditure33% of road expenditure – new and
major rehab 1997/1998 to 2000/0126% of provincial expenditure – routine
maintenance 1997/98 to 2000/01

Provincial capital expenditure on roads
R 0
R 500 000 000
R 1 000 000 000
R 1 500 000 000
R 2 000 000 000
R 2 500 000 000
R 3 000 000 000
1997/98 1998/99 1999/00 2000/01 2001/02 2002/03 2003/04

Planned expenditure – 2001/2002EC – Road maintenance R 69 millionWC – Major improvement projects
(2000-2005) R 244 millionGautrans – maintenance / rehabilitation
263 km in 2001/2002 (R 226 million)Northern Province – Maintenance and
construction (roads and bridges) R 266 million

Proposed projects 2001/2002
0
100
200
300
400
500
600
700
800
Ea
ste
rn C
ap
e
Fre
e S
tate
Ga
ute
ng
Kw
aZ
ulu
-N
ata
l
Mp
um
ala
ng
a
No
rth
ern
Ca
pe
No
rth
ern
Pro
vin
ce
No
rth
We
st
We
ste
rn C
ap
e
Na
tio
na
l
Dis
tan
ce
[k
m]
Paved roads Gravel roads Total
ConclusionsNeed for availability of valid information
– roads focusNeed similar reporting / calculation
mechanisms (backlog, progress etc) Information is “dynamic” until the
Auditor General captures itNeed a team approach

Road forward PFMA effect on availability of budget and
progress information Service delivery measures
2002/03 – measurable objectives, service delivery standards, targets – included in budget submissions – describe how public funds are used
Need for good management systems Backlog calculations Standard format for data at regular intervals


