1. Report No. FHWA-NMDOT- 2. Government Accession No. 3. Recipient's Catalog No. 4. Title and Subtitle Achieving Safety Benefits Sooner Rather Than Later A Before and After Study of US 550/NM 44 5. Report Date September 2006 6. Performing Organization Code NM04MSC-01 7. Author J. W. Hall 8. Performing Organization Report No. 9. Performing Organization Name and Address Department of Civil Engineering MSC01 1070, University of New Mexico Albuquerque, NM 87131-0001 10. Work Unit No. (TRAIS) 11. Contract No. C0 4654 12. Sponsoring Agency Name and Address Research Bureau NM Department of Transportation PO Box 94690 Albuquerque, NM 87199-4960 13. Report Type and Period Covered Final Report April-June 2005 14. Sponsoring Agency Code 15. Supplementary Notes 16. Abstract The traditional approach for reconstructing rural highways in the United States has been to subdivide roads into 5-10 mile segments, and to successively redesign and reconstruct these segments. As a result, a 50-mile highway might require 5 to 10 years to completely rebuild, thus leading the public to conclude that roads are always under construction, with the completion of one project coinciding with the start of the next. More critically, the expected project benefits, including reduced road-user costs, enhanced safety, and economic development are delayed. In a significant departure from this practice, the New Mexico Department of Transportation utilized innovative financing, design, and construction practices to reconstruct a 118-mile section of a two-lane highway to a four-lane highway over a period of three years. The department estimates that it would have taken over 20 years to reconstruct this road using their standard procedures. The prolonged project would have cost more and benefits would have been postponed. This research examines the actual safety benefits resulting from the reconstruction of this extended roadway segment, finding some unexpected results. It also evaluates the safety consequences of the expedited construction process, which minimized the duration of traffic disruption and potential for work zone crashes, while providing the public with a safer road in three, rather than 20, years. 17. Key Words Four-lane Divided, Highway Safety, US 550/NM 44 18. Distribution Statement Available from the NMDOT Research Bu- reau 19. Security Classif. (of this report) None 20. Security Classif. (of this page) None 21. No. of Pages 22. Price Form DOT F 1700.7
Transcript
1. Report No.
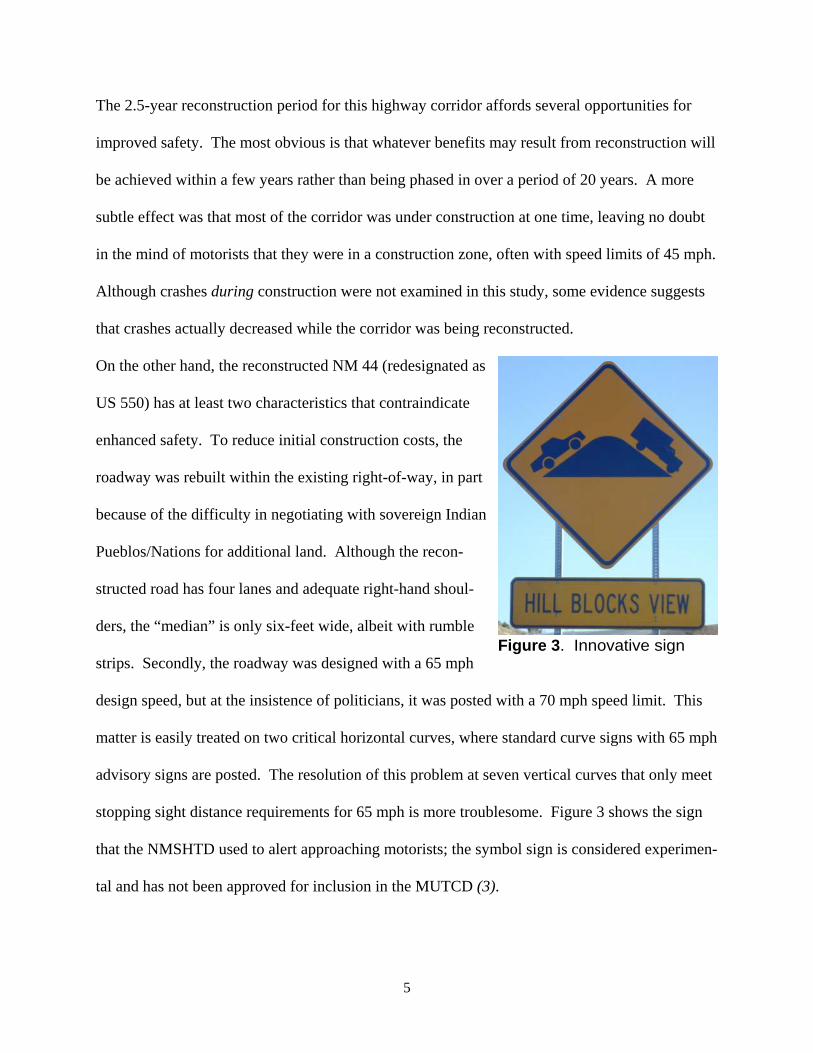
FHWA-NMDOT-2. Government Accession No. 3. Recipient's Catalog No.
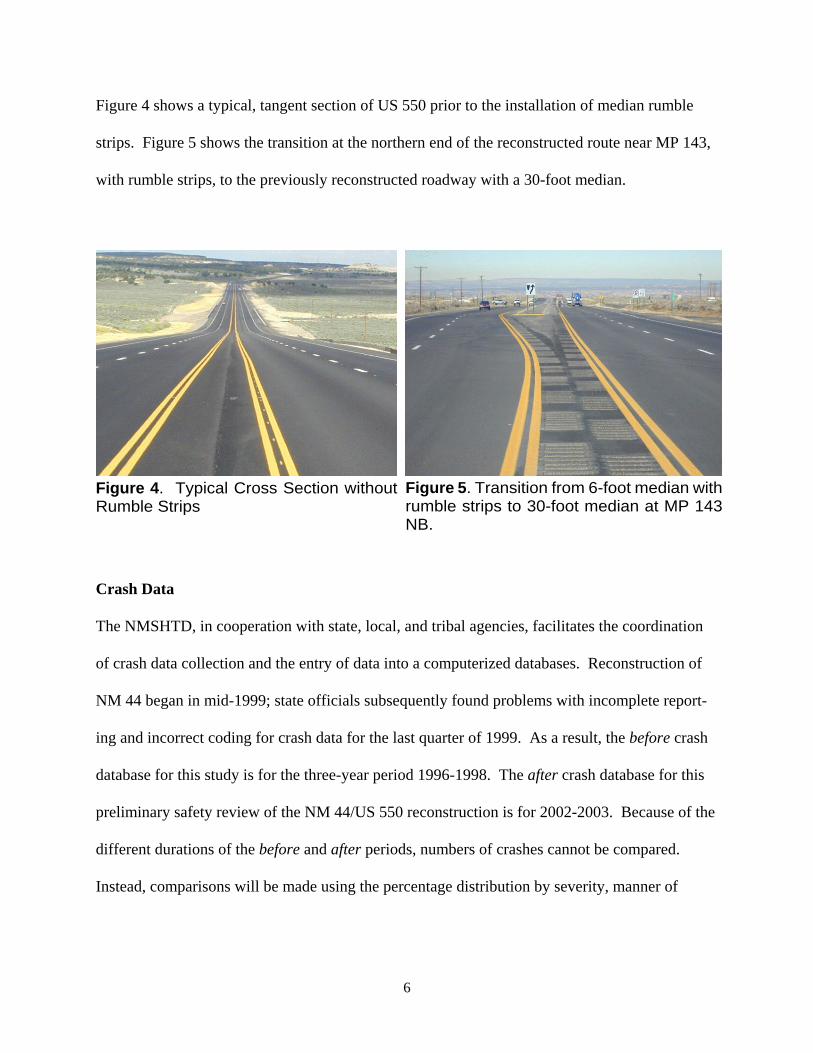
4. Title and Subtitle
Achieving Safety Benefits Sooner Rather Than LaterA Before and After Study of US 550/NM 44
5. Report Date
September 20066. Performing Organization Code
NM04MSC-017. Author
J. W. Hall8. Performing Organization Report No.
9. Performing Organization Name and Address
Department of Civil EngineeringMSC01 1070, University of New MexicoAlbuquerque, NM 87131-0001
10. Work Unit No. (TRAIS)
11. Contract No.
C0 465412. Sponsoring Agency Name and Address
Research BureauNM Department of TransportationPO Box 94690Albuquerque, NM 87199-4960
13. Report Type and Period Covered
Final ReportApril-June 2005
14. Sponsoring Agency Code
15. Supplementary Notes
16. Abstract
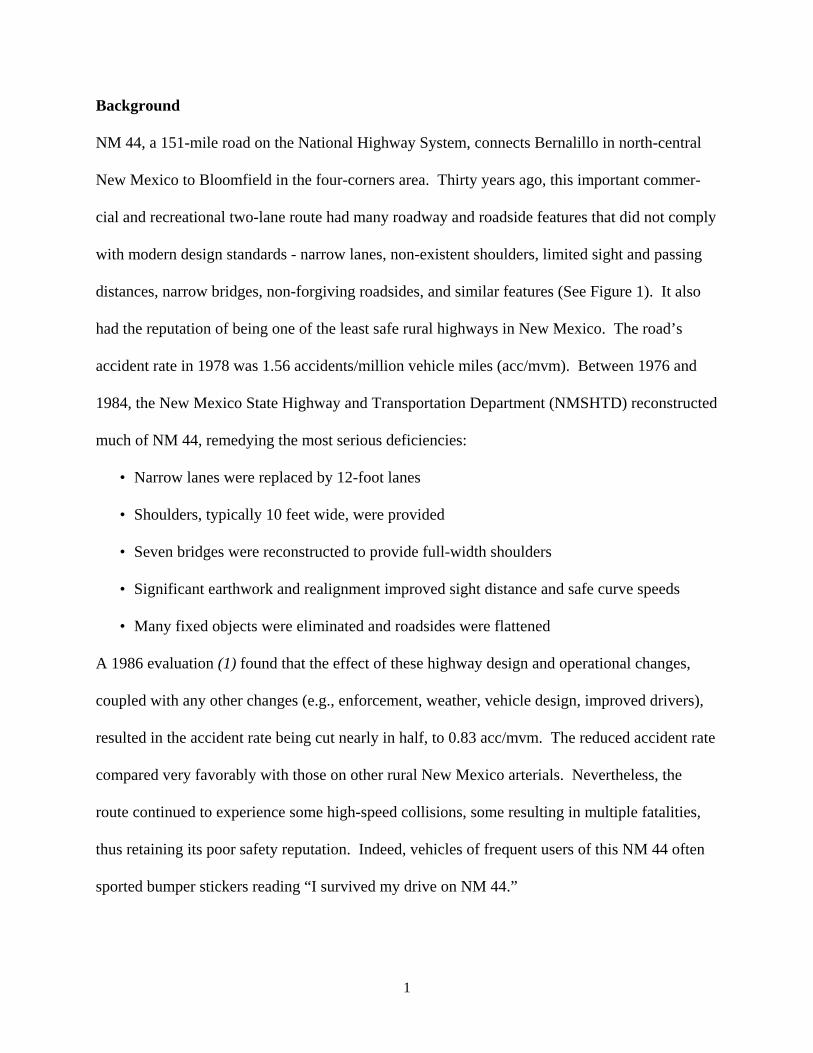
The traditional approach for reconstructing rural highways in the United States has been tosubdivide roads into 5-10 mile segments, and to successively redesign and reconstruct thesesegments. As a result, a 50-mile highway might require 5 to 10 years to completely rebuild, thusleading the public to conclude that roads are always under construction, with the completion ofone project coinciding with the start of the next. More critically, the expected project benefits,including reduced road-user costs, enhanced safety, and economic development are delayed.
In a significant departure from this practice, the New Mexico Department of Transportationutilized innovative financing, design, and construction practices to reconstruct a 118-milesection of a two-lane highway to a four-lane highway over a period of three years. Thedepartment estimates that it would have taken over 20 years to reconstruct this road using theirstandard procedures. The prolonged project would have cost more and benefits would havebeen postponed.
This research examines the actual safety benefits resulting from the reconstruction of thisextended roadway segment, finding some unexpected results. It also evaluates the safetyconsequences of the expedited construction process, which minimized the duration of trafficdisruption and potential for work zone crashes, while providing the public with a safer road inthree, rather than 20, years.
17. Key Words
Four-lane Divided, Highway Safety,US 550/NM 44
18. Distribution Statement
Available from the NMDOT Research Bu-reau
19. Security Classif. (of this report)
None20. Security Classif. (of this page)
None21. No. of Pages 22. Price
Form DOT F 1700.7
Achieving Safety Benefits Sooner Rather Than Later –A Before and After Study of US 550/NM 44
Final Report
by
J. W. HallProfessor, Civil EngineeringUniversity of New Mexico
A Report on Research Sponsored by
New Mexico Department of TransportationResearch Bureau
in cooperation withU.S. Department of TransportationFederal Highway Administration
September 2006
NMDOT Research Bureau7500N Pan American Freeway NE
The research in the body of this report examines the accident experience on NM 44 for threeyears before its reconstruction and renaming as US 550, and for two years afterward. Theinformation in the Appendix, developed gratis after the completion of the sponsored research,incorporates a third year of after data.
NOTICE
DISCLAIMER
The United States Government and the State of NewMexico do not endorse products or manufacturers. Trade or manufacturers’ names appear in this documentsolely because they are considered essential to the objectof this report. This information is available in alterna-tive accessible formats. To obtain an alternative format,contact the NMDOT Research Bureau, 7500B PanAmerican Freeway NE, Albuquerque, NM 87109 (POBox 94690, Albuquerque, NM 87199-4690) or by tele-phone 505.841.9145.
This report presents the results of research conducted bythe author and does not necessarily reflect the views ofthe New Mexico Department of Transportation. Thisreport does not constitute a standard or specification.
ii
Acknowledgments
The crash data used in this report were provided by James Davis at the University of NewMexico Division of Government Research. The traffic volume data used in the latter, unfundedstages of this work were provided by Becky Valencia in the NMDOT Transportation PlanningDivision. The assistance of these individuals and offices is appreciated.
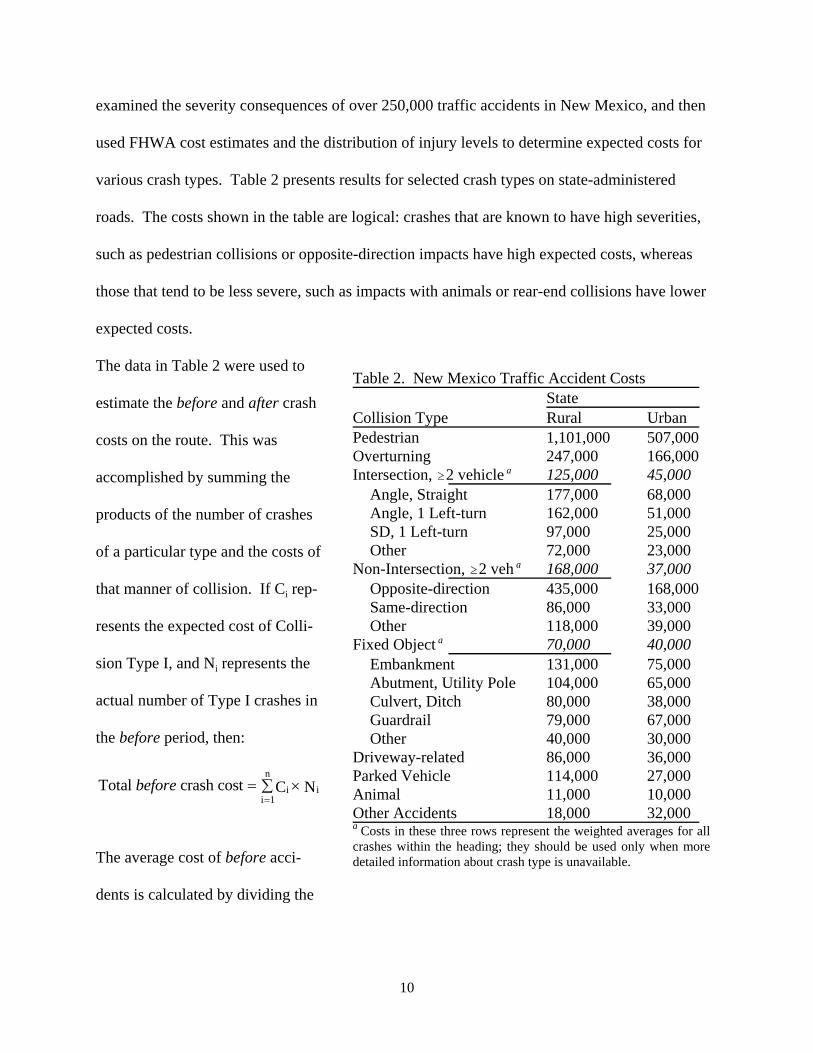
Fixed Object a 70,000 40,000Embankment 131,000 75,000Abutment, Utility Pole 104,000 65,000Culvert, Ditch 80,000 38,000Guardrail 79,000 67,000Other 40,000 30,000
Driveway-related 86,000 36,000Parked Vehicle 114,000 27,000Animal 11,000 10,000Other Accidents 18,000 32,000a Costs in these three rows represent the weighted averages for allcrashes within the heading; they should be used only when moredetailed information about crash type is unavailable.
examined the severity consequences of over 250,000 traffic accidents in New Mexico, and then
used FHWA cost estimates and the distribution of injury levels to determine expected costs for
various crash types. Table 2 presents results for selected crash types on state-administered
roads. The costs shown in the table are logical: crashes that are known to have high severities,
such as pedestrian collisions or opposite-direction impacts have high expected costs, whereas
those that tend to be less severe, such as impacts with animals or rear-end collisions have lower
expected costs.
The data in Table 2 were used to
estimate the before and after crash
costs on the route. This was
accomplished by summing the
products of the number of crashes
of a particular type and the costs of
that manner of collision. If Ci rep-
resents the expected cost of Colli-
sion Type I, and Ni represents the
actual number of Type I crashes in
the before period, then:
Total crash costbefore = ∑ ×=
ii
niC N
1
The average cost of before acci-
dents is calculated by dividing the
11
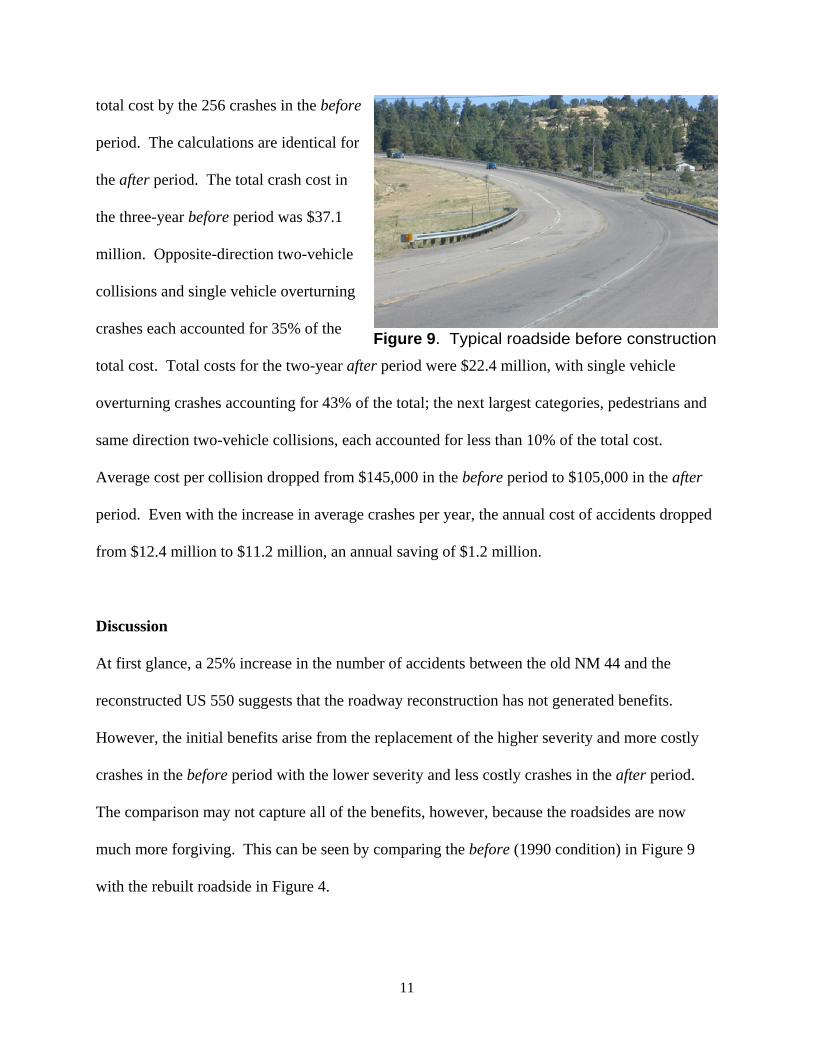
Figure 9. Typical roadside before construction
total cost by the 256 crashes in the before
period. The calculations are identical for
the after period. The total crash cost in
the three-year before period was $37.1
million. Opposite-direction two-vehicle
collisions and single vehicle overturning
crashes each accounted for 35% of the
total cost. Total costs for the two-year after period were $22.4 million, with single vehicle
overturning crashes accounting for 43% of the total; the next largest categories, pedestrians and
same direction two-vehicle collisions, each accounted for less than 10% of the total cost.
Average cost per collision dropped from $145,000 in the before period to $105,000 in the after
period. Even with the increase in average crashes per year, the annual cost of accidents dropped
from $12.4 million to $11.2 million, an annual saving of $1.2 million.
Discussion
At first glance, a 25% increase in the number of accidents between the old NM 44 and the
reconstructed US 550 suggests that the roadway reconstruction has not generated benefits.
However, the initial benefits arise from the replacement of the higher severity and more costly
crashes in the before period with the lower severity and less costly crashes in the after period.
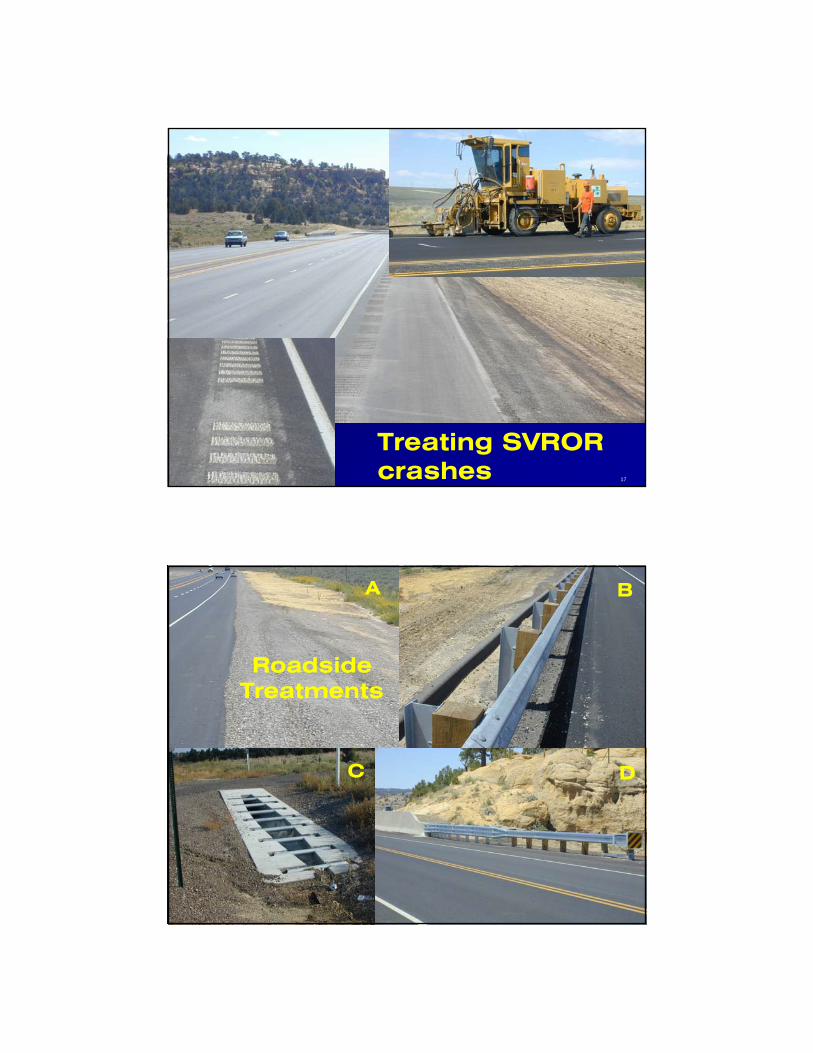
The comparison may not capture all of the benefits, however, because the roadsides are now
much more forgiving. This can be seen by comparing the before (1990 condition) in Figure 9
with the rebuilt roadside in Figure 4.
12
There was concern that the 6-foot median on the reconstructed roadway, albeit with ground-in
rumble strips, was not going to be sufficient to reduce two-vehicle opposite direction impacts.
However, the data show that these collisions dropped from an average of 10 annually in the
before period to 2 annually in the after period.
Results with Three Years of After Crash Data
This project and its funding ended on June 30, 2005 and the NMDOT elected not to extend it.
Computerized crash data for calendar year 2004, the third year of the after period, did not
become available from UNM’s Division of Government Research until late August 2005, nearly
two months after the completion date for the project. Nevertheless, the PI felt a commitment to
exploring the potential improved safety of US 550, and in this spirit, conducted a gratis study of
the route using three years of before and after data. Without any financial support, the PI
performed an analysis and used the findings to prepare a PowerPoint presentation. The 30-
minute presentation was delivered on January 9, 2006, to an audience of about 100 engineers
from governmental agencies and private-sector firms at UNM’s Paving and Transportation
Conference. The most relevant slides from this presentation are shown in Appendix A.
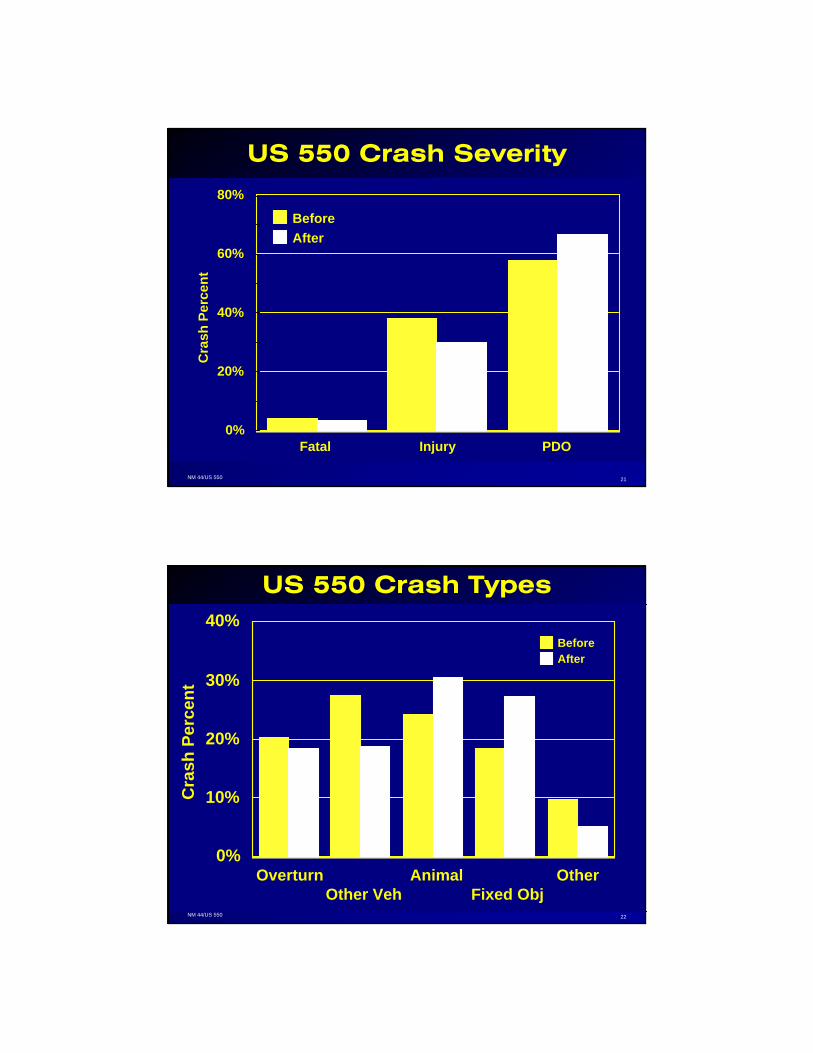
On a positive note, the proportion of crashes involving fatalities is down marginally and the
proportion involving injuries is down about 8%. The proportion of crashes involving other
vehicles, other events, and overturning are down, while those involving animals and fixed
objects are up. With respect to officer-reported contributing factors, the proportion of crashes
involving alcohol dropped from 12% to 7% of all crashes and the proportion of driving left of
center crashes dropped dramatically from 10% in the before period to 1% in the after period.
These statistics are particularly impressive because the officers decreased the proportion of cases
13
in which they reported None/No Error as a contributing factor from 33% to 20%. Another
positive sign is that the average crash cost remains virtually unchanged from the results given for
the two year after period on page 11.
On the negative side, the number of reported crashes has jumped 36%, from 85 per year in 1996-
1998 to 116 per year in 2002-2004. The PI now has a complete set of traffic volume data for this
route to help assess how much of this change is attributable to an increase in volume.
Currently, a student working with the PI identified 190 miles of highway segments on three
routes (US 60, US 64, US 491) that have remained virtually unchanged during the period 1996-
2004. With the assistance of UNM’s Division of Government Research and the NMDOT’s
Transportation Planning Division, we’ve obtained traffic accident and traffic volume data for
these highway segments. As part of a Master’s project, the student will use NM 44/US 550 as
the treatment site, and the other three sites as comparison sites. This will help account for other
factors, such as enforcement, legislation, and human behavior changes, that may have changed
over the period examined in this study.
The researchers expect that these continuing studies will provide useful information and will be
presented in a future technical forum.
References
1. Fernandez, E., New Mexico Route 44 Accident Experience 1978-85, UNM Department of
Civil Engineering, August 1986.
2. Albright, D., et al., Road Life Cycle Innovative Financing Evaluation, Year 2001 Annual
Report, New Mexico State Highway and Transportation Department, March 2002.
14
3. FHWA, Manual on Uniform Traffic Control Devices for Streets and Highways, 2003_R1,
http://mutcd.fhwa.dot.gov , and click on the link to 2003 Edition with Rev. 1.
4. Hall, J., Economic Benefit of Accident Reductions, 68th Annual ITE Meeting, published in
CD compendium, Toronto, 1998.
15
APPENDIX A
Comparison of 1996-1998 with 2002-2004
See Text, page 12
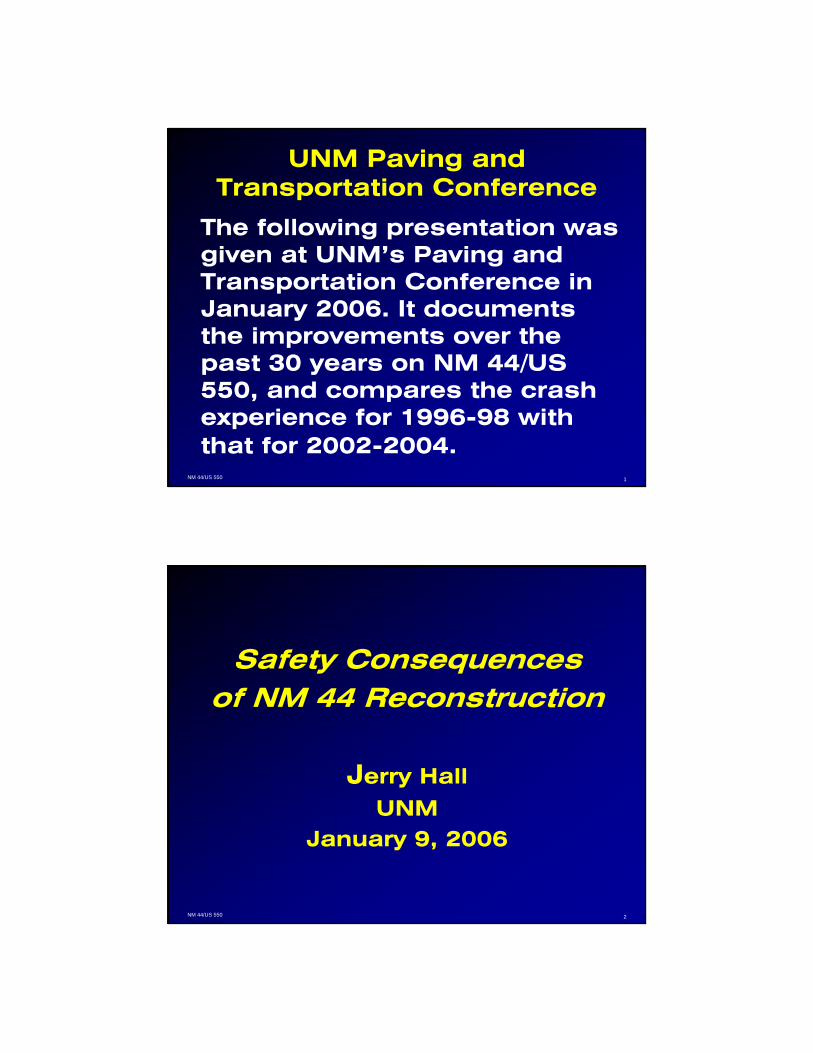
1NM 44/US 550
UNM Paving and Transportation Conference
The following presentation was given at UNM’s Paving and Transportation Conference in January 2006. It documents the improvements over the past 30 years on NM 44/US 550, and compares the crash experience for 1996-98 with that for 2002-2004.
2NM 44/US 550
Safety Consequencesof NM 44 Reconstruction
Jerry Hall
UNMJanuary 9, 2006
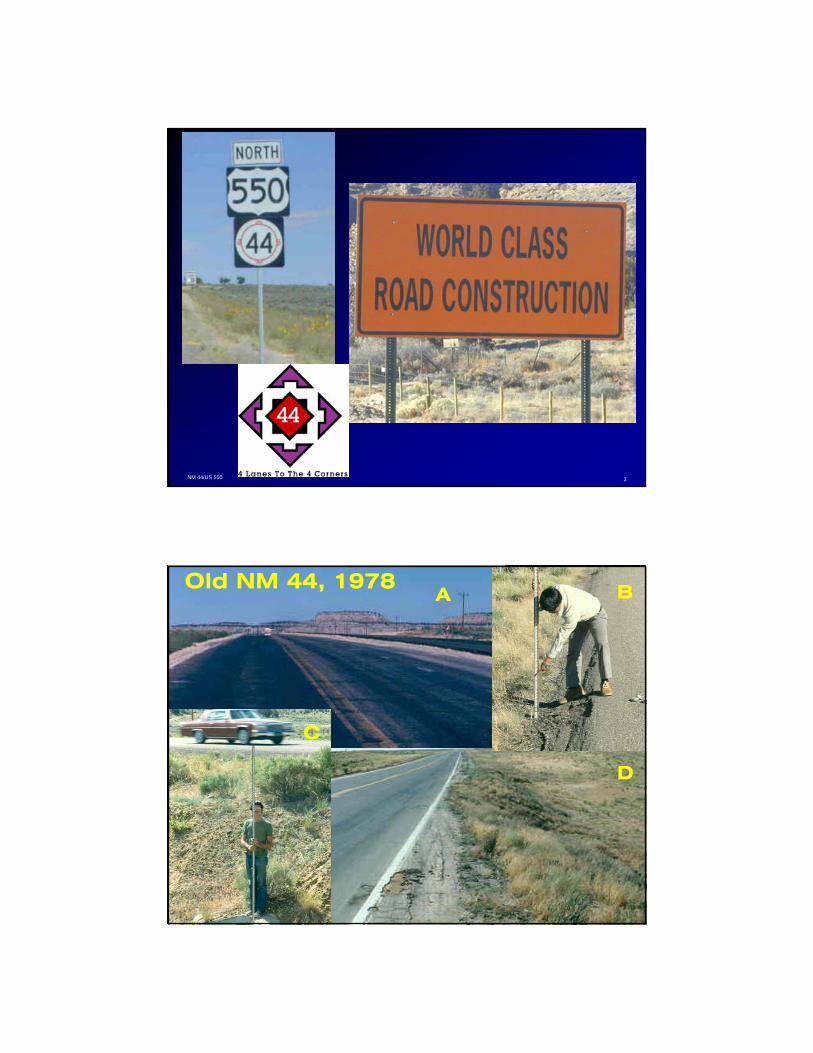
3NM 44/US 550
4NM 44/US 550
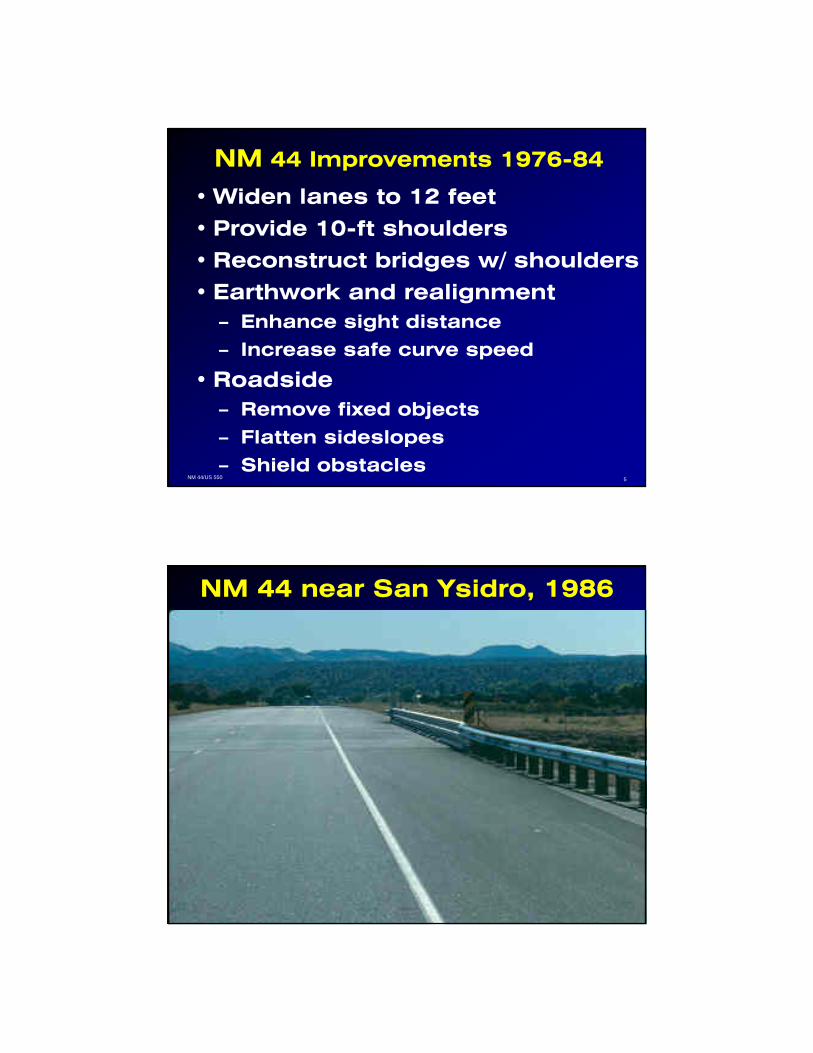
Old NM 44, 1978A B
C
D
5NM 44/US 550
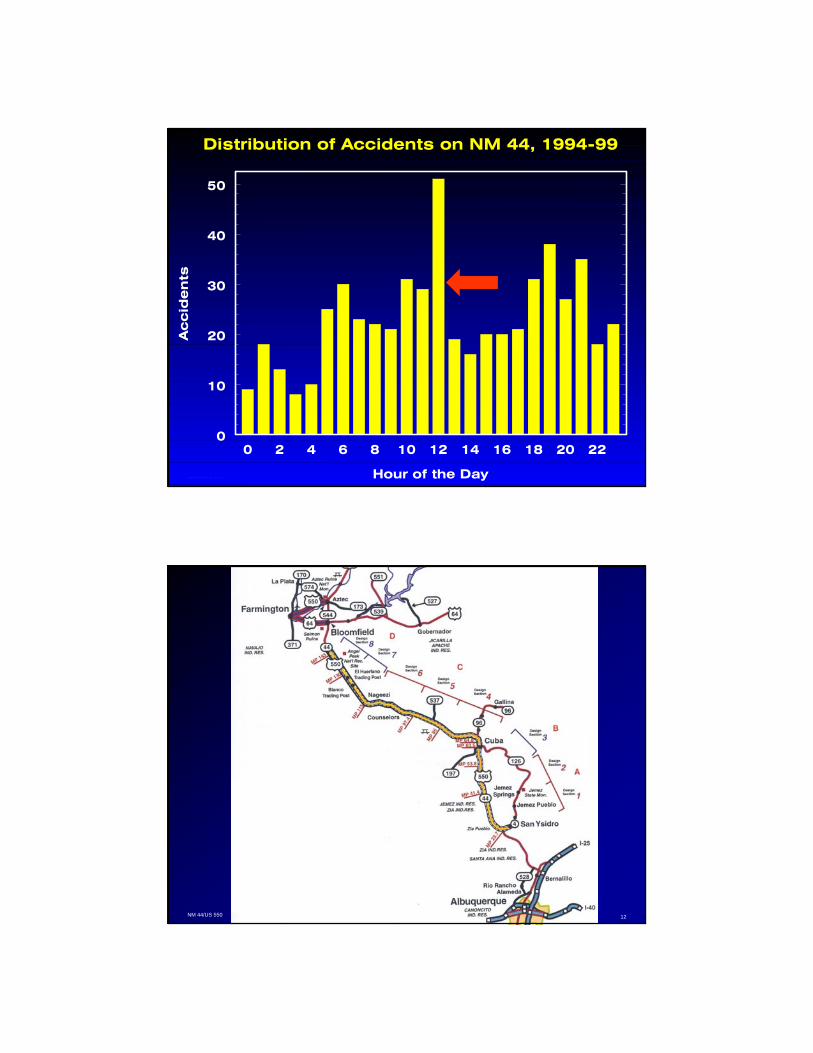
NM 44 Improvements 1976-84
• Widen lanes to 12 feet
• Provide 10-ft shoulders
• Reconstruct bridges w/ shoulders
• Earthwork and realignment– Enhance sight distance
– Increase safe curve speed
• Roadside– Remove fixed objects
– Flatten sideslopes
– Shield obstacles
6NM 44/US 550
NM 44 near San Ysidro, 1986
7NM 44/US 550
Descansos
8NM 44/US 550
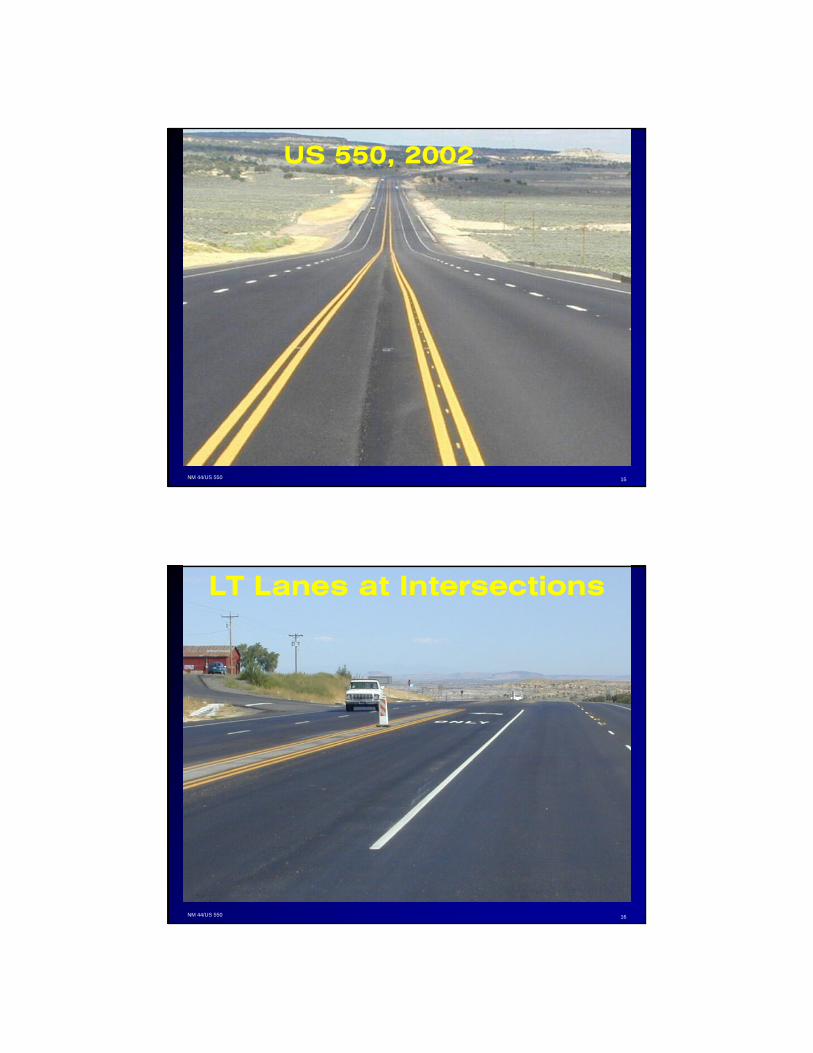
US 550, N of MP 143, 2002
9NM 44/US 550
Crash Rates, NM 44, MP 0-151
0
0.2
0.4
0.6
0.8
1
1.2
1.4
1.6
1978 1981 1984 1987 1990 1993 1996 1999
10NM 44/US 550
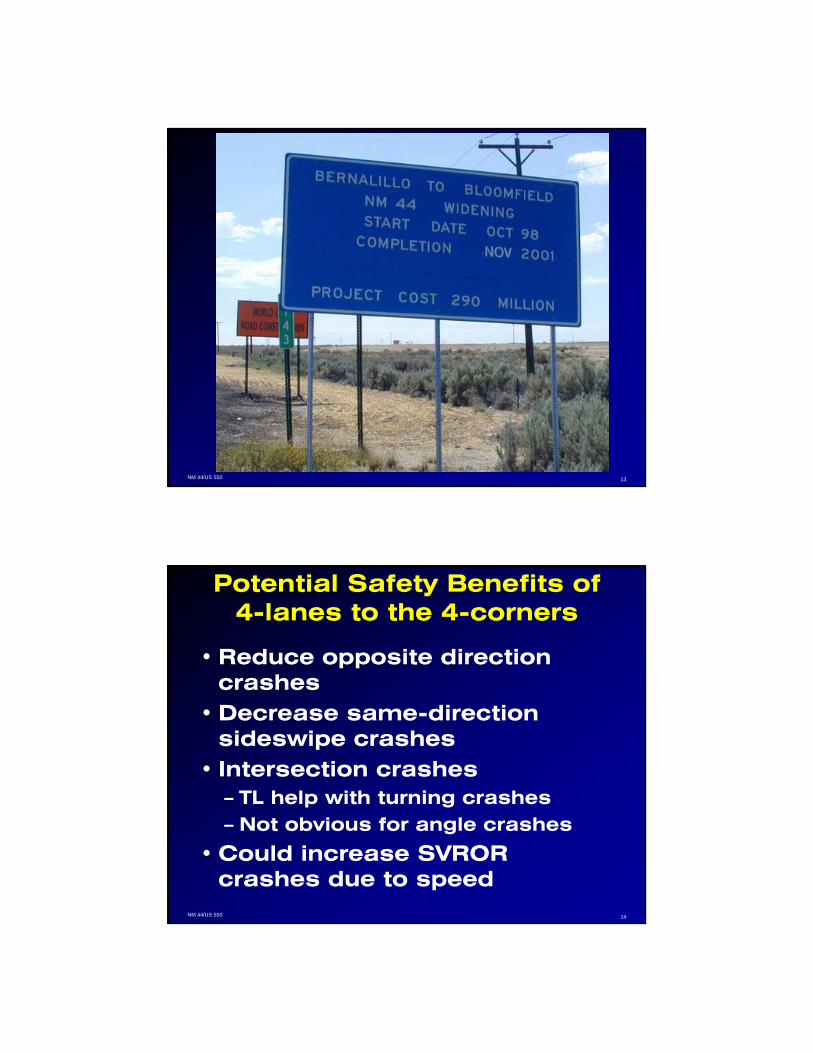
NM 44 Crash Experience1994-99
• San Ysidro to Bloomfield, excluding Cuba
• 557 total accidents– 41 Intersection or driveway– 68% single-vehicle