38
Field Assessment of Forest Fire Severity ForFireS Field Guide

Field Assessment of Forest Fire Severity
ForFireS
Field Guide


ForFireS Field guide
3
Table of contents
1. Introduction ..................................................................................................................................................... 5 2. Searching for a Sampling Point ....................................................................................................................... 6
2.1. General Outlines....................................................................................................................................... 6 2.2. Unreachable Sampling Point .................................................................................................................... 6 2.3. Sampling Point on Agricultural or Urbanised land .................................................................................. 7
3. Sampling Plot Description and Setting............................................................................................................ 8 3.1. Principle.................................................................................................................................................... 8 3.2. Usual Case: Circular Plots........................................................................................................................ 8 3.3. Case of Terraced Ground: Rectangular Plots ........................................................................................... 8 3.4. Plot partially Accessible or on Agricultural or Urbanised land................................................................ 9 3.5. Sampling Plot Marking........................................................................................................................... 10 3.6. Operation Carrying out Order................................................................................................................. 10 3.7. Looking for and Marking Trees.............................................................................................................. 10
4. Plot Related Data........................................................................................................................................... 11 4.1. Fire Number............................................................................................................................................ 11 4.2. Plot Number............................................................................................................................................ 11 4.3. Sampling Date ........................................................................................................................................ 11 4.4. Crew Leader ........................................................................................................................................... 11 4.5. Plot Shape............................................................................................................................................... 11 4.6. Sampling Plot Co-ordinates.................................................................................................................... 12 4.7. GPS Accuracy ........................................................................................................................................12 4.8. Plot Cover before the Fire ...................................................................................................................... 13 4.9. Burnt – Not Burnt Indicator.................................................................................................................... 13 4.10. Point Elevation ..................................................................................................................................... 14 4.11. Slope..................................................................................................................................................... 14 4.12. Aspect ................................................................................................................................................... 14 4.13. Relief Type ........................................................................................................................................... 15 4.14. Slope Shape .......................................................................................................................................... 17 4.15. Erosion Type ........................................................................................................................................ 18 4.16. Erosion Severity ...................................................................................................................................18 4.17. Erosion Aggravation after Fire ............................................................................................................. 19 4.18. Visible Alteration of Rocks Caused by the Fire ................................................................................... 19 4.19. Total Living Tree Cover Rate before the Fire ...................................................................................... 19 4.20. Total Living Tree Cover Rate after the Fire ......................................................................................... 20 4.21. Upper Dominant Tree Species.............................................................................................................. 20 4.22. Lower Dominant Tree Species ............................................................................................................. 20 4.23. Total Living Shrub Cover Rate before the Fire.................................................................................... 20 4.24. Total Living Shrub Cover Rate after the Fire....................................................................................... 21 4.25. Shrub Height before the Fire ................................................................................................................ 21 4.26. Shrub Height after the Fire ................................................................................................................... 21 4.27. Total Living Ligneous Cover Rate before the Fire............................................................................... 21 4.28. Total Living Ligneous Cover Rate after the Fire.................................................................................. 22 4.29. Herbaceous Cover Rate ........................................................................................................................ 22 4.30. Salvage Logging Stock Rate................................................................................................................. 22 4.31. Number of Burnt Stems Not Logged.................................................................................................... 23
5. Tree Related Data .......................................................................................................................................... 24 5.1. Number ................................................................................................................................................... 24 5.2. Diameter at 1.3-m Height ....................................................................................................................... 24 5.3. Species.................................................................................................................................................... 27 5.4. Total Height............................................................................................................................................ 28 5.5. Vegetation State...................................................................................................................................... 29 5.6. Social Status in the Stand ....................................................................................................................... 29 5.7. Height of Charred Stem.......................................................................................................................... 30 5.8. Rate of Burnt Crown............................................................................................................................... 30

ForFireS Field guide
4
5.9. Stem Destruction Rate............................................................................................................................ 30 6. Regeneration Related Data ............................................................................................................................ 31
6.1. Species.................................................................................................................................................... 31 6.2. Number Class of Stems in Each Species ................................................................................................ 31
7. Annexes ......................................................................................................................................................... 32 7.1. Equipment............................................................................................................................................... 32 7.2. Forms...................................................................................................................................................... 32 7.3. Cheat Sheets ........................................................................................................................................... 36

ForFireS Field guide
5
1. Introduction This guide is destined to the field crews in charge of the observations and measures required to assess the severity of the forest fires according to the ForFireS method adopted by the European Union.
The observations and measurements are carried out on plots set around a point whose position has been previously determined in the office.
In the guide the following information are given:
• The rules to search for a point in the field; • Plot description and setting procedure; • Data description and collection procedure; • The rules for data recording.

ForFireS Field guide
6
2. Searching for a Sampling Point
2.1. General Outlines A topographical point called sampling point which must be reached in the field for plot setting is defined by it co-ordinates which are recorded in a GPS receiver before leaving for the field. It also owns an identifier.
The co-ordinates are given in the reference system WGS84. They will be later on converted into the Lambert Azimuthal Equal Area projection recommended by the Ispra Joint Research Centre.
The point must be shown on a topographical map with a scale no less than 1/50,000.
The field crew uses its vehicle to reach the nearest possible place provided it is at least 50 m far away from the sampling point. This place is called “Starting Point”.
At the starting point the crew leader:
• Switches on the reception device; • Selects the sampling point to be reached among the ones recorded in the GPS.
The GPS receptor then displays the azimuth and distance of the point to be reached.
According to the receptor showings the crew leader chooses the itinerary it deems the best suited with the help of the map.
When, according to the indication of its position, the receptor is at a distance inferior to 5 m to the point to be reached, and if the coordinates do not fluctuate, then the point is considered reached.
If because of the reception conditions (vegetative cover, radio transmission, satellites configuration) the values displayed are not stable, the crew leader moves away about ten meters to find a place where the values don’t change, and finish the course using a compass and a measuring tape according to the azimuth and distance indications given by the receptor. When progressing, distance measurements must be corrected to horizontal distances. On steep terrain:
• Progress by horizontal projections, the steeper the slope the shorter the projection; or • Correct the distance measurement along the ground according to the slope; if L is the length measured
on the ground, L’ the length considered to horizontal distance and θ the slope angle it comes θ= cosL'L
Equation 1
When the sampling point has been reached, its location is materialized by a pole or a compass stand.
2.2. Unreachable Sampling Point When the sampling point can’t be reached (water body, building, dangerous ground), it is discarded. The reasons why it has been discarded are reported on the plot form (backside) and the appropriate code is entered in Field 11 of the plot form (§ 4.8). If possible the Burnt – not burnt indicator is entered (§ 4.9).
However, if the point is on a narrow water stream which crosses forest or shrub vegetation, it is moved on the smallest distance necessary to install the plots described in § 3. The coordinates of the new point are taken with the GPS receiver and a sketch is drawn (§ 3.4).

ForFireS Field guide
7
2.3. Sampling Point on Agricultural or Urbanised land If the point is located on agricultural or urbanised land it is discarded. The reasons why it has been discarded are reported on the plot form (backside) and the appropriate code is entered in Field 11 of the plot form (§ 4.8).
Cultivated fields, meadows, market gardens, vineyards, orchards, olive groves are agricultural lands. Poplar stands are not agricultural lands.
Areas developed for dwelling or industrial or craft activity are urbanised lands, including their annexes (gardens, yards, urban parks, theme parks).
However, if the point is on a forest road1 which crosses forest or shrub vegetation, it is moved on the smallest distance necessary to install the plots described in § 3. The coordinates of the new point are taken with the GPS receiver and a sketch is drawn (§ 3.4).
1 A forest road is a paved road whatever its width or, if it is not paved, a road at least 3-metre wide including shoulders, ditches and retaining walls if any.
ForFireS Field guide
8
3. Sampling Plot Description and Setting
3.1. Principle Data are collected on sampling devices made of:
• A 500-square-metre plot for collecting general data and data pertaining to trees with a diameter at breast height above 7 cm;
• A 12-square-meter subplot for collecting data pertaining to trees with a lesser diameter which are called “regeneration”.
In case the number of trees on a 500-square-metre plot exceeds 20 the size of the plot can be reduced following specific rules.
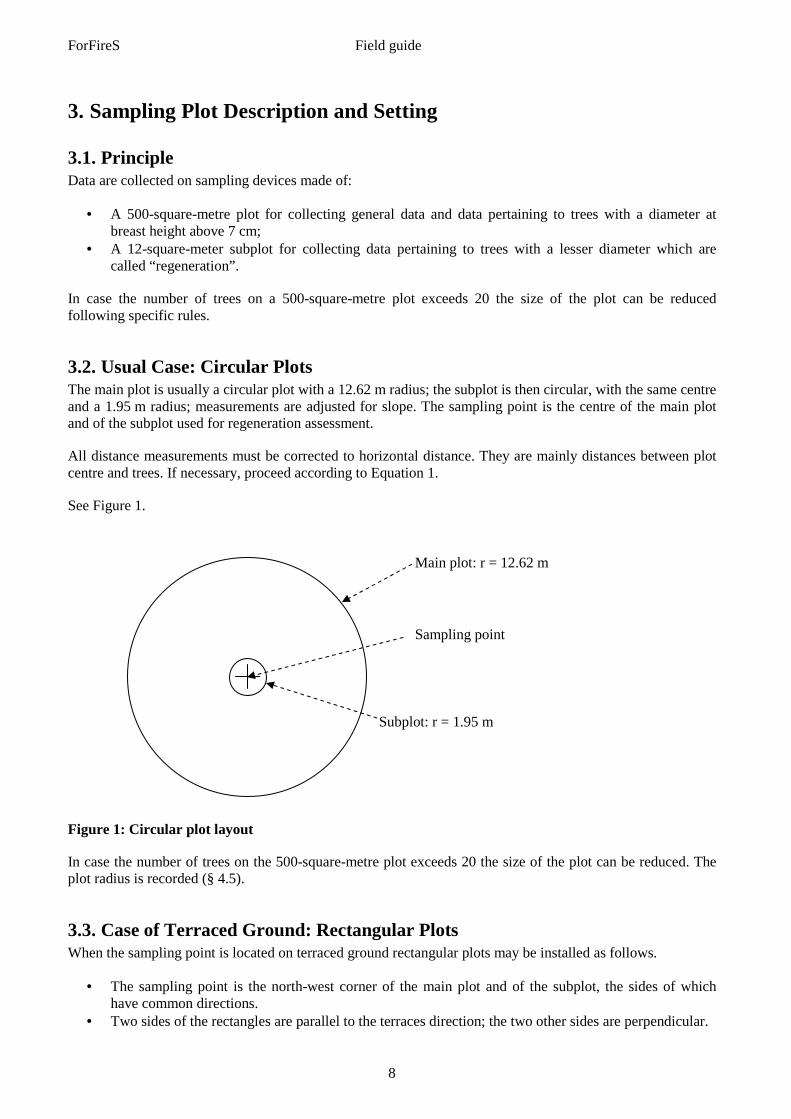
3.2. Usual Case: Circular Plots The main plot is usually a circular plot with a 12.62 m radius; the subplot is then circular, with the same centre and a 1.95 m radius; measurements are adjusted for slope. The sampling point is the centre of the main plot and of the subplot used for regeneration assessment.
All distance measurements must be corrected to horizontal distance. They are mainly distances between plot centre and trees. If necessary, proceed according to Equation 1.
See Figure 1.
Figure 1: Circular plot layout
In case the number of trees on the 500-square-metre plot exceeds 20 the size of the plot can be reduced. The plot radius is recorded (§ 4.5).
3.3. Case of Terraced Ground: Rectangular Plots When the sampling point is located on terraced ground rectangular plots may be installed as follows.
• The sampling point is the north-west corner of the main plot and of the subplot, the sides of which have common directions.
• Two sides of the rectangles are parallel to the terraces direction; the two other sides are perpendicular.
Main plot: r = 12.62 m
Subplot: r = 1.95 m
Sampling point

ForFireS Field guide
9
• The average width of the terraces, corrected to horizontal distance, is measured from bank base to bank base.
• The length of the sides of the main plot perpendicular to the terraces direction is equal to twice the terrace width (the plot is installed on two terraces).
• 500 are divided by twice this average width to obtain the length of the sides of the main plot parallel to the terraces direction. Example: if the average width is 8 m, the length of the sides of the main plot parallel to the terraces direction is 500/16 = 31.25 m.
• The width of a terrace is the length of the side of the subplot in the direction perpendicular to the terraces.
• 12 are divided by this width to obtain the length of the sides of the subplot along the terraces. Example: if the average width is 8 m, the length of the sides of the subplot parallel to the terraces direction is 12/8 = 1.5 m.
See Figure 2.
Figure 2: Rectangular plot layout
Rectangular plots are to be used when the terraces can be considered straight on a distance which matches their length. When their height is low, when they are eroded and, generally speaking, when it is not very difficult to move around the sampling point, it is advised to install a circular plot. If it is likely that there are more than 20 trees on a 500-square meter plot a circular plot should always be preferred.
3.4. Plot partially Accessible or on Agricultural or Urbanised land If a part of the plot is not accessible or is located on agricultural or urbanised land:
• In case of a circular plot, the sampling point is moved perpendicularly to the border, along the smallest possible distance so that the plot is tangent to this border;

ForFireS Field guide
10
• In case of a rectangular plot, the directions of the sides, given by the terrace orientation, must be kept, and the sampling point is moved along the smallest possible distance so that the whole plot is on the same side of the border as the sampling point.
The coordinates of the new sampling point are taken by the GPS receiver and recorded by the crew leader (§ 4.6).
The crew leader draws an explaining sketch on the backside of the plot form.
3.5. Sampling Plot Marking The sampling plot is marked with a stake. In the case of circular plots it is recommended to use a stand on which a compass can be fastened.
In the case of rectangular plots all four corners of the main plot must be marked with stakes.
3.6. Operation Carrying out Order Once the inventory point has been found and the plot shape chosen, it must be looked for regeneration on the sup-plot and in case there is some carry out the operations described in § 6, so as to do them without the plants having been trampled upon.
3.7. Looking for and Marking Trees Trees above the breakpoint diameter must be looked for and numbered. Trees are defined in § 5.1. This applies to standing or inclined trees, including partially uprooted trees. Lying trees are not taken into account.
Numbering and diameter measurements must be carried out according to the rules given in §§ 5.1 and 5.2.
A tree belongs to a plot if the axis of its section at breast height is inside the plot boundary. Distance measurements must be adjusted for the slope of the ground and corrected to horizontal distances.
ForFireS Field guide
11
4. Plot Related Data
4.1. Fire Number Definition: The fire number is the identifier of the fire for whose severity assessment the plot is installed.
Use: The plot number is used to identify the plot in the set of data collected during the severity assessment.
Determination method: The fire number is attributed when the fire is recorded in the European database.
Plot form field: 1.
4.2. Plot Number Definition: The plot number is a number attributed to the plot when carrying out the severity assessment of a given fire.
Use: The plot number, together with the fire number, is used to identify the plot in the set of data collected during the severity assessment.
Determination method: The plot number is attributed when the sampling design is set.
Plot form field: 2.
4.3. Sampling Date Definition: The sampling date is made of the year, the month and the day when the field work is carried out on the plot.
Use: The sampling date makes it possible to know the time elapsed since the fire date. It is also used for checking purposes.
Determination method: The sampling date is entered according to reality. It is written in the YYYY/MM/DD format.
Plot form field: 3.
4.4. Crew Leader Definition: The crew leader is the name of the person leading the crew which carries out the work on the plot.
Use: Determination of the person responsible for carrying out the work on the plot.
Determination method: The crew leader name is entered according to reality. The name itself can be replaced by a code up to eight-characters.
Plot form field: 4.
4.5. Plot Shape Definition: The plot shape is the geometrical shape of the projection of the plot boundary on a horizontal plane.
Use: Determination of the sampling device in use and result computation.

ForFireS Field guide
12
Determination method: The plot is in most cases circular. It can be rectangular when the ground has been terraced. The decision is made by the crew leader
Code Plot shape
100 Circular plot
200 Rectangular plot
300 No plot installed
(Radius) Circular plot, radius smaller than 12.62 m, value in whole centimetres Plot form field: 5.
4.6. Sampling Plot Co-ordinates Definition: The coordinates are a set of two numbers which define the position of any point on the ground and which are tied to a reference datum, to chosen origins (geographic coordinates) and to a map projection system (rectangular coordinates – X, Y).
Each sampling point has at least two coordinate sets. In ForFireS we use: • Rectangular co-ordinates, generally in a local projection system, for designing the
sampling network; we call them “theoretical rectangular co-ordinates”; • Geographic co-ordinates (latitude and longitude) in the WGS84 system for reaching the
point using a GPS receiver; we call “theoretical geographic co-ordinates” the ones which are derived from the above-mentioned rectangular co-ordinates.
When a sampling point has been reached, the geographic coordinates displayed by the GPS receiver may – and usually will – differ from the theoretical geographic coordinates. We call them “actual geographic coordinates”.
They will be later on converted as rectangular coordinates into the Lambert Azimuthal Equal Area projection recommended by the Ispra Joint Research Centre (LAEA).
Use: Precise identification of the sampling point in the field.
Determination method: The sampling point theoretical rectangular coordinates and theoretical geographic coordinates are determined when the sampling design is set. The actual geographic co-ordinates are read on the GPS receiver display once the sampling point has been reached. If the point could not be reached no value is entered. The values are entered in decimal degrees to six decimal places (ex: 38.945926º / 9.761194º). If the point has been reached with the help of a compass and measuring tape because of bad reception conditions the actual geographic co-ordinates are equal to the theoretical co-ordinates.
Plot form fields: 6 and 7 for the theoretical geographic co-ordinates 8 and 9 for the actual geographic co-ordinates.
4.7. GPS Accuracy Definition: The GPS accuracy is the estimate of the error between the point whose coordinates are displayed and the point actually installed.
Use: The GPS accuracy makes it possible to assess the accurateness of the point position. It is also used for checking purposes.
Determination method: The GPS accuracy is displayed by the receptor readings. The value is entered to the nearest whole meter.
ForFireS Field guide
13
It is to be noted that one metre on an earth great circle is equivalent to about 9.10-6 degree and that conversely 1.10-6 degree is equivalent to about 11 cm.
Plot form field: 10.
4.8. Plot Cover before the Fire Definition: The plot cover before the fire is the ground cover at the plot and its surroundings before the fire happened.
Use: The plot cover before the fire is used to record whether a point where no observations or measurements have been done was in forest or shrubland or on agricultural or urbanised land, or if it was not reachable.
Code Plot cover before the fire
100 Forest
200 Shrubland
300 Agricultural land
400 Urbanised land
500 Undetermined plot cover (unreachable point) Determination method: The plot cover before the fire is determined according to what can be observed. Forest cover means that at least one tree as defined in § 5.1 is supposed to have stood on the plot before the fire. Scattered trees in agricultural land or hedges between agricultural fields or meadows must not be taken into account. Rules about agricultural lands are given in § 2.3.
Plot form field: 11.
4.9. Burnt – Not Burnt Indicator Definition: The Burnt – Not burnt indicator records whether traces of a fire are visible on the sampling plot.
Use: The Burnt – Not burnt indicator is used to set out the points which have not been surveyed because no traces of fire are visible.
Code Burnt – Not burnt indicator
100 Burnt
200 Not burnt Determination method: The Burnt – Not burnt indicator is determined according to what can be observed. If any trace of fire is visible the value 100 is entered. If the point could not be reached but if there is no doubt about the indicator value a value is entered.
Plot form field: 12.

ForFireS Field guide
14
4.10. Point Elevation Definition: The point elevation is the distance between the horizontal plane (perpendicular to the Earth gravity) at the mean sea level and the horizontal plane passing through the point.
Use: The point elevation can be used to break down various fire characteristics.
Determination method: The elevation is taken in the office from large scale topographic maps or using a digital elevation model. If the map or digital elevation model accuracy is deemed not sufficient the elevation is taken form the GPS readings. The value is then entered to the nearest whole meter.
Plot form field: 13.
4.11. Slope Definition: The ground slope is the angle made by the horizontal plane and the ground plane.
Use: The slope is used to evaluate the erosion aggravation risk indicator. It can also be used to break down various fire characteristics.
Determination method: The slope is measured with a clinometer or a hypsometer and is entered to the nearest whole degree. It is always measured along the fall line. It is advised to measure it across the whole plot, from its highest point to the lowest one or reversely.
Plot form field: 14.
4.12. Aspect Definition: The ground aspect is the orientation of the plot fall line compared with true north.
Use: The ground aspect can be used to break down various fire characteristics.
Summary of cases when nothing more is to be done on a sampling point
Unreachable point • Plot shape (Field 5): 300 – not installed • Plot landcover (Field 11): 500 • Plot actual co-ordinates (Fields 8 and 9): empty • Burnt – not burnt indicator (Field 12): 100, 200 or empty
Point on agricultural or urbanised land • Plot shape (Field 5): 300 – not installed • Plot landcover (Field 11): 300 or 400 • Plot actual co-ordinates (Fields 8 and 9): GPS readings • Burnt – not burnt indicator (Field 12): 100, 200 or empty
Point on not burnt forest or shrubland • Plot shape (Field 5): 100, 200 or radius (< 12 m) • Plot landcover (Field 11): 100 or 200 • Plot actual co-ordinates (Fields 8 and 9): GPS readings • Burnt – not burnt indicator (Field 12): 200

ForFireS Field guide
15
Determination method: The ground aspect is measured with a compass. It is recorded to the nearest whole degree true north. However in the field the value magnetic north is entered and the value true north is computed in the office.
When the slope is lower than 5 degrees (flat ground) the value “999” is entered.
Plot form field: 15.
4.13. Relief Type Definition: The relief type expresses the ground shape on the plot and its nearest surroundings.
Use: The relief type can be used to break down various fire characteristics.
Determination method: According to the deviation from a flat ground the following modes are chosen:
Code Relief Type Description
100 Flat land: Slope below or equal to 5°; plains, plateaus, terraces, flat valley bottoms are classed here. See Figure 3
Figure 3: Flat land
Code Relief Type Description
200 Slope or comb bottom: Lower parts of steep slopes, of hillsides, of steep comb, of combs, of ditches, of ravines. See Figure 4
Figure 4: Slope bottom
Code Relief Type Description
300 Slope middle: Middle part of mountain slopes, of hillsides, of heaps of fallen rocks or alluvial deposits and similar. See Figure 5

ForFireS Field guide
16
Figure 5: Slope middle
Code Relief Type Description
400 Hilltop, Slope top: Hilltops, mountain tops, mountain ridges, mountain edges, places on slope edges in case of plateau or mountain terrace or moraine. See Figure 6
Figure 6: Slope top
Code Relief Type Description
500 Other: Ground which cannot be classified in the 100 to 400 modes; for instance ground with rapidly changing slopes and aspects.
In case of difficulties to classify refer to the position of the sampling point. For classifying the situation of the plot in its surroundings must be taken into account. See Figure 7.
Figure 7: Relief type determination

ForFireS Field guide
17
Plot form field: 16.
4.14. Slope Shape Definition: The slope shape expresses the shape of the plot fall line around the sampling point.
Use: The slope shape can be used to break down various fire characteristics.
Determination method: The slope shape is chosen among the following modes according to what can be observed.
Code Slope Shape
100 Straight: The fall line is practically a straight line near by the sampling point.
200 Concave: The fall line shows a regular concave shape near by the sampling point.
300 Convex: The fall line shows a regular convex shape near by the sampling point
400 Terraces: The fall line crosses artificial terraces near by the sampling point.
500 Various: The fall line is undulated near by the sampling point.
600 Flat ground
Figure 8: Fall line shape determination
Plot form field: 17.
ForFireS Field guide
18
4.15. Erosion Type Definition: The erosion type expresses the main erosion factor and its consequences in the field.
Use: The erosion type can be used to break down various fire characteristics.
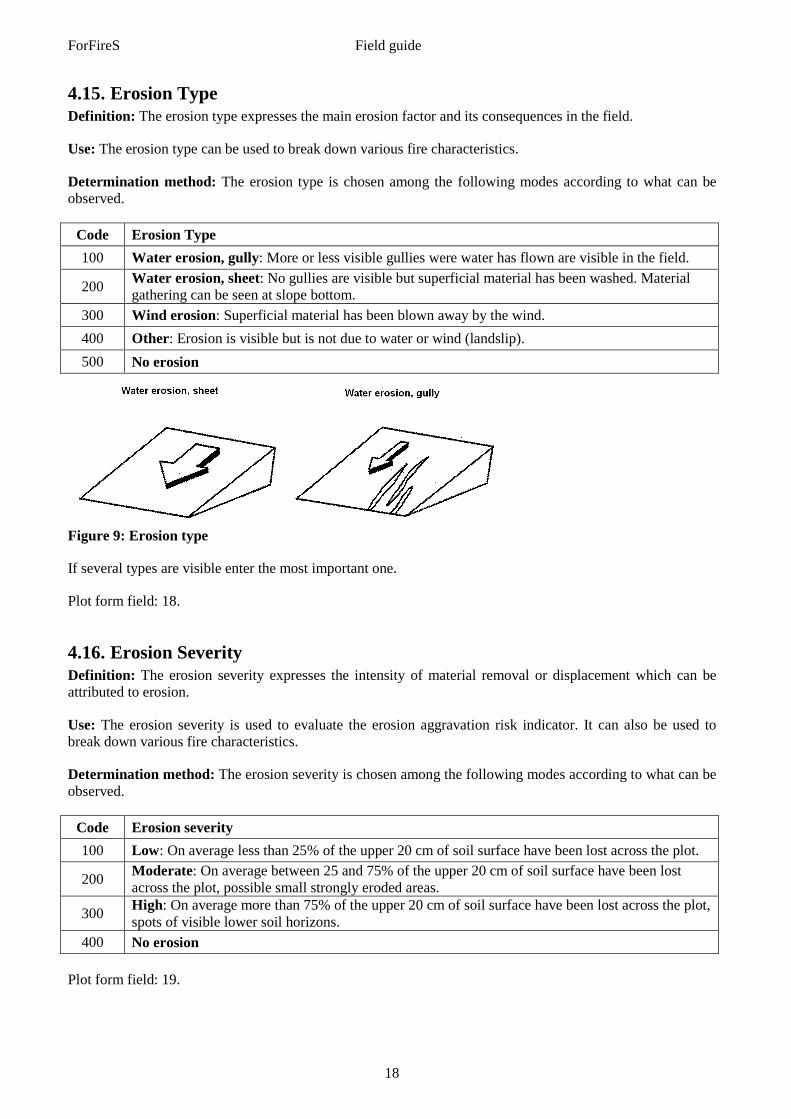
Determination method: The erosion type is chosen among the following modes according to what can be observed.
Code Erosion Type
100 Water erosion, gully: More or less visible gullies were water has flown are visible in the field.
200 Water erosion, sheet: No gullies are visible but superficial material has been washed. Material gathering can be seen at slope bottom.
300 Wind erosion: Superficial material has been blown away by the wind.
400 Other: Erosion is visible but is not due to water or wind (landslip).
500 No erosion
Figure 9: Erosion type
If several types are visible enter the most important one.
Plot form field: 18.
4.16. Erosion Severity Definition: The erosion severity expresses the intensity of material removal or displacement which can be attributed to erosion.
Use: The erosion severity is used to evaluate the erosion aggravation risk indicator. It can also be used to break down various fire characteristics.
Determination method: The erosion severity is chosen among the following modes according to what can be observed.
Code Erosion severity
100 Low: On average less than 25% of the upper 20 cm of soil surface have been lost across the plot.
200 Moderate: On average between 25 and 75% of the upper 20 cm of soil surface have been lost across the plot, possible small strongly eroded areas.
300 High: On average more than 75% of the upper 20 cm of soil surface have been lost across the plot, spots of visible lower soil horizons.
400 No erosion Plot form field: 19.

ForFireS Field guide
19
4.17. Erosion Aggravation after Fire Definition: The erosion aggravation after fire expresses the fact that the erosion severity has increased as a consequence of the fire.
Use: The erosion aggravation after fire is used to evaluate the erosion aggravation risk indicator. It can also be used to break down various fire characteristics.
Determination method: The erosion type is chosen among the following modes according to what can be observed.
Code Erosion Aggravation after Fire
100 The erosion has increased after the fire.
200 The erosion has not increased after the fire. Plot form field: 20.
4.18. Visible Alteration of Rocks Caused by the Fire Definition: The visible alteration of rocks caused by the fire expresses the possible effects of the fire on the bedrock.
Use: The visible alteration of rocks caused by the fire is used to evaluate the fire intensity indicator. It can also be used to break down various fire characteristics.
Determination method: The visible alteration of rocks caused by the fire is chosen among the following modes according to what can be observed.
Code Visible Alteration of Rocks Caused by the Fire
100 Splitting : The heath has caused the rock to split.
200 Texture change: The bedrock has acquired a porous or powdery texture.
300 Colour change: Bedrock colour has changed at least locally.
400 No alteration Plot form field: 21.
4.19. Total Living Tree Cover Rate before the Fire Definition: The total living tree cover rate before the fire is the ratio between the overall projection of living tree crowns on the plot and the plot area as this ratio was before the fire.
Use: The total living tree cover rate before the fire is used to evaluate the erosion aggravation risk indicator. It can also be used to break down various fire characteristics.
Determination method: Trees are defined in § 5.1. The total living tree cover before the fire is evaluated by observing the living trees and the dead trees whose drying up can be attributed to the fire. All trees at least 10 cm high must be taken into account whatever their diameter. One must try to reconstruct mentally the crowns of the dead trees. If a neighbouring undamaged stand is deemed similar to the burnt stand it can be used as a reference. The cover rate is entered in percent, rounded to the nearest 10 percent if the value is higher than 10 percent. The result cannot be above 100%.
Plot form field: 22.
ForFireS Field guide
20
4.20. Total Living Tree Cover Rate after the Fire Definition: The total living tree cover rate after the fire is the ratio between the overall projection of living tree crowns on the plot and the plot area as it is when the sampling is being done.
Use: The total living tree cover rate after the fire is used to evaluate the erosion aggravation risk indicator. It can also be used to break down various fire characteristics.
Determination method: The total living tree cover before the fire is evaluated by observing the living trees on the plot. All trees at least 10-cm high must be taken into account whatever their diameter. The cover rate is entered in percent, rounded to the nearest 10 percent if the value is higher than 10 percent. The result cannot be above 100%.
Plot form field: 23.
4.21. Upper Dominant Tree Species Definition: The upper dominant tree species is the tree species whose individuals 5-m high and above have the highest cover rate on the plot, whatever their vegetation state.
Use: The upper dominant tree species is used to break down several fire characteristics.
Determination method: The overall projection area of all trees of the same species higher than 5 m is estimated. The species which has the highest value is the upper dominant tree species. The species code is entered according to § 5.3. If there is not any tree higher than 5 m on the plot the code 3000 is entered.
Plot form field: 24.
4.22. Lower Dominant Tree Species Definition: The lower dominant tree species is the tree species whose individuals 10-cm to 5-m high have the highest cover rate on the plot.
Use: The lower dominant tree species is used to break down several fire characteristics.
Determination method: The overall projection area of all trees of the same species 10-cm to 5-m high is estimated. The species which has the highest value is the lower dominant tree species. The species code is entered according to § 5.3. If there is not any tree 10-cm to 5-m high on the plot the code 3000 is entered.
Plot form field: 25.
4.23. Total Living Shrub Cover Rate before the Fire Definition: The total living shrub cover rate before the fire is the ratio between the overall projection of living shrub crowns (ligneous plants which are not likely to reach a 5-m height on the site) on the plot and the plot area as this ratio was before the fire.
Use: The total living shrub cover rate before the fire is used to evaluate the erosion aggravation risk indicator. It can also be used to break down various fire characteristics.
Determination method: The total living shrub cover before the fire is evaluated by observing the living shrubs and the dead shrubs whose drying up can be attributed to the fire. All shrubs at least 10-cm high must be taken into account. One must try to reconstruct mentally the crowns of the dead shrubs. If neighbouring undamaged vegetation is deemed similar to the burnt one it can be used as a reference. The cover rate is

ForFireS Field guide
21
entered in percent, rounded to the nearest 10 percent if the value is higher than 10 percent. The result cannot be above 100%.
Plot form field: 26.
4.24. Total Living Shrub Cover Rate after the Fire Definition: The total living shrub cover rate after the fire is the ratio between the overall projection of living shrub crowns on the plot and the plot area as it is when the sampling is being done.
Use: The total living shrub cover rate after the fire is used to evaluate the erosion aggravation risk indicator. It can also be used to break down various fire characteristics.
Determination method: The total living shrub cover after the fire is evaluated by observing the living shrubs on the plot. All shrubs at least 10-cm high must be taken into account. The cover rate is entered in percent, rounded to the nearest 10 percent if the value is higher than 10 percent. The result cannot be above 100%.
Plot form field: 27.
4.25. Shrub Height before the Fire Definition : The shrub height before the fire equals three quarters of the maximum height above the ground reached by the shrubs before the fire.
Use: The shrub height before the fire is used to evaluate the fire intensity indicator.
Determination method: The shrub height before the fire is estimated from the height above the ground of the existing shrub vegetation if there are on the plot shrub stems with living crowns and whose growth doesn’t seem to have been disturbed by the fire. If such is not the case, similar vegetation which fulfils this condition must be looked for in the surroundings.
The value is entered to the nearest whole decimetre.
Plot form field: 28.
4.26. Shrub Height after the Fire Definition : The shrub height after the fire equals three quarters of the maximum height above the ground reached by the shrubs after the fire.
Use: The shrub height after the fire is used to evaluate the fire intensity indicator.
Determination method: The shrub height after the fire is estimated from the height above the ground of the existing shrub vegetation.
The value is entered to the nearest whole decimetre.
Plot form field: 29.
4.27. Total Living Ligneous Cover Rate before the Fire Definition: The total living ligneous cover rate before the fire is the ratio between the area of the plot covered with ligneous vegetation (trees and shrubs) and the total plot area before the fire.
Use: The total living ligneous cover rate before the fire is used to evaluate the erosion aggravation risk indicator. It can also be used to break down various fire characteristics.

ForFireS Field guide
22
Determination method: The total living ligneous cover rate before the fire is evaluated by observing the ligneous vegetation on the plot. All shrubs and trees at least 10-cm high must be taken into account. One must try to reconstruct mentally the crowns of the dead plants. If neighbouring undamaged vegetation is deemed similar to the burnt one it can be used as a reference. The total living ligneous cover rate is not usually equal to the sum of the tree cover rate and of the shrub cover rate because overlaying must be taken into account. The cover rate is entered in percent, rounded to the nearest 10 percent if the value is higher than 10 percent. The result cannot be above 100%.
Plot form field: 30.
4.28. Total Living Ligneous Cover Rate after the Fire Definition: The total living ligneous cover rate after the fire is the ratio between the area of the plot covered with ligneous vegetation (trees and shrubs) and the total plot area after the fire.
Use: The total living ligneous cover rate after the fire is used to evaluate the erosion aggravation risk indicator. It can also be used to break down various fire characteristics.
Determination method: The total living ligneous cover rate is evaluated by observing the ligneous vegetation on the plot. All shrubs and trees at least 10-cm high must be taken into account. The total living ligneous cover rate is not usually equal to the sum of the tree cover rate and of the shrub cover rate because overlaying must be taken into account. The cover rate is entered in percent, rounded to the nearest 10 percent if the value is higher than 10 percent. The result cannot be above 100 %.
Plot form field: 31.
4.29. Herbaceous Cover Rate Definition: The herbaceous cover rate is the ratio between the area of the plot covered with herbaceous vegetation and the total plot area.
Use: The herbaceous cover rate can be used to break down various fire characteristics.
Determination method: The herbaceous cover rate is evaluated by observing the plot vegetation. Whether trees overhang the herbaceous vegetation or not is not taken into account. The cover rate is entered in percent, rounded to the nearest 10 percent if the value is higher than 10 percent.
Plot form field: 32.
4.30. Salvage Logging Stock Rate Definition: The salvage logging stock rate is the ratio between the total areas of tree stocks logged after the fire and the total area which would appear if all the trees had been logged after the fire.
Use: The salvage logging stock rate is used to evaluate the volume of the wood burnt by the fire.
Determination method: The area of the logged tree sections is evaluated as a relative proportion of the total of all possible sections.
Stocks are those of trees which would have been measured and described on the plot had they been standing. Their diameter at breast height should have reached at least 7 cm. As it can’t be known it is assumed that the stock diameter must be at least 11 cm.
Felling must be assumed to have been made 10 cm above ground, measuring uphill when the ground is in a slope. The total of theoretical felling sections must not be confused with the basal area, measured at breast height.

ForFireS Field guide
23
The rate is expressed in percent to the nearest 10 percent.
Plot form field: 33.
4.31. Number of Burnt Stems Not Logged Definition: The number of burnt stems not logged is the number of stems with traces of charring on the plot, whether they are standing or lying.
Use: The number of burnt stems not logged is used to evaluate the volume of the wood burnt by the fire.
Determination method: The burnt stems not logged are tallied. All the lying stems, about which no data are collected (see § 3.7), must be tallied. Therefore on a plot where all standing trees show traces of charring this number can only be equal to or higher than the number of standing trees.
Plot form field: 34.

ForFireS Field guide
24
5. Tree Related Data
5.1. Number Definition: Single identifier of a given tree on a given plot.
Use: The tree number is used for assigning to one tree the different data collected about that tree.
Determination method: What is called a tree is a ligneous plant from a species whose individuals are likely to reach a 5-m height on the considered site. On circular plots trees are numbered clockwise starting from the north. For the duration of the sampling a tag with the number facing the plot centre is attached to the tree.
On rectangular plots trees are numbered from the one nearest to the sampling point moving away along the terrace where it is located then on the adjoining terrace moving in the opposite direction as followed on the first one and so on up to the last terrace of the plot.
If a forgotten tree is added during the sampling it is assigned the next number. If it appears that a numbered tree is outside the plot its number is removed from the list.
Procedure in case of numerous trees: If there are more than 20 trees on a rectangular plot all the trees are numbered as prescribed but only a fraction of them are measured according to the following rules.
Number of trees Rule Measured trees 20 to 25 each fifth tree is omitted 1, 2, 3, 4, 6, 7, 8, 9, 11, 12, 13, 14, 16, 17, … 26 to 30 each third tree is omitted 1, 2, 4, 5, 7, 8, 10, 11, 13, 14, 16, 17, 18, … 31 to 40 each second tree is omitted 1, 3, 5, 7, 9, 11, 13, 15, 17, 19, 21, 23, 25, … 41 to 60 each third tree is measured 1, 4, 7, 10, 13, 16, 19, 22, 25, 28, 31, 34, … 61 to 80 each fourth tree is measured 1, 5, 9, 13, 17, 21, 25, 29, 33, 37, 41, 45, … 81 to 100 each fifth tree is measured 1, 6, 11, 16, 21, 26, 31, 36, 41, 46, 51, 56, …
In all cases, the number 1 tree is measured and the rule is applied along the natural order. Only the measured trees are entered on the tree form.
If it seems that the number of trees on a 500-square-m circular plot exceeds 20, trees are numbered clockwise starting from the one which is nearest to the sampling point and in the order given by their distance to the sampling point. The numbering stops when the first one of those two limits is reached: either a distance of 12.62 m from the sampling point or the 20th tree. In the latter case the distance between the sampling point and the opposite point of the 20th tree section at breast height level is measured. It is recorded as the plot radius (§ 4.5). Distance measurements must be adjusted for the slope of the ground and corrected to horizontal distances.
Tree form field: 3.
5.2. Diameter at 1.3-m Height Definition: The diameter at 1.3-m height of a tree is given by the distance between two tangents to the perimeter of the tree, along a section perpendicular to the stem axis. It is measured at 1.3 m above the ground.
Use: The diameter at 1.3-m height is used to evaluate the volume of the wood burnt by the fire. It can also be used to break down various fire characteristics.
The diameter at 1.3-m height is also used to choose trees on which other observations or measurements are made or to classify them into the regeneration set.

ForFireS Field guide
25
Figure 10a-e: Determining measurement place and modes of the diameter at 1.3-m height
a) Measuring a straight tree on a flat ground or a gentle slope under 10° b) Measuring a straight tree on a slope steeper than 10° c) Measuring on a slope when there is at the foot of the tree a pile of dead wood or a heap of leaves and
needles d) Measuring a tree with bare roots on a boulder e) Measuring a tree with bare roots on a stock
Figure 11f-i: Determining measurement place and modes of the diameter at 1.3-m height
f) Measuring an inclined straight tree g) Measuring a tree with a hump at the theoretical measurement place – if a > 10 cm – two measurements h) Measuring a forked tree, if the division is lower than 1.3 m above ground both trees have to be measured i) Measuring a tree forked higher than 1.3 m above ground and when it is not possible to measure both stems
separately

ForFireS Field guide
26
Figure 12A, B, C: Determining measurement place on trees damaged in the area around 1.3 m above ground
Determination method: The diameter measurement place is located 1.3 m above the ground. A pole or stick is used to mark this height. When marking, the ground surface at the foot of the tree must be carefully examined and all obstacles must be removed if possible (see Figure 10.c). For measuring diameters a calliper or a perimeter tape are used. If a calliper is used, the entered diameter is given by the mean value of two measurements taken at 1.3 m above the ground. The first measurement is taken in the north-south direction and the second one perpendicularly to the first one in the west-east direction at the same height – perpendicularly to the stem axis.
If there are on the plot trees whose diameters exceed the calliper capacity they must be measured with a perimeter tape. While measuring it must be taken care that the perimeter tape is everywhere 1.3 m above the ground and well tight.
When measuring the diameter at 1.3-m height the calliper must be put at the measurement place so that it is perpendicular to the stem length axis. In the same way the perimeter tape must be applied to the stem so that it is in a plane (on inclined trees, in a plane perpendicular to the stem axis). The calliper arms must be squeezed with a constant pressure which must be released when the movable arm meets the first resistance on the tree bark.
1. Measuring in the north-south direction 2. Measuring in the west-east direction Figure 13: Procedure for measuring the diameter at 1.3-m height
Procedure for deciding where to put the instrument when measuring the diameter of damaged trees: A) Tree damaged exactly at a 1.3-m height above the ground (Figure 12.A).
The measurement place must be moved at most 10 cm upward or downward (1.2 to 1.4 m).

ForFireS Field guide
27
B) It’s impossible to put the instrument within an interval between 1.2 – 1.4 m above the ground (Figure 11.g, Figure 12.B).
Two measurements are carried out at equal distances upward and downward from the 1.3-m level in order to avoid the defect. The mean value is computed.
C) It is impossible to choose a measurement place lower than 2 m above the ground (Figure 12.C). The measurement is carried out somewhere on the tree stem (if it can’t be done otherwise, even at the defect place).
Procedure for measuring forked trees: On forked trees each stem is measured independently, either with a calliper if it is possible or with a
perimeter tape (Figure 11.h). It the tree forking does not allow either of them, then the tree is not considered as forked, but as only one stem (divide – Figure 11.i).
On standing dry trees the diameter at breast height is measured; the mean value of the bark thickness (multiplied by two) must be added, if the bark has fallen from the tree.
Broken and partially uprooted trees: If a tree is broken above a 1.3-m height, its diameter at breast height is measured. If a tree is broken at a height lower than 1.3 m above ground, no measurement is taken. However if
the upper part of the stem is still bound to the stump or lies in the vicinity and if the level which would match 1.3 m above ground for the whole tree can be precisely determined, the diameter at this level is measured.
If a tree is partially uprooted, its diameter is measured at a 1.3-m height from the level that would correspond to the one of a standing tree.
The diameter is recorded in whole centimetres.
Tree form field: 4.
5.3. Species Definition: Designation of the species or group of species the tree belongs to, represented by a numerical code.
Use: Tree species determination. It can also be used for various breakdowns.
Determination method: The species is determined according to the physical characteristics of the tree or of elements which might have fallen on the ground (leaves, seeds, cones). The codes of the following table are used.
Code Species or Species group
100 Quercus with deciduous leaves
200 Quercus ilex
300 Quercus suber
400 Fagus sylvatica
500 Castanea sativa
600 Betula sp.
700 Fraxinus sp.
800 Populus sp.
900 Eucalyptus sp.
1000 Other broad-leaved (likely to reach a 5-m height)
1100 Pinus pinaster
1200 Pinus sylvestris

ForFireS Field guide
28
Code Species or Species group
1300 Pinus nigra
1400 Pinus pinea
1500 Pinus halepensis
1600 Abies sp.
1700 Picea sp.
1800 Cedrus sp.
1900 Pinus canariensis
2000 Other coniferous (likely to reach a 5-m height) Tree form field: 5.
5.4. Total Height Definition: Vertical distance between the horizontal plane passing through the highest point of the tree and the horizontal plane passing through the tree stump. See Figure 14.
Figure 14 : Total height of a tree
Use: The total tree height is used to evaluate the volume of the wood burnt by the fire. It can also be used to break down various fire characteristics.
Determination method: The total height of the tree is measured with a hypsometer, from a place in the stand where the base and the top of the tree can be seen from a distance at least equal to the tree height. On slopes the measurement must be done as far as possible while standing at the same level as the tree base. Especially on broad-leaved trees one must be careful to aim at the point where the horizontal plane is tangent to the curve which envelops the crown. When the tree is inclined, all precautions must be taken so that the measured height is actually the vertical distance from the ground to the highest point of the tree. See Figure 15.

ForFireS Field guide
29
Figure 15 : Measuring the height of an inclined tree
Trees broken beneath the crown: If a tree is broken beneath the crown, its height is not measured. The conventional value “999” is
recorded.
The tree height is recorded in whole decimetres.
Tree form field: 6.
5.5. Vegetation State Definition: Characterisation of the fact that the tree is alive or dead.
Use: The vegetation state is used to evaluate the volume of the wood burnt by the fire. It is also used to assess the probability of survival of the whole stand.
Determination method: The vegetation state is determined by observing visually the tree. In case of doubt the bark of a twig can be cut to check whether it is completely dry. To be considered as dead a tree must show no sign of life above 1.3 m. If living branches exist below 1.3 m they are independent stems and taken or not into account according to their diameter at 1.3-m height. The following codes are used.
Code Vegetation state
100 Living tree
200 Dead tree Tree form field: 7.
5.6. Social Status in the Stand Definition: Expresses the state of the tree according to its position in the different stand storeys.
Use: The social status in the stand is used to break down various fire characteristics.
Determination method: The social status in the stand is chosen among the following modes according to what can be observed.

ForFireS Field guide
30
Code Social Status in the Stand
100 Stand main storey: A tree which belongs to the stand storey where the main economic production takes place (seed bearer, main stand).
200 Stand secondary storey: A tree which grows under shelter of the main stand or in a storey of quite different age or size. It belongs generally to the regeneration or to an undergrowth of importance for soil protection or shaping the stems in the main stand.
300 Hold-over: A tree which has been left from a previous stand, above the present main stand. It is an isolated stem.
Tree form field: 8.
5.7. Height of Charred Stem Definition: Length of the highest char mark found on the tree.
Use: The height of charred stem is used to evaluate the volume of the wood burnt by the fire.
Determination method: The height of charred stem is measured with a graduated tape if it is possible, or with a hypsometer (see § 5.4) in the contrary.
Trees broken beneath the crown: If a tree is broken beneath the crown, the charred height is measured on the stump.
The height of charred stem is recorded in whole decimetres.
Tree form field: 9.
5.8. Rate of Burnt Crown Definition: Relative part of the crown that has been killed by the fire.
Use: The rate of burnt crown is used to assess the probability of survival of the whole stand.
Determination method: The rate of burnt crown is evaluated by visually observing the tree. The charred foliage that might still stay on the tree is included in the destroyed part.
The rate of burnt crown is entered in percent to the nearest 10 percent.
Tree form field: 10.
5.9. Stem Destruction Rate Definition: Relative part of the stem wood volume that the fire has rendered improper to any use.
Use: The stem destruction rate is used to evaluate the volume of the wood burnt by the fire.
Determination method: The stem destruction rate is evaluated by visually observing the tree. Presence of adhering bark is usually a sign that the underlying wood is not damaged. Three destruction rate classes are distinguished.
Code Stem Destruction Rate
100 Less than one third of the stem wood is destroyed.
200 One third to two thirds of the stem wood is destroyed.
300 More than two thirds of the stem wood is destroyed.
ForFireS Field guide
31
Tree form field: 11.
6. Regeneration Related Data Under regeneration is meant the set of trees with a height above 10 cm and, if they reach a 1.3-m height, with a diameter at breast height lesser than 7 cm, whatever their age.
This set is divided into subsets defined by a species or a group of species.
In every one of those subsets the number or individuals on the subplot, circular (§ 3.2) or rectangular (§ 3.3), of the sampling device is tallied.
6.1. Species Definition: Designation of the species or group of species the seedling belongs to, represented by a numerical code.
Use: Regeneration species determination.
Determination method: The species is determined according to the physical characteristics of the seedling. The codes of section 5.3 are used.
Regeneration form field: 3.
6.2. Number Class of Stems in Each Species Definition: Number of seedlings of the same species or group of species on the subplot used for regeneration assessment.
Use: Assessment of the regeneration importance.
Determination method: Seedlings are tallied on the regeneration subplot. Seedlings on the border of the subplot are taken into account if their collars are inside the subplot. Double and chopped stems are considered as one individual. All shots sprouting from old stocks are tallied, except if they are themselves double or have been chopped after their sprouting, in which case the rule given above is applied. The tally is converted into classes.
Code Number Class
100 1 stem.
200 2 or 3 stems.
300 4 or 5 stems.
400 6 or 7 stems.
500 8 stems or more. Regeneration form field: 4.

ForFireS Field guide
32
7. Annexes
7.1. Equipment GPS receiver Compass Graduated tape for measuring distances (at least 20 m) Pole (1.5 m or 2 m) Machete, clearing knife Pruning saw Drawing-pins or stapler Reusable numbered tags Clinometer Forest calliper Graduated tape for measuring diameters Hypsometer (Vertex, Blume-Leiss, Suunto) Forest flora Sampling forms Clipboard Pencils, eraser
7.2. Forms

ForFireS Plot Form
Identification Field 1 Fire Number Field 2 Plot Number Carrying out Field 3 Date _ _ _ _/_ _/_ _ Field 4 Crew leader Field 5 Plot Shape Location Field 6 Latitude WGS84 Field 7 Longitude WGS84 Field 8 Abscissa X Field 9 Ordinate Y Field 10 GPS Accuracy m Carrying out conditions Field 11 Plot Cover Before Fire Field 12 Burnt – Not burnt Plot Topography Field 13 Point Elevation m Field 14 Slope ° Field 15 Aspect ° Field 16 Relief Type Field 17 Slope Shape Erosion Field 18 Erosion Type Field 19 Erosion Severity Field 20 Erosion Aggravation Field 21 Rock Alteration
Tree Field 22 Living Tree Cover Rate Before Fire % Field 23 Living Tree Cover Rate After Fire % Field 24 Upper Dominant Tree Species Field 25 Lower Dominant Tree Species Shrub Field 26 Living Shrub Cover Rate Before Fire % Field 27 Living Shrub Cover Rate After Fire % Field 28 Shrub Height Before Fire dm Field 29 Shrub Height After Fire dm Ligneous Field 30 Living Ligneous Cover Rate Before Fire % Field 31 Living Ligneous Cover Rate After Fire % V
eget
atio
n
Herbaceous Field 32 Herbaceous Cover Rate %
Salvage Field 33 Salvage Logging Stock Rate % Logging Field 34 Number of Burnt Stems non logged
Write any comment on the backside
Tree form: YES NO
Regeneration form: YES NO

ForFireS Tree Form
Identification Field 1 Fire Number Field 2 Plot Number
Field 3 Field 4 Field 5 Field 6 Field 7 Field 8 Field 9 Field 10 Field 11 Number Diameter at
breast height (cm)
Species Total height (dm)
Vegetation state
Social status in the stand
Height of charred stem
(dm)
Rate of burnt crown (%)
Stem destruction rate
Write any comment on the backside

ForFireS Regeneration Form
Identification Field 1 Fire Number Field 2 Plot Number
Field 3 Species
Field 4 Tally Class
Write any comment on the backside

ForFireS Field Guide
36
7.3. Cheat Sheets

ForFireS Field Guide
37
ForFireS Plot Data Cheat Sheet
Plot cover before the fire (Field 11) Code Plot cover 100 Forest 200 Shrubland 300 Agricultural land 400 Urbanised land 500 Unreachable point
Plot shape (Field 5) Code Plot shape 100 Circular plot 200 Rectangular plot 300 No plot installed (Radius) Circular plot, radius < 12.62 cm, value in whole centimetres
Burnt – not burnt indicator (Field 12) Code Indicator 100 Burnt 200 Not burnt
Relief type (Field 16) Code Relief type 100 Flat land 200 Slope or comb bottom 300 Slope middle 400 Hilltop, slope top 500 Other
Slope shape (Field 17) Code Slope shape 100 Straight 200 Concave 300 Convex 400 Terraces 500 Various 600 Flat ground
Erosion type (Field 18) Code Erosion type 100 Water erosion, gully 200 Water erosion, sheet 300 Wind erosion 400 Other (landslip) 500 No erosion
Erosion severity (Field 19) Code Erosion severity 100 Low 200 Moderate 300 High 400 No erosion
Erosion aggravation after fire (Field 20) Code Indicator 100 The erosion has increased 200 The erosion has not increased
Visible alteration of rocks (Field 21) Code Alteration of rocks 100 Splitting 200 Texture change 300 Colour change 400 No alteration
Precision Feature Standard Latitude ±0.000001 degree Longitude ±0.000001 degree Elevation 10 m Slope ±5 degrees Aspect ±5 degrees Cover rate estimates ±1 class Heights ±5 dm
Cover rates Class Cover rate 0 <0.5% 1 0.5% – 1.5% 2 1.5% - 2.5% 3 2.5% - 3.5% 4 3.5% - 4.5% 5 4.5% - 5.5% 6 5.5% - 6.5% 7 6.5% - 7.5% 8 7.5% - 8.5% 9 8.5% - 9.5% 10 9.5% - 15% 20 15% - 25% 30 25% - 35% 40 35% - 45% 50 45% - 55% 60 55% - 65% 70 65% - 75% 80 75% - 85% 90 85% - 95% 100 95% - 100%
Tree species (Fields 24 and 25) Code Species or species group 100 Quercus with deciduous leaves 200 Quercus ilex 300 Quercus suber 400 Fagus sylvatica 500 Castanea sativa 600 Betula sp. 700 Fraxinus sp. 800 Populus sp. 900 Eucalyptus sp. 1000 Other broad-leaved 1100 Pinus pinaster 1200 Pinus sylvestris 1300 Pinus nigra 1400 Pinus pinea 1500 Pinus halepensis 1600 Abies sp. 1700 Picea sp. 1800 Cedrus sp. 1900 Pinus canariensis 2000 Other coniferous
3000 No species

ForFireS Field Guide
38
ForFireS Tree and Regeneration Data Cheat Sheet
Tree and Regeneration Data
Regeneration Data
Tree Data
Tree species (Fields 5 – Tree – and 3 – Regeneration) Code Species or species group 100 Quercus with deciduous leaves 200 Quercus ilex 300 Quercus suber 400 Fagus sylvatica 500 Castanea sativa 600 Betula sp. 700 Fraxinus sp. 800 Populus sp. 900 Eucalyptus sp. 1000 Other broad-leaved 1100 Pinus pinaster 1200 Pinus sylvestris 1300 Pinus nigra 1400 Pinus pinea 1500 Pinus halepensis 1600 Abies sp. 1700 Picea sp. 1800 Cedrus sp. 1900 Pinus canariensis 2000 Other coniferous
Social status (Field 8) Code Social status 100 Stand main storey 200 Stand secondary storey 300 Hold-over
Vegetation state (Field 7) Code Vegetation state 100 Living tree 200 Dead tree
Precision Feature Standard Diameter at breast height ±1 cm Heights ±5 dm Rate of burnt crown ±1 class
Rate of burnt crown (Field 10) Class Rate of burnt crown 0 <5% 10 5% - 15% 20 15% - 25% 30 25% - 35% 40 35% - 45% 50 45% - 55% 60 55% - 65% 70 65% - 75% 80 75% - 85% 90 85% - 95% 100 95% - 100%
Stem destruction rate (Field 11) Code Stem destruction rate 100 Less than one third of the stem wood is destroyed 200 One third to two thirds of the stem wood is destroyed 300 More than two thirds of the stem wood is destroyed
Number class (Field 4) Code Number class 100 1 stem 200 2 or 3 stems 300 4 or 5 stems 400 6 or 7 stems 500 8 stems or more


