112
Field phenotyping for water-limited conditions “Genomic, physiological and breeding approches for enhancing drought resistance in crops
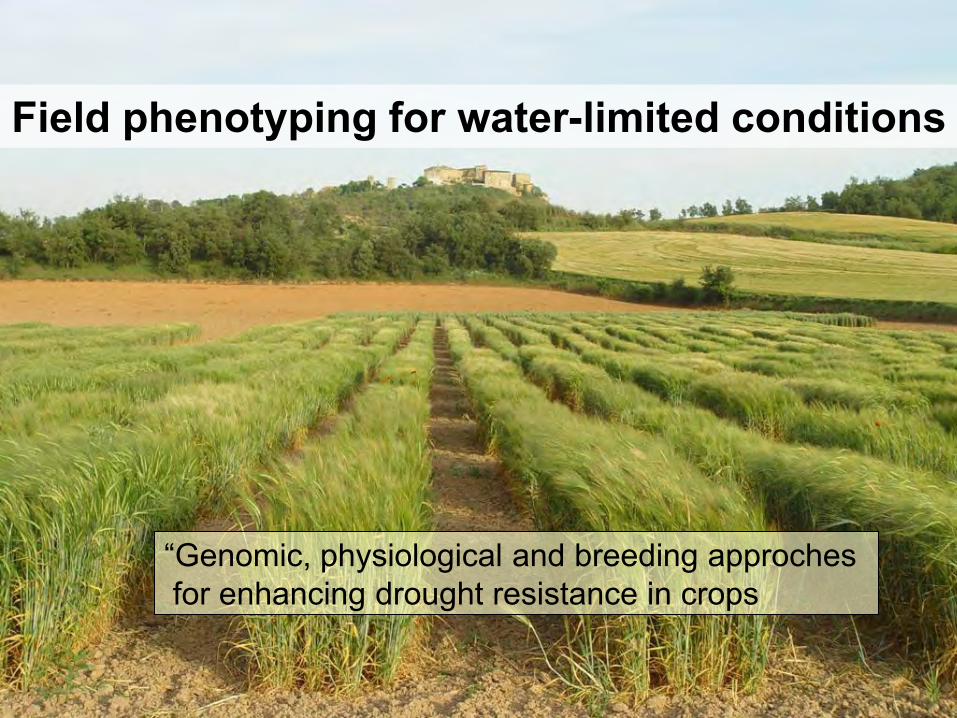
Field phenotyping for water-limited conditions
“Genomic, physiological and breeding approches for enhancing drought resistance in crops
Field phenotyping for water-limited conditions
J.L. Araus, J. Bort, M.D. Serret, J.E. Cairns
Outline
Why field phenotyping?
Some examples of traits and tools
More than just traits and tools
Outline
Why field phenotyping?
Some examples of traits and tools
More than just traits and tools

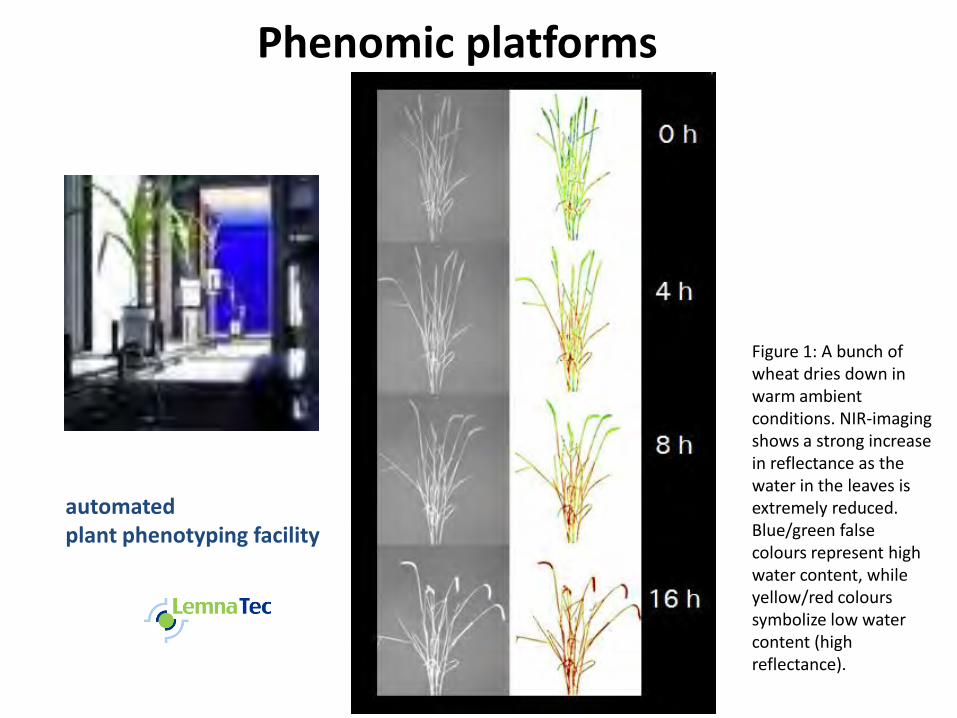
Figure 1: A bunch of wheat dries down in warm ambient conditions. NIR-imaging shows a strong increase in reflectance as the water in the leaves is extremely reduced. Blue/green false colours represent high water content, while yellow/red colours symbolize low water content (high reflectance).
Phenomic platforms
automated plant phenotyping facility
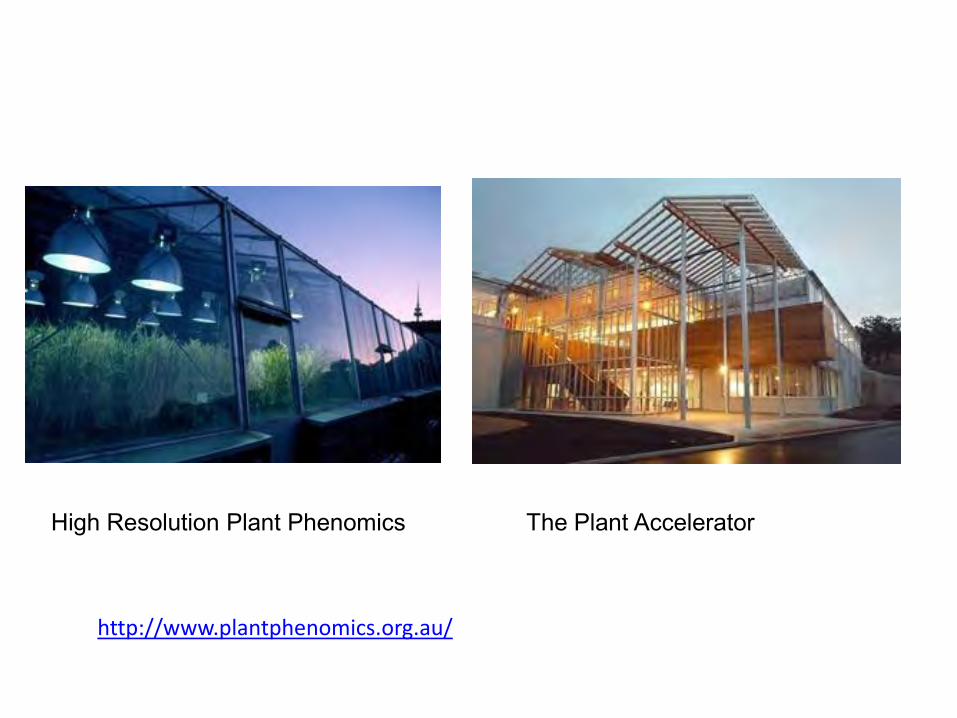
The Plant Accelerator High Resolution Plant Phenomics
http://www.plantphenomics.org.au/
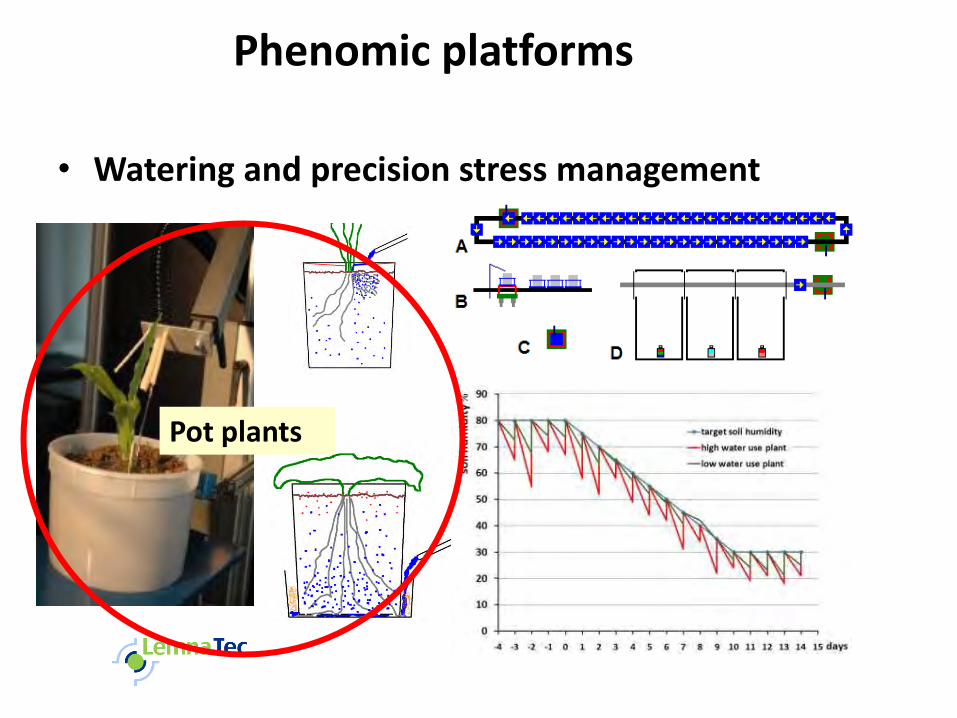
• Watering and precision stress management
Phenomic platforms
Pot plants
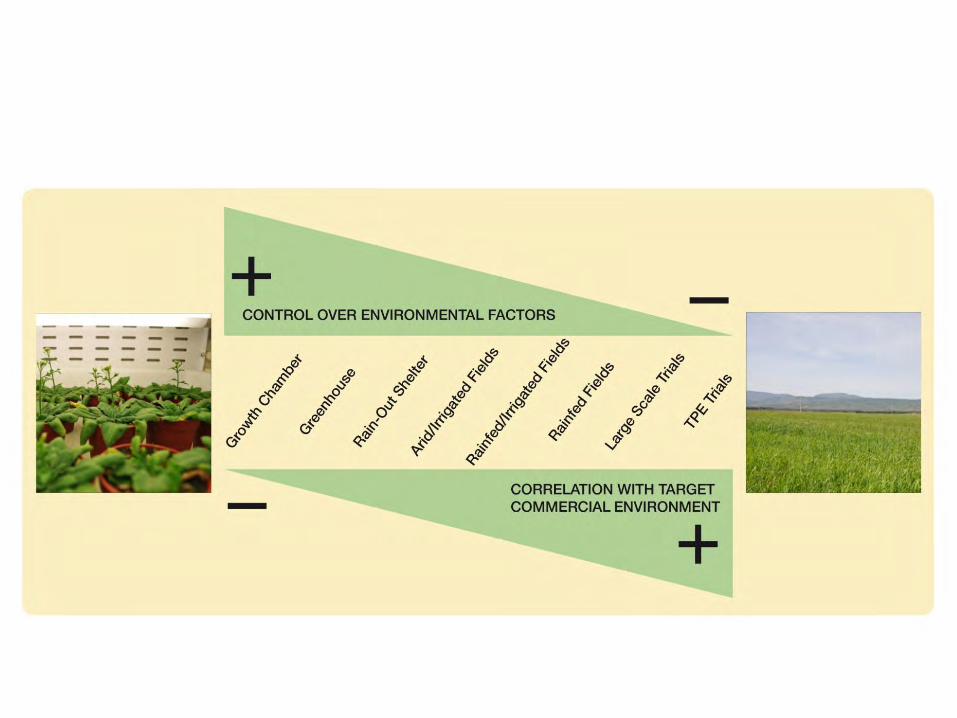

“It’s one thing to use a glasshouse for a trait that is expressed early in development and at the individual plant level, but a lot of traits that we are interested in are expressed at the community scale, which means you have to be working in field plots”
CSA News March 2013

Outline
Why field phenotyping?
Examples of traits and tools
More than just traits and tools

Yield Components
General Determinant
Yield = IR x AR x PE x HI
– IR, Incident Radiation
– AR, Absorbed Radiation
– PE, Photosynthetic Efficiency
– HI, Harvest Index
In Water-limiting Conditions (Passioura 1977)
Yield = W x WUE x HI
– W, Water Used
– WUE, Water Use Efficiency
– HI, Harvest Index
Biomass
Photosynthetic Efficiency
Water use efficiency Water use
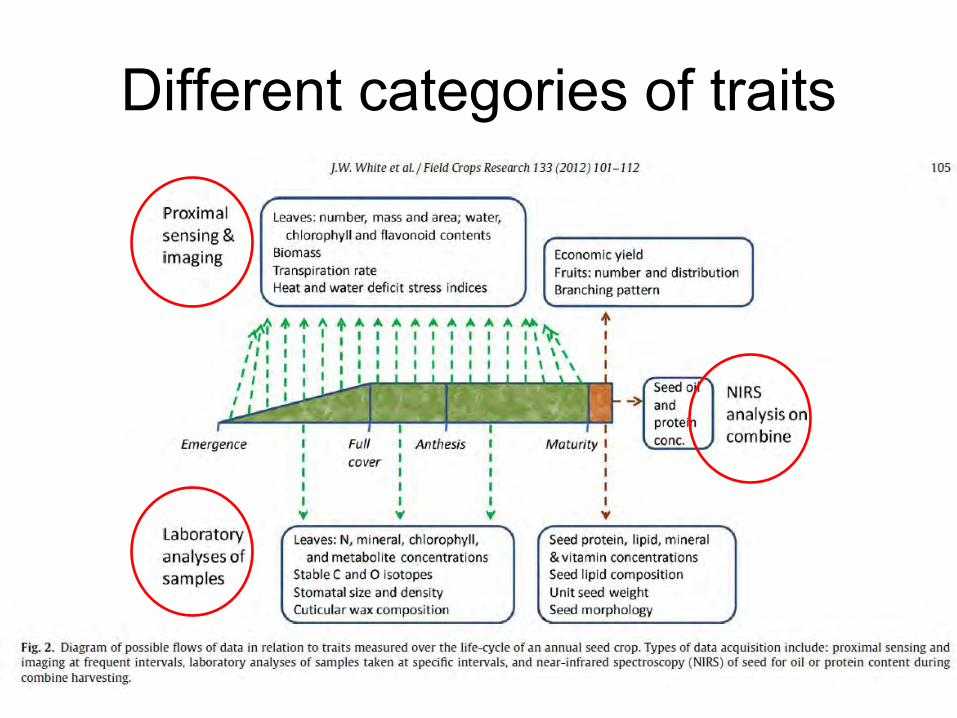
Different categories of traits

Some examples of traits and tools
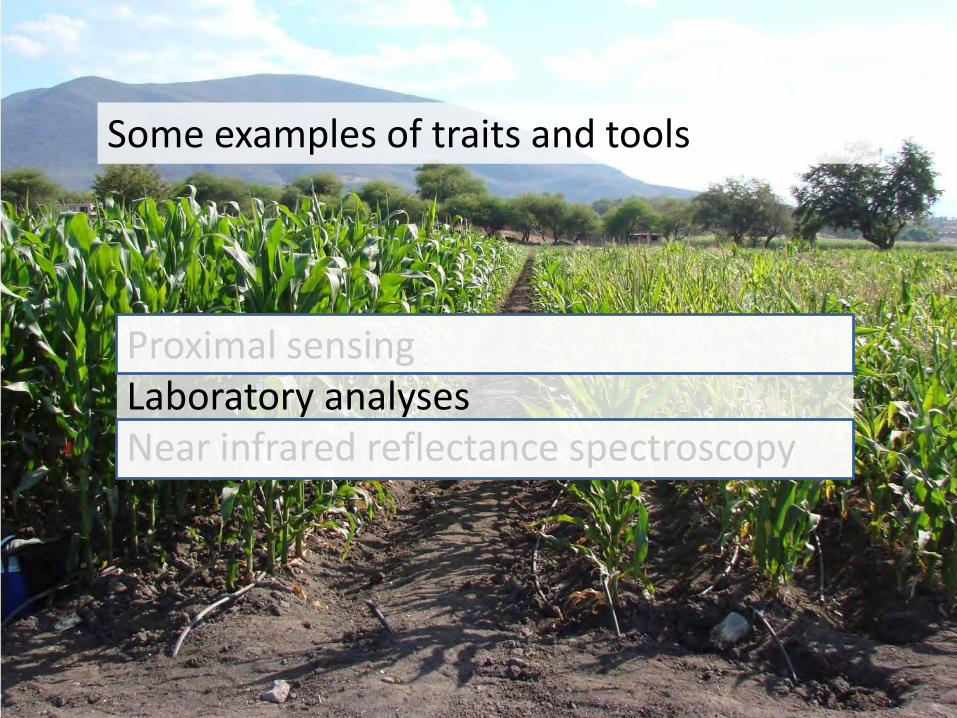
Proximal sensing Laboratory analyses Near infrared reflectance spectroscopy

Some examples of traits and tools
Proximal sensing Laboratory analyses Near infrared reflectance spectroscopy
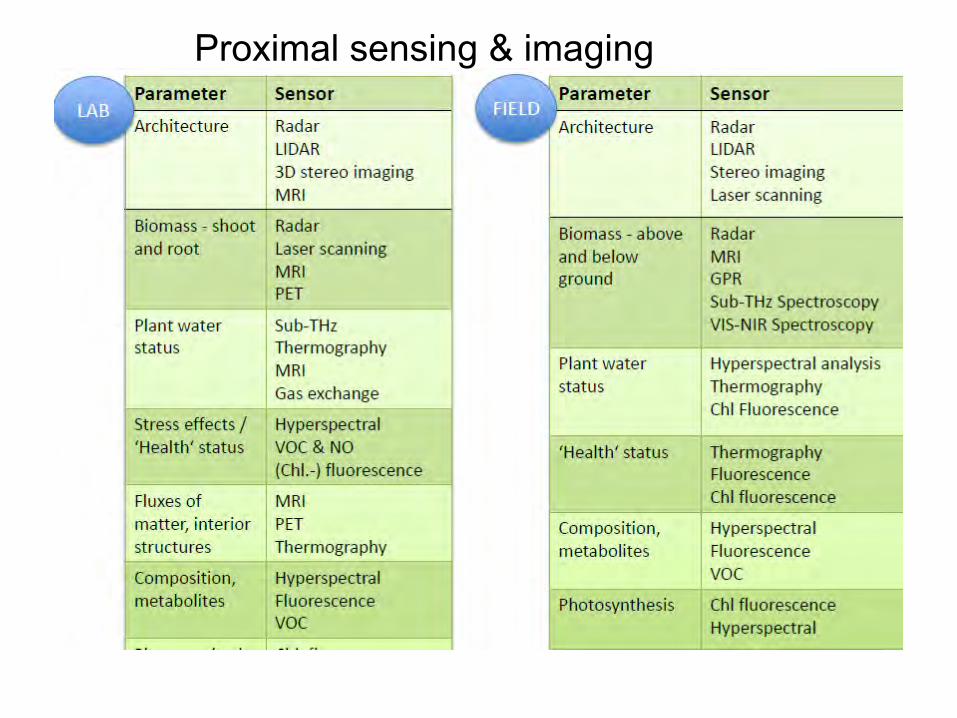
Proximal sensing & imaging
Spectroradiometry

Spectroradiometrical Reflectance Indices
Different levels of assessment: - Canopy - Seedlings - Leaves

Wavelength, nm400 500 600 700 800 900 1000
Ref
lect
ance
0.0
0.2
0.4
0.6
0.8
1.0
Control
N-deficient
Spectroradiometrics and Nitrogen Status

GreenSeeker SPAD

Spectroradiometrical Indices
Some indices for remote sensing of crop status.
Physiological parameter Radiometric Index
NDVIR R
R R
NIR d
NIR red
Re
Leaf area, [Chl],Green Biomass, etc.
SRR
RNIR
red
SAVIR R
R R LL
NIR d
NIR red
Re ( )1
(where L=0.5 for most crops)
Chl degradationNPQI
R R
R R
415 435
415 435
Car/ChlSIPI
R R
R R
800 435
415 435
PRUEPRI
R R
R R
531 570
531 570
Water ContentWI
R
R
900
970

Full-range ( 350 – 2500 nm) Vis/NIR Spectroradiometers

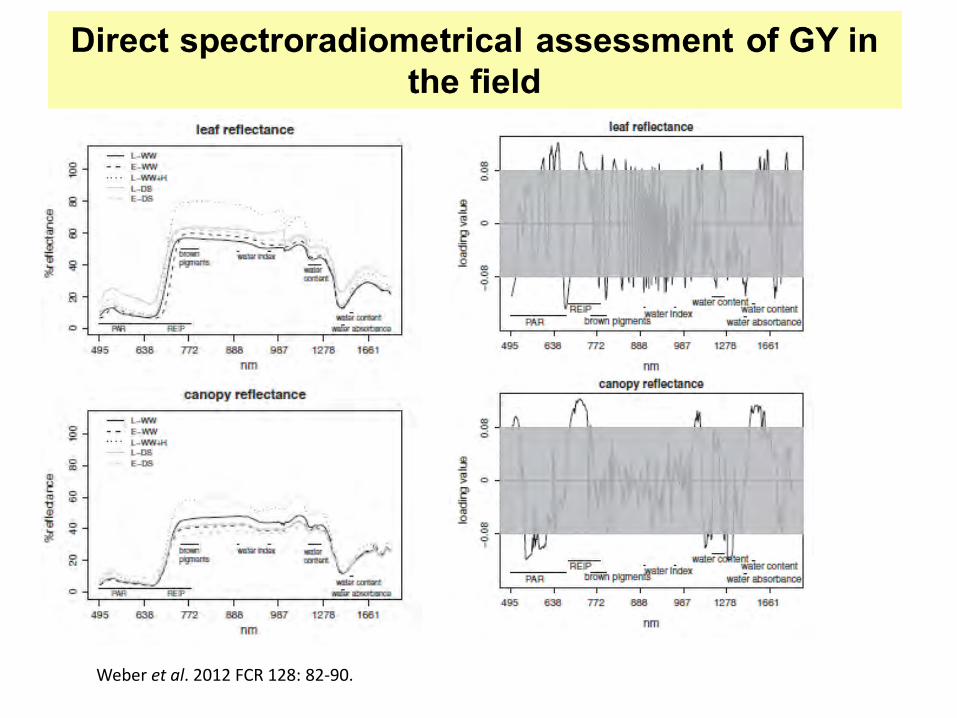
Direct spectroradiometrical assessment of GY in the field
Weber et al. 2012 FCR 128: 82-90.
Weber et al. 2012 FCR 128: 82-90.
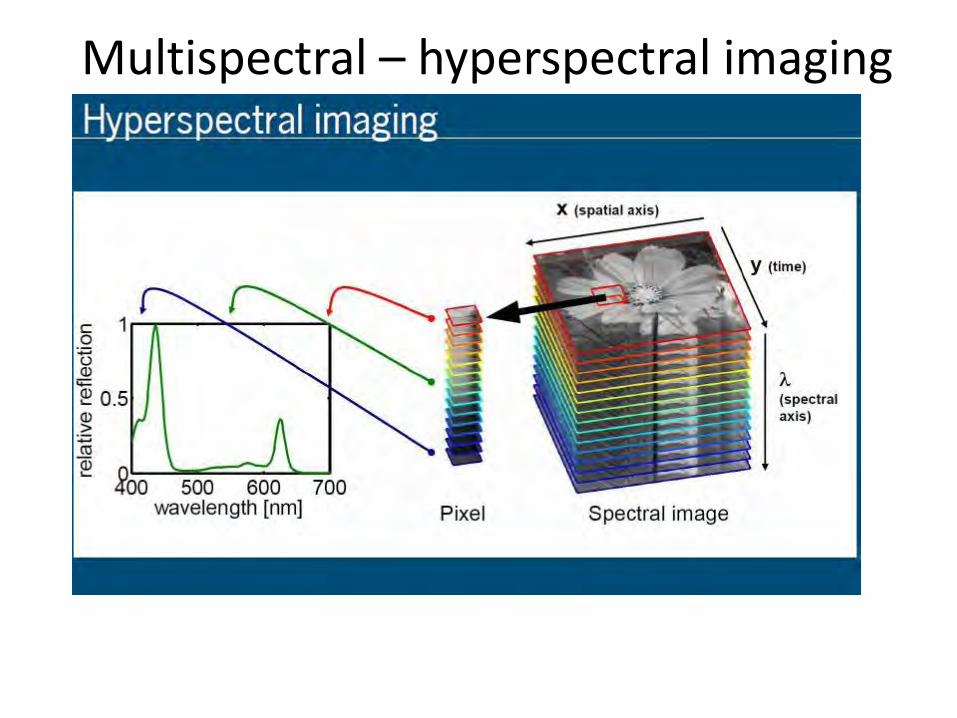
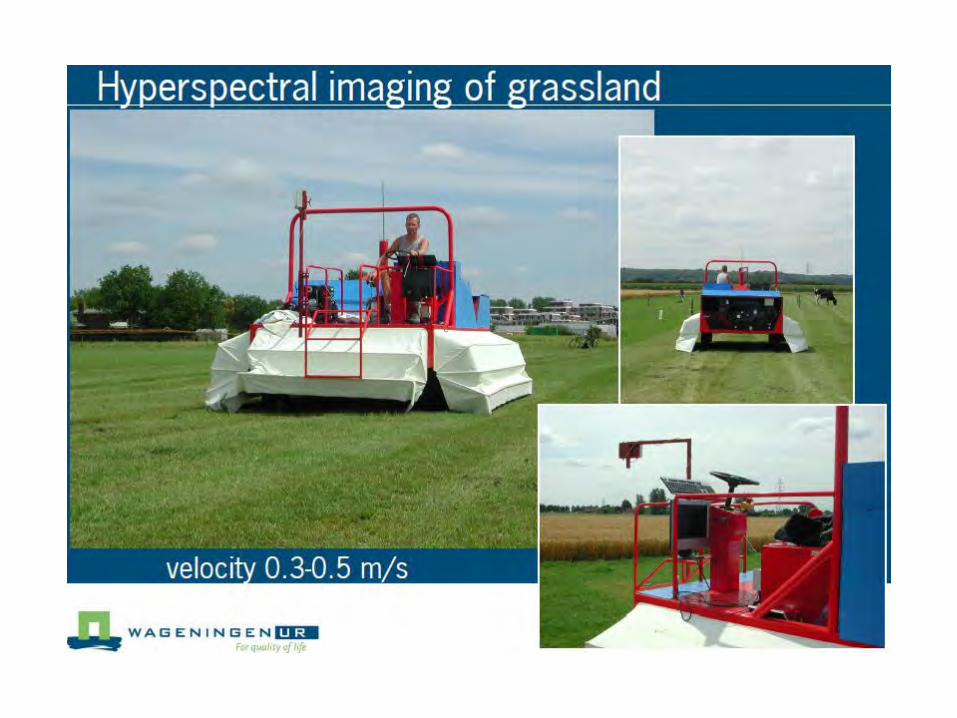
Multispectral – hyperspectral imaging
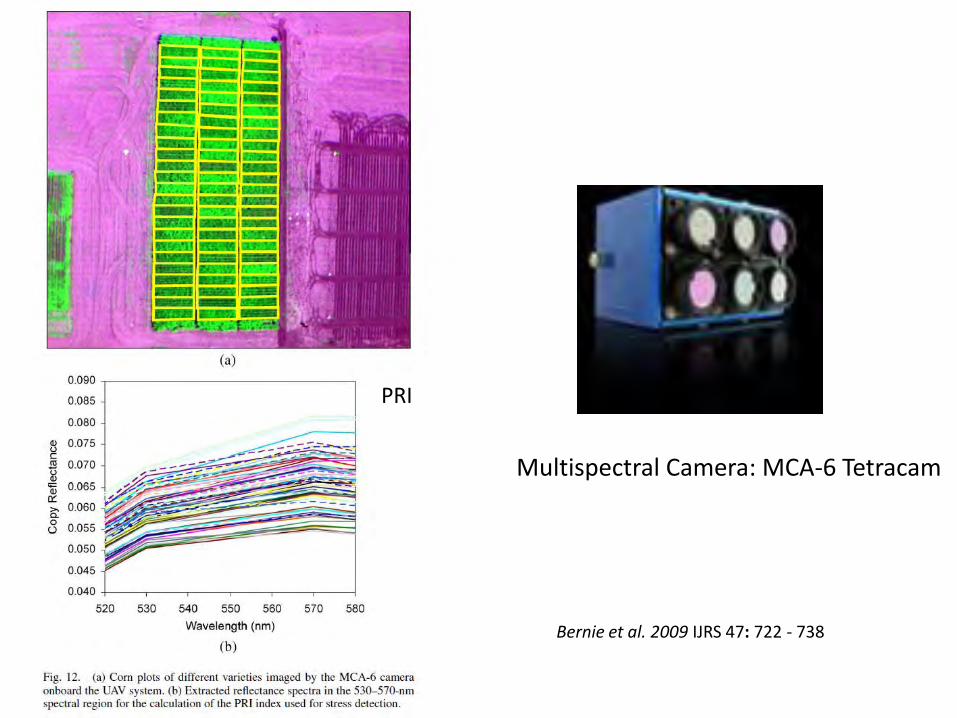
Bernie et al. 2009 IJRS 47: 722 - 738
Multispectral Camera: MCA-6 Tetracam
PRI

Bernie et al. 2009 IJRS 47: 722 - 738
Multispectral Camera: MCA-6 Tetracam

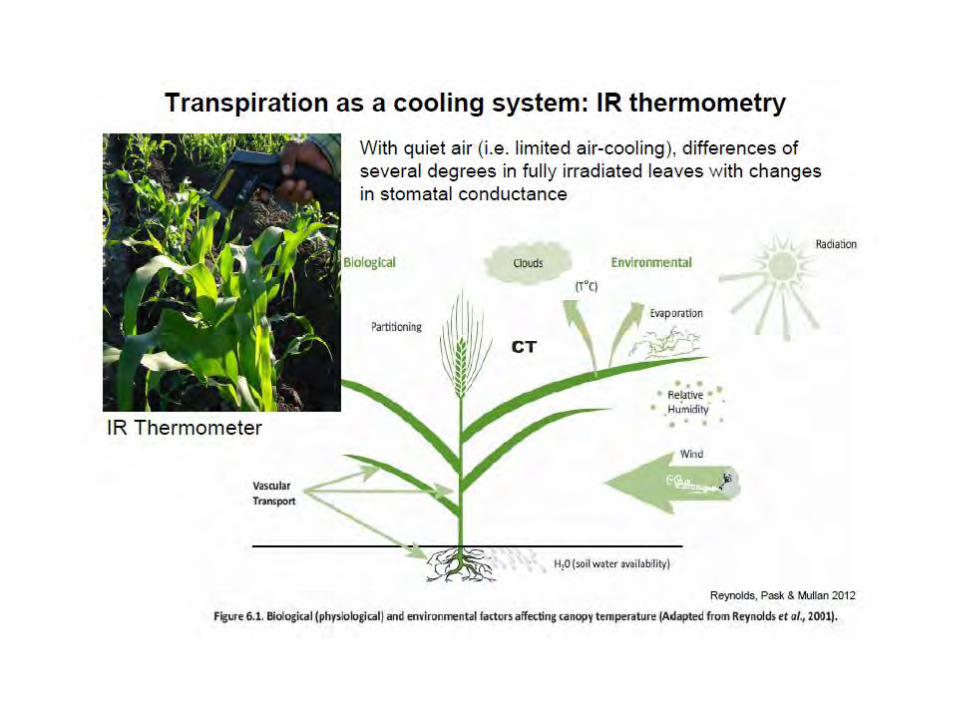
Plant temperature

CTD and Yield
____Correlation of CTD with yield Aerial Hand-held Trial n Phenotypic Genetic Phenotypic Genetic
RILs (Seri82*7C66) 81 0.40** 0.63** 0.50** 0.78**
Advanced lines 58 0.34** - 0.44** -
**statistical significance at 0.01 level of probability - genetic correlations not calculated due to design restrictions
Reynolds et al., 1999
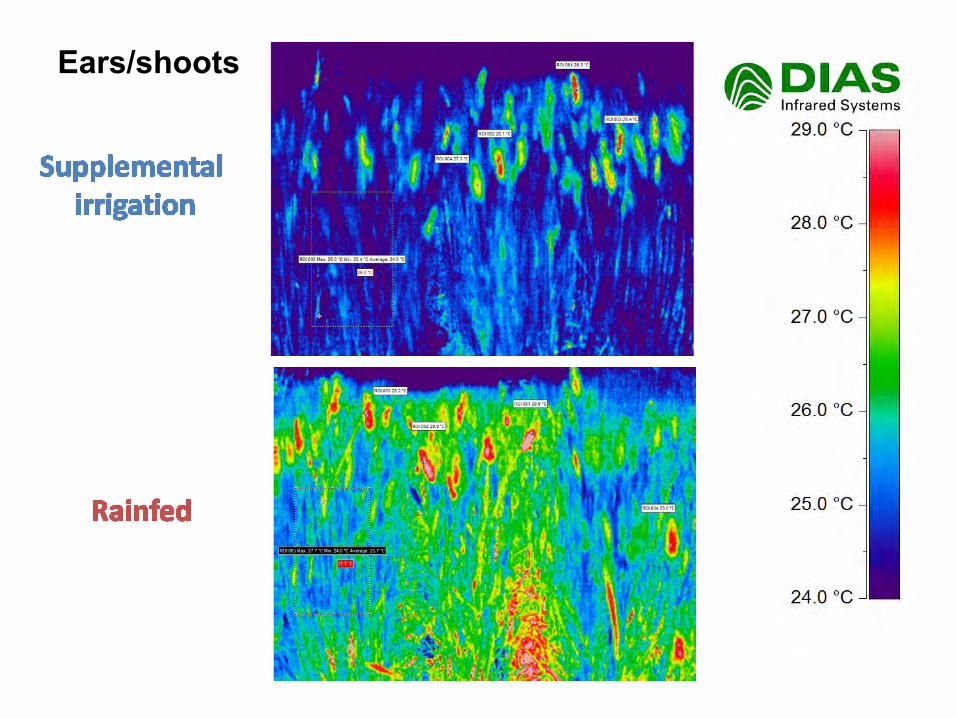
Ears/shoots

Bernie et al. 2009 IJRS 47: 722 - 738

How to implement proximal sensing in practice?


Phenomobiles


Montes et al. 2011. High-throughput non-destructive biomass determination during early plant development in maize under field conditions. Field CropsResearch121: 268–273

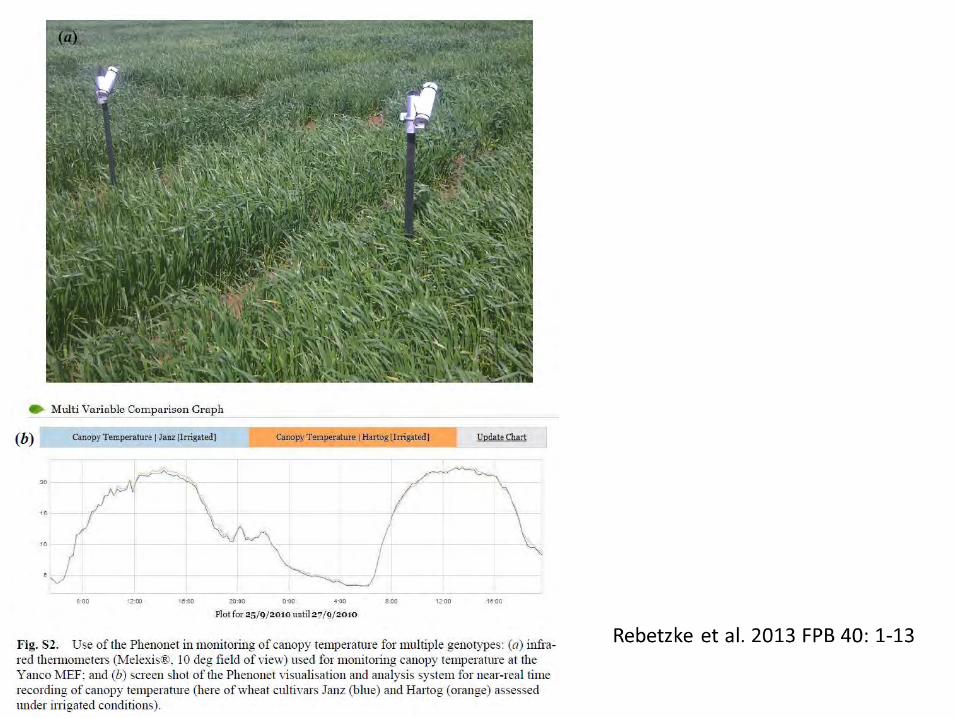
Rebetzke et al. 2013 FPB 40: 1-13
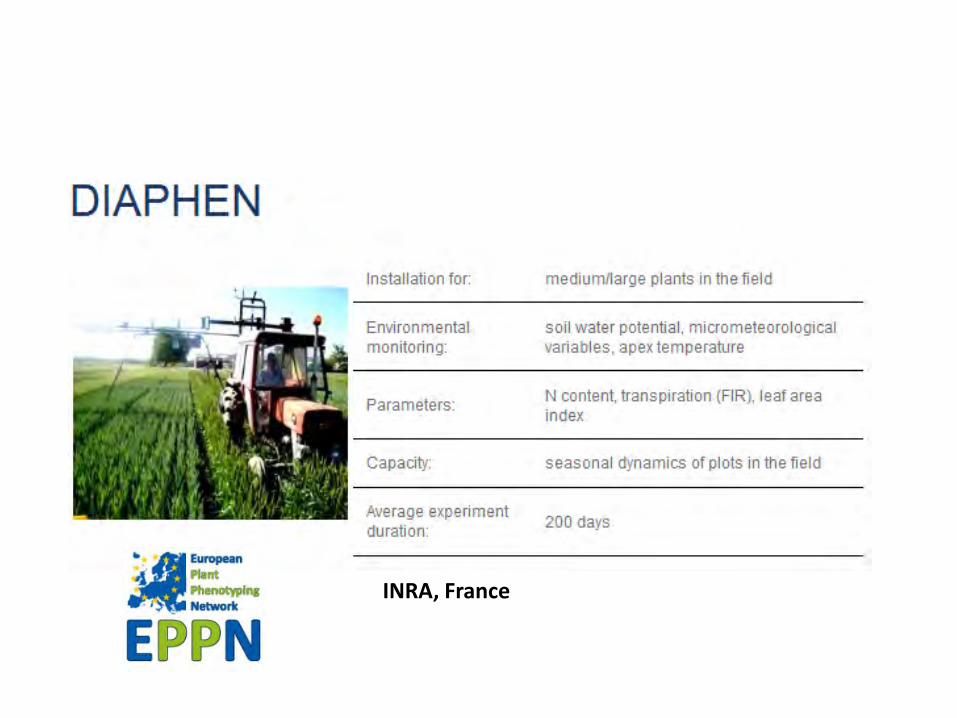
INRA, France

Fig. 1. High-clearance tractor in operation over young cotton plants at Maricopa, AZ. Replicated sets of sensors allow simultaneous measurement of canopy height, temperature, and spectral reflectance at three bandwidths. Real time kinematic GPS provides positional accuracy under 2 cm.
White et al. 2012 FCR 133:101–112

PB
Comar et al. 2012 FPB 39: 914-924

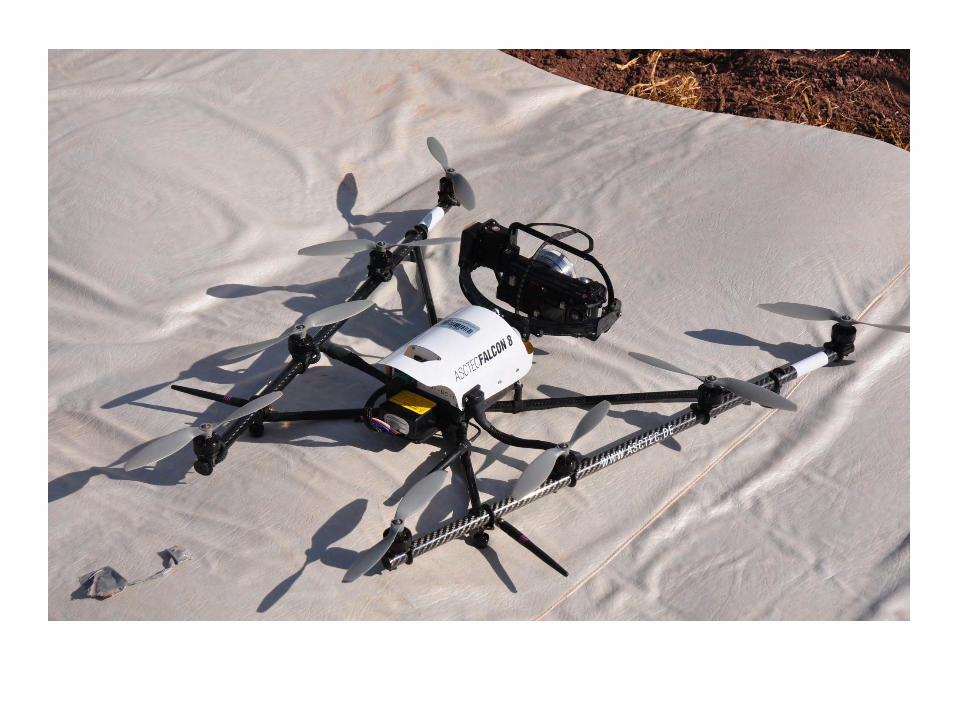
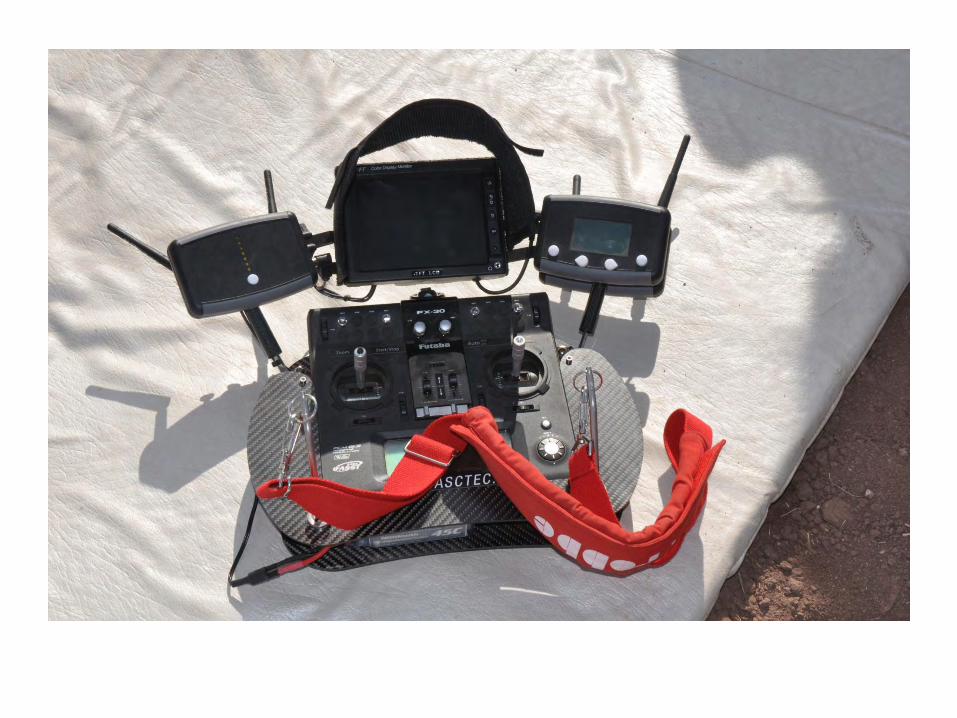
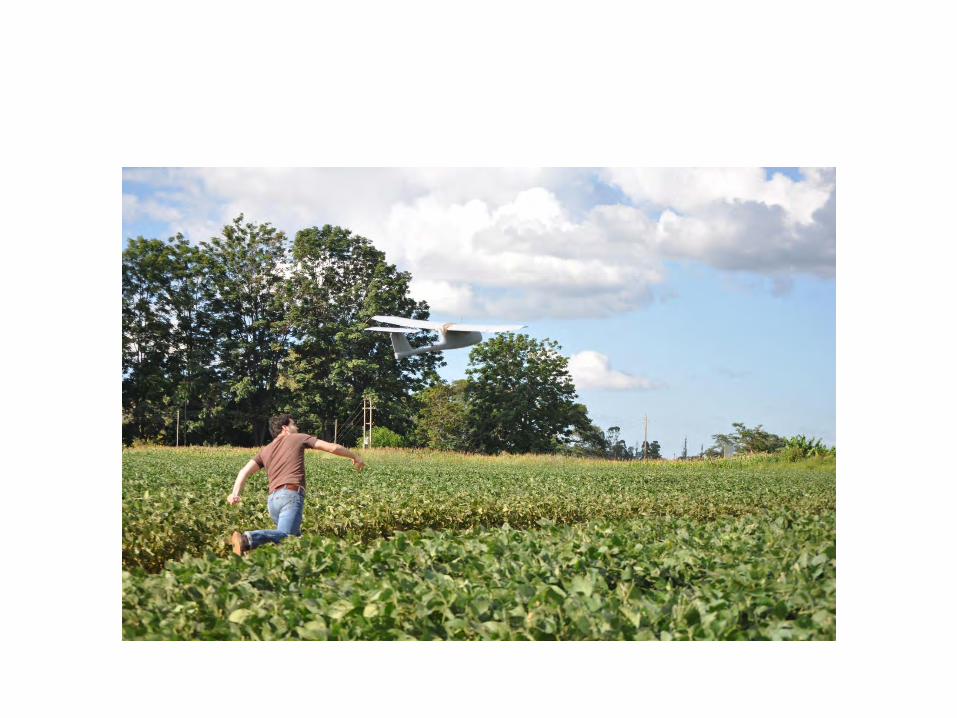
Aerial platforms

Need of an aerial platform


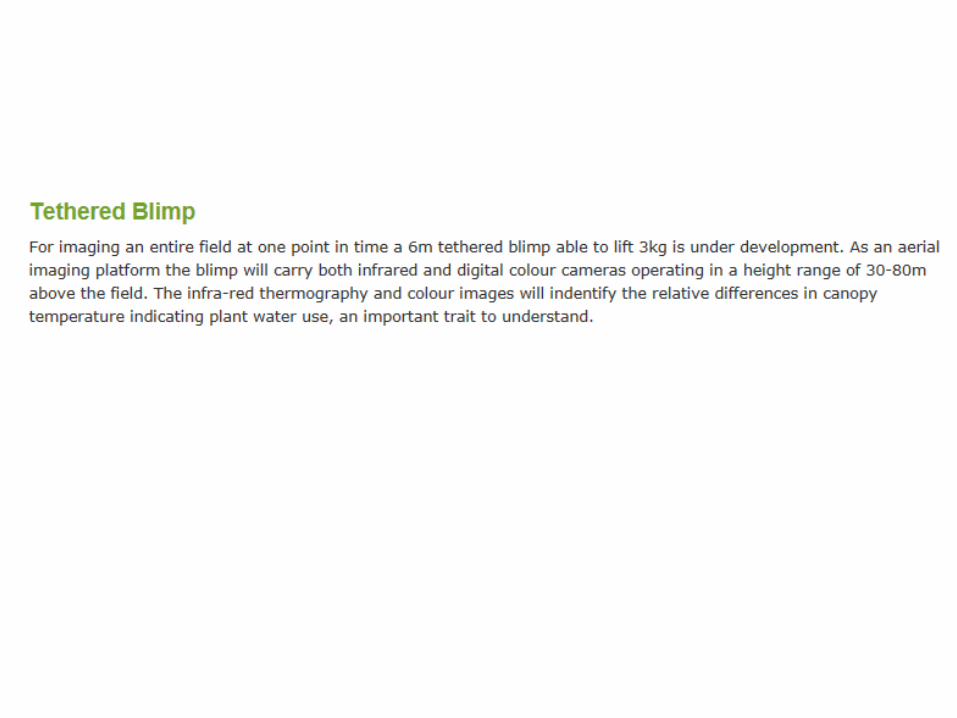


Unmanned aerial vehicles

Unmanned aerial vehicles


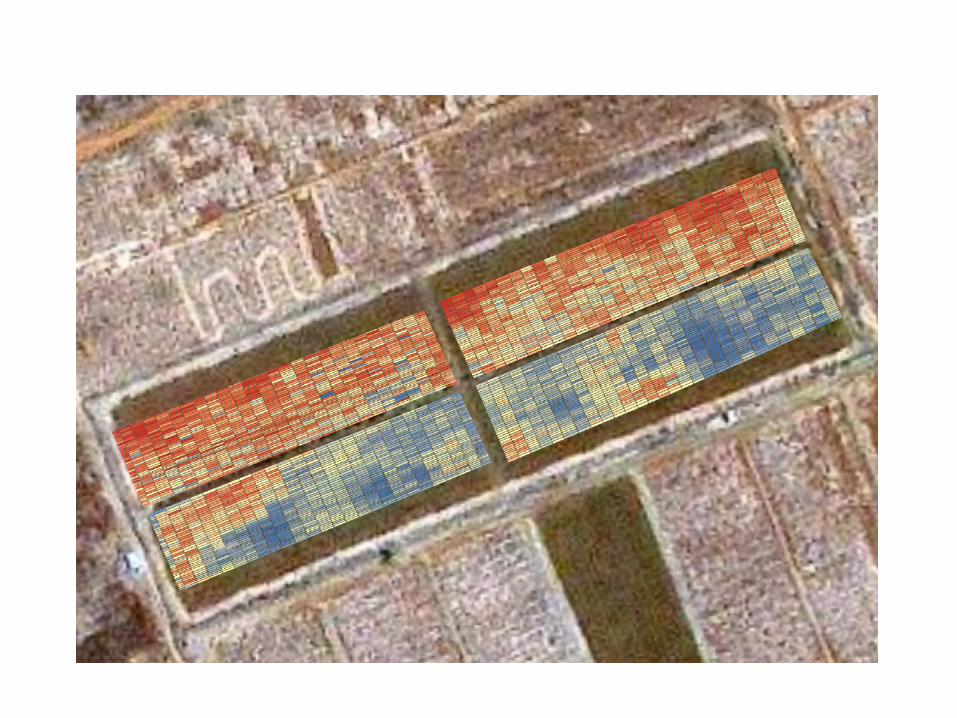
Researchers at CSIRO use a remotecontrolled gas-powered model helicopter called the “phenocopter” to measure plant height, canopy cover, lodging, and temperature throughout a day. Pictured here are Scott Chapman (left), a principal research scientist at CSIRO, and Torsten Merz, developer of the phenocopter.
CSA News March 2013

Plant height data collected by the near-infrared camera on the phenocopter can be used to estimate lodging across plots. Images courtesy of Scott Chapman, CSIRO.

Unmanned aerial vehicle

Miricle 307 KS sealed infrared camera. 640x480
307K – 640x480 detector resolution: 307,200 pixels and 25μm pitch KS


Proximal sensing: Low cost approaches

Canopy senescence – visual score
1 (10%) 3 (30%) 5 (50%) 7 (70%) 9 (90%)
Measurement: - score from 0-10, divide the % of estimated total leaf area that is dead by 10 - initiation & rate of canopy senescence
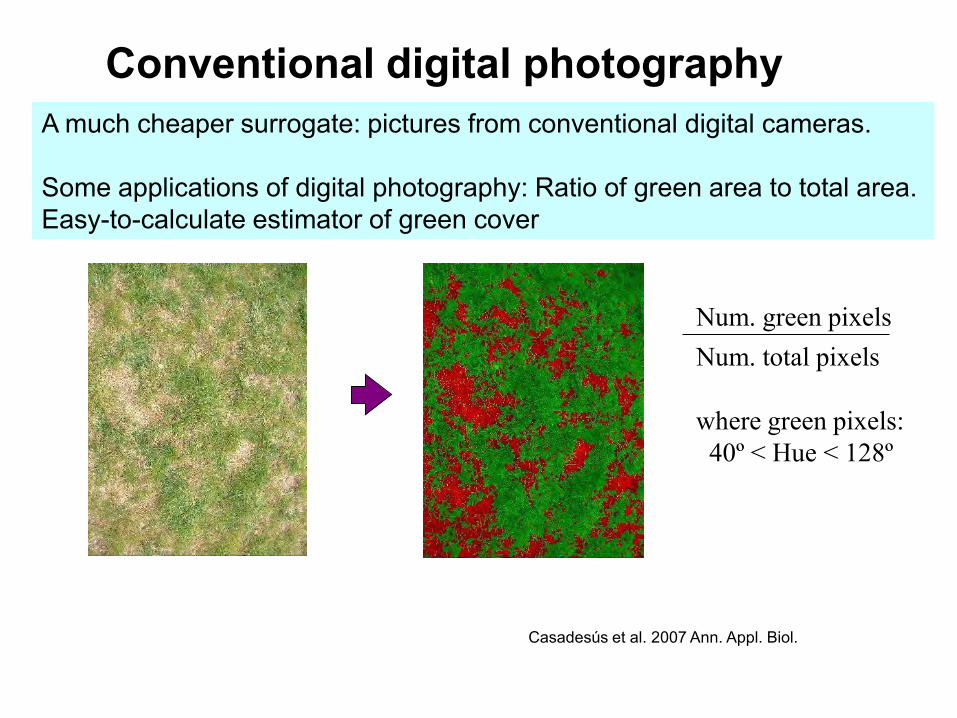
A much cheaper surrogate: pictures from conventional digital cameras. Some applications of digital photography: Ratio of green area to total area. Easy-to-calculate estimator of green cover
where green pixels: 40º < Hue < 128º
Num. green pixels Num. total pixels
Casadesús et al. 2007 Ann. Appl. Biol.
Conventional digital photography
Some examples of traits and tools
Proximal sensing Laboratory analyses Near infrared reflectance spectroscopy

C and O stable isotopes in cereal breeding
12 C 13 C
M. Ribas-Carbó
● Reflects variation in water-use efficiency (WUE)
●Has been proposed as a selection criterion for improved WUE and yield in C3 cereals (few reports in C4 cereals??)
● Can be used in C3 and C4 cereals (independent on A)
● Integrative indicator of genotypic differences in gs and yield
● May help in separating the independent effects of A and gs on Δ13C and then on WUE in C3 cereals

Ways to ameliorate yield in water-limited environments
GY = WU × WUE × HI
The Passioura’s identity (1977)
Capturing more soil water
Economizing water use
(more crop per drop)
Improving partitioning to grains
WU = total water used by the crop
HI = fraction of the total dry matter harvested as yield
Δ18O (Transpiration) Δ13C (C to H2O used) WUE = ability of the crop to produce biomass per unit of water used

‘Drysdale (2002) and Rees (2003) are drought tolerant wheat varieties bred by CSIRO scientists using innovative gene selection criteria. The DELTA technique gives plant breeders the ability to breed varieties of wheat that more efficiently exchange atmospheric carbon dioxide for water during photosynthesis’
Stable Isotopes: 13C & Yield
They were selected for low Δ13C increased WUE as crop mostly grows on storage water which exhausted through the growing season
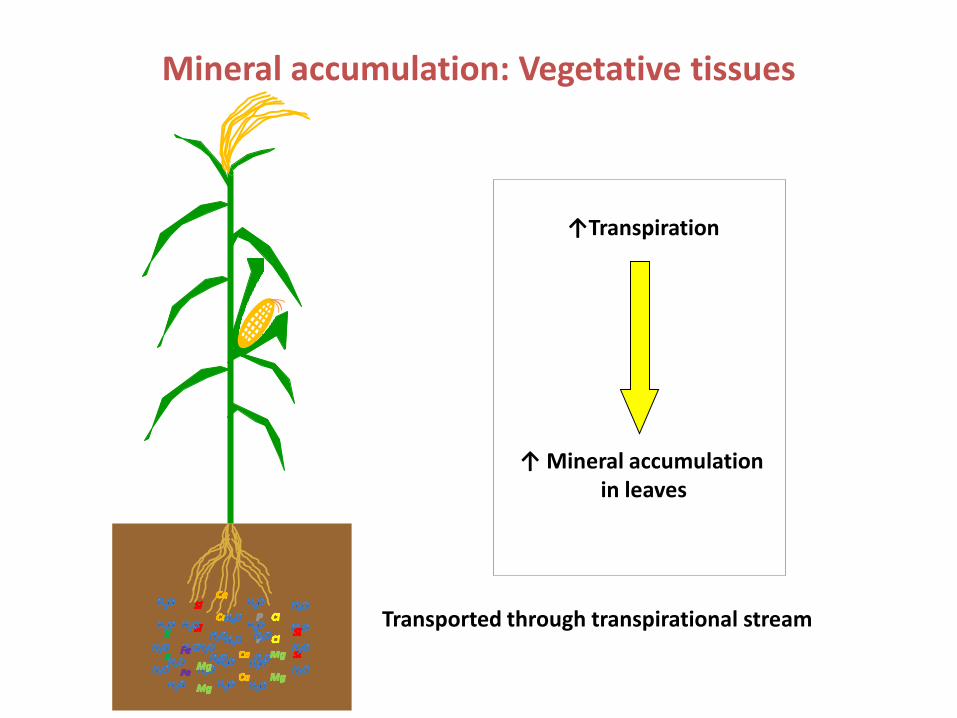
Mineral accumulation: Vegetative tissues
↑Transpiration
↑ Mineral accumulation in leaves
Transported through transpirational stream

13C and Ash vs Yield
Araus et al., 1998 Aust. J. Plant Physiol.

Some examples of traits and tools
Proximal sensing Laboratory analyses Near infrared reflectance spectroscopy
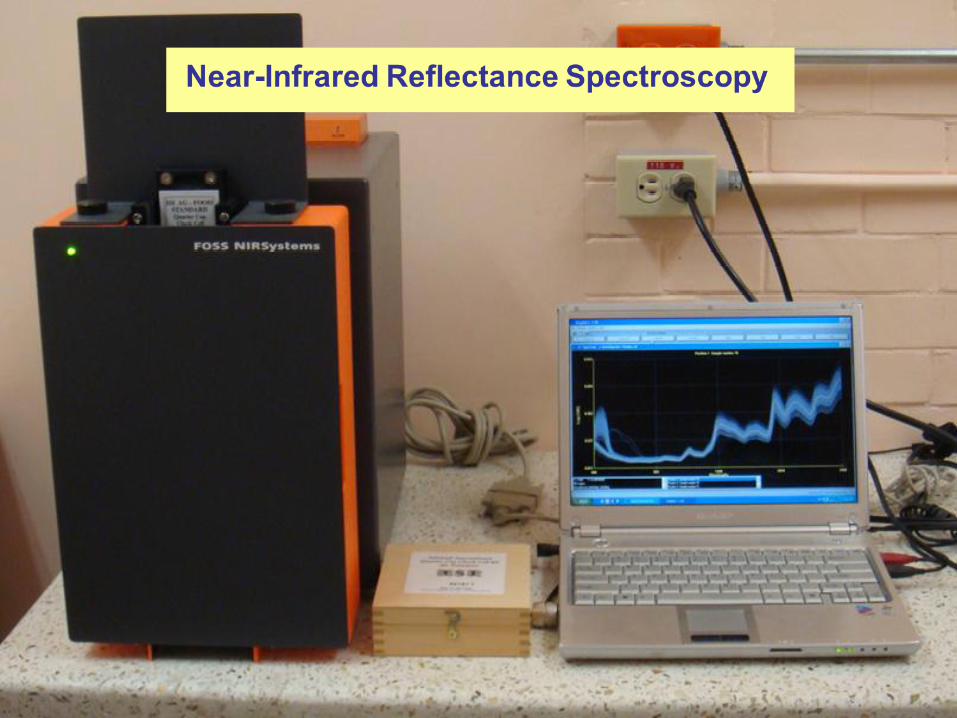

Technique IRMS EA AACC Method NIRS-prediction
Parameter 13C 18O N content Ash content 13C* 18O Ash N
Cost per sample 10€ 20€ 3€ 1.5€ 0.5€
Time <10 min <10 min <10 min ≈24 h ≈3 min
Equipment EA-IRMS EA Muffle furnace NIR spectrometer
*previously reported by Clark et al. 1995; Ferrio et al. 2001; Kleinebecker et al. 2009

NIRS a surrogate analysis of 13C
Calibration Samples
Measured 13C Discrimination (o/oo)
12131415161718
NIRS Predicted 13 C Discrimination (o /oo)
12
13
14
15
16
17
18N = 135Y = 2.10 + 0.86xr2 = 0.86***RMSEP = 0.46
Validation Samples
Measured 13C Discrimination (o/oo)
12131415161718
N = 179Y = 1.48 + 0.90xr2 = 0.82***RMSEP = 0.55
Breda RainfedTel Hadya RainfedTel Hadya Irrigated
Breda RainfedTel Hadya RainfedTel Hadya Irrigated

Trait N Mean SD Range CV SEC R2c SECV R2cv RPD Slope
Nkernels 126 1.81 0.24 1.15-2.38 13.4 0.09 0.87 0.09 0.87 2.76 0.90
Nleaves 152 1.57 0.22 1.04-2.05 14.1 0.10 0.80 0.12 0.72 1.86 0.80
ASHkernels 129 1.47 0.24 0.91-1.90 16.2 0.11 0.79 0.13 0.72 1.89 0.79
ASHleaves 150 14.31 2.89 8.78-21.46 20.2 0.54 0.97 0.65 0.95 4.42 0.98
18Okernels 128 31.69 1.43 28.05-34.99 4.5 0.82 0.66 1.04 0.49 1.38 0.66
18Oleaves 151 32.97 1.25 29.37-36.46 3.8 0.79 0.54 1.00 0.38 1.26 0.57
NIRS prediction of ash content and δ18O
Trait N Mean SD Range CV SEC R2c SECV R2cv RPD Slope
Nkernels 73 1.73 0.24 1.15-2.24 13.71 0.07 0.87 0.08 0.87 2.79 0.87
Nleaves 86 1.49 0.22 0.92-1.95 14.71 0.08 0.86 0.09 0.83 2.46 0.86
ASHkernels 75 1.37 0.27 0.91-1.80 19.71 0.10 0.82 0.14 0.70 1.92 0.82
ASHleaves 84 14.89 2.92 10.02-20.82 19.64 0.49 0.97 0.78 0.93 3.76 0.98
18Okernels 70 31.03 1.05 29.06-33.53 3.37 0.50 0.77 0.76 0.51 1.38 0.77 N, number of samples; SD, standard deviation; CV, coefficient of variation; R2c, determination coefficient of calibration; R2cv,
determination coefficient of cross-validation; RPD, ratio of performance deviation; SEC, standard error of calibration; SECV, standard
error of cross calibration. All correlations were significant at P<0.001 level.
Calibration statistics for hybrid sample set for leaf and kernel N and ash content and kernel 18O
Calibration statistics for global sample sets (including inbred lines and hybrids) for N, ash content and 18O in kernels and leaves

Roots: the hidden part

Ground-penetrating radar (GPR)

“Shovelomics”
Trachsel et al. 2011 Plant and Soil 341: 75-87

Δ180 sδ180 stem watertem water
Sánchez et al. unpublished
Some examples of traits and tools
Present bottleneck and the way ahead


Outline
Why field phenotyping?
Some examples of traits and tools
More than just traits and tools

Useful genetic variation
High selection intensity
“High quality” experimental sites
Cornerstone of development of improved germplasm
Jill Cairns, CIMMYT.

Prior phenotyping we need to characterise experimental sites for environmental variability
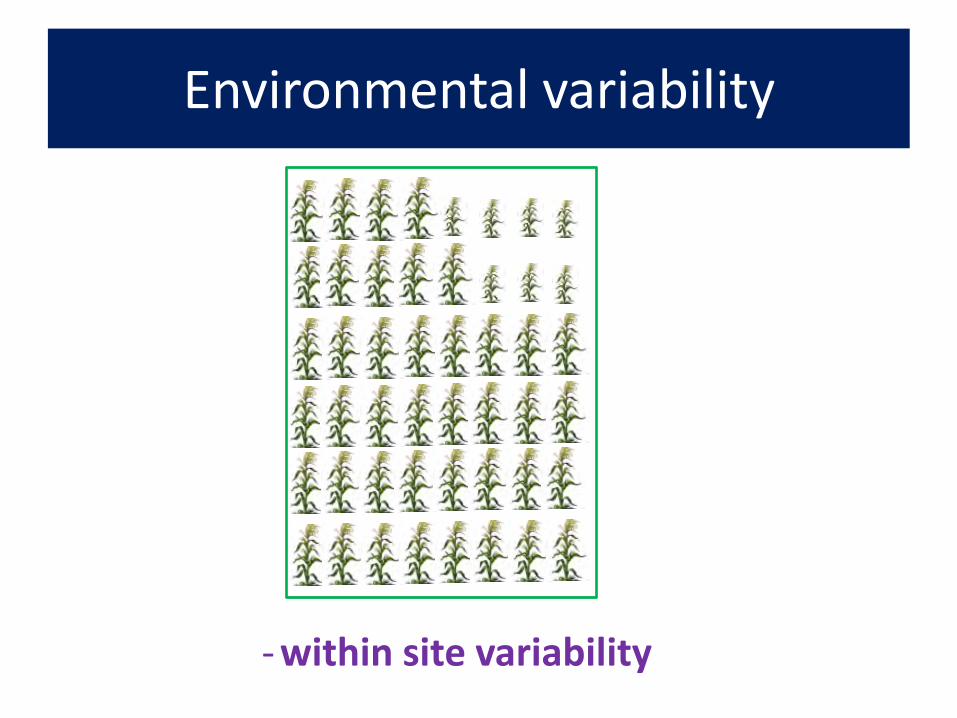
Environmental variability
- within site variability

Soil variability within drought screening sites
B. Das CIMMYT-Kenya

Mapping field variation
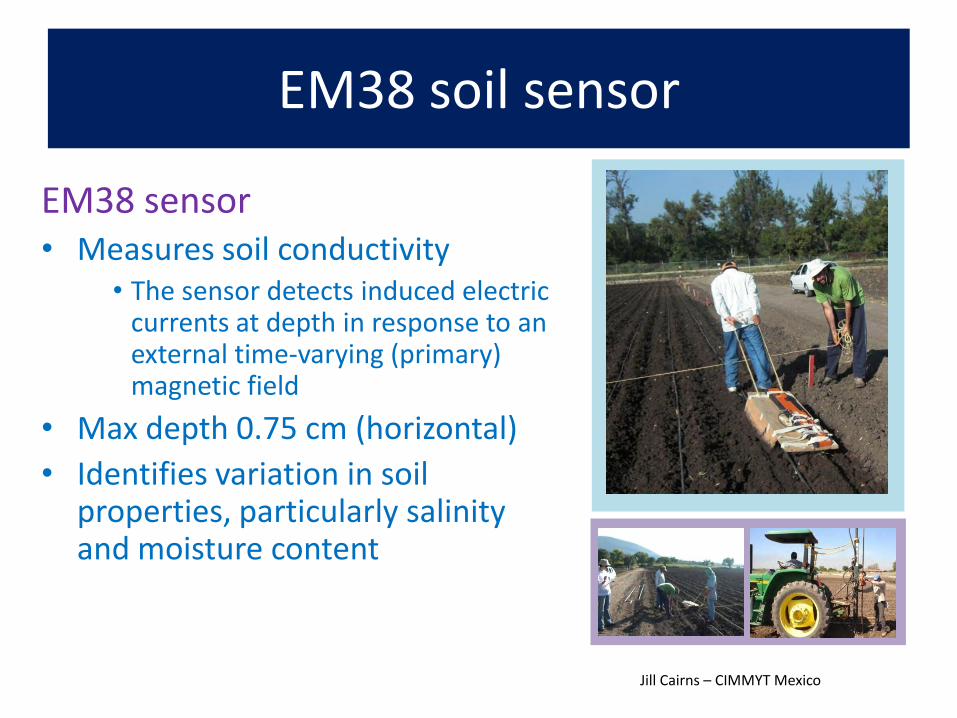
EM38 sensor • Measures soil conductivity
• The sensor detects induced electric currents at depth in response to an external time-varying (primary) magnetic field
• Max depth 0.75 cm (horizontal)
• Identifies variation in soil properties, particularly salinity and moisture content
EM38 soil sensor
Jill Cairns – CIMMYT Mexico

Measuring soil variability using EM38
Dan Makumbi – Jill Cairns – CIMMYT2

Mapping field variation: non-destructive
Depth to 3 MPa PR 0 cm 60 cm
Electrical conductivity
Prasanna et al. 2013

Soil variability map using NDVI
Dry weight (g)
NDVI

Mapping variability using infrared thermography
Campos GCP Phenotyping Manual, 2011

Consolidating data inc yield
Develop comprehensive site maps
Link to specific coordinates using base stations or GPS correction facilities

Reducing the effects of field variation
EM38 (1 ha = ~ 3 hours)
Penetrometer (1 ha = 3 days)
Masuka et al. Journal of Integrative Plant Biology 2012
H > 0.5 for all trials
Identify field gradients
incorporate into field design
NDVI (1 ha = 1 days, +
14-21 days to grow uniformity crop)

Summary


Ackowledgements
• Affordable field-based high Throughput Phenotyping Platforms (HTPPs). Maize Competitive Grants Initiative. CIMMYT
• Adaptation to Climate Change of the Mediterranean Agricultural Systems – ACLIMAS.. EuropeAid/131046/C/ACT/Multi. European Commission
• Durum wheat improvement for the current and future Mediterranean conditionsMejora del trigo duro para las condiciones mediterráneas presentes y futuras. AGL2010-20180 Spain.
• Breeding to Optimise Chinese Agriculture (OPTICHINA). FP7 Cooperation, European Commission - DG Research. Grant Agreement 26604 .

Many thanks….

Importance of phenotyping
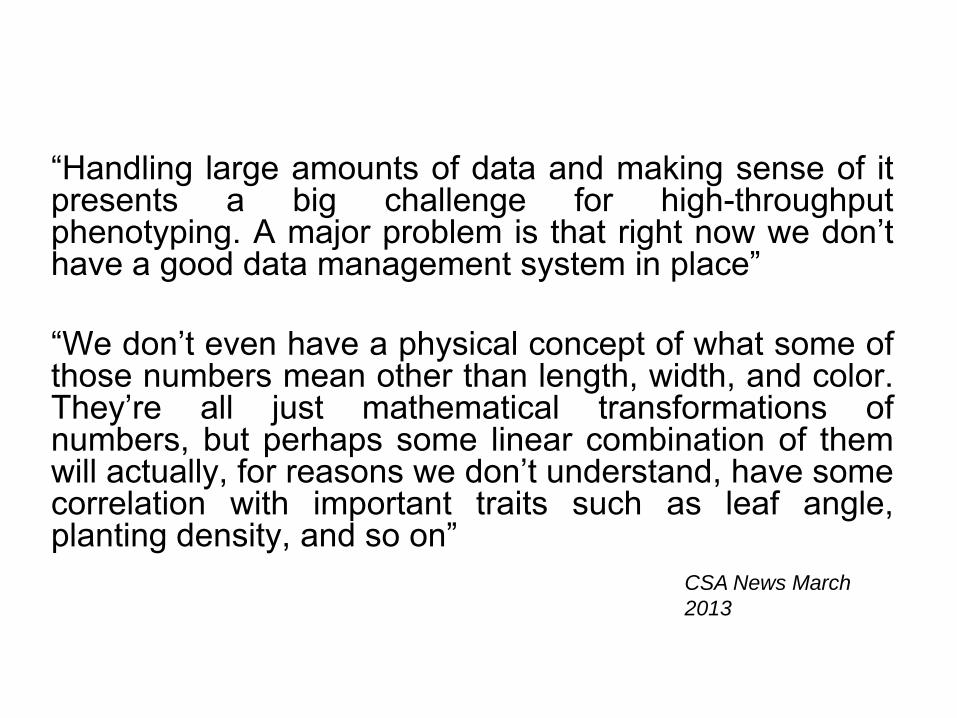
“Handling large amounts of data and making sense of it presents a big challenge for high-throughput phenotyping. A major problem is that right now we don’t have a good data management system in place” “We don’t even have a physical concept of what some of those numbers mean other than length, width, and color. They’re all just mathematical transformations of numbers, but perhaps some linear combination of them will actually, for reasons we don’t understand, have some correlation with important traits such as leaf angle, planting density, and so on”
CSA News March
2013


