Page 1/26 A Global Non-Invasive Methodology for the Phenotyping of Potato Under Water Decit Conditions using Imaging, Physiological and Molecular Tools Maja Musse INRAE Bretagne-Normandie: Institut National de Recherche pour l'Agriculture l'Alimentation et l'Environnement Centre Bretagne-Normandie https://orcid.org/0000-0002-1681-5592 Ghina Hajjar INRAE Bretagne-Normandie: Institut National de Recherche pour l'Agriculture l'Alimentation et l'Environnement Centre Bretagne-Normandie Nusrat Ali Roullier Group: Groupe Roullier Bastien Billiot Roullier Group: Groupe Roullier Gisèle Joly Germicopa Jérémy Pépin INRAE Bretagne-Normandie: Institut National de Recherche pour l'Agriculture l'Alimentation et l'Environnement Centre Bretagne-Normandie Stéphane Quellec INRAE Bretagne-Normandie: Institut National de Recherche pour l'Agriculture l'Alimentation et l'Environnement Centre Bretagne-Normandie Sylvain Challois INRAE Bretagne-Normandie: Institut National de Recherche pour l'Agriculture l'Alimentation et l'Environnement Centre Bretagne-Normandie François Mariette INRAE Bretagne-Normandie: Institut National de Recherche pour l'Agriculture l'Alimentation et l'Environnement Centre Bretagne-Normandie Mireille Cambert INRAE Bretagne-Normandie: Institut National de Recherche pour l'Agriculture l'Alimentation et l'Environnement Centre Bretagne-Normandie Clément Fontaine Roullier Group: Groupe Roullier Charlotte Ngo-Dinh
Transcript
Page 1/26
A Global Non-Invasive Methodology for thePhenotyping of Potato Under Water De�citConditions using Imaging, Physiological andMolecular ToolsMaja Musse
INRAE Bretagne-Normandie: Institut National de Recherche pour l'Agriculture l'Alimentation etl'Environnement Centre Bretagne-Normandie https://orcid.org/0000-0002-1681-5592Ghina Hajjar
INRAE Bretagne-Normandie: Institut National de Recherche pour l'Agriculture l'Alimentation etl'Environnement Centre Bretagne-NormandieNusrat Ali
Roullier Group: Groupe RoullierBastien Billiot
Roullier Group: Groupe RoullierGisèle Joly
GermicopaJérémy Pépin
INRAE Bretagne-Normandie: Institut National de Recherche pour l'Agriculture l'Alimentation etl'Environnement Centre Bretagne-NormandieStéphane Quellec
INRAE Bretagne-Normandie: Institut National de Recherche pour l'Agriculture l'Alimentation etl'Environnement Centre Bretagne-NormandieSylvain Challois
INRAE Bretagne-Normandie: Institut National de Recherche pour l'Agriculture l'Alimentation etl'Environnement Centre Bretagne-NormandieFrançois Mariette
INRAE Bretagne-Normandie: Institut National de Recherche pour l'Agriculture l'Alimentation etl'Environnement Centre Bretagne-NormandieMireille Cambert
INRAE Bretagne-Normandie: Institut National de Recherche pour l'Agriculture l'Alimentation etl'Environnement Centre Bretagne-NormandieClément Fontaine
IGEPP: Institut de Genetique Environnement et Protection des PlantesCarole Deleu
IGEPP: Institut de Genetique Environnement et Protection des PlantesLaurent Leport ( [email protected] )
Université de Rennes 1 https://orcid.org/0000-0001-9886-287X
Research
Keywords: Tuber, MRI, NMR Relaxometry, Gene expression, ABA, Water relations, Water potential, Osmoticpotential, Drought
Posted Date: February 10th, 2021
DOI: https://doi.org/10.21203/rs.3.rs-205257/v1
License: This work is licensed under a Creative Commons Attribution 4.0 International License. Read Full License
Version of Record: A version of this preprint was published at Plant Methods on July 23rd, 2021. See thepublished version at https://doi.org/10.1186/s13007-021-00771-0.
AbstractBackground: Drought is a major consequence of global heating that has negative impacts on agriculture.Potato is a drought-sensitive crop; tuber growth and dry matter content may both be impacted. Moreover,water de�cit can induce physiological disorders such as glassy tubers and internal rust spots. Theresponse of potato plants to drought is complex and can be affected by cultivar type, climatic and soilconditions, and the point at which water stress occurs during growth. The characterization of adaptiveresponses in plants presents a major phenotyping challenge. There is therefore a demand for thedevelopment of non-invasive analytical techniques to improve phenotyping.
Results: This project aimed to take advantage of innovative approaches in MRI, phenotyping andmolecular biology to evaluate the effects of water stress on potato plants during growth. Plants werecultivated in pots under different water conditions. A control group of plants were cultivated underoptimal water uptake conditions. Other groups were cultivated under mild and severe water de�ciencyconditions (40 and 20% of �eld capacity, respectively) applied at different tuber growth phases (initiation,�lling). Water stress was evaluated by monitoring soil water potential. Two fully-equipped imagingcabinets were set up to characterize plant morphology using high de�nition color cameras (top and sideviews) and to measure plant stress using RGB cameras. The response of potato plants to water stressdepended on the intensity and duration of the stress. Three-dimensional morphological images of theunderground organs of potato plants in pots were recorded using a 1.5 T MRI scanner. A signi�cantdifference in growth kinetics was observed at the early growth stages between the control and stressedplants. Quantitative PCR analysis was carried out at molecular level on the expression patterns ofselected drought-responsive genes. Variations in stress levels were seen to modulate ABA and drought-responsive ABA-dependent and ABA-independent genes.
Conclusions: This methodology, when applied to the phenotyping of potato under water de�citconditions, provides a quantitative analysis of leaves and tubers properties at microstructural andmolecular levels. The approaches thus developed could therefore be effective in the multi-scalecharacterization of plant response to water stress, from organ development to gene expression.
1. IntroductionPotato (Solanum tuberosum L.) is cultivated on every continent other than Antarctica. With a yield of 374Mt in 2017, it is the world’s fourth most produced crop after sugar cane (1851 Mt), maize (1164 Mt) andwheat (773 Mt) [1]. Its global production has grown steadily for the last three decades (by around 40%).An important staple food, it is grown in over 100 countries around the world for its adaptability to a widerange of environments. However, as for many crops, potato cultivation is under threat from globalheating. Water stress is the main cause of yield loss in �eld crops and climate forecasts suggest that thisproblem will worsen in the coming years. Compared to other �eld crop species, potato is considered to berelatively sensitive to water stress [2-4]. One reason for this sensitivity is its shallow and sparse rootsystem [5, 6]. Water stress causes a decrease in the number [7] and size of tubers [8] and a decrease in
Page 4/26
their quality due to biotic and abiotic disorders (scab, growth crack, hollow heart, etc.). The timing,duration and severity of the water de�cit have a signi�cant effect on stress expression. Additionally, aproportion of the expression is linked to tuber formation and growth which occurs underground. Thisexplains why, although the consequences of water stress on potato yield are well known, the effects ofdehydration at key stages of sensitivity on yield are poorly understood. The development of effectivephenotyping tools, from microscopic to macroscopic level, especially for underground tubers, is a keybottleneck in deciphering and acquiring a better understanding of the effects of water stress on potatogrowth and its impact on yield.
Plants respond to drought by initiating multiple physiological and metabolic adjustments that form acomplex network of cellular and molecular processes. This includes the dynamic shifting of regulatoryresponses during transcription and protein expression, consequently affecting numerous biochemicalpathways and eventually leading to phenotypic changes [9-11]. In the last decade, high-throughputphenotyping tools have seen substantial development so that precise monitoring of the progression ofmorphological parameters under water de�cit [12, 13] can be undertaken. Equally, other tools have nowbecome available for the in situ characterization of leaf and tuber development and its disturbance understress. Indeed, the capacity of Nuclear Magnetic Resonance (NMR) relaxometry to evaluate in detail thewater distribution associated with the cell and tissue structures of oilseed rape, tobacco and lettuceleaves has been recently demonstrated [14-16]. NMR transverse relaxation time, which is particularlysensitive to variations in the water properties of plant tissues, was used to study changes in cell waterstatus and distribution. As was demonstrated for different plant tissues, including leaves [14, 17], multi-exponential transverse relaxation times re�ect the differences in the physical and chemical properties ofwater in different cell compartments under conditions where diffusion exchange of water moleculesbetween compartments is relatively slow. It has been shown that in hydrated plant tissues (�eshy fruits,tubers, leaves) the longest T2 peak with the highest relative intensity is generally associated with vacuolarwater [17], which is the largest pool of cell water. In the particular case of leaves, in the course ofsenescence, the single vacuolar peak splits into two peaks as a result of differential leaf hydration andcell enlargement between the palisade and spongy layers. Following the split, the T2 value of palisadecells (which have the longer T2 value) increases while that of spongy cells remains stable. Further,throughout plant development during the vegetative stage, the split is seen to progress from the bottomto the top of the canopy [18]. This pattern of T2 evolution re�ects the orderly and progressive process ofsequential leaf senescence. In the case of N depletion, it has been shown that lower tolerance to thisstress was associated with a higher impact on senescence-associated structural modi�cation patterns.
In Magnetic Resonance Imaging (MRI), the image contrast can be adjusted to provide anatomicalinformation for an intact plant organ or to map the spatial distribution of relaxation parameters. Oneapplication is root imaging as an additional value in plant phenotyping [19]. MRI has been used tomonitor the development of 3D root architecture [19], to identify active roots for water uptake [20], and toevaluate pathogen-induced root damage [21]. In addition, 3D MRI images have allowed comparison ofthe internal physiology of chilled and non-chilled tulip bulbs during storage and after planting [22, 23].
Page 5/26
This revealed that normal water balancing between different subcellular compartments (vacuole andcytoplasm) associated with water membrane permeability was a key process for the healthydevelopment of tulip bulbs. A similar study found it possible to identify markers of dormancy release, aprocess that is not physiologically visible, by means of MRI images of tulip bulbs [22]. To the best of ourknowledge, the growth kinetics of potato tubers are presented for the �rst time in this study.
In order to understand observed morphological changes, it is possible to combine phenotyping withphysiological and genotyping analysis. For instance, plant response to water stress can be monitored byassessing leaf water relations and by measuring leaf-water potential, osmotic potential and relative watercontent, while yield components can be monitored by quantifying total biomass, potato tuber numbersand tuber fresh weight. Plants perceive water de�cit signals through multiple signal transductionpathways which subsequently activate different drought-responsive genes producing adaptativeresistance to stress [24]. A crucial role in the transduction of these stress signals is played byphytohormones, speci�cally abscisic acid (ABA) [25]. Stress signal perception and the consequentexpression of drought-responsive genes involve different transcription factors which could be either ABA-dependent or ABA-independent [26]. Here, metabolomics and molecular tools provide the means togenerate datasets for the study of changes in gene expression and metabolites resulting from droughtstress.
In this study, a holistic approach was adopted towards potato plant responses to drought, focusing onthe foliar parts of the plant as well as the tubers and combining both destructive and non-destructivemethods in order to investigate the effects of water stress on the whole potato plant throughout theperiod of its lifecycle development between planting and harvest. This approach brought togetherbreeders, geneticists, physiologists, physicists and agronomists to pool their expertise and to unlockinformation on potato plant response to the multifactorial effects of water stress. The plants’ physicalenvironment was characterized by measuring air temperature and installing humidity and light sensors,while the measurement of the water de�cit was �nely calibrated by weighing the pots in order to quantifywater use and tensiometers to monitor soil dehydration. NMR was used to evaluate the impact of waterstress on the structural modi�cation of leaves during development and MRI was used for undergroundmonitoring of the number and volume of tubers. High throughput phenotyping tools were used toquantify changes in shoot morphology and color, using top and side view cameras. Abscisic acid (ABA)was quanti�ed and the effect of water stress on gene expression was assessed for ABA and otherdrought-responsive genes. Gene expression analysis was performed, selecting ABA-dependent AREB(ABA-responsive element binding protein) transcription factors (StAREB1 and StAREB2) and ABA-independent DREB (drought-responsive element binding) transcription factors (StDREB1 and StDREB2)that bind to drought-responsive cis-acting elements and are induced by dehydration. Moreover, speci�cdrought-inducible genes coding for Late-Embryogenesis Abundant (LEA) proteins (for example dehydrins)and chaperone proteins (heat shock proteins) such as StDHN1, StTAS14, StERD7, StRD22 and StHSP100involved in adaptive stress responses were also analyzed by real-time PCR-based gene expressionanalysis. Using this integrative approach, the present study aims to establish a methodology forinvestigating the effects of drought on potato development, employing modern tools and innovative
Page 6/26
methods in combination with more traditional water stress evaluation techniques. This will make itpossible for deeper analysis to be carried out in order to improve understanding of this plant’s response todrought.
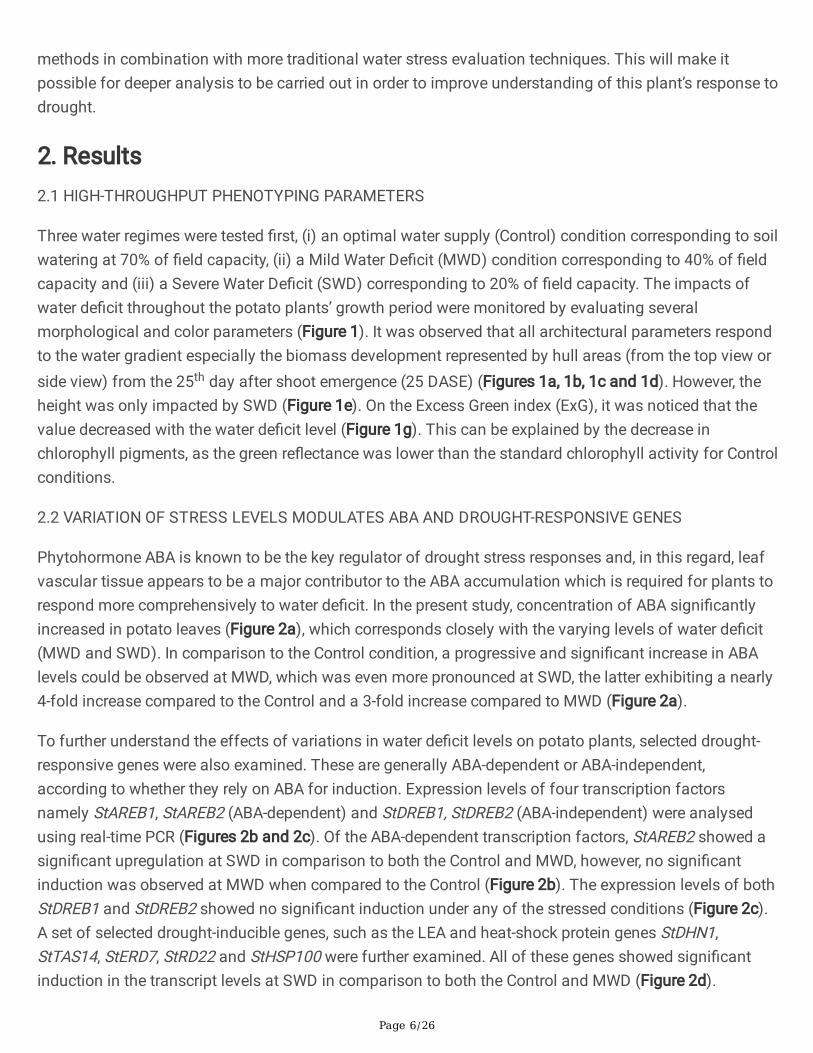
Three water regimes were tested �rst, (i) an optimal water supply (Control) condition corresponding to soilwatering at 70% of �eld capacity, (ii) a Mild Water De�cit (MWD) condition corresponding to 40% of �eldcapacity and (iii) a Severe Water De�cit (SWD) corresponding to 20% of �eld capacity. The impacts ofwater de�cit throughout the potato plants’ growth period were monitored by evaluating severalmorphological and color parameters (Figure 1). It was observed that all architectural parameters respondto the water gradient especially the biomass development represented by hull areas (from the top view orside view) from the 25th day after shoot emergence (25 DASE) (Figures 1a, 1b, 1c and 1d). However, theheight was only impacted by SWD (Figure 1e). On the Excess Green index (ExG), it was noticed that thevalue decreased with the water de�cit level (Figure 1g). This can be explained by the decrease inchlorophyll pigments, as the green re�ectance was lower than the standard chlorophyll activity for Controlconditions.
2.2 VARIATION OF STRESS LEVELS MODULATES ABA AND DROUGHT-RESPONSIVE GENES
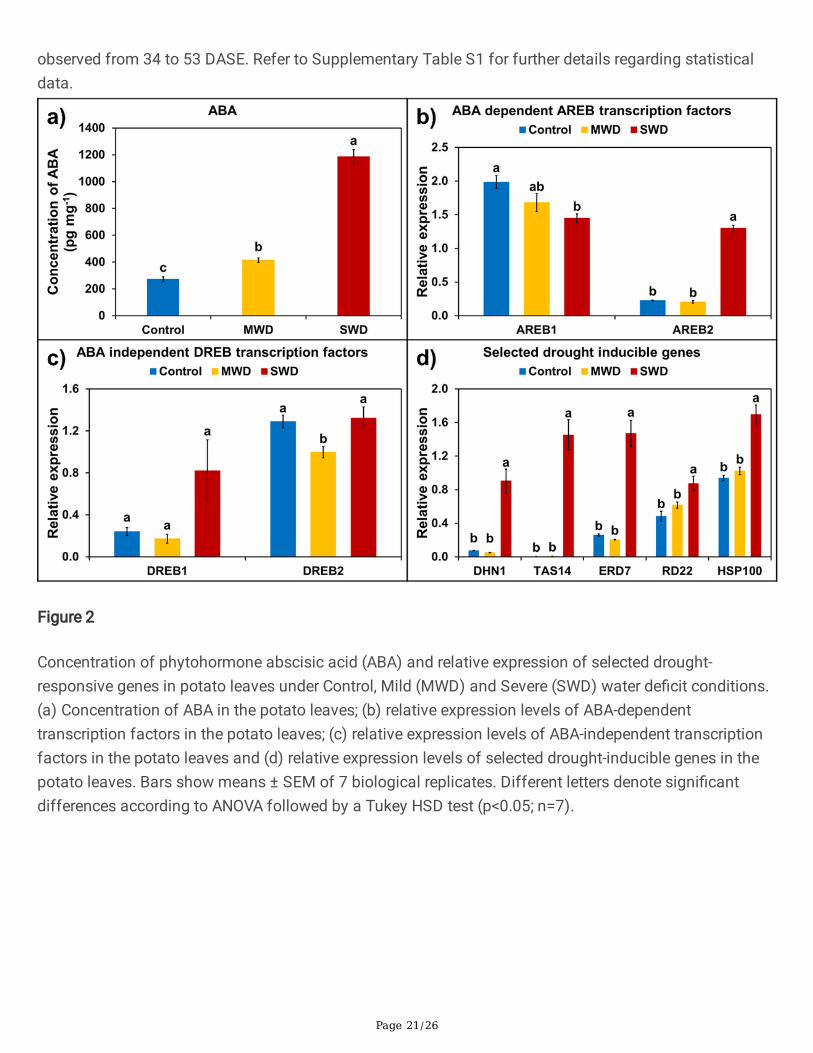
Phytohormone ABA is known to be the key regulator of drought stress responses and, in this regard, leafvascular tissue appears to be a major contributor to the ABA accumulation which is required for plants torespond more comprehensively to water de�cit. In the present study, concentration of ABA signi�cantlyincreased in potato leaves (Figure 2a), which corresponds closely with the varying levels of water de�cit(MWD and SWD). In comparison to the Control condition, a progressive and signi�cant increase in ABAlevels could be observed at MWD, which was even more pronounced at SWD, the latter exhibiting a nearly4-fold increase compared to the Control and a 3-fold increase compared to MWD (Figure 2a).
To further understand the effects of variations in water de�cit levels on potato plants, selected drought-responsive genes were also examined. These are generally ABA-dependent or ABA-independent,according to whether they rely on ABA for induction. Expression levels of four transcription factorsnamely StAREB1, StAREB2 (ABA-dependent) and StDREB1, StDREB2 (ABA-independent) were analysedusing real-time PCR (Figures 2b and 2c). Of the ABA-dependent transcription factors, StAREB2 showed asigni�cant upregulation at SWD in comparison to both the Control and MWD, however, no signi�cantinduction was observed at MWD when compared to the Control (Figure 2b). The expression levels of bothStDREB1 and StDREB2 showed no signi�cant induction under any of the stressed conditions (Figure 2c).A set of selected drought-inducible genes, such as the LEA and heat-shock protein genes StDHN1,StTAS14, StERD7, StRD22 and StHSP100 were further examined. All of these genes showed signi�cantinduction in the transcript levels at SWD in comparison to both the Control and MWD (Figure 2d).
Page 7/26
However, no signi�cant induction was observed in any of the analyzed genes at MWD in comparison tothe Control (Figure 2d). These results clearly suggest that drought stress perception and signaling varieswidely with the degree of applied stress.
2.3 CHARACTERISATION OF WATER DEFICIT EFFECTS ON SOIL AND PLANT WATER PARAMETERS ANDTUBER PRODUCTION
In this part, analyses were carried out under Control conditions and under the most severe stressconditions (SWD conditions) that displayed the greatest effects on plant growth and gene expressioncompared with the Control. Soil water potential was monitored throughout the experiment (Figure 3a).Under Control conditions, soil water potential was maintained at around 0 MPa from tuber planting up to25 DASE. It then decreased and remained stable at about -1 MPa from 39 to 60 DASE. A decrease to -2MPa was observed from 60 to 85 DASE corresponding to the withholding of water from top-kill to �nalharvest. Under SWD conditions, soil water potential decreased when water de�cit was induced by waterinput reduction at 25 DASE. It was maintained at a value close to -2 MPA (between -1.78 to -2.34 MPa)from 39 DASE until top-kill (60 DASE) by the daily adjustment of water management. The more drasticdecrease to -3.43 MPa observed from 60 to 85 DASE corresponded to the withholding of water.
Leaf water potential was simultaneously monitored (Figure 3b). In Control conditions, unlike soil waterpotential, leaf water potential remained stable at approximately -0.75 MPa during the entire measurementperiod from shoot emergence to top-kill. In SWD conditions, leaf water potential slightly decreased oneweek after water input reduction and reached -1.1 MPa at 39 DASE. During the period when soil waterpotential was maintained at around -2 MPa, a slight increase of leaf water potential was observed closeto that seen in the Control plants followed by a decrease to -1.4 MPa. This corresponded to the increaseobserved in soil water potential associated with water inputs to maintain soil watering at 20% of �eldcapacity.
The leaf osmotic potential (measured at relative water content) presented a pattern similar to that of leafwater potential (Figure 3c). In the Control plants, values remained close to -0.7 MPa for all times ofsampling and were not signi�cantly different in SWD plants, except at 38 DASE where leaf water potentialshowed a slight decrease at -1.12 MPa. Simultaneously, leaf water de�cit remained stable at close to 10%in the Control plants whereas it strongly increased in SWD plants with values ranging between 20 and40% (Figure 3d). A comparison of calculated osmotic potential at full turgor between the Control andSWD plants revealed no difference indicating that the potato plants analyzed did not carry out osmoticadjustment.
In addition to soil and plant water parameters, the effects of water input patterns were also evaluated fortuber production (Figures 3e and 3f). The sum of all tubers Fresh Weight (FW) from individual plants wascomputed (Figure 3e). In addition, the FW gain was evaluated for the nine largest individual tubers ofeach plant during the tuber �lling stage (between 38 to 85 DASE) (Figure 3f). In the Control plants, tubertotal FW steadily increased from 22 to 52 DASE, corresponding to the tuber �lling stage, reaching 345 gper plant. After 52 DASE and until harvest, this value remained stable. In SWD plants, tuber FW increase
Page 8/26
was also observed during the same period (22 to 52 DASE). However, the maximum value reached was111 g per plant corresponding to about a third of the tuber yield obtained in the Control plants.
When plants produced nine viable tubers (de�ned as having a tuber diameter greater than 25 mm, 38DASE in this study), FW of the individual tubers was measured for each plant. Then, FW gain wasdetermined for individual tubers, from the largest (tub1) to the smallest (tub9), between this date (38DASE) and the harvest date (85 DASE) (Figure 3f). It appeared that in the Control plants, FW gain wasproportional to tuber size from the 1st to the 6th tuber while for the last 3 tubers (tubs 7-9) FW gainremained at the same low values. For tuber FW at 38 DASE, this gain corresponded to a factor of 2.5(tubs 1-2) to 2 (tubs 3-9). In SWD plants, a lower FW gain was observed than in the Control plants. TheFW gain in the largest tuber was about 20 g while no variation was observed in other tubers where thegain was below 10 g.
2.4 CHARACTERIZATION OF LEAF AGING AND SENESCENCE
Changes in T2 parameters were monitored for two leaves (Leaf Ranks (LR) 0 and +3) throughout the six-week plant development period and under Control and SWD conditions. As expected, all T2 distributionsmeasured in the leaves displayed several distinct peaks (data not shown). NMR data were interpreted inline with results obtained for oilseed rape, tobacco and escarole [14-16]. In the following, only relaxationpeaks associated with the vacuole water pool (either one or two peaks characterized by the longest T2
relaxation times, depending on leaf age and condition) are presented. In all Control plants analyzed(Figures 4a and 4b), the progression of structural changes associated with leaf development wasre�ected by the pattern of T2 evolution in accordance with previous results obtained from well-wateredplants. Indeed, the T2 of the single vacuolar peak observed in young leaves (Figure 4a) increased withleaf development and split, in senescing leaves, into two peaks corresponding to the palisade (largevacuoles) and spongy (small vacuoles) layers (Figure 4b). The split occurred at 62 DASE for leaves at LR+3, while it occurred at 24 DASE for LR 0 leaves following the bottom-up progression of structuralchanges associated with leaf development throughout the canopy. Note that for LR +3 (Figure 4a), thepattern of T2 evolution was not veri�ed for one of the four leaves analyzed at each developmental stage(data not shown). In SWD plants, the evolution pattern of the vacuolar T2 observed in young leaves (LR+3) was similar to that observed in the Control plants. Differences were observed only for the time whenthe split occurred, corresponding to 62 and 53 DASE for the Control and SWD plants respectively. In oldleaves, the pattern of vacuolar T2 evolution was complex. Up to 33 DASE, the T2 pattern was similar in theControl and SWD plants. At 39 DASE, the palisade and spongy vacuolar peaks merged, then split again at46 DASE and �nally re-merged at 61 DASE. At 46 DASE, only half of the data made it possible todistinguish between the vacuoles of the two leaf tissues.
2.5 IN-SITU MONITORING OF TUBER GROWTH
MRI was used as a non-destructive method to monitor the growth of potato tubers while still in theirculture medium. 3D MRI images of the underground organs of the plant in the container enabled access
Page 9/26
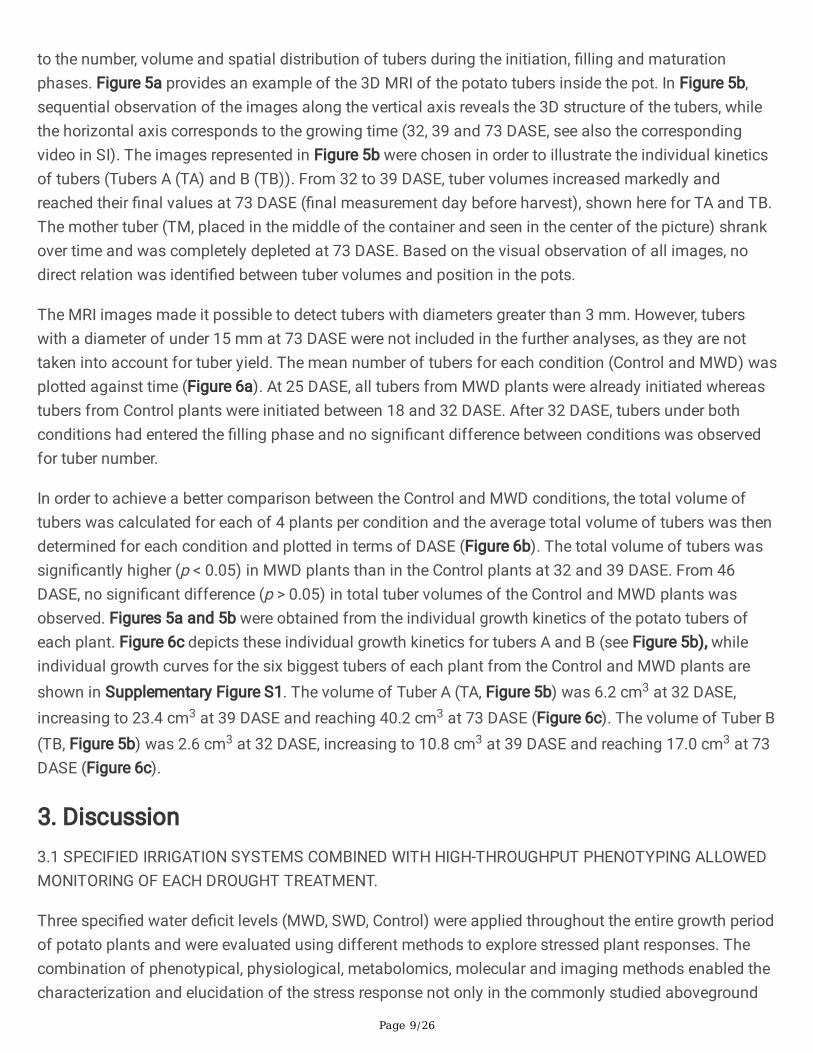
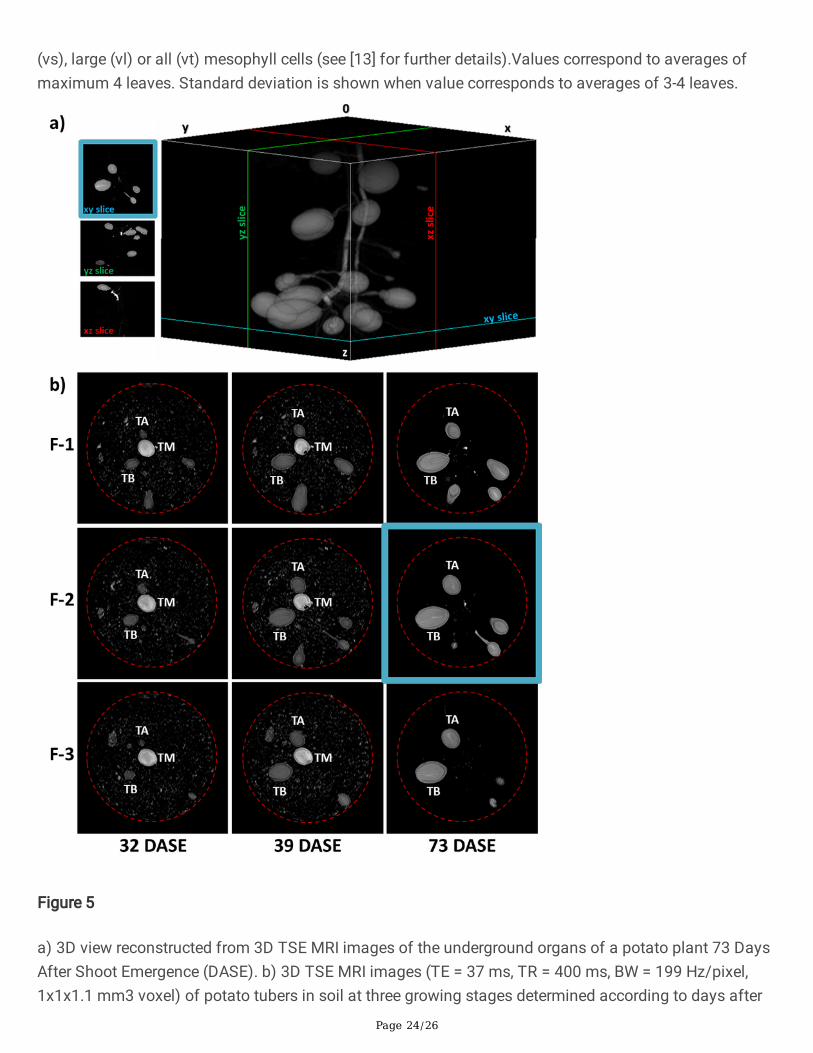
to the number, volume and spatial distribution of tubers during the initiation, �lling and maturationphases. Figure 5a provides an example of the 3D MRI of the potato tubers inside the pot. In Figure 5b,sequential observation of the images along the vertical axis reveals the 3D structure of the tubers, whilethe horizontal axis corresponds to the growing time (32, 39 and 73 DASE, see also the correspondingvideo in SI). The images represented in Figure 5b were chosen in order to illustrate the individual kineticsof tubers (Tubers A (TA) and B (TB)). From 32 to 39 DASE, tuber volumes increased markedly andreached their �nal values at 73 DASE (�nal measurement day before harvest), shown here for TA and TB.The mother tuber (TM, placed in the middle of the container and seen in the center of the picture) shrankover time and was completely depleted at 73 DASE. Based on the visual observation of all images, nodirect relation was identi�ed between tuber volumes and position in the pots.
The MRI images made it possible to detect tubers with diameters greater than 3 mm. However, tuberswith a diameter of under 15 mm at 73 DASE were not included in the further analyses, as they are nottaken into account for tuber yield. The mean number of tubers for each condition (Control and MWD) wasplotted against time (Figure 6a). At 25 DASE, all tubers from MWD plants were already initiated whereastubers from Control plants were initiated between 18 and 32 DASE. After 32 DASE, tubers under bothconditions had entered the �lling phase and no signi�cant difference between conditions was observedfor tuber number.
In order to achieve a better comparison between the Control and MWD conditions, the total volume oftubers was calculated for each of 4 plants per condition and the average total volume of tubers was thendetermined for each condition and plotted in terms of DASE (Figure 6b). The total volume of tubers wassigni�cantly higher (p < 0.05) in MWD plants than in the Control plants at 32 and 39 DASE. From 46DASE, no signi�cant difference (p > 0.05) in total tuber volumes of the Control and MWD plants wasobserved. Figures 5a and 5b were obtained from the individual growth kinetics of the potato tubers ofeach plant. Figure 6c depicts these individual growth kinetics for tubers A and B (see Figure 5b), whileindividual growth curves for the six biggest tubers of each plant from the Control and MWD plants areshown in Supplementary Figure S1. The volume of Tuber A (TA, Figure 5b) was 6.2 cm3 at 32 DASE,increasing to 23.4 cm3 at 39 DASE and reaching 40.2 cm3 at 73 DASE (Figure 6c). The volume of Tuber B(TB, Figure 5b) was 2.6 cm3 at 32 DASE, increasing to 10.8 cm3 at 39 DASE and reaching 17.0 cm3 at 73DASE (Figure 6c).
3. Discussion3.1 SPECIFIED IRRIGATION SYSTEMS COMBINED WITH HIGH-THROUGHPUT PHENOTYPING ALLOWEDMONITORING OF EACH DROUGHT TREATMENT.
Three speci�ed water de�cit levels (MWD, SWD, Control) were applied throughout the entire growth periodof potato plants and were evaluated using different methods to explore stressed plant responses. Thecombination of phenotypical, physiological, metabolomics, molecular and imaging methods enabled thecharacterization and elucidation of the stress response not only in the commonly studied aboveground
Page 10/26
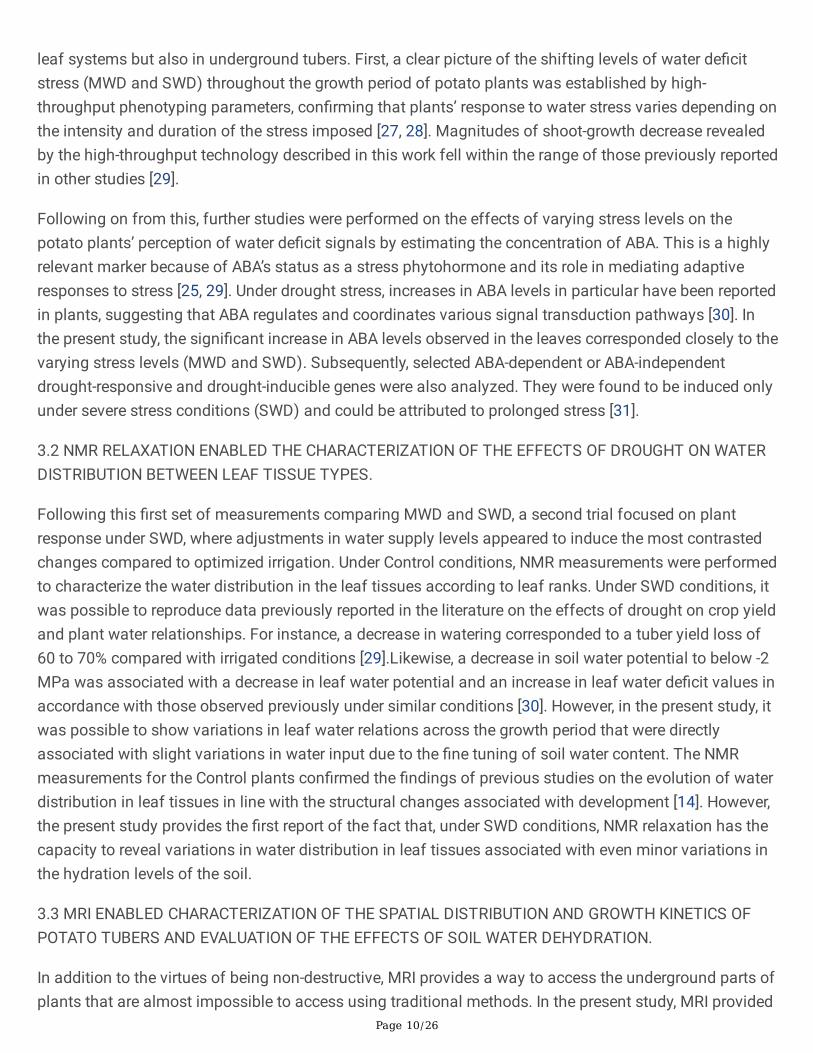
leaf systems but also in underground tubers. First, a clear picture of the shifting levels of water de�citstress (MWD and SWD) throughout the growth period of potato plants was established by high-throughput phenotyping parameters, con�rming that plants’ response to water stress varies depending onthe intensity and duration of the stress imposed [27, 28]. Magnitudes of shoot-growth decrease revealedby the high-throughput technology described in this work fell within the range of those previously reportedin other studies [29].
Following on from this, further studies were performed on the effects of varying stress levels on thepotato plants’ perception of water de�cit signals by estimating the concentration of ABA. This is a highlyrelevant marker because of ABA’s status as a stress phytohormone and its role in mediating adaptiveresponses to stress [25, 29]. Under drought stress, increases in ABA levels in particular have been reportedin plants, suggesting that ABA regulates and coordinates various signal transduction pathways [30]. Inthe present study, the signi�cant increase in ABA levels observed in the leaves corresponded closely to thevarying stress levels (MWD and SWD). Subsequently, selected ABA-dependent or ABA-independentdrought-responsive and drought-inducible genes were also analyzed. They were found to be induced onlyunder severe stress conditions (SWD) and could be attributed to prolonged stress [31].
3.2 NMR RELAXATION ENABLED THE CHARACTERIZATION OF THE EFFECTS OF DROUGHT ON WATERDISTRIBUTION BETWEEN LEAF TISSUE TYPES.
Following this �rst set of measurements comparing MWD and SWD, a second trial focused on plantresponse under SWD, where adjustments in water supply levels appeared to induce the most contrastedchanges compared to optimized irrigation. Under Control conditions, NMR measurements were performedto characterize the water distribution in the leaf tissues according to leaf ranks. Under SWD conditions, itwas possible to reproduce data previously reported in the literature on the effects of drought on crop yieldand plant water relationships. For instance, a decrease in watering corresponded to a tuber yield loss of60 to 70% compared with irrigated conditions [29].Likewise, a decrease in soil water potential to below -2MPa was associated with a decrease in leaf water potential and an increase in leaf water de�cit values inaccordance with those observed previously under similar conditions [30]. However, in the present study, itwas possible to show variations in leaf water relations across the growth period that were directlyassociated with slight variations in water input due to the �ne tuning of soil water content. The NMRmeasurements for the Control plants con�rmed the �ndings of previous studies on the evolution of waterdistribution in leaf tissues in line with the structural changes associated with development [14]. However,the present study provides the �rst report of the fact that, under SWD conditions, NMR relaxation has thecapacity to reveal variations in water distribution in leaf tissues associated with even minor variations inthe hydration levels of the soil.
3.3 MRI ENABLED CHARACTERIZATION OF THE SPATIAL DISTRIBUTION AND GROWTH KINETICS OFPOTATO TUBERS AND EVALUATION OF THE EFFECTS OF SOIL WATER DEHYDRATION.
In addition to the virtues of being non-destructive, MRI provides a way to access the underground parts ofplants that are almost impossible to access using traditional methods. In the present study, MRI provided
Page 11/26
information on the effects of drought on the number of newly-formed potato tubers and made it possibleto monitor individual tuber growth within the pot at all times during the growth period, from tuber �llingup to harvest. Under MWD conditions, potato tubers reached volumes equal to those of the Controlpotatoes at the end of the growth stage (Figure 6b). However, water de�cit signi�cantly affected thegrowth kinetics in early growth stages, demonstrating that the growth kinetics of potato plants aredependent on their water uptake. Increases in tuber volume (Figure 6a) were similar under both waterregimes. However, this increase started earlier under MWD conditions (18 DASE) than under Controlconditions (25 DASE). The slight increase in tuber volume (Figure 6b) observed during the �rst phaseoccurred at tuber initiation and the total volume increase was the result of an increase in tuber number.Under Control conditions, the highest increase observed between 32 and 39 DASE, with an increase of56% of tuber total volume, corresponded to the tuber �lling phase. Under MWD, a similar increaseassociated with the tuber �lling period was observed between 25 and 32 DASE and corresponded to a45% increase of tuber total volume. At crop maturity, the maximum total volume of the Control plants wasreached at 59 DASE whereas for MWD plants, it was reached at 46 DASE. Where these conditions areconcerned, it appears that MWD induced early initiation followed by early growth in the tubers comparedwith Control conditions.
4. ConclusionIn the present work, the effect of drought on potato production was assessed adopting a multi-scaleapproach that combined conventional studies on physiological plant response and gene expressionanalysis with innovative technologies for high-throughput phenotyping at whole-plant (high-throughputphenotyping using RGB cameras) or organ and tissue levels (NMR and MRI analyses). Of the range ofabiotic stresses that affect potato crops (see recent review [13]), the present study focused on the effectsof drought on yield and biomass. Water de�cit has an impact at a number of different stages of potatogrowth (see review [27]), so the present work has chosen to concentrate on the effects of dehydrationoccurring mostly during the tuber-�lling phase. This study concludes that the close monitoring of theresults of applied water stress, through the precise measurement of soil hydration status combined withthe use of phenotyping tools allows precise characterization of the effects of treatment. It does so bycontrolling variations in plant response by adjusting the physico-chemical environmental conditions thatdirectly impact such responses. NMR relaxation offers a promising technological tool in this approach tothe understanding of the effects of water stress on water distribution at tissue and cell level in leaftissues, and hence for the characterization of plant response to drought. In addition, MRI constitutes anon-destructive and powerful method to monitor stress-induced changes underground, in roots andtubers.
A multi-scale approach of this type could be used to undertake studies on the genetic variability of potatoplant responses to drought. It could also serve as a means to evaluate new practices such as the use ofseaweed extracts to stimulate plant drought resistance [31].
Page 12/26
5. Materials And Methods5. 1 PLANT MATERIALS
Plant growth conditions
Potato (Solanum tuberosum) tubers were produced by GERMICOPA (Quimper, France) under irrigated �eldconditions and stored while dormant at 4 °C until use for experimentation under controlled or semi-controlled conditions. The variety Rosanna was chosen for its relatively low sensitivity to drought. From abatch of calibratedpotatoes (28-35 mm), tubers were selected for homogeneous weight (average 23 +/- 2mg fresh weight). Before planting, they were pre-germinated in the dark at 20°C for two weeks and tuberswith 1 to 2 sprouts were retained. The plants were grown in 25L plastic pots (Airpot®, 27 cm diameter, 50cm high) �lled with a mixture (Falienor® ref. 992016F1) of sandy loam (40% v/v) and peat moss (60%v/v) with added clay (40kg/m3) and NPK (0.7 kg/m3 PG-MIX 14-16-18) (soil solution : pH 5,8 +/- 0.2 andEc (1/1,5) 0,7mS/cm). A single tuber was placed in each pot at 25 cm depth. All pots were �lled with thesame quantity of soil (17.4+/-0.1kg at soil humidity equivalent to 70% of �eld capacity). At shootemergence, two to three stems were present per pot. In the controlled environment, in order to optomizeplant phenotyping, thinning was carried out to retain only one stem per pot. Plants measurements beganat 15 days after shoot emergence (DASE) and continued until top kill day (55 DASE). Plants were grownunder either a controlled environment (using the Roullier high-throughput plant phenotyping platform anda greenhouse equipped with high-pressure sodium lights) or a semi-controlled environment (using anINRAE greenhouse equipped with an air-cooling system, X: 48° 5' 59.99" Y: -1° 48' 0"). In the controlledenvironment, the temperature regime was 22 (light phase)/19 (dark phase) °C and relative humidity was70 % with a light/dark cycle of 16/8hrs. In the semi-controlled environment, plants received natural lightwith a light/dark cycle of 15/9hrs at the start of measurements (0 DASE) and at �nal harvest (85 DASE),the longest light period being recorded at 50 DASE (16/8hrs). During the plant growth period (up to 57DASE), the temperature regime was 24.2 +/-1.1 (light phase)/14.7 +/-0.5 (dark phase) °C with a relativehumidity of 53.7+/-2.4 (light phase)/90.7+/- 0.7 (dark phase) %. Following top kill, the averagetemperature increased to 27.1 +/-1.2 (light phase) /17.9 +/-0.3 (dark phase) °C while the relative humiditydecreased to 49.0+/-2.9 (light phase)/85.3+/- 1.0 (dark phase) %.
Plant watering regimes
All plants were well watered from planting to 25 DASE. From 25 to 55 DASE, the experimental designcomprised three different watering regimes – a well-watered (Control) and mild (MWD) and severe (SWD)water de�cits – corresponding to soil humidity levels equivalent to 70 (Control), 40 (MWD) and 20 (SWD)% of �eld capacity. The amount of water supplied corresponded to around 100 (Control), 50 (MDW) and30 (SWD) % of evaporative demand. The amount of water to be supplied was determined by automaticweighing twice a day under controlled conditions and by daily manual weighing under semi-controlledconditions. From top kill day (57 DASE) the plants were top killed and watering ceased from 57 DASE to�nal tuber harvest.
Page 13/26
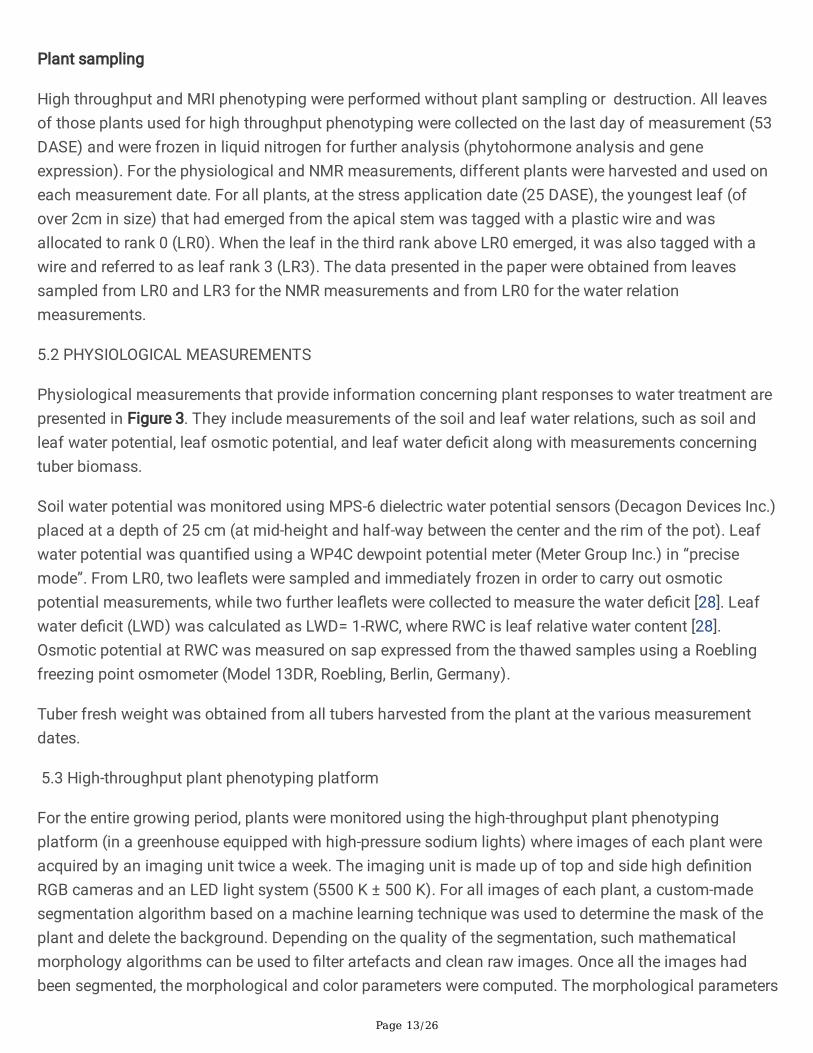
Plant sampling
High throughput and MRI phenotyping were performed without plant sampling or destruction. All leavesof those plants used for high throughput phenotyping were collected on the last day of measurement (53DASE) and were frozen in liquid nitrogen for further analysis (phytohormone analysis and geneexpression). For the physiological and NMR measurements, different plants were harvested and used oneach measurement date. For all plants, at the stress application date (25 DASE), the youngest leaf (ofover 2cm in size) that had emerged from the apical stem was tagged with a plastic wire and wasallocated to rank 0 (LR0). When the leaf in the third rank above LR0 emerged, it was also tagged with awire and referred to as leaf rank 3 (LR3). The data presented in the paper were obtained from leavessampled from LR0 and LR3 for the NMR measurements and from LR0 for the water relationmeasurements.
5.2 PHYSIOLOGICAL MEASUREMENTS
Physiological measurements that provide information concerning plant responses to water treatment arepresented in Figure 3. They include measurements of the soil and leaf water relations, such as soil andleaf water potential, leaf osmotic potential, and leaf water de�cit along with measurements concerningtuber biomass.
Soil water potential was monitored using MPS-6 dielectric water potential sensors (Decagon Devices Inc.)placed at a depth of 25 cm (at mid-height and half-way between the center and the rim of the pot). Leafwater potential was quanti�ed using a WP4C dewpoint potential meter (Meter Group Inc.) in “precisemode”. From LR0, two lea�ets were sampled and immediately frozen in order to carry out osmoticpotential measurements, while two further lea�ets were collected to measure the water de�cit [28]. Leafwater de�cit (LWD) was calculated as LWD= 1-RWC, where RWC is leaf relative water content [28].Osmotic potential at RWC was measured on sap expressed from the thawed samples using a Roeblingfreezing point osmometer (Model 13DR, Roebling, Berlin, Germany).
Tuber fresh weight was obtained from all tubers harvested from the plant at the various measurementdates.
5.3 High-throughput plant phenotyping platform
For the entire growing period, plants were monitored using the high-throughput plant phenotypingplatform (in a greenhouse equipped with high-pressure sodium lights) where images of each plant wereacquired by an imaging unit twice a week. The imaging unit is made up of top and side high de�nitionRGB cameras and an LED light system (5500 K ± 500 K). For all images of each plant, a custom-madesegmentation algorithm based on a machine learning technique was used to determine the mask of theplant and delete the background. Depending on the quality of the segmentation, such mathematicalmorphology algorithms can be used to �lter artefacts and clean raw images. Once all the images hadbeen segmented, the morphological and color parameters were computed. The morphological parameters
Page 14/26
linked to the development of plant architecture are the convex hull areas and projected areas for the topand side views along with the width and height for the side view. For the color parameter, the ExG indexwas computed (Excess Green Index Eq. 1). This index intensi�es the greenness of the plant for highervalues.
Equation 1:
5.4 Determination of Phytohormones using UHPLC-MS/MS
The leaves of potato plants for all tested conditions (Control, MWD and SWD) were harvested at 53 DASEand immediately frozen with liquid nitrogen and stored at -80 ºC for further phytohormonal and molecularanalyses.
Phytohormone abscisic acid (ABA) was analyzed using a UHPLC-MS/MS system. For the analysis, 10 mgground leaf samples were extracted using 70% methanol, 29% H2O and 1% formic acid containingisotope-labelled internal standards, and centrifuged at 12,600 rpm to collect the supernatant. Afterevaporation (SPE Dry 96, Biotage, Uppsala, Sweden), the extract was resuspended in a 2% formic acidsolution and puri�ed using a 30 mg/mL SPE ABN express plate (Biotage, Uppsala, Sweden). Thephytohormones were eluted with methanol, and the samples were evaporated and resuspended in 200 µLof 0.1% formic acid solution before injection into the system. The separation and detection were carriedout using a Nexera X2 UHPLC system (Shimadzu, Japan) coupled to a QTrap 6500+ mass spectrometer(Sciex, Concord, ON, Canada) equipped with an IonDrive turbo V electrospray (ESI) source. Phytohormoneseparation was carried out by injecting 2 µL into a Kinetex Evo C18 core-shell column (100 x 2.1 mm, 2.6µm, Phenomenex, Torrance, CA, USA) at a �ow rate of 0.7 mL min-1 and the column oven was kept at 40°C. The mobile phases, solvents A and B, were composed of Milli-Q water containing 0.1% formic acid(LCMS grade, Merck, Darmstadt, Germany) and acetonitrile containing 0.1% formic acid (LCMS grade,Fisher Optima, UK) respectively. The analysis was carried out in scheduled MRM in negative mode. Allquantitative data were processed using MultiQuant V 3.0.2 software (Sciex, Canada).
5.5 Gene expression analysis using real-time PCR
The harvested frozen leaf samples from the control and stressed potato plants were ground to a �nepowder under liquid nitrogen. Total RNA was extracted from 100mg ground samples using aNucleospin® 8 RNA kit in accordance with the manufacturer’s protocol (Macherey-Nagel, Düren,Germany). The quality and yield of extracted RNA samples were analysed and checked in a 4200Tapestation (Agilent Technologies, USA) and were then subjected to simultaneous DNase treatment andcDNA synthesis from 1 μg RNA using an iScriptTM gDNA clear cDNA synthesis kit (BioRad, CA, USA).Quantitative RT-PCR (qRT-PCR) analysis was performed on a total volume of 10 μl using Universal SYBRGreen Supermix (Bio-Rad, CA, USA)) in a Real-Time PCR Detection System (Bio-Rad, CA, USA). The qRT-
Page 15/26
PCR reactions were obtained in technical triplicates using independent cDNA reactions for each biologicalreplicate and 300 nM of gene-speci�c primer pairs (Supplementary Table S2). The thermal cycler protocolincluded preincubation at 98 °C for 3 min, �rst followed by 40 cycles of ampli�cation, each consisting ofdenaturation for 15 s at 98°C, then by annealing for 30 s at 60°C and then by elongation at 72 °C for 15swith a �nal 5-min extension at 72 °C. Additionally, a melting curve analysis was performed at the end ofeach assay to con�rm the absence of multiple products or primer dimers. The expression of all candidategenes was normalized against four potato reference genes, namely, StRPL2, StEF1α, StActin andStGAPDH. Speci�c primers for all candidate genes were designed using Primer3 software and are listed inSupplementary Table 1. Primer e�ciency for each gene (target genes and reference genes) wascalculated by the standard curve method using the appropriate dilution series. All qPCR expression datawere acquired and analyzed using CFX Maestro Software Version 1.0 (BIO-RAD, CA, USA).
5.6 NMR relaxometry
For plants grown under semi-controlled environments, the youngest leaf of each plant at 25 DASE wastagged and considered to be leaf rank 0. NMR measurements were performed on the �ve to six oldestleaves of each plant. To achieve this, one or two leaves older and three leaves younger than the referencesenescing leaf (rank 0) from plants grown under optimal and SWD conditions were analyzed.
Transverse relaxation measurements were performed on a 20 MHz spectrometer (Minispec PC-120,Bruker, Karlsruhe, Germany). Analyses were successively performed on six fully expanded leaves (leafranks -2 to +3 by reference to the tag) of four individual plants (corresponding to four replicates) for eachControl and MWD conditions. In some cases where plants were at later stages of development, no leavesat LR -2 were present on the plant and only 5 leaves were analyzed. 4 discs 8 mm in diameter wereexcised from three external lea�ets (12 in all), without either cutting off the leaf or uprooting the plant. Toobtain homogeneous tissues, the discs were taken from each side of the central vein as close as possibleto the vein and avoiding lateral nervures. The discs were then placed in NMR tubes which were coveredwith a 3-cm-long Te�on cap to avoid water loss during measurement. The temperature of the samplesinside the NMR probe was set at 18°C. Transverse relaxation times were measured using the Carr-Purcell-Meiboom-Gill (CPMG) sequence with a 90°–180° pulse spacing of 0.2 ms and 64 averages. The numberof successive echoes recorded was adjusted for each sample according to its T2. The recycle delay of thesamples was adjusted following measurement of the longitudinal relaxation time (T1) with a fast-saturation-recovery sequence. The measurement time for T2 (including spectrometer adjustments andthe T1 measurement) was about 10 min per sample. The CPMG signal was �tted using Scilab softwarein accordance with the maximum entropy method (MEM) [Mariette F, Data Handl Sci Technol 1996],which provides a continuous distribution of relaxation time components with no assumption concerningtheir number. In this representation, the peaks of the distribution are centered on the corresponding mostprobable T2 values, while the peak areas correspond to the intensity of the T2 components. For each leafrank, when the number of T2 vacuolar components was not identical across all repetitions (one or two,depending the repetition), NMR data were averaged only in homogenous groups of repetitions, with thesame number of vacuolar components.
Page 16/26
5.7 MRI acquisition and image treatment
3D images of the underground part of the potato plant in pots were recorded on a 1.5 T MRI scanner(Magnetom Avanto, Siemens, Erlangen, Germany) equipped with a circular polarized head array coil. Themother tuber was placed about 25 cm deep in pots with a height of 50 cm. Tubers were allowed to growunder a de�ned water intake regime (Control and MWD). Measurements were carried out 7 times over 8months corresponding to the period from the initation of tuberization until tuber harvest. Pots wereplaced horizontally inside the MRI tunnel and their centers were carefully marked before the �rst MRIexperiment in order to maintain the same position for subsequent experiments during the growingprocess. All images were acquired using a standard 3-dimensional (3D) Fast Spin Echo (FSE) sequencewith the following parameters: imaging matrix 256x256, Field of View (FOV) 256x256 mm², slicethickness 1.1 mm, �ip angle 170°, repetition time (TR) 400 ms, echo time (TE) 37 ms, echo train length(ETL) 16, bandwidth (BW) 199 Hz/pixel, 1 average and 50% interpolation in the slice direction.Experiments were conducted at room temperature.
Image processing was performed using Seg3D V2.4.0 (SCI University of Utah). Semi-automated tubersegmentation consisted of three main steps: i) manual contouring of each tuber (seed) on one slice intwo of the 192 coronal-acquired slices; ii) automatic segmentation using “Segmentation Level Set”, abuilt-in advanced �lter, to expand manually-segmented seeds to include any surrounding pixels that arestatistically matched with those within the selection; iii) manual adjustment of automatically drawnmasks, if necessary. Then, a 3D Object Counter plugin in ImageJ V1.53b (National Institute of Health)was applied on the generated masks in order to count the 3D objects (corresponding to tubers) in theimage stack and to quantify the volume of each tuber. This allowed the number and spatial distributionof tubers to be determined, and their individual volume to be quanti�ed for the analysis period.
DeclarationsETHICS APPROVAL AND CONSENT TO PARTICIPATE
Not applicable
CONSENT FOR PUBLICATION
Not applicable
AVAILABILITY OF DATA AND MATERIAL
All data generated or analyzed during this study are included in this published article (and itssupplementary information �les).
COMPETING INTEREST
The authors declare that they have no competing interests
Page 17/26
FUNDING
This work is a part of the “TuberBioScan” research project funded by the Brittany regional authority andan ERDF (FEDER fund) “Cross-sector collaborative innovation” grant.
AUTHORS' CONTRIBUTIONS
Research program design: MM, BB, GJ, FM, FJ, AB, CD and LL; NMR and MRI experiments and dataanalysis: MM, GH, JP, SQ, SC, MC, FM and LL; High throughput and gene expression experiments anddata analysis: NA, BB, CF, CN, and FJ; Physiological experiments and data collection: PL, Cd and LL;Discussion of data and production of the paper: MM, GH, NA BB, GJ, CD and LL.
ACKNOWLEDGEMENTS
We are most grateful to the PRISM core facility (Rennes-Angers, France) for access to its facilities, andthe GIS Biogenouest
References1. FAOSTATS: Food and Agriculture Organization of the United Nations (FAO) - Statistics Division. In.;
2020.
2. Salter P, Goode J: Crop responses; to water stress at different stages of growth. East Mailing,Maidstone, Kent, Commonwealth Bureau of Horticulture and Plantation Crops (Resources ResearchSeries, 2) 1967.
3. Van Loon C: The effect of water stress on potato growth, development, and yield. American PotatoJournal 1981, 58(1):51-69.
4. Yuan BZ, Nishiyama S, Kang YH: Effects of different irrigation regimes on the growth and yield ofdrip-irrigated potato. Agricultural Water Management 2003, 63(3):153-167.
5. Iwama K, Yamaguchi J: Abiotic stresses. Handbook of potato production, improvement andpostharvest management Food Product Press, New York 2006:231-278.
�. Jefferies R: Responses of potato genotypes to drought. I. Expansion of individual leaves andosmotic adjustment. Annals of Applied Biology 1993, 122(1):93-104.
7. Eiasu BK, Soundy P, Hammes PS: Response of potato (Solanum tuberosum) tuber yield componentsto gel-polymer soil amendments and irrigation regimes. New Zealand Journal of Crop andHorticultural Science 2007, 35(1):25-31.
�. Scha�eitner R, Rosales ROG, Gaudin A, Aliaga CAA, Martinez GN, Marca LRT, Bolivar LA, Delgado FM,Simon R, Bonierbale M: Capturing candidate drought tolerance traits in two native Andean potatoclones by transcription pro�ling of �eld grown plants under water stress. Plant Physiology andBiochemistry 2007, 45(9):673-690.
Page 18/26
9. Bhargava S, Sawant K: Drought stress adaptation: metabolic adjustment and regulation of geneexpression. Plant Breeding 2013, 132(1):21-32.
10. Mane SP, Robinet CV, Ulanov A, Scha�eitner R, Tincopa L, Gaudin A, Nomberto G, Alvarado C, Solis C,Bolivar LA: Molecular and physiological adaptation to prolonged drought stress in the leaves of twoAndean potato genotypes. Functional Plant Biology 2008, 35(8):669-688.
11. Vasquez-Robinet C, Mane SP, Ulanov AV, Watkinson JI, Stromberg VK, De Koeyer D, Scha�eitner R,Willmot DB, Bonierbale M, Bohnert HJ: Physiological and molecular adaptations to drought inAndean potato genotypes. Journal of experimental botany 2008, 59(8):2109-2123.
12. Araus JL, Kefauver SC, Zaman-Allah M, Olsen MS, Cairns JE: Translating high-throughputphenotyping into genetic gain. Trends in plant science 2018, 23(5):451-466.
13. Berger B, Parent B, Tester M: High-throughput shoot imaging to study drought responses. Journal ofexperimental botany 2010, 61(13):3519-3528.
14. Musse M, De Franceschi L, Cambert M, Sorin C, Le Caherec F, Burel A, Bouchereau A, Mariette F,Leport L: Structural changes in senescing oilseed rape leaves at tissue and subcellular levelsmonitored by Nuclear Magnetic Resonance relaxometry through water status. Plant Physiology 2013,163(1):392-406.
15. Sorin C, Mariette F, Musse M: NMR study of fresh cut salads: In�uence of temperature and storagetime on leaf structure and water distribution in escarole. Magnetic Resonance in Chemistry 2019,57(9):626-637.
1�. Sorin C, Mariette F, Musse M, Leport L, Cruz F, Yvin J-C: Leaf Development Monitoring and EarlyDetection of Water De�ciency by Low Field Nuclear Magnetic Resonance Relaxation in Nicotianatabacum Plants. Applied Sciences 2018, 8(6):943.
17. Van As H: Intact plant MRI for the study of cell water relations, membrane permeability, cell-to-celland long distance water transport. Journal of Experimental Botany 2007, 58(4):743-756.
1�. Sorin C, Musse M, Mariette F, Bouchereau A, Leport L: Assessment of nutrient remobilization throughstructural changes of palisade and spongy parenchyma in oilseed rape leaves during senescence.Planta 2015, 241(2):333-346.
19. van Dusschoten D, Metzner R, Kochs J, Postma JA, P�ugfelder D, Bühler J, Schurr U, Jahnke S:Quantitative 3D Analysis of Plant Roots Growing in Soil Using Magnetic Resonance Imaging. PlantPhysiology 2016, 170:1176-1188.
20. Pohlmeier A, Oros-Peusquens A, Javaux M, Menzel MI, Vanderborght J, Kaffanke J, Romanzetti S,Lindenmair J, Vereecken H, Shah NJ: Changes in Soil Water Content Resulting from Ricinus RootUptake Monitored by Magnetic Resonance Imaging. Vadose Zone Journal 2008, 7(3):1010-1017.
21. Hillnhutter C, Sikora RA, Oerke E-C, Van Dusschoten D: Nuclear magnetic resonance: a tool forimaging belowground damage caused by Heterodera schachtii and Rhizoctonia solani on sugarbeet. Journal of Experimental Botany 2012, 63(1):319-327.
22. Kamenetsky R, Zemah H, Ranwala AP, Vergeldt F, Ranwala NK, Miller WB, Van As H, Bendel P: Waterstatus and carbohydrate pools in tulip bulbs during dormancy release. New Phytologist 2003,
Page 19/26
158(1):109-118.
23. Van der Toorn A, Zemah H, Van As H, Bendel P, Kamenetsky R: Developmental changes and waterstatus in tulip bulbs during storage: visualization by NMR imaging. Journal of Experimental Botany2000, 51(348):1277-1287.
24. Blum A: Stress, strain, signaling, and adaptation–not just a matter of de�nition. Journal ofExperimental Botany 2016, 67(3):562-565.
2�. Agarwal P, Jha B: Transcription factors in plants and ABA dependent and independent abiotic stresssignalling. Biologia Plantarum 2010, 54(2):201-212.
27. Obidiegwu JE, Bryan GJ, Jones HG, Prashar A: Coping with drought: stress and adaptive responsesin potato and perspectives for improvement. Frontiers in Plant Science 2015, 6.
2�. Turner NC: Techniques and experimental approaches for the measurement of plant water status.Plant and Soil 1981, 58(1):339-366.
29. Rolando JL, Ramírez DA, Yactayo W, Monneveux P, Quiroz R: Leaf greenness as a drought tolerancerelated trait in potato (Solanum tuberosum L.). Environmental and Experimental Botany 2015,110:27-35.
30. Levy D, Coleman WK, Veilleux RE: Adaptation of potato to water shortage: irrigation managementand enhancement of tolerance to drought and salinity. American Journal of Potato Research 2013,90(2):186-206.
31. Shukla PS, Shotton K, Norman E, Neily W, Critchley AT, Prithiviraj B: Seaweed extract improve droughttolerance of soybean by regulating stress-response genes. AoB Plants 2018, 10(1):plx051.
Figures
Page 20/26
Figure 1
Impact of water stress on phenotyping parameters. Evolution measured in Days After Shoot Emergence(DASE) of (a, b) the hull area and projected area from the top view camera (leaf coverage), (c, d) the hullarea and projected area from the side view camera, (e, f) height and width from the side view camera and(g) the ExG index. All parameters were computed from the day of transplantation into the soil to the dayof harvest. For all of the mentioned parameters, a signi�cant difference between the three conditions was
Page 21/26
observed from 34 to 53 DASE. Refer to Supplementary Table S1 for further details regarding statisticaldata.
Figure 2
Concentration of phytohormone abscisic acid (ABA) and relative expression of selected drought-responsive genes in potato leaves under Control, Mild (MWD) and Severe (SWD) water de�cit conditions.(a) Concentration of ABA in the potato leaves; (b) relative expression levels of ABA-dependenttranscription factors in the potato leaves; (c) relative expression levels of ABA-independent transcriptionfactors in the potato leaves and (d) relative expression levels of selected drought-inducible genes in thepotato leaves. Bars show means ± SEM of 7 biological replicates. Different letters denote signi�cantdifferences according to ANOVA followed by a Tukey HSD test (p<0.05; n=7).
Page 22/26
Figure 3
Comparison of the evolution of water parameters and tuber production under Control and Severe WaterDe�cit (SWD) conditions during �lling. (a) Evolution plotted according to Days After Shoot Emergence(DASE) of (a) soil water potential, (b) leaf water potential, (c) leaf osmotic potential, (d) leaf water de�citand (e) total fresh weight of potato tubers from individual plants; (f) fresh weight gain of the nine largesttubers of individual plants, from biggest (tub 1) to smallest (tub 9) during the tuber �lling period (38 DASE
Page 23/26
to harvest). Outline arrow indicates stress application date and full arrow indicates top-kill date. Valuesare means ± S.E. of 4 independent plants for each condition.
Figure 4
Evolution plotted according to Days After Shoot Emergence (DASE) of NMR relaxation parameter T2 ofyoung (a) and mature (b) potato leaves (referring to the �rst measurement date) from plants grown underControl and Severe Water De�cit (SWD) conditions. Parameters correspond to vacuolar water from small
Page 24/26
(vs), large (vl) or all (vt) mesophyll cells (see [13] for further details).Values correspond to averages ofmaximum 4 leaves. Standard deviation is shown when value corresponds to averages of 3-4 leaves.
Figure 5
a) 3D view reconstructed from 3D TSE MRI images of the underground organs of a potato plant 73 DaysAfter Shoot Emergence (DASE). b) 3D TSE MRI images (TE = 37 ms, TR = 400 ms, BW = 199 Hz/pixel,1x1x1.1 mm3 voxel) of potato tubers in soil at three growing stages determined according to days after
Page 25/26
shoot emergence (columns from left to right: 32, 39, and 73 DASE). Rows correspond to 1 mm frames(from top to bottom: F-1 to F-3 separated by 5 mm). See Fig.6 (c) for growth curves of Tubers A (TA) andB (TB). The mother tuber (TM) was placed in the middle of the container, seen in the center of the picture.Dashed red lines represent the edge of the container. Differences in soil aspect are due to different levelsof soil hydration on the measurement day. The xy slice in (a) corresponds to F-2 at 73 DASE in (b).
Figure 6
Page 26/26
Evolution of mean number of tubers (ab) and mean total volume of tubers (b) during growth of theControl and MWD potato plants expressed as Days After Shoot Emergence (DASE). For the same DASE,values labelled with different letters denote signi�cant differences according to ANOVA followed by aTukey HSD test (p<0.05; n=4). c) Individual growth curves of Tubers A and B shown in the MRI images inFigure 5b.
Supplementary Files
This is a list of supplementary �les associated with this preprint. Click to download.