Page 1
KANSAS STATE U N I V E R S I T Y
Jesse Poland Wheat Genetics Resource Center
Applied Wheat Genomics Innovation Lab
Kansas State University, USA
Genomic Selection & Precision Phenotyping
March 27, 2014
1
Borlaug Global Summit, Cd. Obregon, Mexico
Borlaug Global Summit, Cd. Obregon, Mexico
March 27, 2014
Page 2
KANSAS STATE U N I V E R S I T Y
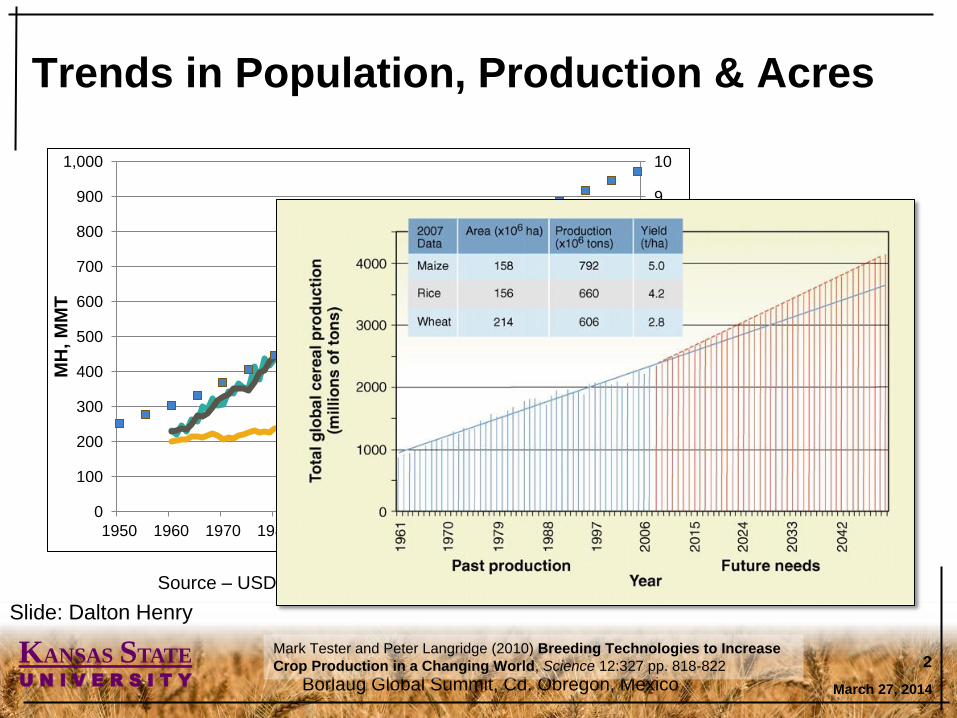
Trends in Population, Production & Acres
0
1
2
3
4
5
6
7
8
9
10
0
100
200
300
400
500
600
700
800
900
1,000
1950 1960 1970 1980 1990 2000 2010 2020 2030 2040 2050
Po
pu
lati
on
(b
il)
MH
, M
MT
Acreage
Production
Demand
Population
Source – USDA and UN Population Database
Slide: Dalton Henry
656 696
500
520
540
560
580
600
620
640
660
680
700
04/05 05/06 06/07 07/08 08/09 09/10 10/11 11/12 12/13 13/14
MM
T
Production Use
March 27, 2014
2
Borlaug Global Summit, Cd. Obregon, Mexico
Mark Tester and Peter Langridge (2010) Breeding Technologies to Increase
Crop Production in a Changing World, Science 12:327 pp. 818-822
Page 3
KANSAS STATE U N I V E R S I T Y
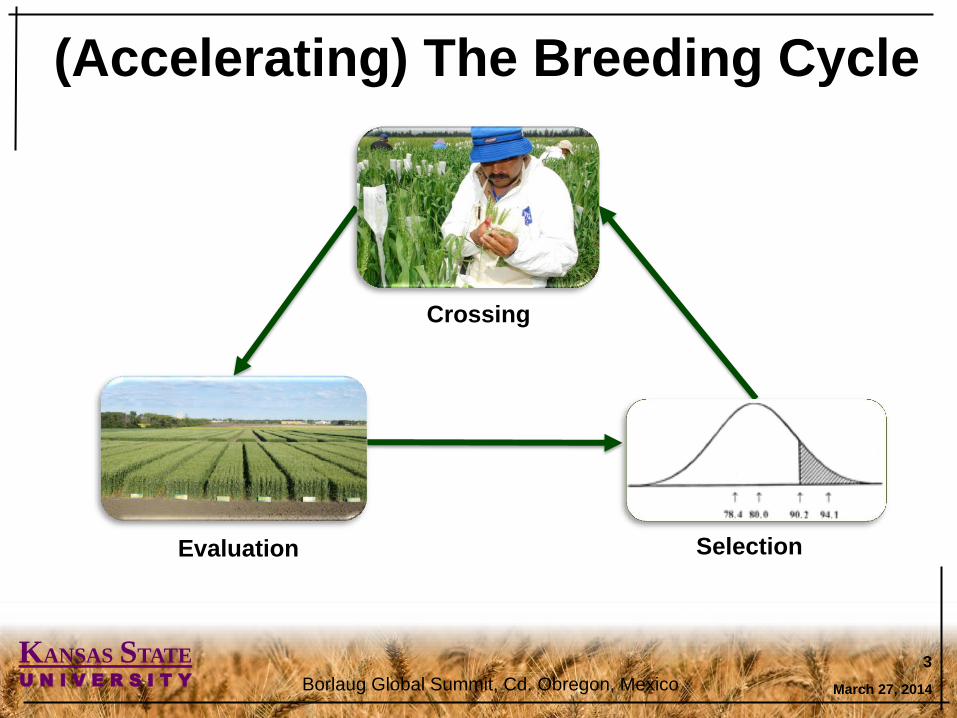
(Accelerating) The Breeding Cycle
March 27, 2014
3
Crossing
Evaluation Selection
Borlaug Global Summit, Cd. Obregon, Mexico
Page 4
KANSAS STATE U N I V E R S I T Y
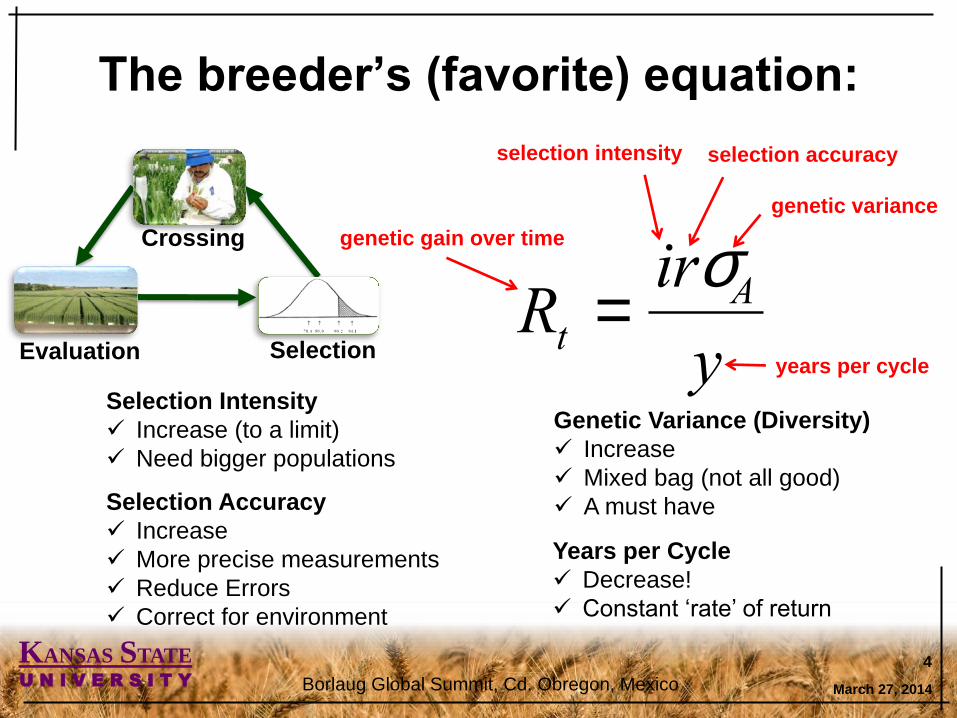
The breeder’s (favorite) equation:
March 27, 2014
4
Rt =irsAy
genetic gain over time
years per cycle
selection intensity selection accuracy
genetic variance
Crossing
Evaluation Selection
Borlaug Global Summit, Cd. Obregon, Mexico
Selection Intensity
Increase (to a limit)
Need bigger populations
Selection Accuracy
Increase
More precise measurements
Reduce Errors
Correct for environment
Genetic Variance (Diversity)
Increase
Mixed bag (not all good)
A must have
Years per Cycle
Decrease!
Constant ‘rate’ of return
Page 5
KANSAS STATE U N I V E R S I T Y
Genomic Selection & Precision Phenotyping
Dec 2, 2013
5
NOT NEW CONCEPTS!
Phenotype is what we eat!
Phenotype results from complex process of
genetics and environment.
We can improve the environment (i.e. Agronomy) and
we can improve the genetics (i.e. Breeding)
Use field testing to ‘observe’ the underlying
genetics
- (GBS) ‘genotyping-by-seeing’
Page 6
KANSAS STATE U N I V E R S I T Y
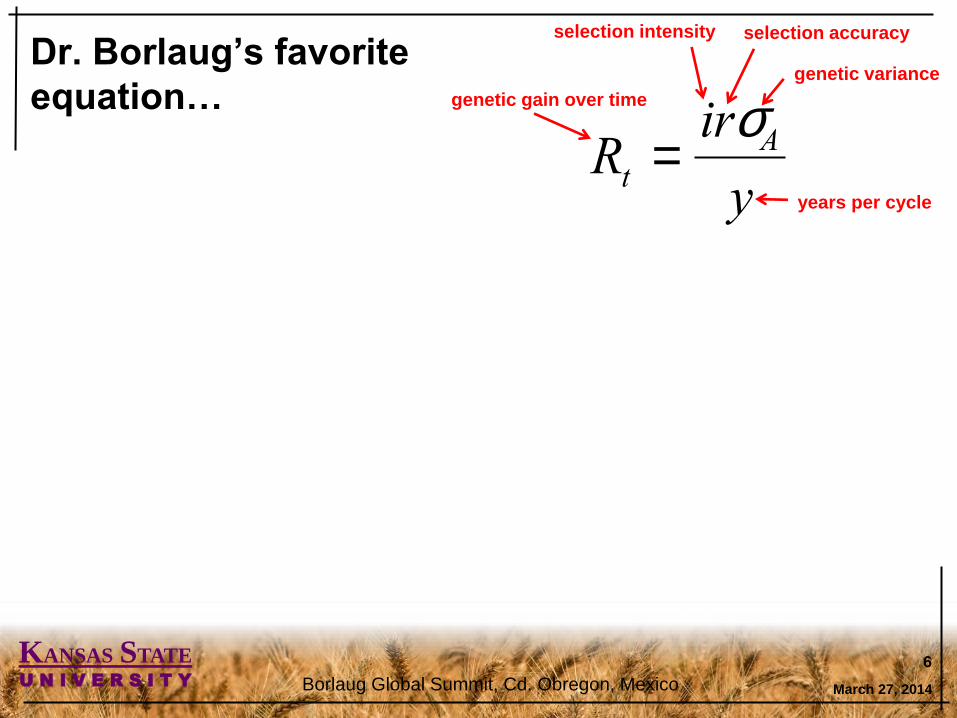
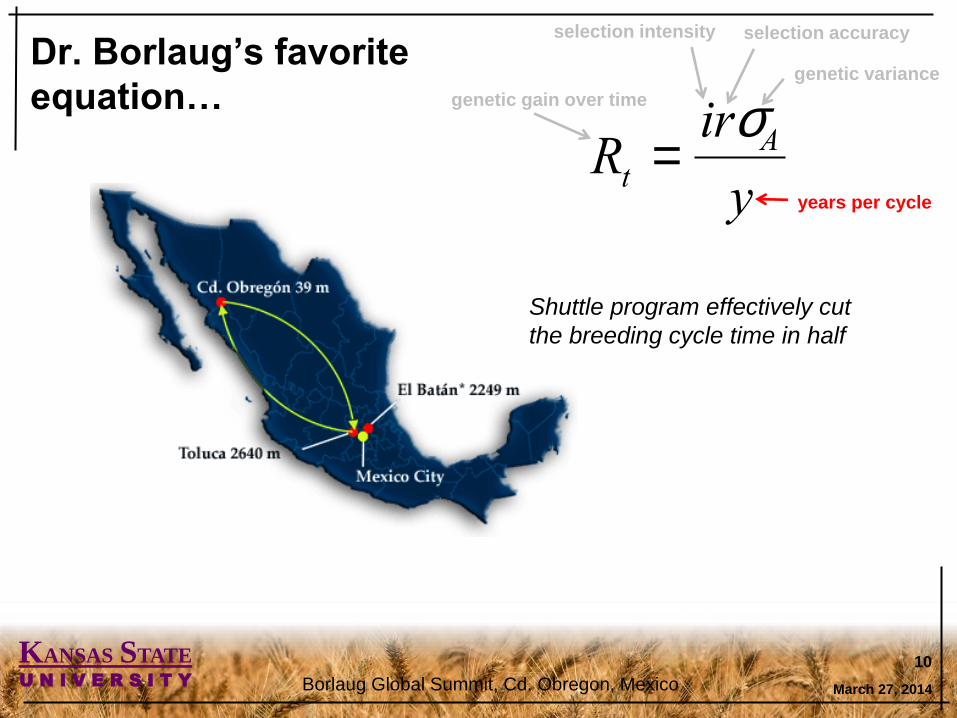
Dr. Borlaug’s favorite
equation…
March 27, 2014
6
Rt =irsAy
genetic gain over time
years per cycle
selection intensity selection accuracy
genetic variance
Borlaug Global Summit, Cd. Obregon, Mexico
Page 7
KANSAS STATE U N I V E R S I T Y
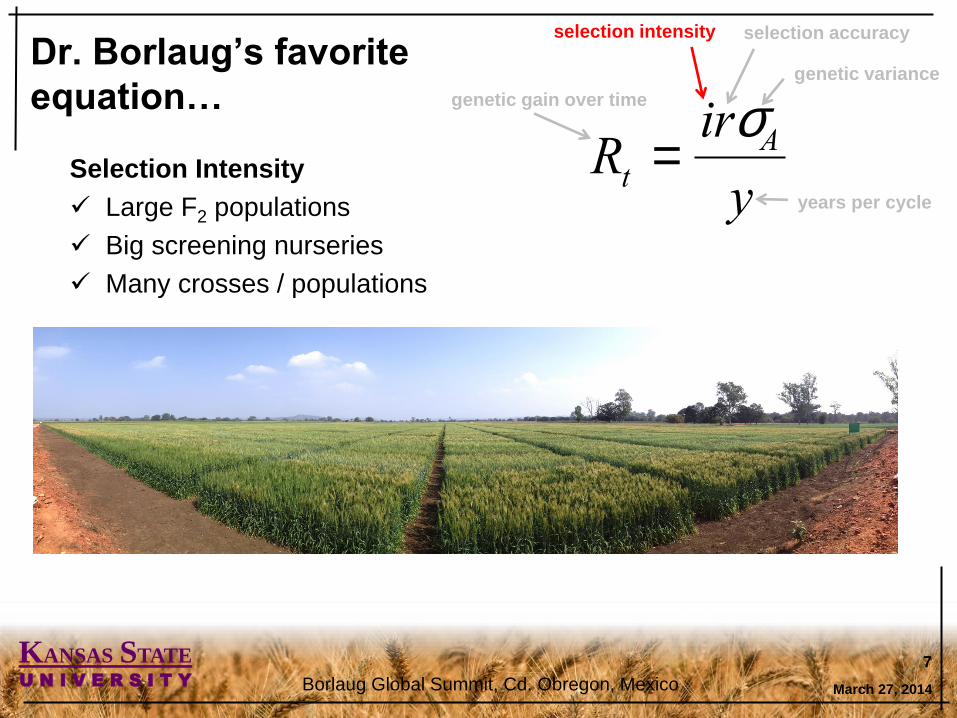
Dr. Borlaug’s favorite
equation…
March 27, 2014
7
Rt =irsAy
genetic gain over time
years per cycle
selection intensity selection accuracy
genetic variance
Borlaug Global Summit, Cd. Obregon, Mexico
Selection Intensity
Large F2 populations
Big screening nurseries
Many crosses / populations
Page 8
KANSAS STATE U N I V E R S I T Y
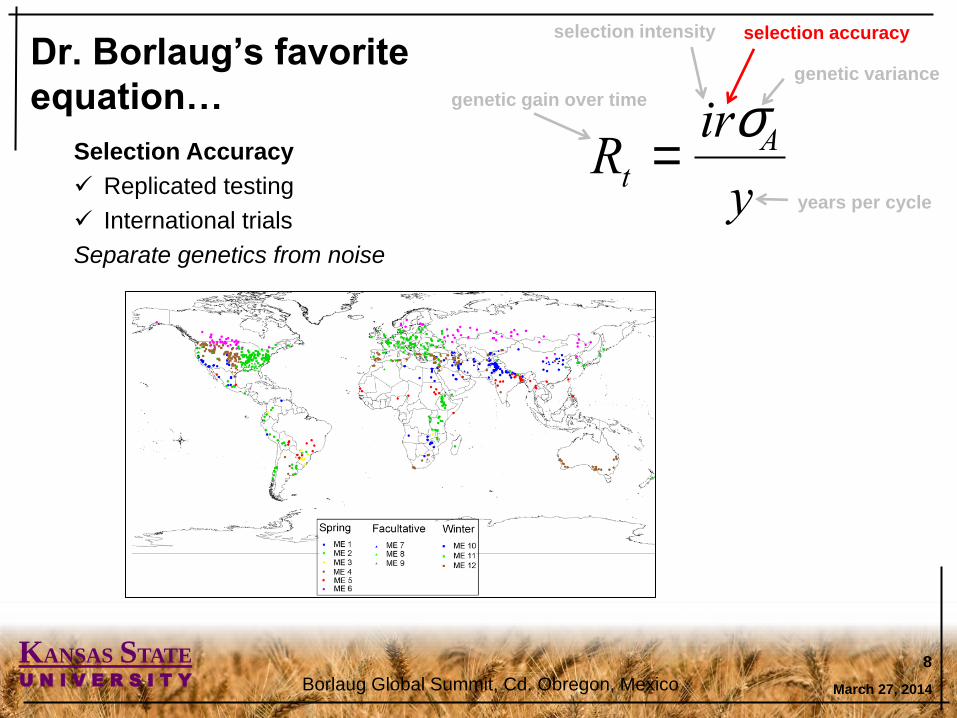
Dr. Borlaug’s favorite
equation…
March 27, 2014
8
Rt =irsAy
genetic gain over time
years per cycle
selection intensity selection accuracy
genetic variance
Borlaug Global Summit, Cd. Obregon, Mexico
Selection Accuracy
Replicated testing
International trials
Separate genetics from noise
Page 9
KANSAS STATE U N I V E R S I T Y
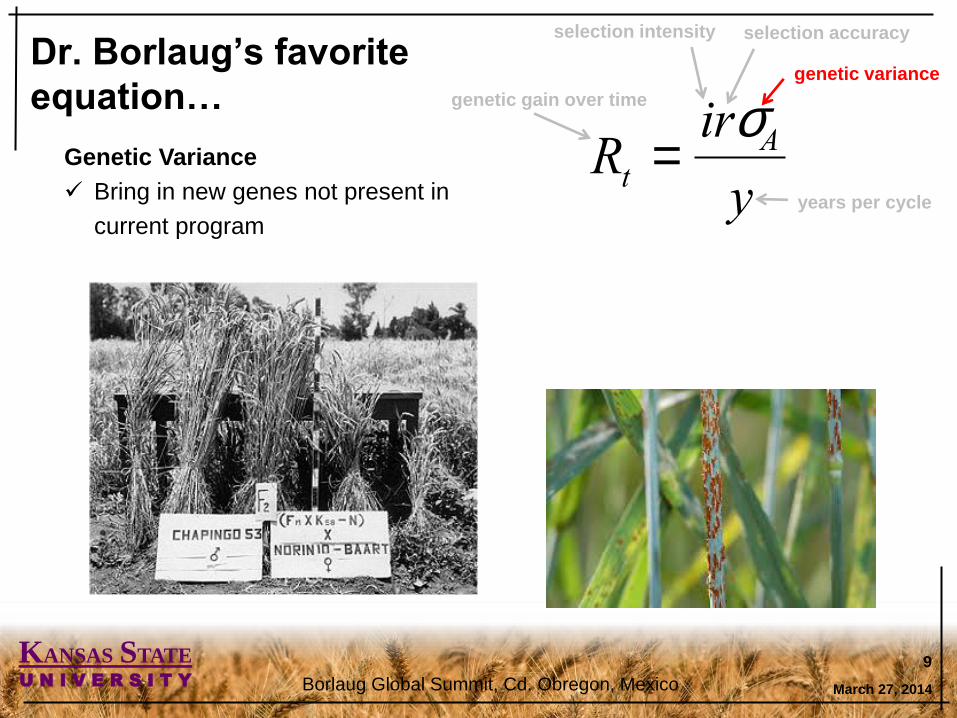
Dr. Borlaug’s favorite
equation…
March 27, 2014
9
Rt =irsAy
genetic gain over time
years per cycle
selection intensity selection accuracy
genetic variance
Borlaug Global Summit, Cd. Obregon, Mexico
Genetic Variance
Bring in new genes not present in
current program
Page 10
KANSAS STATE U N I V E R S I T Y
Dr. Borlaug’s favorite
equation…
March 27, 2014
10
Rt =irsAy
genetic gain over time
years per cycle
selection intensity selection accuracy
genetic variance
Borlaug Global Summit, Cd. Obregon, Mexico
Shuttle program effectively cut
the breeding cycle time in half
Page 11
KANSAS STATE U N I V E R S I T Y
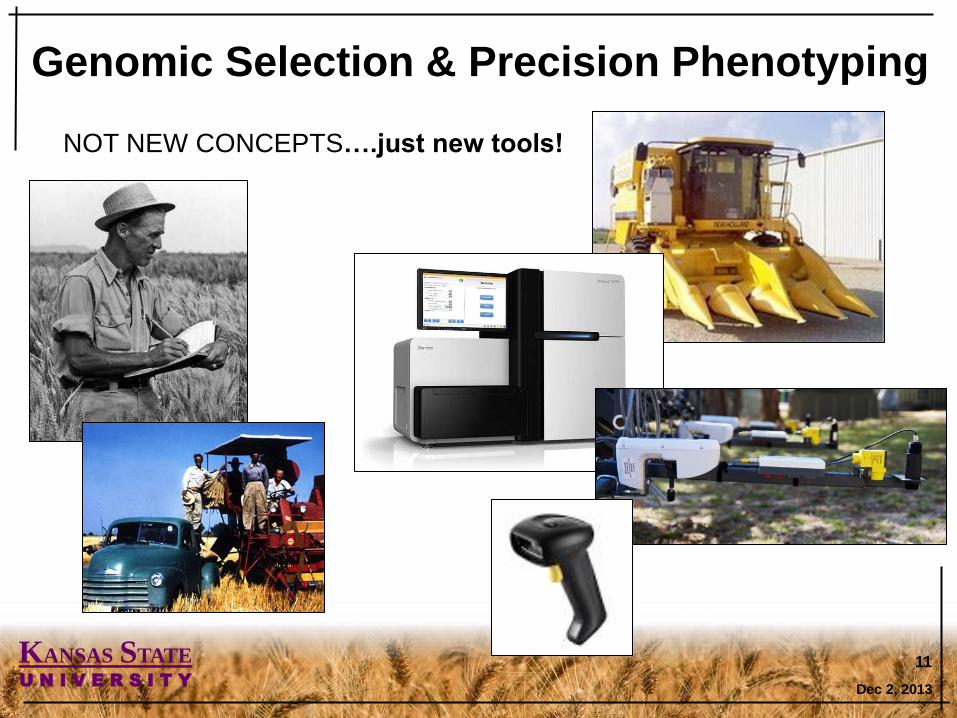
Genomic Selection & Precision Phenotyping
Dec 2, 2013
11
NOT NEW CONCEPTS….just new tools!
Page 12
KANSAS STATE U N I V E R S I T Y
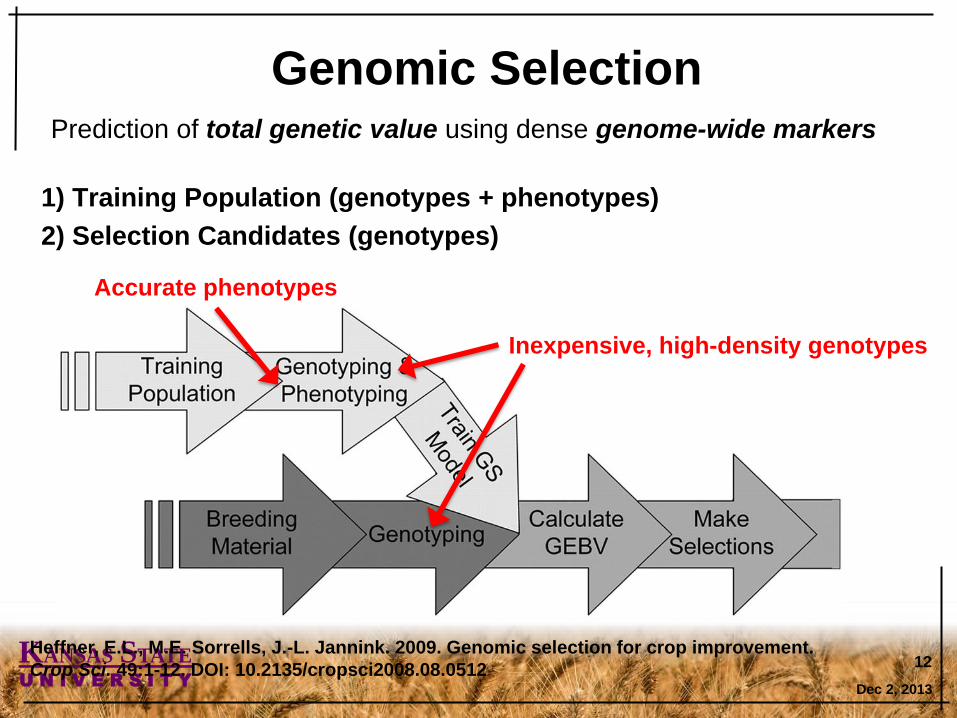
Genomic Selection
1) Training Population (genotypes + phenotypes)
2) Selection Candidates (genotypes)
Dec 2, 2013
12 Heffner, E.L., M.E. Sorrells, J.-L. Jannink. 2009. Genomic selection for crop improvement.
Crop Sci. 49:1-12. DOI: 10.2135/cropsci2008.08.0512
Inexpensive, high-density genotypes
Accurate phenotypes
Prediction of total genetic value using dense genome-wide markers
Page 13
KANSAS STATE U N I V E R S I T Y
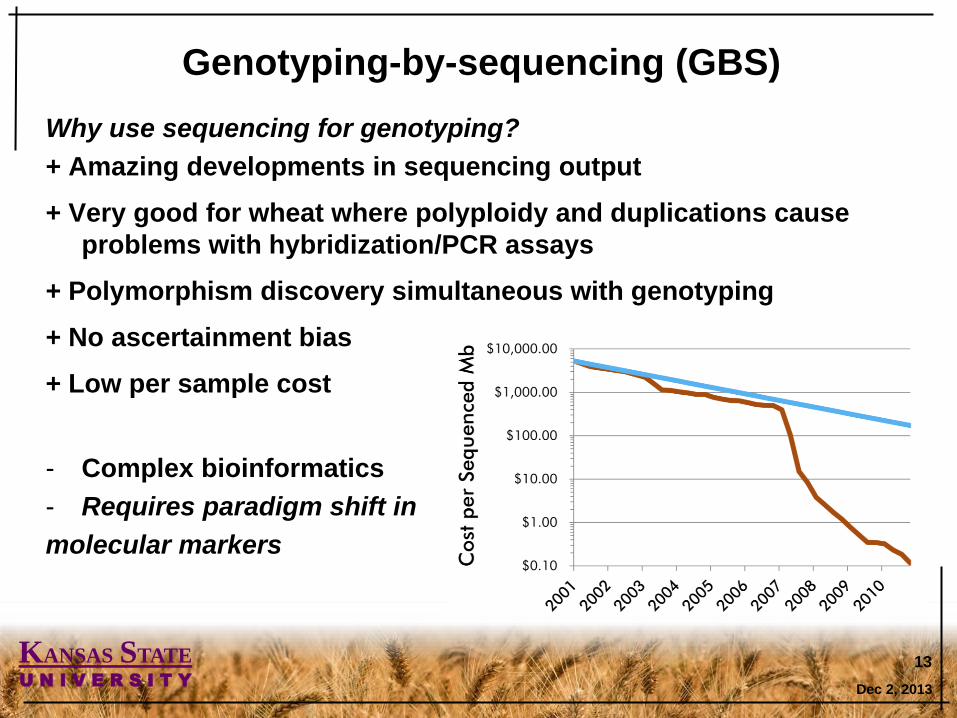
Why use sequencing for genotyping?
+ Amazing developments in sequencing output
+ Very good for wheat where polyploidy and duplications cause
problems with hybridization/PCR assays
+ Polymorphism discovery simultaneous with genotyping
+ No ascertainment bias
+ Low per sample cost
- Complex bioinformatics
- Requires paradigm shift in
molecular markers
Dec 2, 2013
13
Genotyping-by-sequencing (GBS)
Page 14
KANSAS STATE U N I V E R S I T Y
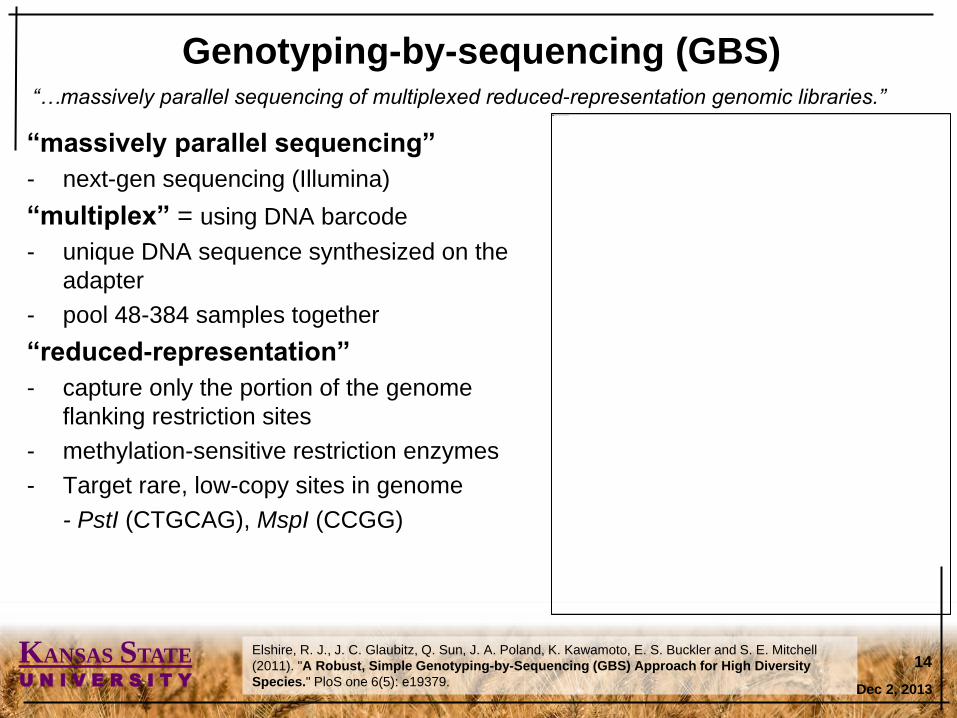
Genotyping-by-sequencing (GBS)
“massively parallel sequencing”
- next-gen sequencing (Illumina)
“multiplex” = using DNA barcode
- unique DNA sequence synthesized on the
adapter
- pool 48-384 samples together
“reduced-representation”
- capture only the portion of the genome
flanking restriction sites
- methylation-sensitive restriction enzymes
- Target rare, low-copy sites in genome
- PstI (CTGCAG), MspI (CCGG)
14
“…massively parallel sequencing of multiplexed reduced-representation genomic libraries.”
Elshire, R. J., J. C. Glaubitz, Q. Sun, J. A. Poland, K. Kawamoto, E. S. Buckler and S. E. Mitchell
(2011). "A Robust, Simple Genotyping-by-Sequencing (GBS) Approach for High Diversity
Species." PloS one 6(5): e19379. Dec 2, 2013
Page 15
KANSAS STATE U N I V E R S I T Y
Dec 2, 2013
15
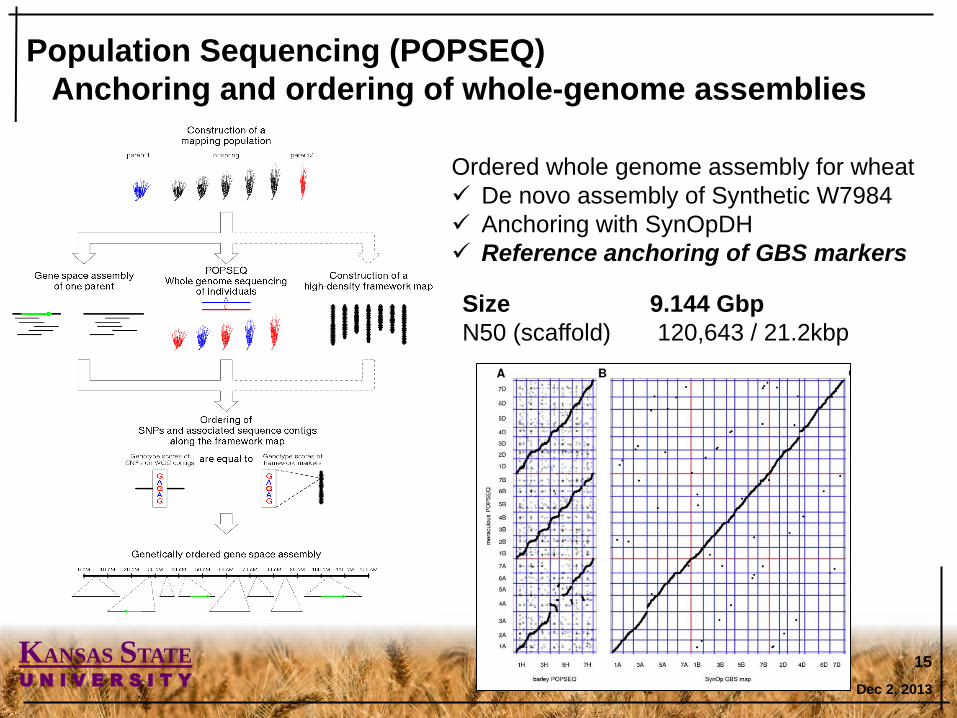
Population Sequencing (POPSEQ)
Anchoring and ordering of whole-genome assemblies
Ordered whole genome assembly for wheat
De novo assembly of Synthetic W7984
Anchoring with SynOpDH
Reference anchoring of GBS markers
Size 9.144 Gbp
N50 (scaffold) 120,643 / 21.2kbp
Page 16
KANSAS STATE U N I V E R S I T Y
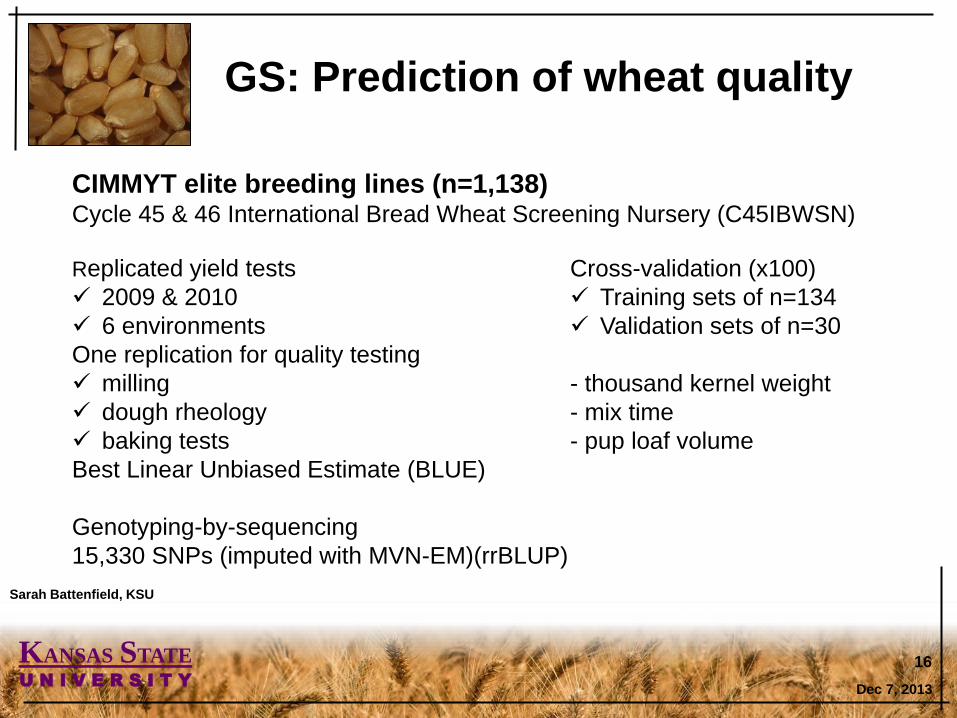
GS: Prediction of wheat quality
Dec 7, 2013
16
CIMMYT elite breeding lines (n=1,138) Cycle 45 & 46 International Bread Wheat Screening Nursery (C45IBWSN)
Replicated yield tests
2009 & 2010
6 environments
One replication for quality testing
milling
dough rheology
baking tests
Best Linear Unbiased Estimate (BLUE)
Genotyping-by-sequencing
15,330 SNPs (imputed with MVN-EM)(rrBLUP)
Cross-validation (x100)
Training sets of n=134
Validation sets of n=30
- thousand kernel weight
- mix time
- pup loaf volume
Sarah Battenfield, KSU
Page 17
KANSAS STATE U N I V E R S I T Y
Dec 7, 2013
17
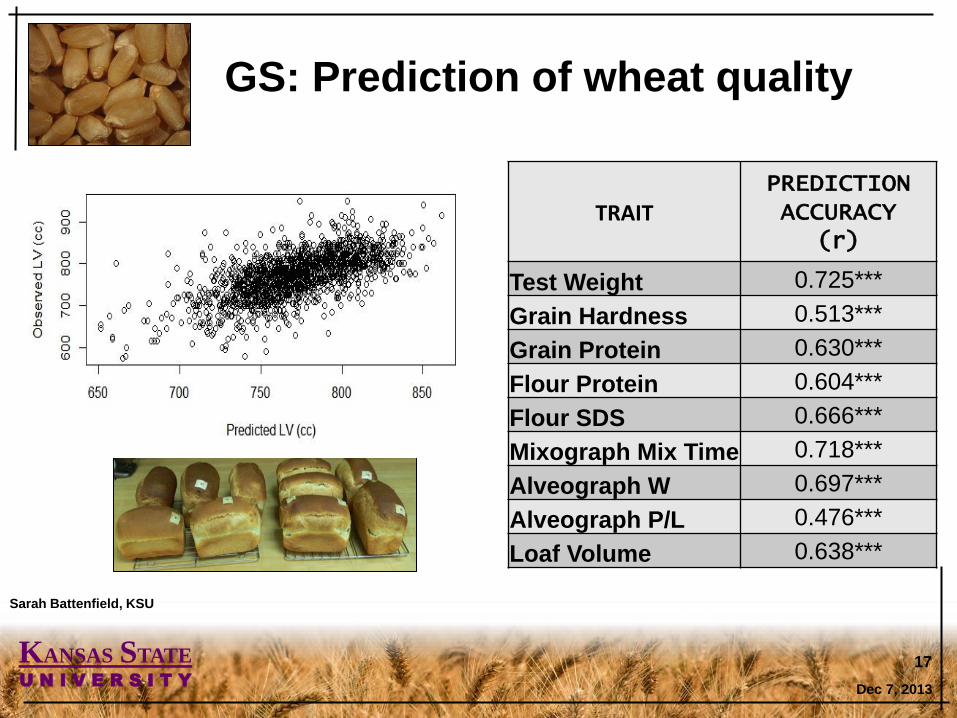
GS: Prediction of wheat quality
Sarah Battenfield, KSU
TRAIT PREDICTION ACCURACY
(r)
Test Weight 0.725***
Grain Hardness 0.513***
Grain Protein 0.630***
Flour Protein 0.604***
Flour SDS 0.666***
Mixograph Mix Time 0.718***
Alveograph W 0.697***
Alveograph P/L 0.476***
Loaf Volume 0.638***
Page 18
KANSAS STATE U N I V E R S I T Y
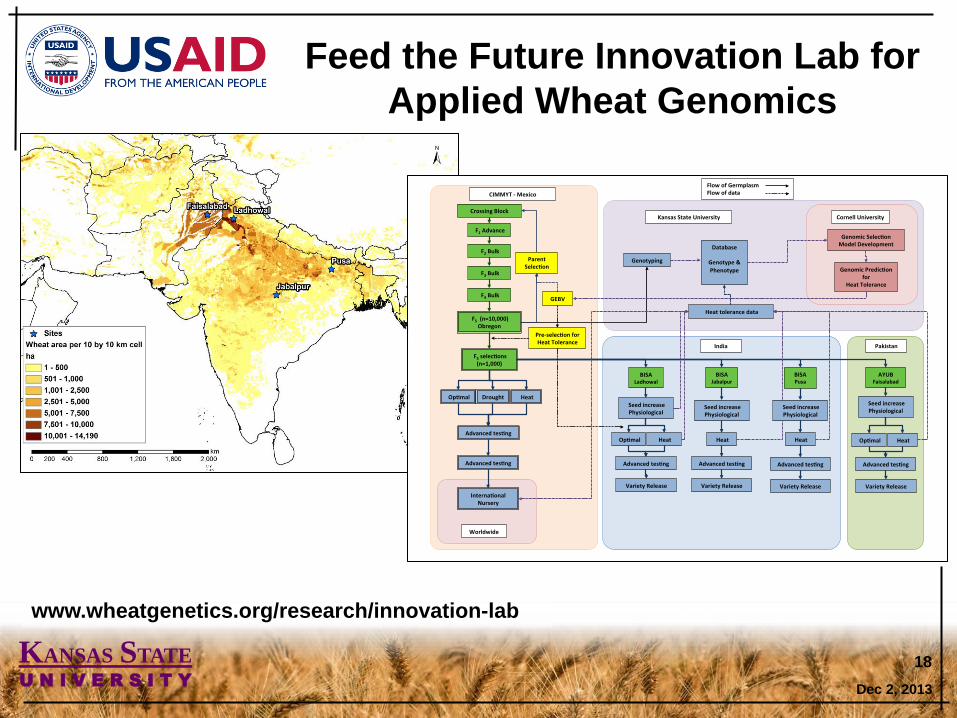
Feed the Future Innovation Lab for
Applied Wheat Genomics
Dec 2, 2013
18
www.wheatgenetics.org/research/innovation-lab
Page 19
KANSAS STATE U N I V E R S I T Y
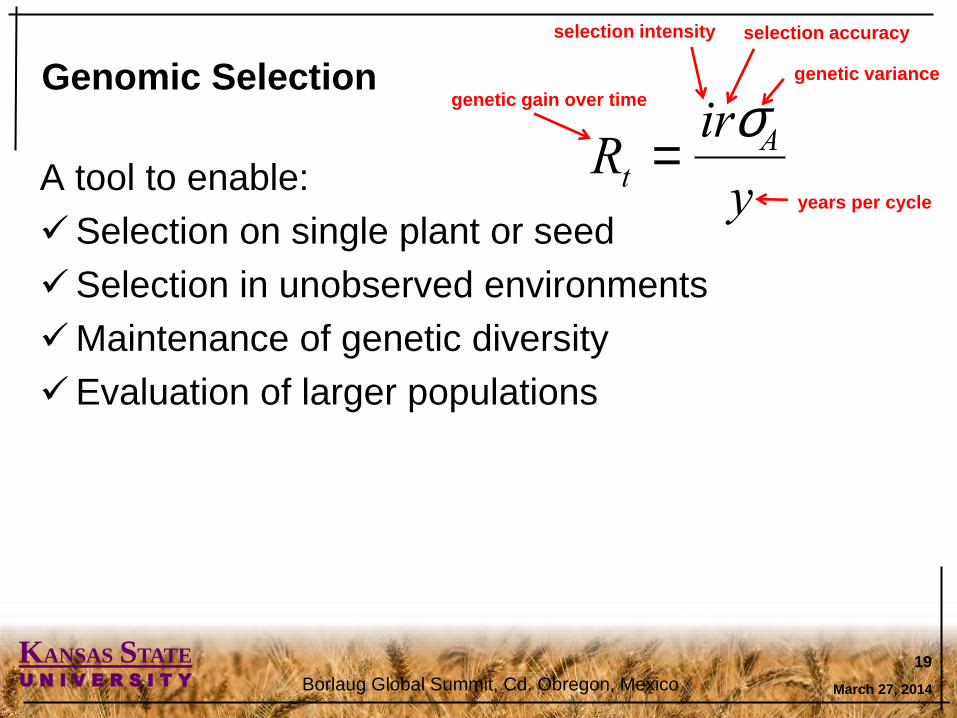
Genomic Selection
A tool to enable:
Selection on single plant or seed
Selection in unobserved environments
Maintenance of genetic diversity
Evaluation of larger populations
March 27, 2014 Borlaug Global Summit, Cd. Obregon, Mexico
19
Rt =irsAy
genetic gain over time
years per cycle
selection intensity selection accuracy
genetic variance
Page 20
KANSAS STATE U N I V E R S I T Y
High-throughput phenotyping
• Automated or semi-automated platforms for
rapid, precision assessment
• High-throughput analysis pipelines
• Decrease the phenotyping burden and increase
efficiency of the breeding program
Dec 2, 2013
20
Page 21
KANSAS STATE U N I V E R S I T Y
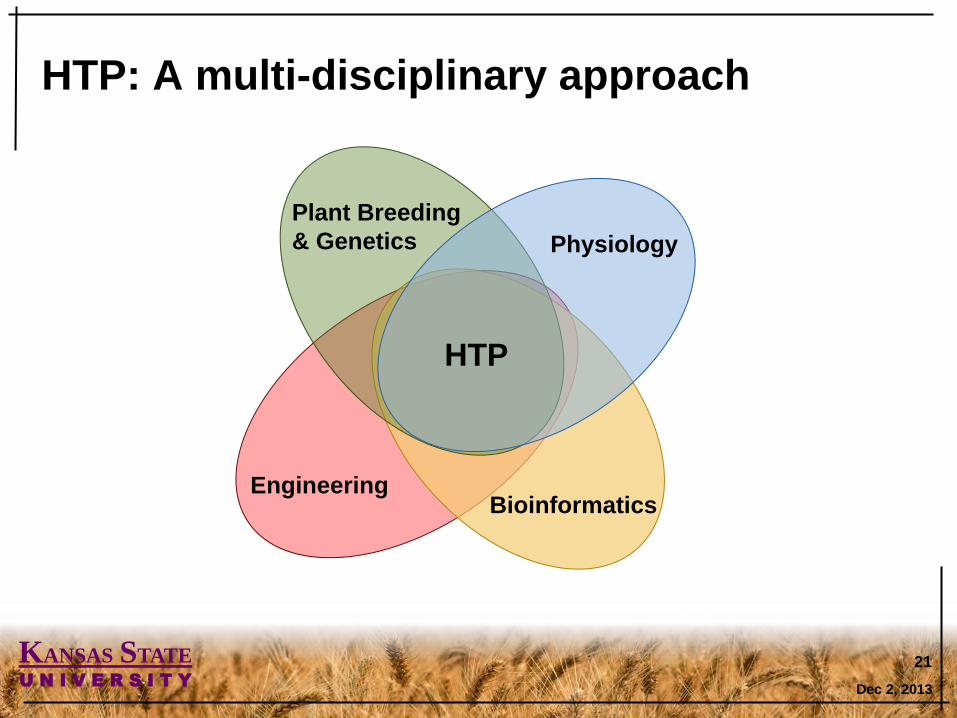
HTP: A multi-disciplinary approach
Dec 2, 2013
21
Plant Breeding
& Genetics Physiology
Engineering Bioinformatics
HTP
Page 22
KANSAS STATE U N I V E R S I T Y
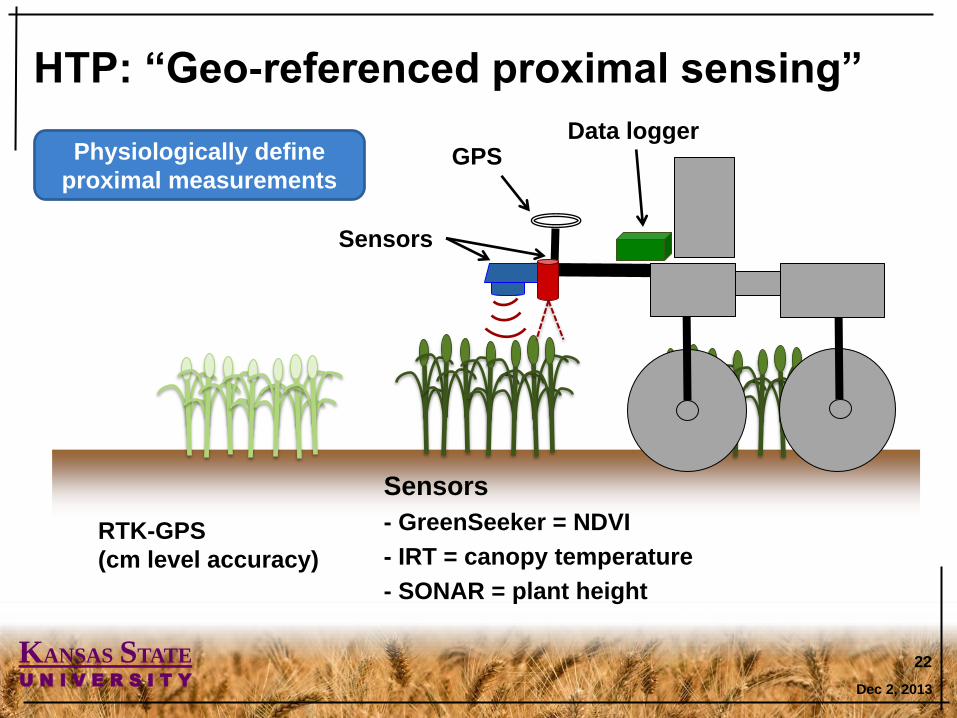
HTP: “Geo-referenced proximal sensing”
Dec 2, 2013
22
GPS Data logger
Sensors
Sensors
- GreenSeeker = NDVI
- IRT = canopy temperature
- SONAR = plant height
Physiologically define
proximal measurements
RTK-GPS
(cm level accuracy)
Page 23
KANSAS STATE U N I V E R S I T Y
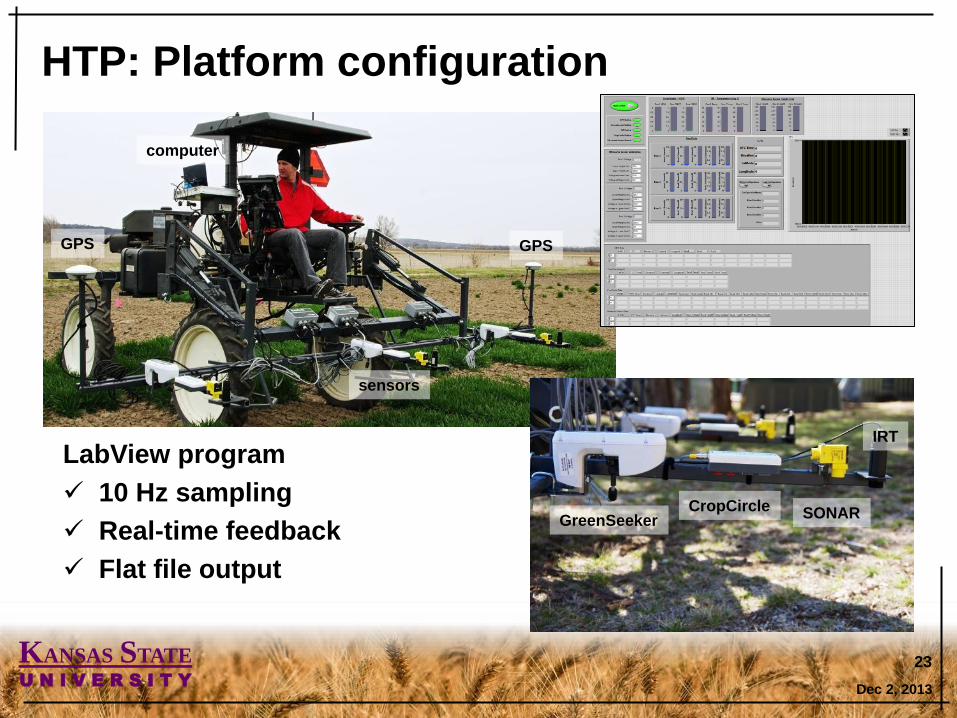
HTP: Platform configuration
Dec 2, 2013
23
GreenSeeker CropCircle SONAR
IRT
GPS GPS
sensors
computer
LabView program
10 Hz sampling
Real-time feedback
Flat file output
Page 24
KANSAS STATE U N I V E R S I T Y
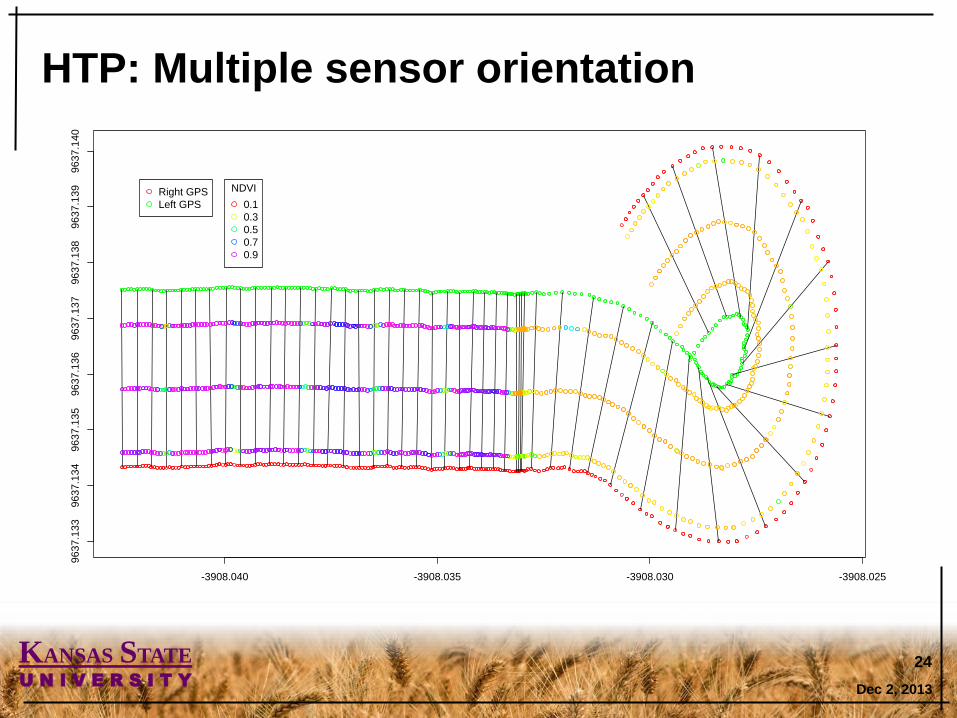
HTP: Multiple sensor orientation
Dec 2, 2013
24
-3908.040 -3908.035 -3908.030 -3908.025
9637.1
33
9637.1
34
9637
.135
963
7.1
36
96
37.1
37
96
37.1
38
9637.1
39
9637.1
40
-data$Right_Longitude
data
$R
ight_
La
titu
de
Right GPS
Left GPS
NDVI
0.1
0.3
0.5
0.7
0.9
Page 25
KANSAS STATE U N I V E R S I T Y
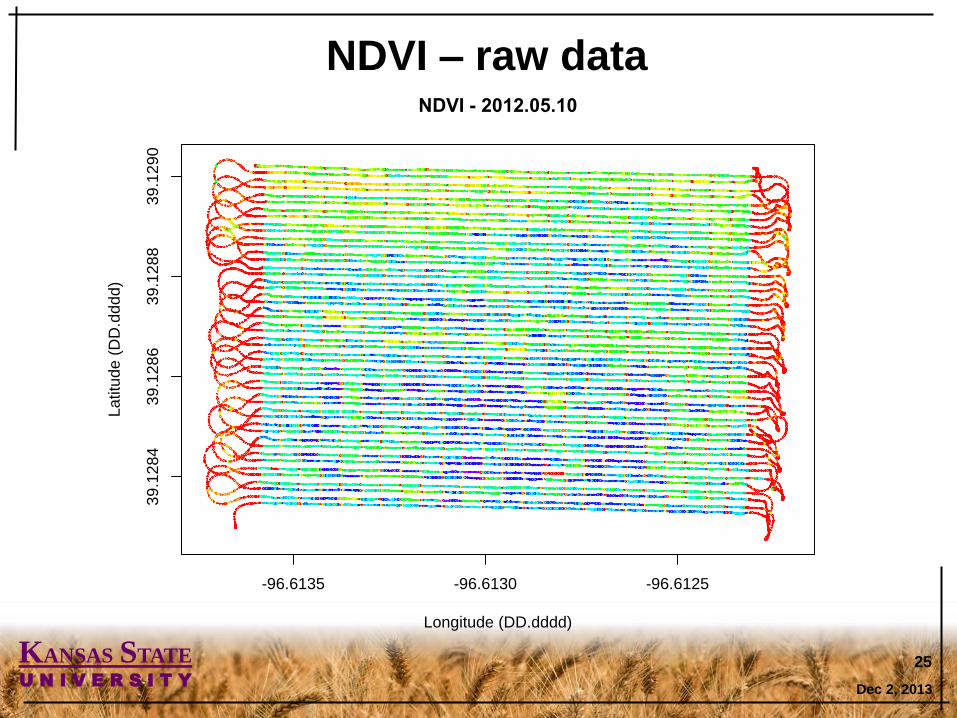
NDVI – raw data
Dec 2, 2013
25
-96.6135 -96.6130 -96.6125
39
.12
84
39.1
28
63
9.1
288
39
.12
90
NDVI - 2012.05.10
Longitude (DD.dddd)
Latitu
de
(D
D.d
dd
d)
Page 26
KANSAS STATE U N I V E R S I T Y
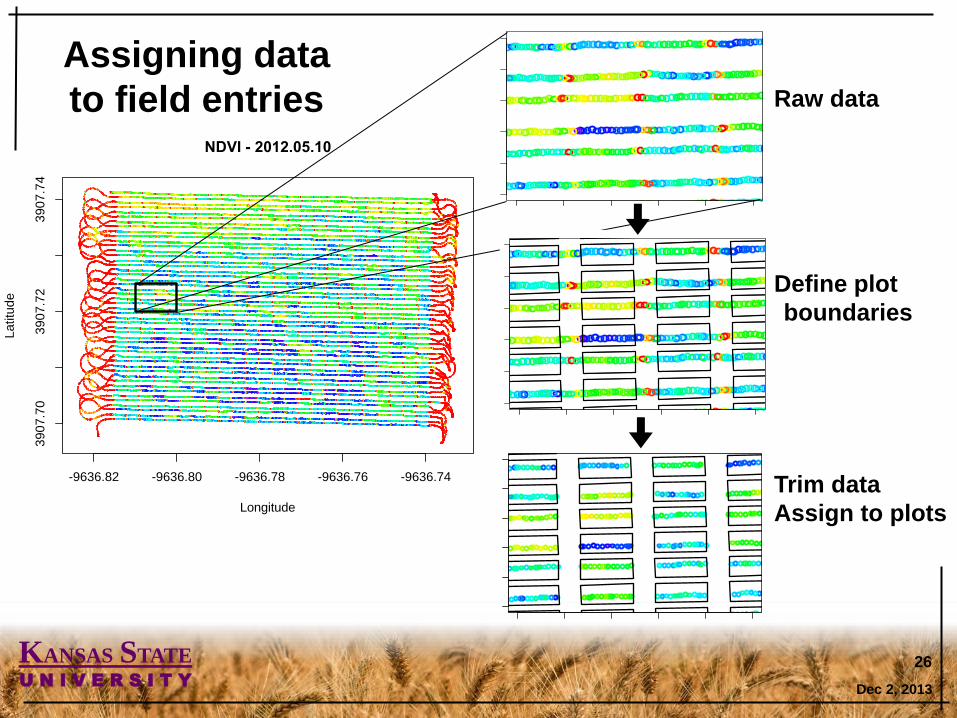
Assigning data
to field entries
Dec 2, 2013
26
-9636.82 -9636.80 -9636.78 -9636.76 -9636.74
390
7.7
039
07
.72
390
7.7
4
NDVI - 2012.05.10
Longitude
Latitu
de
-9636.800 -9636.804 -9636.808
3907
.720
3907
.722
3907
.724
NDVI - 2012.05.10
Longitude
Lat
itu
de
-9636.800 -9636.804 -9636.808
390
7.7
20
390
7.7
22
39
07
.724
NDVI - 2012.05.10
-data.2$long[!is.na(data.2$pass)]
data
.2$
lat[
!is.n
a(d
ata
.2$
pa
ss)]
-9636.800 -9636.804 -9636.808
3907
.720
3907
.722
3907
.724
NDVI - 2012.05.10
Longitude
Lat
itu
de
Raw data
Define plot
boundaries
Trim data
Assign to plots
Page 27
KANSAS STATE U N I V E R S I T Y
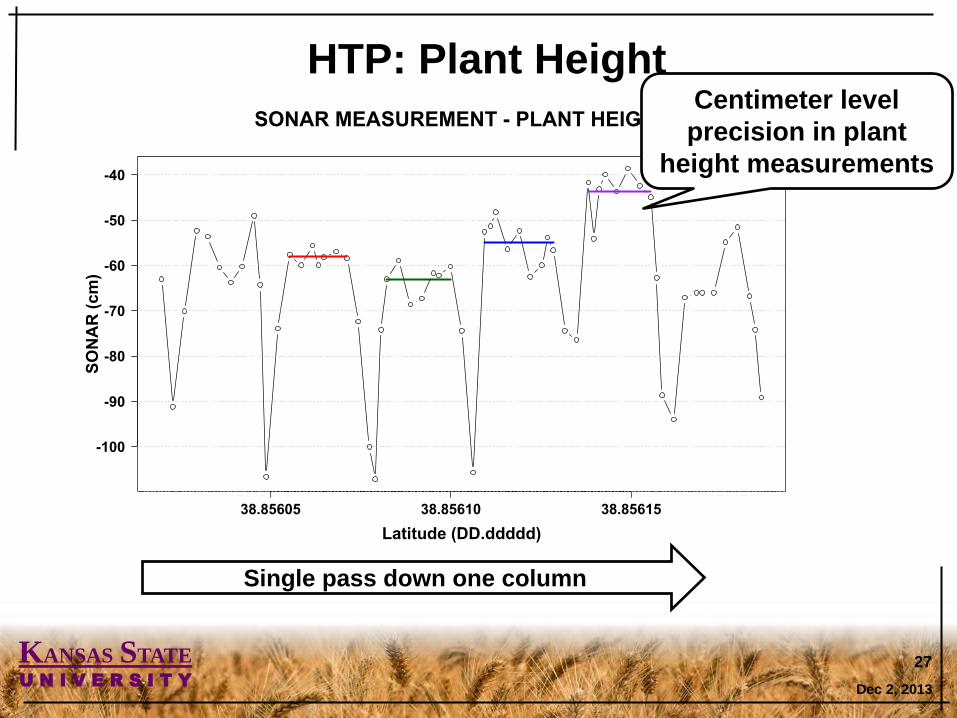
HTP: Plant Height
Dec 2, 2013
27
38.85605 38.85610 38.85615
-100
-90
-80
-70
-60
-50
-40
SONAR MEASUREMENT - PLANT HEIGHT
Latitude (DD.ddddd)
SO
NA
R (
cm
)
Single pass down one column
Centimeter level
precision in plant
height measurements
Page 28
KANSAS STATE U N I V E R S I T Y
Dec 2, 2013
28
X2013.05.31
−10 −5 0 5 10
●
●
●
●
●
●●
●●
●
●
●
●
●●
●
●
●
●
●●
●
●
●●
●
●
●●●●
●
●
●●
●●
●●●
●
● ●●
●
●
●
●●
●
●
●
●
●
●
●●
●●
●
●
●● ●
●
●
●
●●
●●
●●
●●
●
●●
●
●
●
●
●●
●
●
●
●
●
●
●●
●
●
●
●●
●
●
●
●●
●
●
●
●●
●
●
●
●
●
●●●●
●
●
●
●
●
●
●
●
●
●●
●
●
●
●
●●
●
●
●
●
●●
●
●
●●
●
●
● ●●
●
●
●
●●
●●
●●●
●
●● ●
●
●
●
●●
●
●
●
●
●
●
● ●
●●
●
●
●● ●
●
●
●●
● ●
●
●●
●
●●
●●
●
●●
●
●
●
●
●
●
●●
●
●
●
●●
●
●
●
● ●
●
●
●
●●●
●
●
●
●
●●● ●●
●
●
75 80 85 90 95
●
●
●
●
●
●●
●●
●
●
●
●
●●
●
●
●
●
●●
●
●
●●
●
●
● ●●
●
●
●
●●
●●
●●●
●
●● ●
●
●
●
●●
●
●
●
●
●
●
● ●
●●
●
●
●● ●
●
●
●
●●
● ●
● ●
●●
●
●●
●
●
●
●
●●
●
●
●
●
●
●
●●
●
●
●
●●
●
●
●
●●
●
●
●
●●
●
●
●
●
●
●●
●● ●
●
●
−1
0−
50
510
●
●
●
●
●
●●
●●
●
●
●
●
●●
●
●
●
●
●●
●
●
●●
●
●
● ●●●
●
●
●●
●●
●●●
●
●● ●
●
●
●
●●
●
●
●
●
●
●
●●
●●
●
●
●●●
●
●
●
●●
● ●
● ●
●●●
●●
●
●
●
●
●●
●
●
●
●
●
●
●●
●
●
●
●●
●
●
●
● ●
●
●
●
●●
●
●
●
●
●
●●●●●
●
●
−1
0−
50
510
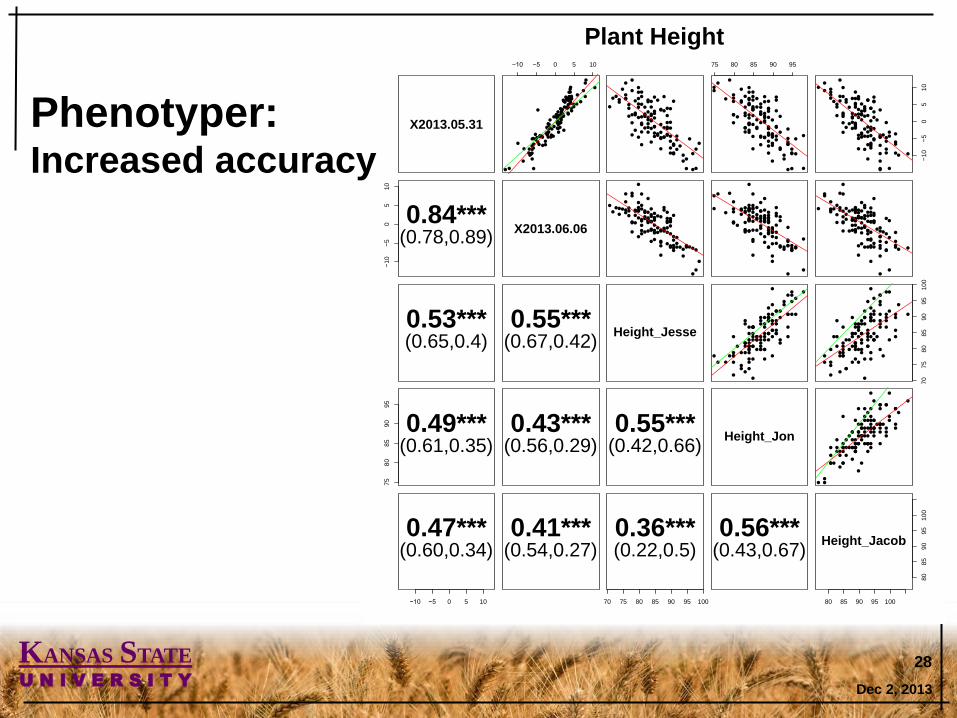
0.84***(0.78,0.89)
X2013.06.06
●●
●●
●
●
●
●
●
●●
●
●●●
●
●
●●
●
●
●
●
●●
●
● ●
● ●
●
●●●
● ●
●
●●
●
●
●
●
●
●
●
●
●
●●
●● ●
●● ●
●●●
●●
●
●
●
●
●●
●
●
●●
●●
●●
●●
●
●●
●
●
●
●
●
●
● ●
●
●
●
●● ●●
●
● ●●
●
●
●
●
●
●
●
● ●
●●●
●●
●
●
●●
●●
●
●●
●
●
●
●●
●
●● ●
●
●
●●
●
●
●
●
●●
●
● ●
● ●
●
●●●
●●
●
●●
●
●
●
●
●
●
●
●
●
●●
●● ●
●● ●
●●●
●●
●
●
●
●
●
●●
●
●
● ●●
●●
●●
●
●
●
●
●●
●
●
●
●
●
●
●●
●
●
●
●● ●●
●
●● ●
●
●
●
●
●
●
●
●●
●●●
●●
●
●
●●
●●
●
●●
●
●
●
●●
●
●● ●
●
●
●●
●
●
●
●
●●
●
● ●
●●
●
●●●
●●
●
●●
●
●
●
●
●
●
●
●
●
●●
●● ●
●●●
●●●
●●●
●
●
●
●
●●
●
●
● ●●●●●●
●
●
●
●
●●
●
●
●
●
●
●
●●
●
●
●
●● ●●
●
● ●●
●
●
●
●
●
●
●
●●
●●●
●●
●
●
0.53***(0.65,0.4)
0.55***(0.67,0.42)
Height_Jesse
●●
●●
●
● ●●
●●
●●
●● ●
●
●●
●
●
● ●
●● ●●
●
●●
●
●
●
●●
●
●
●
●●
●●
●
●
●
●
●
●
●
●●
●
●
●
●
●●
●●●●●
●
●
●
●
●● ●
●
●
●●
●●
●
●●
●
●● ●
●
●
●
●
●
●
●
●
●●
●
●
●● ●
●● ●
●
●
●
● ●
●
●
●●
●
●●
●
●
●
●
70
75
80
85
90
95
10
0
●●
●●
●
● ●●
●●
●●
●● ●
●
●●
●
●
●●
●● ●●
●
● ●
●
●
●
●●
●
●
●
●●
●●
●
●
●
●
●
●
●
●●
●
●
●
●
●●
●●●●●
●
●
●
●
●●●
●
●
●●
●●
●
●●
●
●● ●
●
●
●
●
●
●
●
●
●●
●
●
●● ●
●●●
●
●
●
● ●
●
●
●●
●
●●
●
●
●
●
75
80
85
90
95
0.49***(0.61,0.35)
0.43***(0.56,0.29)
0.55***(0.42,0.66)
Height_Jon
●
●
●●●
●
●
●
●
●●
●
●
●●
●
●
●
●●
●
●
●
●●
●
●
●
●●
●
●
●
●●
●
●
●●
●●●●
●
●●
●
●
●
●●
●●
●●
●
●●
●●●
●
●●
●
●
●●
●
●●
●
●
●
●
●
●●
●
●
●●●
●●●
●●
●
●
●●
●
●●
●
●
●●
●
●
●
●●
●●
●
●
●
●
●●
●●●
●●
●●
−10 −5 0 5 10
0.47***(0.60,0.34)
0.41***(0.54,0.27)
70 75 80 85 90 95 100
0.36***(0.22,0.5)
0.56***(0.43,0.67)
80 85 90 95 100
80
85
90
95
100
Height_Jacob
Phenotyper: Increased accuracy
Plant Height
Page 29
KANSAS STATE U N I V E R S I T Y
Dec 2, 2013
29
-9636.82 -9636.80 -9636.78 -9636.76 -9636.74
390
7.7
039
07
.71
39
07.7
23
907
.73
390
7.7
4
NDVI - 2012.05.03
-data.1$long
-9636.82 -9636.80 -9636.78 -9636.76 -9636.74
39
07
.70
390
7.7
13
90
7.7
23
90
7.7
339
07
.74
NDVI - 2012.05.10
-data.2$long
-9636.82 -9636.80 -9636.78 -9636.76 -9636.74
39
07
.70
390
7.7
13
90
7.7
239
07
.73
39
07
.74
NDVI - 2012.05.15
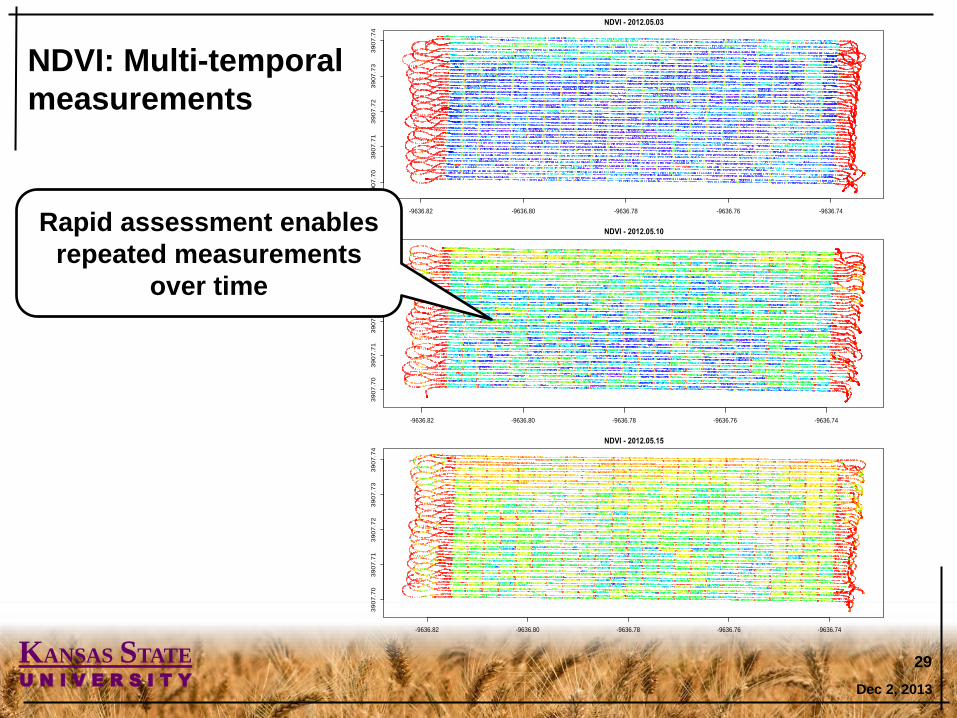
NDVI: Multi-temporal
measurements
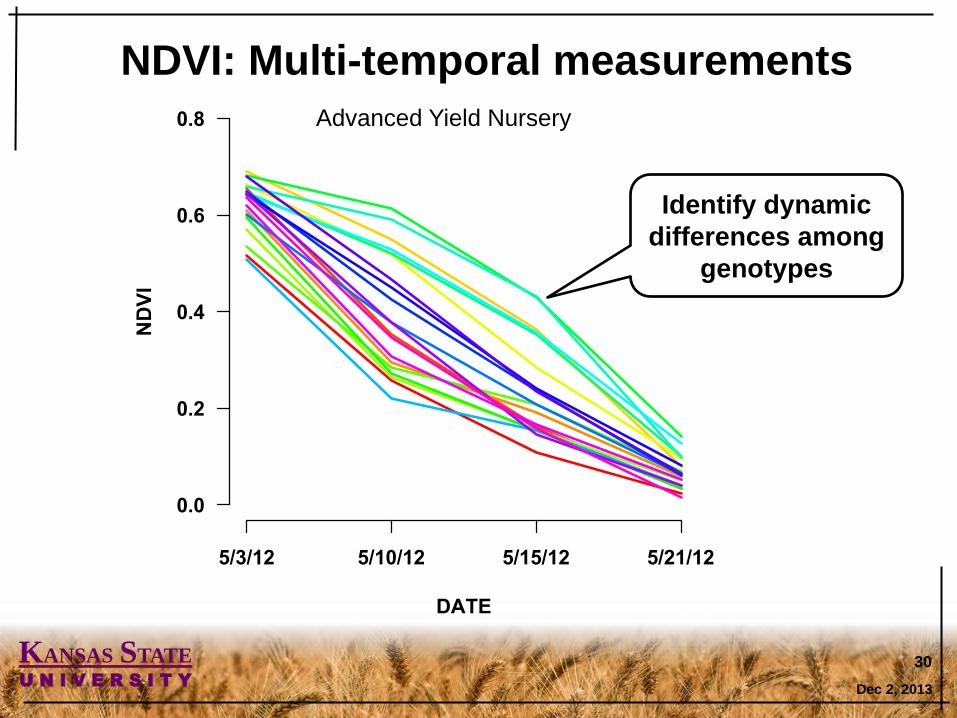
Rapid assessment enables
repeated measurements
over time
Page 30
KANSAS STATE U N I V E R S I T Y
NDVI: Multi-temporal measurements
Dec 2, 2013
30
DATE
ND
VI
0.0
0.2
0.4
0.6
0.8
5/3/12 5/10/12 5/15/12 5/21/12
Advanced Yield Nursery
Identify dynamic
differences among
genotypes
Page 31
KANSAS STATE U N I V E R S I T Y
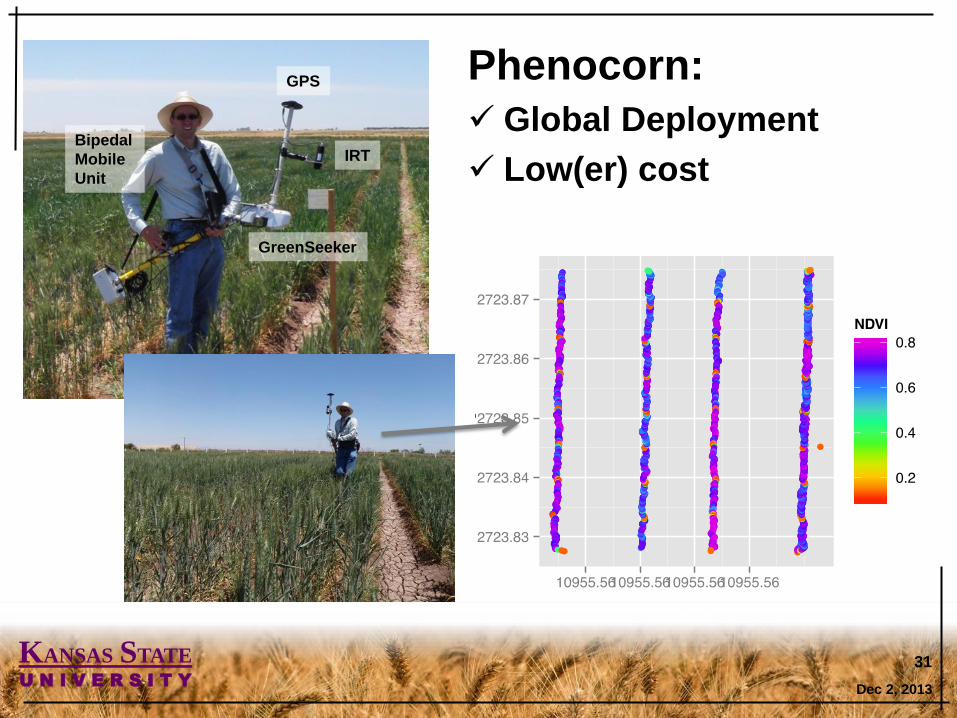
Phenocorn:
Global Deployment
Low(er) cost
Dec 2, 2013
31
GPS
IRT
GreenSeeker
Bipedal
Mobile
Unit
Page 32
KANSAS STATE U N I V E R S I T Y
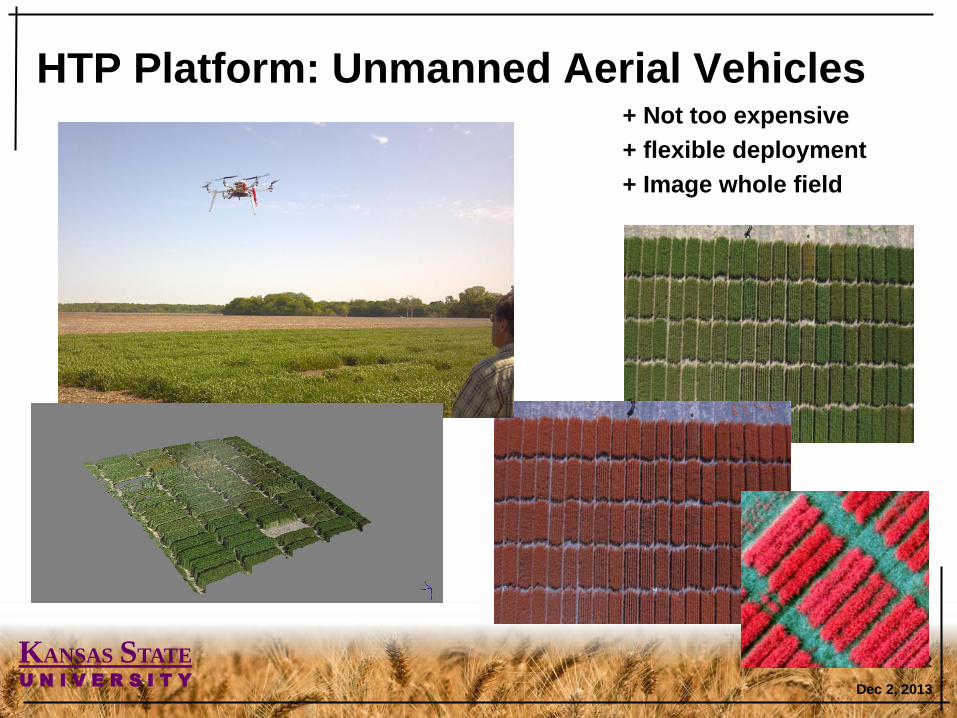
HTP Platform: Unmanned Aerial Vehicles
Dec 2, 2013
32
+ Not too expensive
+ flexible deployment
+ Image whole field
Page 33
KANSAS STATE U N I V E R S I T Y
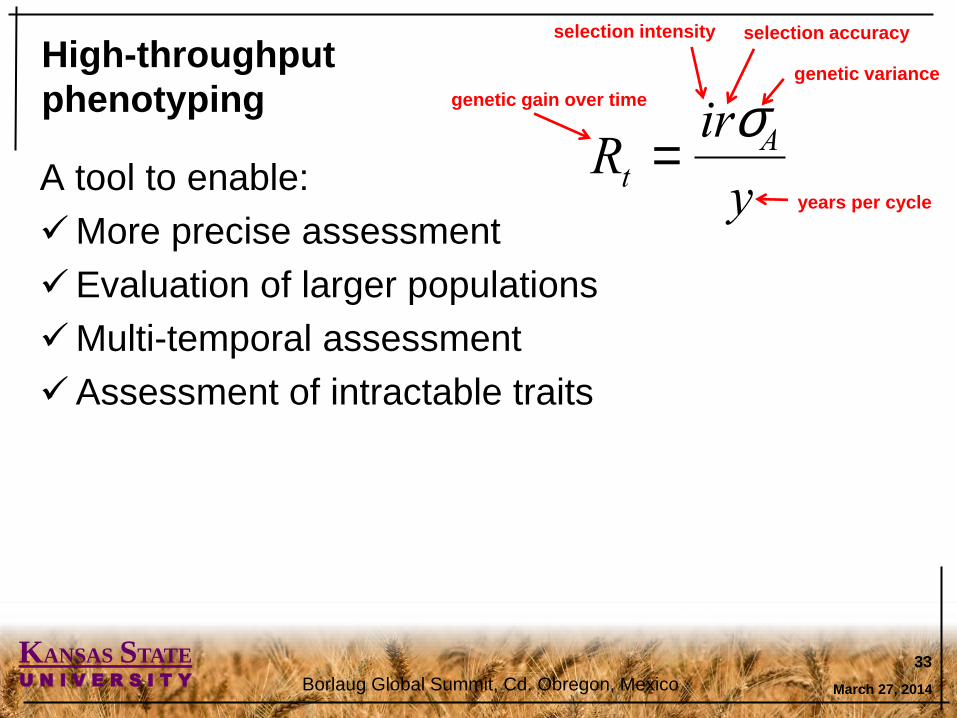
High-throughput
phenotyping
A tool to enable:
More precise assessment
Evaluation of larger populations
Multi-temporal assessment
Assessment of intractable traits
March 27, 2014 Borlaug Global Summit, Cd. Obregon, Mexico
33
Rt =irsAy
genetic gain over time
years per cycle
selection intensity selection accuracy
genetic variance
Page 34
KANSAS STATE U N I V E R S I T Y
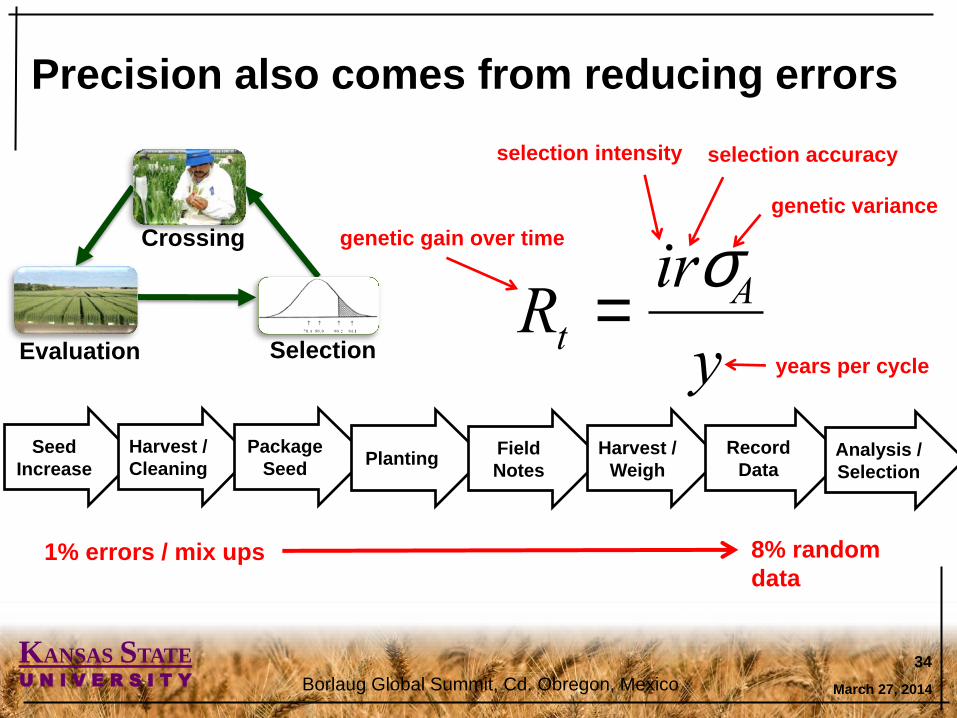
Precision also comes from reducing errors
March 27, 2014
34
Rt =irsAy
genetic gain over time
years per cycle
selection intensity selection accuracy
genetic variance
Crossing
Evaluation Selection
Borlaug Global Summit, Cd. Obregon, Mexico
Seed
Increase
Harvest /
Cleaning
Package
Seed Planting
Field
Notes
Harvest /
Weigh
Record
Data Analysis /
Selection
1% errors / mix ups 8% random
data
Page 35
KANSAS STATE U N I V E R S I T Y
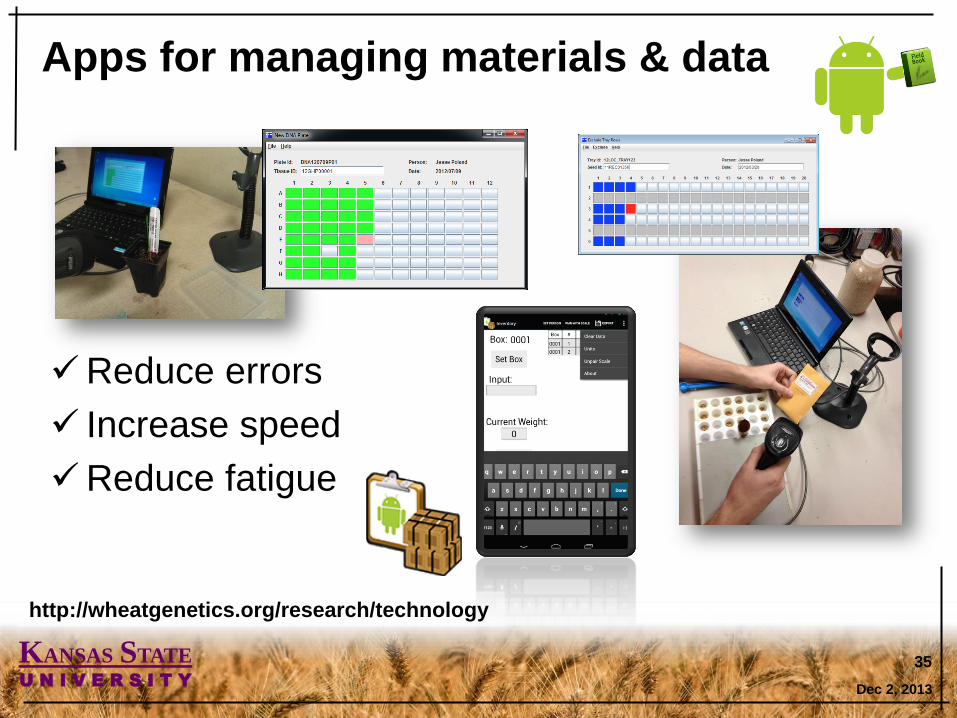
Apps for managing materials & data
Reduce errors
Increase speed
Reduce fatigue
Dec 2, 2013
35
http://wheatgenetics.org/research/technology
Page 36
KANSAS STATE U N I V E R S I T Y
Dec 2, 2013
36
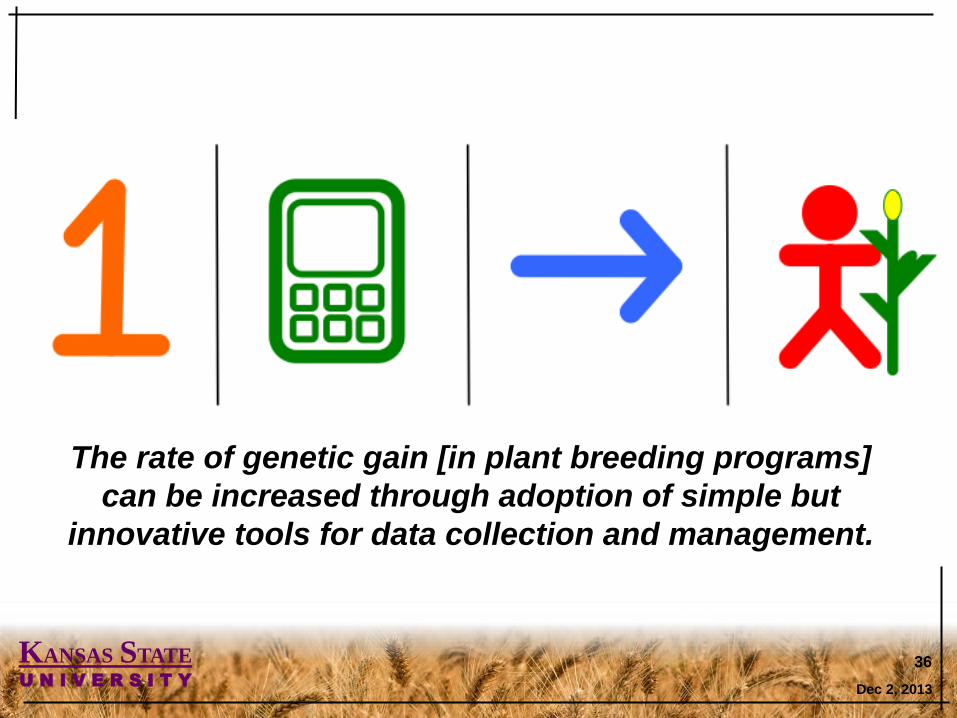
The rate of genetic gain [in plant breeding programs]
can be increased through adoption of simple but
innovative tools for data collection and management.
Page 37
KANSAS STATE U N I V E R S I T Y
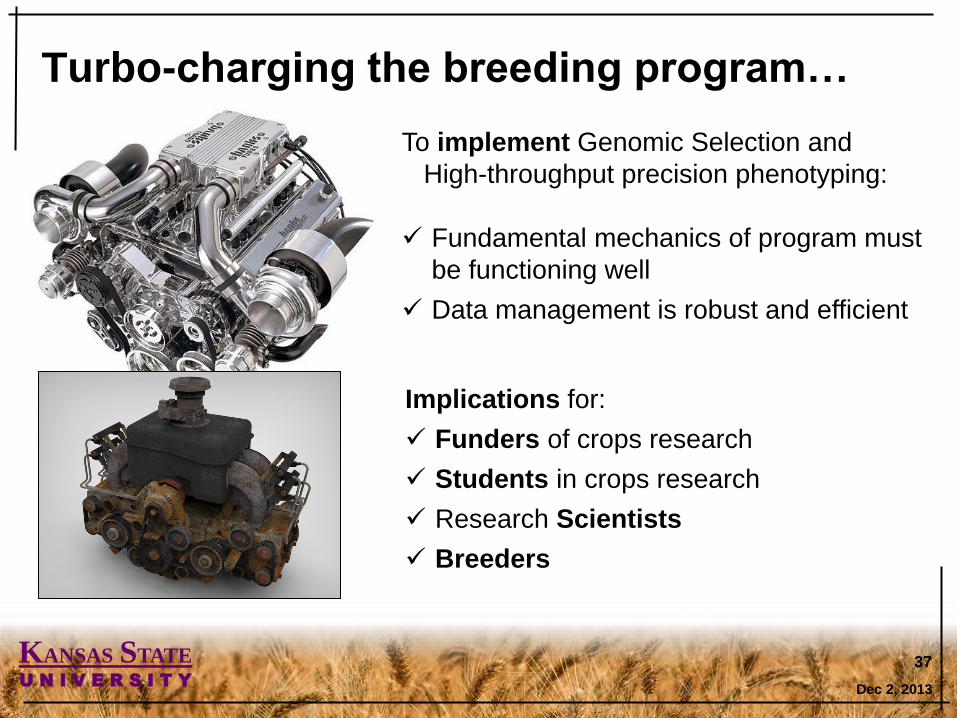
Turbo-charging the breeding program…
Dec 2, 2013
37
To implement Genomic Selection and
High-throughput precision phenotyping:
Fundamental mechanics of program must
be functioning well
Data management is robust and efficient
Implications for:
Funders of crops research
Students in crops research
Research Scientists
Breeders
Page 38
KANSAS STATE U N I V E R S I T Y
Ravi Singh
David Bonnett
Matthew Reynolds
Yann Manes
Susanne
Dreisigacker
Jose Crossa
Hector Sanchez
Shuangye Wu
Josh Sharon
Ryan Steeves
Jared Crain
Sandra Dunckel
Trevor Rife
Traci Viinanen
Narinder Singh
Daljit Singh
Xu “Kevin” Wang
Erena Edae
Bikram Gill
Bernd Friebe
Sunish Seghal
Jon Raupp
Duane Wilson
Eric Olson
Ed Buckler
Rob Elshire
Jeff Glaubitz
Jean-Luc Jannink
Mark Sorrells
Jeffrey Endelman
Julie Dawson
Jessica Rutkoski
Rebecca Nelson
Mike Gore
Robbie Waugh
Hui Liu
Pedro Andrade-Sanchez
John Heun
Jeffery White
Kelly Thorp
Andrew French
Mike Salvucci
Nils Stein
Martin Mascher
Burkhard Steuernagel
Thomas Nussbaumer
Kevin Price
Nan An
Niaqian Zhang
Jed Barker
Allan Fritz
Sarah Battenfield
Chris Gaynor
Lee DeHaan