enables the user to mathematically model an operation on a computer before physically imple-menting it. Statistical distributions of different parameters, such as arrival rates of trucks, pro-files of orders, picking times, etc., provide the data to run the simulation. To be close to reality,time standards of basic elements are used to provide the time value as input for the simulation.
7. Comparing Present Standards Against Established Industry Standards. Finally, ifthe time standard has been determined for an operation, a manager can compare that standardwith a predetermined time standard for a particular operation. The critical point to remember incomparing standards is that actual times may vary significantly depending upon factors whichinclude the type of warehouse, the product handled, the physical environment, the frequency ofoperations, and the actual distance traveled during each operation. Nevertheless, standards doprovide benchmarks to compare present productivity levels. Figure 2.4 shows some samples ofthroughput standards in the warehouse compiled by the authors.
Time Standard Techniques
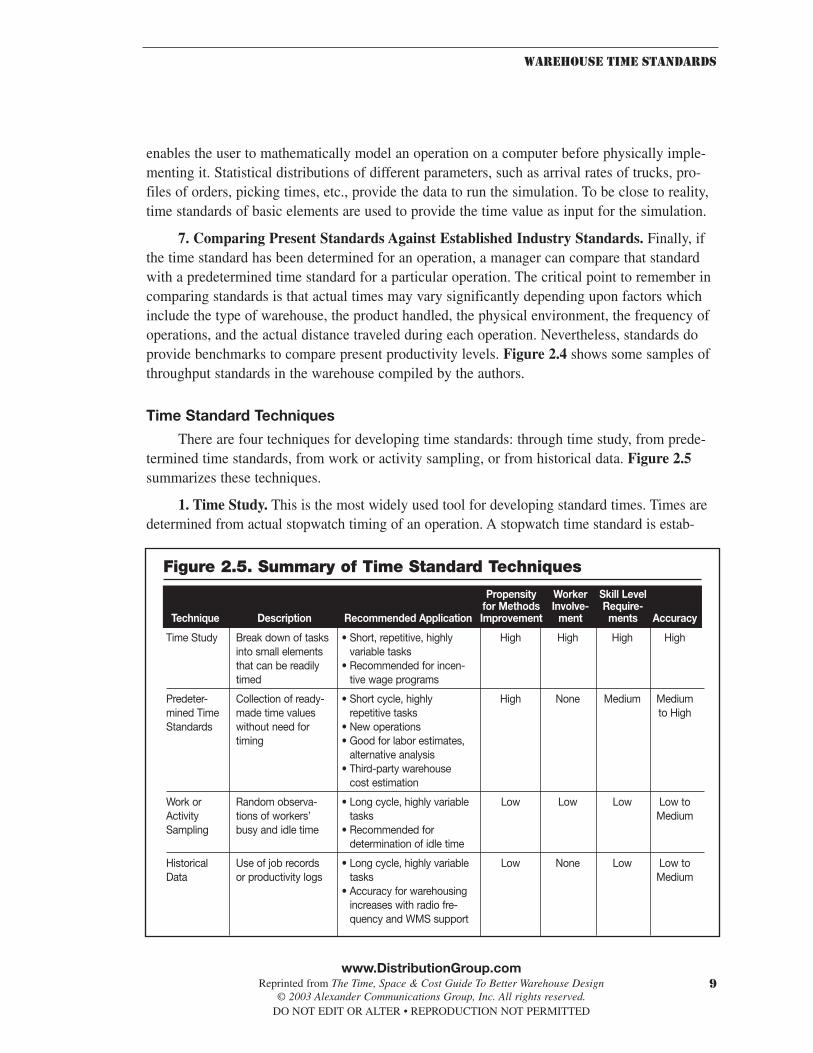
There are four techniques for developing time standards: through time study, from prede-termined time standards, from work or activity sampling, or from historical data. Figure 2.5summarizes these techniques.
1. Time Study. This is the most widely used tool for developing standard times. Times aredetermined from actual stopwatch timing of an operation. A stopwatch time standard is estab-
Technique Description Recommended Application Improvement ment ments Accuracy
Time Study Break down of tasks • Short, repetitive, highly High High High Highinto small elements variable tasksthat can be readily • Recommended for incen-timed tive wage programs
Predeter- Collection of ready- • Short cycle, highly High None Medium Medium mined Time made time values repetitive tasks to HighStandards without need for • New operations
timing • Good for labor estimates, alternative analysis
• Third-party warehouse cost estimation
Work or Random observa- • Long cycle, highly variable Low Low Low Low to Activity tions of workers’ tasks MediumSampling busy and idle time • Recommended for
determination of idle time
Historical Use of job records • Long cycle, highly variable Low None Low Low to Data or productivity logs tasks Medium
• Accuracy for warehousing increases with radio fre-quency and WMS support
www.DistributionGroup.comReprinted from The Time, Space & Cost Guide To Better Warehouse Design
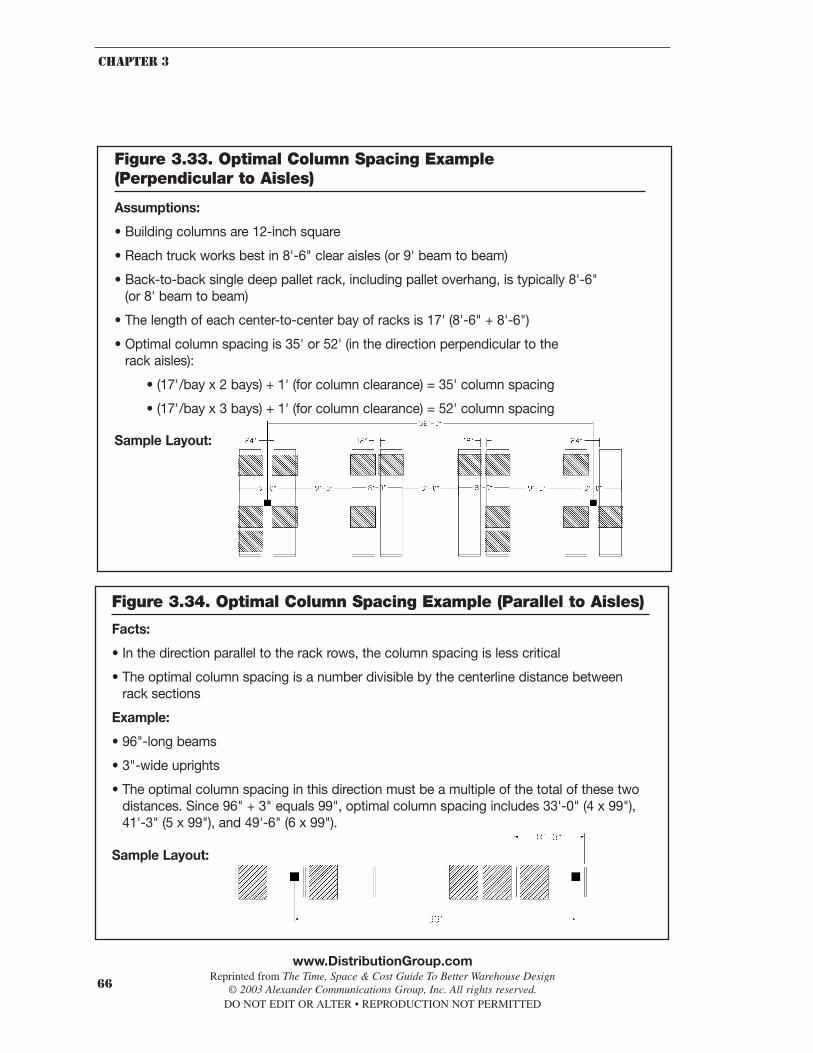
Figure 3.34. Optimal Column Spacing Example (Parallel to Aisles)
Facts:
• In the direction parallel to the rack rows, the column spacing is less critical
• The optimal column spacing is a number divisible by the centerline distance betweenrack sections
Example:
• 96"-long beams
• 3"-wide uprights
• The optimal column spacing in this direction must be a multiple of the total of these twodistances. Since 96" + 3" equals 99", optimal column spacing includes 33'-0" (4 x 99"),41'-3" (5 x 99"), and 49'-6" (6 x 99").
Sample Layout:
Figure 3.33. Optimal Column Spacing Example (Perpendicular to Aisles)
Assumptions:
• Building columns are 12-inch square
• Reach truck works best in 8'-6" clear aisles (or 9' beam to beam)
• Back-to-back single deep pallet rack, including pallet overhang, is typically 8'-6" (or 8' beam to beam)
• The length of each center-to-center bay of racks is 17' (8'-6" + 8'-6")
• Optimal column spacing is 35' or 52' (in the direction perpendicular to the rack aisles):
Step 3. Identify Storage Equipment Costs. Costs of storage equipment can be obtainedfrom manufacturers and industrial equipment suppliers. Quantity discounts are usually availableon large installations. Used storage equipment in good condition can be considered in the bid-ding process, but only if it meets specifications. Getting seismic code approval for used rack canbe difficult. Figure 4.5 shows some typical cost estimates of new storage modules.
For pallet rack systems, the cost of materials differs between structural steel and roll-formed beams and uprights. In the past, roll-formed steel rack systems were less expensive thanstructural steel rack systems. The difference in prices has narrowed to as little as 10%. Structuralsteel racks are more likely to withstand impact and damage compared to roll-formed racks. Whena roll-formed upright is struck, its load-carrying capacity is reduced. The load should be removedimmediately and the damaged upright replaced. Additional pallet rack options will increase costs.Some of these options include safety bars, upright protectors, and decking.
Costs increase when shelving and flow racks are used to support mezzanines or used aspart of a specialized system as in pick-to-light applications.
Step 4. Determine and Identify Other Special Costs. These are miscellaneous costsincurred in the start-up of a new or improved warehouse. They include the following:
Planning and Design Costs. These are estimated expenses incurred by the study andimplementation team to assess, design, justify, and implement the new design. These include
96
CHAPTER 4
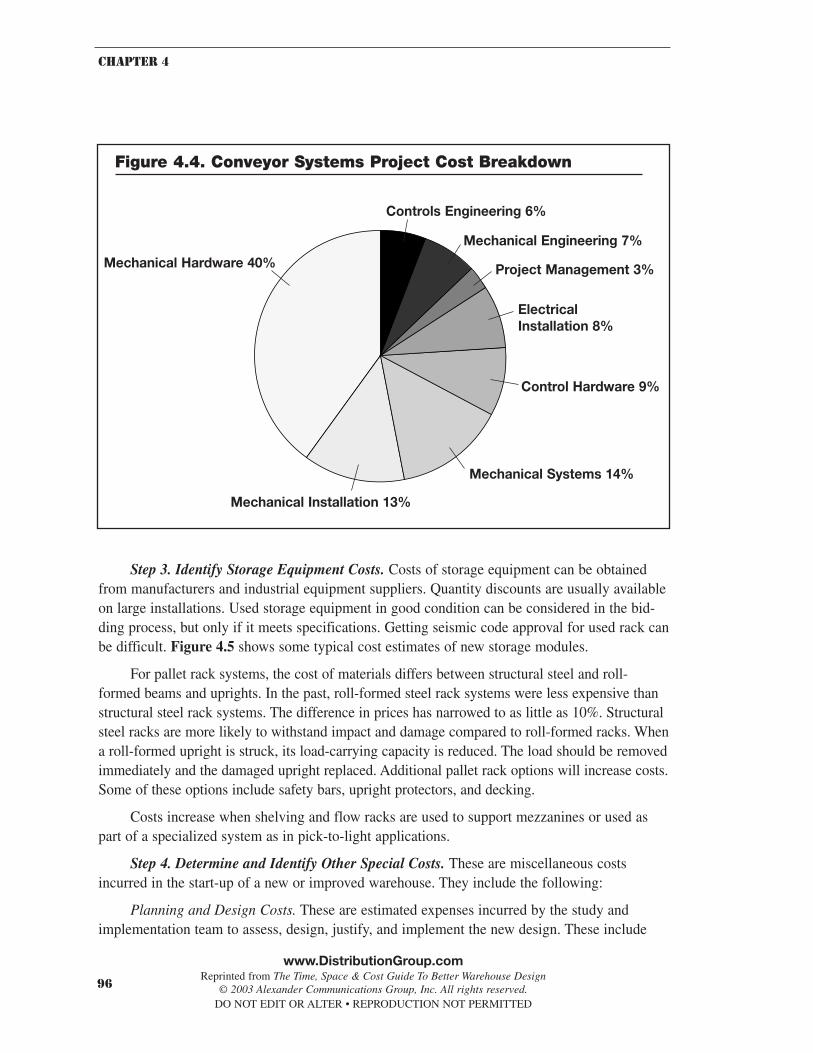
Figure 4.4. Conveyor Systems Project Cost Breakdown
Controls Engineering 6%
Mechanical Engineering 7%
Project Management 3%
Control Hardware 9%
Mechanical Systems 14%
Mechanical Installation 13%
Mechanical Hardware 40%
Electrical Installation 8%
www.DistributionGroup.comReprinted from The Time, Space & Cost Guide To Better Warehouse Design


![Visualization Techniques in Smart GridVisualization Techniques in Smart Grid 177. Figure 3. Single line diagram. Figure 4. Real time bar chart. 3.3. 3D Surface with Contour [14] The](https://static.documents.pub/doc/80x56/5ed1b0e58885c9544e6bcb35/visualization-techniques-in-smart-grid-visualization-techniques-in-smart-grid-177.jpg)


