37
[ / FILE COpy DO NOT REMOVE NST TUTE. FOR 172-73 RESEARCH ON BLACK CAPITALISM: DUALITY AND DEVELOPMENTAL PROSPECTS Timothy Bates

[
/ FILE COpyDO NOT REMOVE
NSTTUTE. FOR 172-73
RESEARCH ONPOVERTYD,scWl~J~~
BLACK CAPITALISM:DUALITY AND DEVELOPMENTAL PROSPECTS
Timothy Bates

"i
BLACK CAPITALISM:DUALITY AND DEVELOPMENTAL PROSPECTS
Timothy Bates
The research reported here was supported in part by funds granted to theInstitute for Research on Poverty at the University of Wisconsin by theOffice of Economic Opportunity Act of 1964. The conclusions expressedherein are those of the author.
August 1973

ABSTRACT
Because Black-owned enterprises vary in size, line of business and a
number of other characteristics, it is difficult to make -global statements
about Black entrepreneurship. Furthermore, conventional standards of firm
profitability or viability in the White community may not be directly
applicable to firms existing in the environment of an urban ghetto. In
this study a set of specific criteria will be proposed that can be used to
sort out the marginal Black firms from those which appear to be economically
viable: criteria are presented for estimating the profitability of Black
firms having various levels of sales, labor,input and capital input. Using
data collected from offices of the Small Business Administration in Chicago,
Boston and New York, multiple linear regression 'models explaining business
profits are estimated for a sample of 285 Black existing businesses. The
empirical results suggest that profitability can be accurately predicted
and that many Black-owned firms are economically viable in the sense of
generating enough profits to provide at least a lower-middle-class standard
of living for their owner-operators. Viability in retailing, a most
popular field for new and expanding Black firms, typically requires a
fairly substantial net investment and the ability to generate an annual
sales volume in the $1000,000 range. Entrepreneurs with slender resources
should avoid the field of retailing.
The sample data under consideration suggests that the newer Black
owned firms that have been provided access to capital markets are entering
lines of business not previously occupied by Blacks. Results of regression
analyses support the notion that Blacks have historically concentrated in

narrowly circumscribed fields like laundries, restaurants and barbershops
because these were fields in which one could begin and continue operations
with very little capital. If Blacks conti~ue to have access to capital
markets, Black firms can be expected in almost all lines of commerce and
industry. It was primarily lack of access to capital markets which
previously prevented Blacks from operating outside of their traditional
lines of business.

BLACK CAPITALISM:
DUALITY AND DEVELOPMENTAL PROSPECTS
Timothy Bates .
Why are there so few Black businesses? Perhaps a representative
answer to this question is: 1) lack of capital and contact with financial
institutions and 2) lack of managerial skills and attitudes among Blacks.l
Authors of articles analyzing Black businesses usually suggest that
segregation and discrimination have been instrumental in creating Black
enterprises that are typically small scale and inefficient. Most of these
authors conclude that government and private corporate enterprise should
make one or more of the following aids available to minority entrepreneurs:
1) provide greater credit availability, 2) provide managerial and
technical assistance, 3) liberalize bonding and insurance standards and
requirements, 4) . provide easier access to markets. 2
A. Attempts to Analyze the Black Business Community
The massive literature about Black entrepreneurship tends to be
repetitive and nonanalytic; often an author bases his remarks on a small
number of incidents or is busy attempting to promote some policy which he
believes will improve the environment for Black business.
The literature on Black capitalism has generally lacked substance because
comprehensive financial information on Black firms has not been available.
Empirical studies that have appeared to date have relied upon voluntary
responses of Black entrepreneurs to survey questionnaires; the nature of this
data gathering technique eliminates the possibility of verifying the accuracy
of the collected information. Relying on surveys for data, empirical studies

"
2
in this field have understandably been unable to gather balance sheet
information on the type and dollar amount of the assets and liabilities of
Black businesses. Because of the nature of available data on the Black
business community, articles and books on Black enterprise have often been
nonanalytic statements of personal opinion. Many unsubstantiated views
have persisted and a number of unanswered questions have plagued those who
have contributed to the literature on Black entrepreneurship.
One major series of contributions to this literature has come from the
pen of Governor Andrew Brimmer, a member of the Board of Governors of the
3Federal Reserve System. His ,analysis has had a broad impact both because
of his own influential position in government and because it appeared to be
documented with supporting empirical evidence. In a recently published
article, I have shown that Brimmer's empirical work is inaccurate; his
theoretical interpretation of Black entrepreneurship is similarly deficient
because it ignores major burdens that have been imposed on Black businessmen
b ' 1 d' .. t' 4y raCla lscrlmlna lon.
The data analyzed in my research efforts, including the econometric
analyses presented in this article, suggest that limited access to capital
markets has been instrumental in limiting the size and scope of the past and
present Black business community.S Because the Black business community has,
to date, been restricted from competing effectively in highly capitalized
lines of business, government and banking industry programs for opening
capital markets to Black entrepreneurs give them
, f' d d' ,. 6creatlng new lrms an expan lng eXlstlng ones.
good opportunities for
The industrial composition
of Black firms who borrow through, these programs differs sharply from the
distribution of all Black businesses because most of these loan recipients

3
are moving into new territory,into fields of activity which require consid
erable amounts of capital.7
The availability of long-term credit at
moderate interest rates makes it possible for Black entrepreneurs to break
away from their traditional'lines of business.
Brimmer's article and my own publications on Black entrepreneurship
have emphasized the dual nature of the Black business community: Brimmer
refers to "protected" and "unprotected" enterprise, while I have divided
. 8Black firms into "traditional" and "emerging" lines of business. While
the terms protected and traditional refer to nearly identical groups of
firms, they are derived from lines of reasoning that have quite different,
distinct implications concerning the future prospects of Black entrepreneur-
ship. According to Brimmer's "protected markets" thesis, Black businesses
exist primarily because White-owned firms simply do not offer a wide range
of services demanded by Negroes. "Behind the wall of segregation which cut
Negroes off from many public services, there grew up a whole new area of
opportunity. Behind this wall of protection emerged the Negro physician,
the Negro lawyer, and, above all, the Negro businessman. ,,9 Most Black
businesses supply personal services and public accommodations to this
protected market. Furthermore, recent progress toward desegregation in the
United States is interpreted as undermining the position of many Black
b . h d d . h . k 10US1nessmen w 0 were epen ent on segregat10n to protect t e1r mar ets.
My thesis identifying traditional and emerging categories of Black-owned
firms is developed from the folloWing line of reasoning: despite a myriad
of adverse conditions, a small Black business community has stubbornly
managed to survive; because capital was extremely scarce, the overwhelming
majority of Black entrepreneurs concentrated in lines of business requiring

4
little capital. When capital markets finally open up, Black businesses will
expand i~to fields in which they heretofore had been unable to compete on
an equal basis.ll
Traditional Black firms are concentrated in fields
requiring little capital; emerging Black businesses are heavily concentrated
in fields of activity requiring considerable amounts of capital. This thesis
and the protected markets thesis certainly are not mutually exclusive, as
I have explained, in detail, in earlier publications. 12 To understand the
present orientation and the future prospects of Black entrepreneurship, one
must consider the changing nature of all of the major forces shaping the
Black business community. Contrary to Brimmer's views, the erosion of
segregation and discrimination may be ushering in a new era of opportunity
for Black entrepreneurs.
Evidence discussed in the next section of this study shows that Blacks
in protected, traditional lines of business tend to be overcapitalized
while unprotected, emerging enterprises are clearly undercapitalized. Firms
in unprotected fields earn a much higher rate of return on net investment
and they are larger (as measured by total assets) than protected businesses.
The findings suggest that the more traditional, protected lines of Black
enterprise have little need for greater access to capital markets because
they typically operate with minimal amounts of capital and their estimated
rate of return on net investment is extremely low. Unprotected Black-owned
businesses would benefit from greater access to capital markets; their
estimated rate of return on net investment is approximately 16 percent and
their liquid asset positions are typically very weak.

5
B. Determinants off Profitability for Black Businesses
The body of data analyzed in this study has been collected from the
loan applications of business borrowers; audited business balance sheets
and income statements have been used as the source of information. Under
Project OWN, long-term bank loans to minority firms are insured against
default risk by the Small Business Administration (SBA). Because of Project
OWN and similar programs for lending to minorities, the SBA possesses a
most comprehensive collection of data on Black businesses. Using information
provided by SBA's Office of Records, a random sample of Black firms in
Chicago, New York, and Boston was selected for analysis.
While the samples of businesses analyzed in the remainder of this
article are not a representative cross section of all Black firms, they are
particularly useful for several reasons: 1) these data are the most
complete and accurate data on Black businesses that I know of; 2) a most
interesting aspect of the Black business community is its potential for
future expansion and this potential can best be estimated by examining data
on firms that are receiving long-term loans to expand their business
operations; 3) the existing firms in the sample of SBA borrowers tend to
be large relative to all Black firms, which suggests that the SBA data focus
upon an elite group of Black entrepreneurs; 4) if lack of access to capital
markets has, in fact, severely limited the scope of the Black business
community, then the potential of Black entrepreneurship can best be under
stood by focusing upon new and expanding Black firms that actually do have
access to capital markets. This last point is the most important single
justification for restricting the remainder of this study to analyzing data
collected on the :"samples of SBA borrowers.

6
By studying an above average group of Black firms, one risks painting
too optimistic a picture of Black entrepreneurship if one makes careless
generalizations, on the basis of the samples of SBA borrowers, about the
overall Black business community. On the other hand, if Black entrepreneur-
ship has any potential for alleviating ghetto problems, this potential
should certainly be most easily identified by studying samples of high
caliber Black enterprises. Brief summary statistics are presented in
Table 1 and Table 2 to summarize the more important traits of the sample
of Black loan recipients. Bank loans guaranteed by SBA are included in
the sample and in all summary statistics.13
Because Black-owned enterprises vary in size, profitability, line of
business, and a number of other characteristics, it is difficult to make
global statements about Black entrepreneurship. In this section, criteria
are presented for estimating the profitability of Black firms having various
levels of sales, labor input, and capital input. Using the SBA loan data
collected in Chicago, Boston, and New York, multiple linear regression models
explaining firm profits are reported for the 285 Black existing businesses;
in addition, separate models have been estimated for the traditional and
the emerging lines of Black enterprise.
1, The Variables
Business income statement (flow) variables were recorded in dollar
amounts for the most recent full year prior to the filing of the loan
application. The net profits figure, which measures annual profits of the
firm under consideration, has most commonly been picked up from the
b " 14orrower s lncome tax return",

Table 1
Black Existing Business Loan Recipients in Boston, New York, and
Chicago: Mean Values for Selected Business Characteristics
Total Sales $74,101
7
Net Profits (including owner's withdrawals)
Current Assets (excluding intangibles)
Total Assets (excluding intangibles)
Total Liabilities
Owner's Management Experience (years)
Loan Amount
Number of Observations in This Group
Table 2
$ 7,000
$17,110
$30,029
$19,528
8.45
$27,740
285
Existing Black Business Borrowers in New York, Boston, and Chicago:
Mean Values of Sales and Profits by Industrial Classification
(in dollars)
Number of Mean Annual Mean AnnualFirms Sales Profits
Retail 99 92,570 7,779
Contracting Services 29 97,836 6,650
Professional Services 22 53,224 10,566
Other Services 89 41,092 6,223
Wholesaling, Manufacturing 46 93,237 5,342
All 285 74,101 7,000

8
For business balance sheet variables, values in dollar amounts were
taken from the most recent business balance sheet available at the time of
the SBA loan application. All assets and liabilities are strictly business
related. The explanatory variables are straightforward--a complete list of
the variables used in regression analysis exercises appears below:
Total Sales total annual sales of the
Employees
Outside Job
Experience
Business Net Worth
Business Liquidity
business under consideration.
total tangible assets minus total
liabilities.
total business cash and accounts
receivable minus current liabilities.
years of managerial experience.
number of business employees,
excluding the owner.
indicates whether the entrepreneur
holds a job outside of the business
being considered; dummy variable.
Four additional explanatory variables were created by multiplying total
sales by four dummy variables representing types of business, including 1)
retail sales, 2) contracting services, 3) professional services, 4) other
services: sales in retailing, sales in contracting services, sales in
professional services, sales in other services.
2. Hypothesized Relationships
In the business community, the term "profits" refers to the sum
available to a firm after all payments for factor unit services and other
current obligations such as taxes have been covered. In a given time
However, in the real world, small businessmen operate
period, a firm obtains a certain sum from the sale of its products and it
makes various 'contracted payments for labor services, materials, transporta-
tion, power, etc. The firm must meet rent, insur·ance, interest and tax
obligations; because capital equipment owned declines in value during the
period, depre,ciation charges must be charged against receipts as a cost.
The excess of total receipts over all of these payments and charges is
considered to be the profit of the firm. For businesses being analyzed in
this study, reported net "profits" consist of payments for the use of labor
and capital services provided by the owner of the enterprise. For small
firms, a large portion of business profits is a noncontractual wage payment
for work performed by the entrepreneur. The remainder consists of (1) income
which would have been earned if the entrepreneur-owner had invested his
capital in some other enterprise, and (2) a reward for risk exposure.
When the theory of the firm is derived from assumptions of certainty,
factor divisibility, and competitive markets, business profits can be
identified as returns to entrepreneurial inputs of human capital and
h . 1 . 1 15P YSlca caplta.
with lumpy factors in an environment of imperfect markets and are exposed
to considerable uncertainty. Data collected from the SBA do not permit
precise measurement of the quantity and quality of entrepreneurial inputs
to the firms under consideration.
Business profits are expected to be a function of five variables: (1)
the owner's nonhuman capital inputs, (2) the owner's human capital inputs,
(3) the value of annual production, (4) the business's liquidity and (5) the
number of its employees. The value of annual production should be measured
by value added, but the unavailability of this information necessitates

10
using annual sales as a proxy for annual value added. Hypothes.ized
relations between profitability and these five factors are explained in
detail below. While all hypotheses about business profits reflect an
assumption of ceteris paribus, one should note that it is impossible to
have ceteris paribus changes in cash and accounts receivable minus current
liabilities, because any change in this variable will necessarily change
the value of business net worth.
1. Firms having larger inputs of owner's nonhuman capital, as measured
by business net worth, will tend to have high~r profits.
2. Firms having larger inputs of entrepreneurial human capital will
tend to have higher profits. In an attempt to measure both the qualitative
and the quantitative aspects of human capital input, owner's experience is
interpreted to describe quality and outside job to describe quantity.
Years of management experience could in£luence reported profits in
different ways. Experience should help one to be more successful in
business. While owner experience should bring about higher business profits,
experience may also enable one to fill out tax forms in a manner that
lessens a firm's income tax liability. Because the value of profits was
most often picked up from income tax returns, the experienced entrepreneur
may tend to show lower reported profits because he is seeking to minimize
the burden of income taxes. Finally, experience is positively c~rrelated
with age of the owner and older entrepreneurs perhaps operate their firms
more conservatively.or, in the extreme case, they might be a bit senile;
in either case, entrepreneurial experience could lower business profitability.
A positive coefficient for the experience variable would suggest that
experience enables one to operate more profitably, but the interpretation of
a negative coefficient would be ambiguous.

11
Businesses owned by entrepreneurs holding an outside job are .likely to
show lower profits because less labor input is being rewarded through profits.
The variables for experience and outside job are incomplete measures
of entrepreneurial human capital input for several reasons. The .. intelligence
and drive of the business-owner tend to be directly related to profitability
but no direct measures of these traits are available. The experience
variable does not measure relevant work experience in nonmanagerial
capacities. A grocer with one year of managerial experience and five years
of work experience at the check out counter may, for example, be better
prepared for the grocery business than a grocer with one year of managerial
experience only. The entrepreneur who is willing to work relatively longer
hours will tend to have a more profitable business operation, but hours of
labor input are not recorded in the sample data.
3. The val~e of a firm's production, ceteris paribus, will be
positively related to its profits. While value added is the' desirable
measure of the value of a firm's production, total sales is a good proxy
for intra-industry data because value added should be a fairly constant
proportion of total sales within a given industry. Total sales by major
industry group will be used to test for inter-industry differences in value
added; in industries where value added is a high proportion of sales, the
coefficient for total sales should be high. The explanatory power of total
sales will tend to be greater if measures of inputs of physical and human
capital by the entrepreneur are inaccurate. It is well-known that measures
of net worth are subject to arbitrary accounting conventions. Because the
proxies measuring quality and quantity of owner input of human capital are
rather crude, the total sales variable should also partially pick up the

12
effects of intelligence and hard work by entrepreneurs. Holding other
factors constant, relatively low sales by a firm in a given industry is
assumed to be prima facie evidence that the entrepreneur does not work as
hard and/or lacks business acumen relative to the other entrepreneurs in
the field. Firms having higher total sales may have higher profits if
they also have a wider range of products; diversification of lines of
activity reduces the need to maintain unprofitable precautionary cash
balances, etc. In retailing, for example, larger stores carrying more
diverse product lines may be able to insulate themselves from the dangers
of shifting consumer tastes.
4. For a similar reason, firms having greater financial liquidity,
as measured by cash and accounts receivable minus current liabilities,
will tend to have higher profits. Business liquidity reflects a firm's
aQi1ity to cover its day-to-day, short-run cash requirements and the effects
of liquidity on profits are largely caused by imperfections in capital
16markets. A firm's ability to meet current liabilities affects profitability
in two vital ways: in the short-run, being liquid allows one to take
advantage of discounts offered for prompt payment of bills; in the long-run,
being liquid gives one greater access to trade credit which is particularly
vital to growing enterprises in most lines of business.
5. The relation between a firm's profits and the number of its
employees depends upon whether or not a firm expects to grow in the future.
An efficient firm expecting no future growth in its operations will hire
workers up to the point where wages paid to the last worker hired are equal
to the marginal revenue product of that worker: aY/aXg > 0 would imply
that it would be profitable for the firm to hire an additional worker,

13
while aY/aX9
~ 0 implies that the firm is overhiring in the sense that
profits would be increased by firing one worker.
A profit maximizing Black entrepreneur may tend to overhire labor if
he expects that his sales will rise. Since decisions to invest in human
and non-human capital are based upon estimates of the most profitable
output today and in the future, overcapacity is likely to be optimal for
the growing firm. This will be particularly true if factors are lumpy and
for smaller firms, a single employee is often a lumpy factor. Hollis Chenery
has shown that optimal overcapacity also depends upon a firm's production
function, its planning period and discount rate, and uncertainty about
17future demand for its products. Because the sample population consists
of firms receiving long-term loans through the SBA and because most of them
are expanding their business operations, they probably should be observed
18to have an unprofitably large number of workers. Black businessmen might
also feel that overhiring is necessary to maintain good will in the community.
The nature of the SBA data on urban businesses raises several
statistical problems. The dependent variable, net profits, is taken from
the business income statement which reports profits for the most recent
full year prior to filing the SBA loan application. Values of the explana-
tory variable business liquidity, were recorded from the most recent business
balance sheet available at the time of the loan application. The business
balance sheet has therefore been computed at a date quite close to the end
of the time period for which net profits are reported. For firms reporting
high profits, the past year's profits are apt to be overrepresented in the
cash section of business balance sheets that are drawn up at a time close
to the end of the year for which profits have been reported. One should

14
expect some positive bias, therefore, in the coefficient of the business
liquidity variable and this bias might similarly influence the business
net worth coefficient, but not appreciably. Random measurement errors in
the variables tend to bias coefficients toward zero and this phenomenon is
undoubtedly exerting some downward bias on the coefficient of the business
net worth variable. Accepted accounting practices for valuing business
inventories and fixed assets vary widely enough to produce sharply different
balance sheet values for similar assets. When arbitrary differences in
asset values are added to the errors, understatements and overstatements
that characterize the balance sheets of many small businessmen, the business
net worth variable understandably becomes a classic example of a variable
subject to random measurement error. Heteroskedasticity plagues the models
examined in this study, but this problem appears to be minor because when
the dependent variable, the constant, and every explanatory variable are
divided by total assets, heteroskedasticity vanishes and the model results
are not appreciably a1tered.19
3. Empirical Analysis of Black Enterprise: the Entire Sample
When explanatory variables are analyzed and discussed in the remainder
of this article, a .05 cutoff point will be used to determine statistical
significance.
The coefficients based upon sales can be used as estimates of the
marginal profitability of an additional dollar of sales for different firm
types. Because the regression model is linear, coefficients of these
variables can be thought of as profit margins having the following values:
Margin A - 4.70 percent (retail sales)
Margin B - 5.58 percent (contracting services)

15
Margin C - 6.99 percent (professional services)
Margin D - 9.94 percent (other services)
Margin E - 5.99 percent (manufacturing, wholesaling)
Margin A should be interpreted as (aY/a$l sales for a retailer) and
Margin A is calculated by adding the coefficient of sales in retailing to
the coefficient of total sales. Margins in the various industry groups are,
except for other services, not significantly different across industries.
The other services category--which includes firms in transportation, auto-
motive services other than gasoline stations, laundries, beauty and barber
shops, miscellaneous personal services, and three minor categories--consists
of small businesses where value added is a very high proportion of total
sales. The significantly larger coefficient for the sales in other services
variable indicates that, relative to the other industries under consideration,
value added is a higher proportion of total sales in the other services
group.
The coefficient for business net worth measures the rate of return on
the owner's net investment in the business, 14.43 percent for the sample
of Black borrowers.
Cash and accounts receivable min.us current liabilities (business
liquidity) measures a firm's ability to meet its short-term liabilities and
for most Black firms, the value of this variable is negative. This fact
suggests that many Black-owned businesses are highly illiquid and desperately
in need of cash.21
There is a very high penalty for being illiquid; results
of the regression model indicate that business profits drop by 23 cents for
every dollar that current liabilities exceed cash and accounts receivable.

Multiple Linear Regression Model Explaining Profitability
Bl k E · . B· 20ac x1st1ng US1nesses:
16
Variable
Constant
Total Sales
Sales in retailing
Sales in contracting services
Sales in professional services
Sales in other services
Business net worth
Business liquidity
Experience
Employees
Outside job
Regression StandardCoefficient Error
*3797.7861 832.7782
*00599 .0106
-.0128 .0092
-.0041 .0138
.0100 .0199
*.0395 .0144
*.1443 .0315
*.2302 .0332
-72.0116 69.4413
-74.8442 57.9291
*-1979.6919 1023.9021
R2
= .548; F-ratio = 35.39; standard error of estimate =
7819.91; n = 285
*statistically significant at the .05 level.

17
The coefficient of experience is insignificantly negative but is
consistent with a view that experienced businessmen tend to report lower
profits for tax purposes. Many writers have stressed that lack of business
experience among Blacks is a major obstacle to plans for expanding the
size and scope of the Black business community. Regression analysis
exercises reported in this article suggest that entrepreneurial experience
has no clearcut impact on business profits. Although the insignificance
of the experience variable cannot be interpreted unambiguously, it is
clearly possible that prior managerial experience on the part of the owner
may have very little impact upon the level of profitability of a small
business enterprise.
The negative value of the employees coefficient does suggest that
sample firms are overhiring labor, but the relationship is not statistically
significant.
The coefficient for "outside job" indicates that owners holding outside
jobs lose nearly $2,000 in profits relative to the rest of the sample and
this relation is statistically significant.
4. Empirical Analysis of Black Enterprise; Traditional and Emerging
Lines of Business
The first section of this article briefly reviewed two explanations of
the past and present orientation of the Black business community. Governor
Brimmer claims that Black firms are typically "small, service-oriented
businesses which owe their existence to a protective barrier of segregation,,,22
and I have stressed the role that scarcity of capital has played in restricting
most Black entrepreneurs to their traditional lines of small scale enterprise.
·1___________ . . . ._~ . . . - .. _ .. ----- 1

18
Acceptance of the Brimmer thesis does not imply that lack of capital has
been a trivial consideration, and vice versa. If one assumes, though, that
lack of access to capital markets is a minor consideration, and that racial
discrimination has been beneficial for Black entrepreneurs, then Brimmer's
position suggests that Blacks in "protected" fields would earn a rate of
return on net investment that is likely to be higher, but certainly not
lower, than Blacks in unprotected fields 'facing stiff competition from
White competitors. If my thesis is correct, then firms that are in the
unprotected category should tend to be undercapitalized and illiquid
relative to the protected firms. Because protected firms are traditional
lines of Black enterprise requiring little capital, they should be adequately
aapitalized. Undercapitalized businesses whose access to capital markets
has been severely limited should tend to have a higher, and certainly not
a lower, rate of return on net investment than adequately capitalized firms.
Relying primarily upon Andrew Brimmer's concept of protection (the
previously discussed "protective barrier of segregation" notion) the sample
of Black existing businesses was split into two groups: 1) traditional,
protected lines of Black enterprise, 2) emerging, unprotected Black firms.23
After carefully combing through all of Brimmer's writings on Bla~k entre
preneurship, I could not determine whether Black-owned laundries should be
classified as protected or unprotected. Although the precise manner in
which Brimmer employs the concept of protection leaves the categorization of
laundries somewhat ambiguous, laundries ,have certainly been a major
category of firms within the traditional Black business community.24 The
traditional, protected group contains 71 firms and is dominated by three
lines of Black entrepreneurship: beauty and barber shops account for 14 of

19
the observations, restaurants appear 18 times and laundries account for
23 of the 71 firms in this sub-sample. The linear regression model presented
on page 16 was re-estimated for each of these groups of Black firms. The
relevance of Brimmer's protective barrier of segregation notion for under
standing contemporary Black entrepreneurship is inversely related to the
degree to which rate of return on net investment for emerging, unprotected
firms exceeds the rate of return for traditional, protected ones.
For traditional firms, the coefficient of business net worth suggests
that the rate of return on net investment is 0.28 percent; for emerging
firms the corresponding coefficient implies a 15.94 percent rate of return.
For the sample of traditional businesses, mean values of total assets and
net worth are $23,585 and $12,211 respectively while emerging firms reported
corresponding mean values of $32,166 and $9,933.
For traditional firms, the coefficient for business liquidity is .0070,
not significantly different from zero at the .05 level. Mean values of
business liquidity for traditional and emerging firms are -$3,291 and -$6,016
respectively.
The regression coefficients indicate that emerging firms would earn
24.31 cents in annual profits, holding cash and accounts receivable constant,
if current liabilities are reduced by a dollar, and profits would increase
15.94 cents for each additional dollar in net investment. Such large
. increases in net profits for injections of capital and reductions in
liabilities suggest that emerging firms are undercapitalized.
Profits of traditional firms, on the other hand, will not be significantly
affected by increases in business liquidity and/or business net worth; such
firms appear to be overcapitalized.
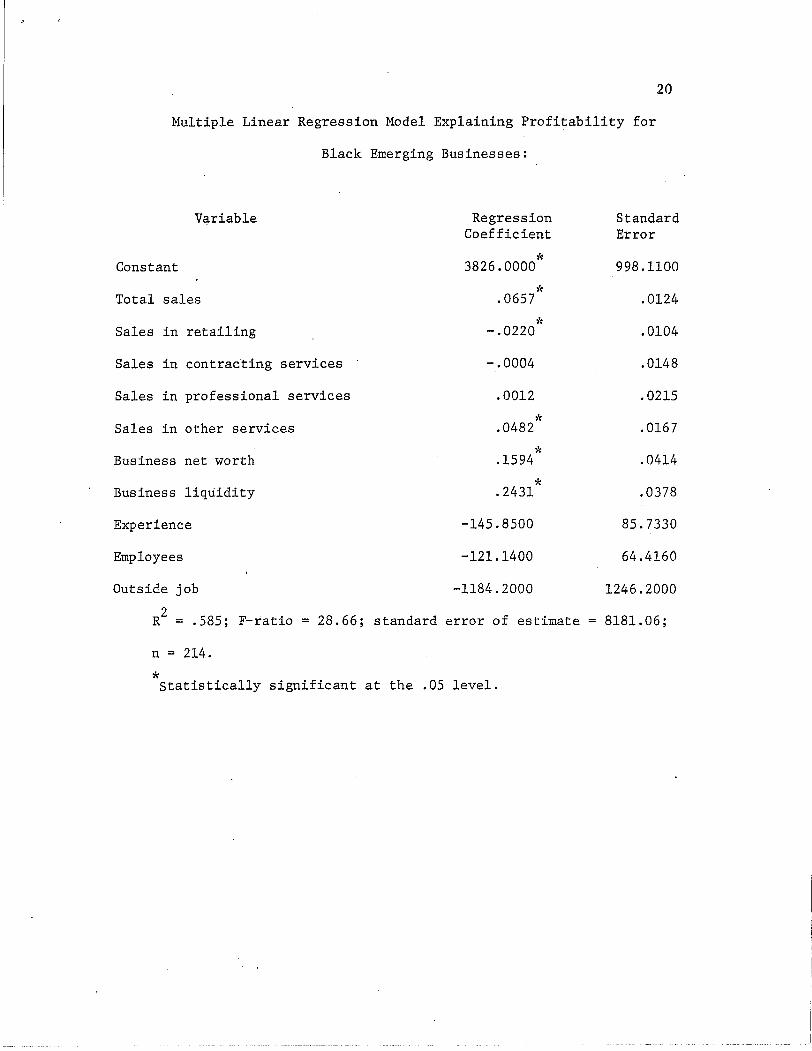
20
Multiple Linear Regression Model Explaining Profitability for
Black Emerging Businesses:
V(3.riable
Constant
Total sales
Sales in retailing
Sales in contrac·ting services
Sales in professional services
Sales in other services
RegressionCoefficient
*3826.0000,~
.0657
*-.0220
-.0004
.0012'/e
.0482
StandardError
998.1100
.0124
.0104
.0148
.0215
.0167
*Business net worth .1594
*Business liquidity .2431
Experience -145.8500
Employees -121.1400
Outside job -1184.2000
2R = .585; F-ratio = 28.66; standard error of estimate
n = 214.
*Statistically significant at the .05 level.
.0414
.0378
85.7330
64.4160
1246.2000
8181. 06;

21
Multiple Linear Regression Model Explaining Profitability for
Black Traditional Businesses:
Variable
Constant
Total sales
Sales in retailing
Sales in professional services
Sales in other services
Business net worth
Business liquidity
Experience
Employees
Outside job.
RegressionCoefficient
~~
4917.2271
.1141
-.0561
.1432
-.0437
.0028
.0070
-73.1820
260.1999~'(
-4276.6Q75
StandardError
1100.9922
.1133
.1125
.1187
.1118
.0388
.0794
85.7145
188.0888
1242.8559
R2 = .758; F-ratio = 21.28; standard error of estimate
n = 71
*Statistically significant at the .05 level.
4684.43;
._--_._---~---------~._-----------------

22
It is clear from a profile of the sample data that the newer Black
owned firms that have been provided access to capital markets are entering
lines of business not previously occupied by Blacks. Results of the above
regression analyses provide strong empirical support for my affirmation that
Blacks concentrated in narrowly circumscribed fields like laundries,
restaurants and barbershops for such a long time not primarily because
these kinds of businesses were left to them by White businessmen, but,
more importantly, because these were fields in which one could begin and
continue operations with very little capital. If Blacks continue to have
access to capital markets, Black firms can be expected in almost all lines
of commerce and industry. It was primarily lack of access to the capital
markets which previously prevented Blacks from operating outside of the~r
traditional lines of business.
In the model explaining profits for traditional firms, profit margin
variables have little meaning because only five firms fell into the profes
sional services category, three wholesalers or manufacturers were observed,
and no firms fell into the contracting services category. This lack of
observations for certain types of businesses makes accurate estimation of
profit margins an impossible task. For businesses in the retailing and
other services industries, margins were not significantly different for the
samples' of traditional and emerging firms.
While management experience and other job variables performed rather
similarly for the groups of traditional and emerging Black firms, the
employees variable produced strikingly different results. For traditional
firms, the employees coefficient is negative and borders on the cutoff point
for statistical significance. These results suggest that emerging firms

23
tend to overhire labor, which is consistent with a profit maximization
strategy if one expects that sales will be rising in the future. The clear
cut differences in results for the employees variable suggests, following
Chenery's argument, that entrepreneurs in the emerging lines of business are
gearing their busin~sses for future growth to a greater extent than the
firms in traditional fields.
To test the value of estimating separate models to explain net profitsb
for the samples of traditional, protected and emerging, unprotected firms,
the residual sums of squares from the model based on the pooled sample of
285 firms were compared to the summed residual sums of squares for the
separate models (analysis of covariance), and the separate models explain
net profits more accurately than the pooled model (F = 4.34); this difference
in explanatory power is statistically significant at the .01 level.
Because Black economic development programs call for the expansion of
existing businesses and the creation of new ones, the above findings on the
emerging lines of Black enterprise have interesting policy implications.
Writers on Black entrepreneurship have often assumed that emerging Black
firms would be replicas of the existing species, but the empirical analyses
cited herein suggest that it is invalid to assume that new and expanding
Black firms will conform to the stereotype of the small~ undercapitalized,
inefficient Black firm of the past. The erosion of segregation and dis-
crimination may be ushering in a new era of opportunity for Black entre-
preneurs; if capital markets remain open to Blacks, the future Black
business community may be characterized by a relatively greater number of
large firms competing effectively in all lines of business. The large
difference in rates of return between traditional businesses and the emerging

24
lines of Black enterprise suggests that financial capital may not be utilized
efficiently within Black inner-city areas. Establishment of financial
intermediaries to facilitate the flow of funds from overcapitalized to
undercapitalized segments of the Black business community should increase
the prosperity of ghetto areas.
c. Evaluating the Viability of Various Black Firms
A business may be considered "viable" if it generates a level of
profits adequate to justify the full-time efforts of a capable individual.
No single number can describe the income level that is adequate because
entrepreneurs are a heterogeneous group--a skilled plumbing contractor may
feel that an annual return of $12,000 does not justify his remaining in
business while a barber may be living contentedly on $5,000 per year. The
linear regression model discussed on page 16, though, is useful for policy
purposes if an agency like SBA decides that it does not want to perpetuate,
knowingly, marginal firms which produce low incomes for their owners. These
models are perhaps most useful for showing potential entrepreneurs the
levels of profits typically associated with various scales of operation in
different fields. One of the great tragedies of Black capitalism promotional
programs has been the frequency with which the availability of loan funds
has induced Black wage earners to become owners of businesses that are not
viable.
Assume, for example, that a potential entrepreneur with eight years
experience decides to open up his own retail clothing shop. If he has $3,000
in personal savings, he can qualify for a maximum loan of $20,000 from SBA.
Assume that the projected business will have $50,000 in annual sales and no

25
liquidity problems; the entrepreneur hires three employees and invests his
personal $3,000 plus $20,000 from SBA into the business. If everything
goes as planned, then this entrepreneur should expect profits (including
owner's salary) of $5,780 per year, which is probably much less than he
could be earning in some nonentrepreneural capacity. If this hypothetical
entrepreneur took an outside job in addition to running his clothing store,
then expected profits would be less than $3,800 per year. If the clothing
store encountered liquidity problems, typical for small retailers, then
profits would be still lower. To establish a viable business, this entre-
preneur should double his investment and generate an annual sales volume of
$100,000; expected annual profits should then be about $8,600, barring
unforeseen problems.
Using the mean values of the explanatory variables total sales, business
net worth, business liquidity, experience, and employees by business type
for the sample of 285 Black existing firms, levels of profits were estimated
for the various lines of business. Profit estimates were ~alculated using
the linear regression model described earlier; entrepreneurs, by assumption,
hold no outside jobs.
Mean Business Net Mean Sales Estimated ProfitsWorth for This for This for Firms having
Category Category Mean Values of theExplanatory Variables
Retailing $13,231 $92,570 $8,190.03
Contracting Services $5,549 $97,836 $7,751.11
Professional Services $15,400 $53,224 $10,427.44
Other Services $6,210 $41,092 $6,988.15

26
The manufacturing, wholesaling cateogry has been excluded because it
is difficult and possibly misleading to generalize about such a heterogeneous
group of businesses. Viability in retailing, the most popular field for new
and expanding Black firms, requires a fairly substantial net investment and
the ability to generate an annual sales volume in the $100,000 range.
Potential entrepreneurs having less than $10,000 to invest would most
likely succeed in the labor intensive service industries where profit
margins are highest and business viability can be established by generating
annual sales in the $50,000 range. Entrepreneurs with slender financial
resources should avoid the field of retailing,.
-- ~------ ------------------------------ ---------- -- --_.-

27
FOOTNOTES
lRobert B. McKersie, "Vitalize Black Enterprise," Harvard BusinessReview 46 (September 1968):88-99.
2See , for example, Lewis L. Allen, "Making Capitalism Work in theGhettos," Harvard Business Review 47 (May 1969):83-92; Theodore Cross,Black Capitalism (New York: Atheneum Press, 1969); and Gerson Green andGeoffrey Faux, "The Social Utility of Black Enterprise," in Black EconomicDevelopment, G. Douglas Pugh and William F. Haddard, eds., pp. 21-37(Englewood Cliffs, New Jersey: Prentice-Hall, 1969).
3This theory is explained most fully in Adrew Brimmer, "The Negro inthe National Economy," in American Negro Reference Book, edited by JohnDavid, (Englewood Cliffs, New Jersey: Prentice-Hall, 1966); pp. 291-292of the Spring 1971 Public Policy article by Brimmer and Henry Terrell containa brief summary of Brimmer's theory of the Black business community. TheBrimmer and Terrell article in Public Policy is of special interest becauseit attempts to support empirically Brimmer's theoretical works on Blackcapitalism.
4See, Timothy Bates, "The Potential of Black Capitalism," Public Policy21 (Winter 1973):135-148.
5See, Timothy Bates, Black Capitalism: A Quantitative Analysis(New York: Praeger, 1973), chapters 1, 2, and 4.
6For a general overview of the major government and banking industryprograms for lending to Black businesses, see, Timothy Bates, "An EconometricAnalysis of Lending to Black Businessmen,lI The Review of Economics andStatistics 55 (August 1973):272-283.
7This is expressed in detail, in Bates, "Potential of Black Capitalism,"pp. 143-145.
8Ibid ., p. 145.
9Andrew Brimmer, "desegregation and Negro Leadership," in BusinessLeadership and the Negro Crisis, edited by Eli Ginsberg, p. 34 (New York:McGraw-Hill, 1968).
lOBrimmer, "The Negro in the National Economy," p. 291.
11Bates, "Potential of Black Capitalism," pp. 144-146.
12See, Bates,Black Capitalism, chapter 1.

28
l3The ·mean values reported in Table 1 are intended to describe a"typical" Black firm; one extremely large Black firm was therefore notincluded when the mean values were calculated; standard deviations andmedian values for these variables are reported in part C of the appendixto chapter 1, of Bates, Black Capitalism.
l4When corporations were encountered in the process of data collection,owner's salary from the business was added back into net profits in orderto make the profits figure comparable for proprietorships, partnershipsand corporations. Net profits, the dependent variable, is thereforeequivalent to returns to owner in this study. For a more detailed description of the explanatory variables, see part B of the appendix to chapter 1of Bates, Black Capitalism.
15Joseph Schumpeter has identified innovation as a source of businessprofits over and above usual implicit factor costs but for one-owner firms,profits from innovation are synonymous with returns to innovative owners;profits from innovation are returns to the human capital input of theentrepreneur.
l6capital market imperfections relevant to small business borrowersinclude transaction costs, uncertainty, racial discrimination and legalceilings on interest rates.
l7Hollis Chenery, "Overcapacity and the Acceleration Principle,"Econometrica 20 (January 1952):1-28.
l80vercapacity is expected to appear in the form of labor rather thanphsyical nonhuman capital because, as suggested earlier, Black entrepreneurshave had limited access to capital markets. Evidence presented on pp. 16-22of this article empirically demonstrates that most Black firms are undercapitalized. Black businessmen have virtually free access to local labormarkets and limited access to the sources of nonhuman productive capital;the undercapitalized Black entrepreneur would therefore tend to expand byhiring additional employees; and overcapacity would most likely appear inthe form of labor.
19Dividing through by total assets, though, leads to multicollinearityamong a number of the explanatory variables. When the dependent variable,the constant, and every explanatory variable are divided through by totalassets, the equation explaining net profits for Black existing firmsbecomes:
* *y = 3600.197 + .066Xl
- .007X2 +.OOlX3
+ .014X4(315.79) (.010) (.012) (.028) (.015)
l~ * l~ l~
+ .092X5
+ .134X6+ .374X
7 - 84.138X8 - 57.260X9(.028) (.061) (.081) (19.484) (69.026)
*- 1,262.525XlO(349.151)
(standard error is in parentheses)R2 = .79, F = 96.18, n = 285.
*Statistically significant at the 5 percent level.

29
Y, Xl' X2
, X3
, X4
, X5
, X6
, X7, X8
, X9
, and XIo correspond, respectively,
to net profits, total sales, sales in retailing, sales in contractingservices, sales in professional services, sales in other services, businessnet worth, business liquidity experience, employees and other job--alldivided by total assets.
20In the models explaining net profits for Black existing firms, oneobservation was deleted because its industrial classification was not clear.
2lAdditional evidence presented in Timothy Bates, "Financing BlackEnterprise," forthcoming in The Journal of Finance, strongly suggests thatmany Black firms are desperately in need of cash.
22Brimmer and Terrell, "Economic Potential of Black Capitalism," p. 295.
23The following direct quotes were relied upon to define those firmswhich are protected by segregation:
a. "For the Negro community in the United States, the greatest barrierimposed by segregation was not in the market for goods--to whichthey generally had relatively open access--but in the market forpersonal services (such as barber and beauty shops and funeralservices) and in public accommodations (such as hotels'and restaurants). Consequently, a protected market evolved for provisionof these services within the Negro community," in Brimmer andTerrell, "Economic Potential," (AEA paper), p. 5.
b. "This parallel structure is the predominantly segregated Negromarket. It is basically a market for services. It is the placeof practice for the Negro professfonal (lawyers, physicians,dentists, undertakers). It is the counter for the Negro businessmen (owners of retail outlets, real estate dealers and brokers,life insurance companies, cosmetic manufacturers). And above all,it is the source of personal services purchased by Negroes (barberand beauty shops)," in Brimmer, "The Negro in the National Economy,"p. 254.
c. "If we divide the retail trade sector according to the principaltypes of stores, we see immediately the importance of segregationin providing opportunities for Negro entrepreneurs. For example,in 1960, Negroes operated 2.6 percent of all retail outlets--but5.6 percent of the eating and drinking establishments," in idem,"The Negro in the National Economy," p. 293. Later on this samepage, Brimmer mentions that cosmetics distributors are protectedby segregation. In defining the category of traditional, protectedlines of Black enterprise, all firms that had been directly labeledprotected in Brimmer's writings were included. Additi0nal firmsincluded in the traditional, protected category were laundries,photographic studios and types of entertainment that distinctlyqualify as public accommodations. Law firms and convalescent homes,both labeled protected by Brimmer, did not appear in the sample of285 Black existing businesses.

30
24In 1944, an extensive survey of Black firms in 12 cities found 3,866Black-owned enterprises; laundries were the fourth most common line ofBlack enterprise and they accounted for 288 of these 3,866 firms. See,Joseph Pierce, Negro Business and Business Education (New York: Harper andBrothers, 1947), p. 15.

31
Appendix--Data Handling and Sample Selection
In the spring of 1967 the SBA ordered its regional offices to .start
classifying all loan applicants into appropriate racial, ethnic groupings.
Although loans then in process were generally not classified, by June 1967,
racial designations were available for more than 95 percent of the loans
reaching final approval status. As the first step in selecting the sample
of firms analyzed in this study, a listing (on tape) was received of all
loan approvals originating in the Boston, New York and Chicago regional
offices of the SBA. This listing covered the period from June 1967 -
June 1970, and specificed racial, ethnic group membership of the 3,000+
borrowers. Six minority codes were being used by the SBA: Eskimo, Indian,
Puerto Rican, Spanish American, Asian and Negro.
The SBA data listed above were then punched on data cards (from the
magnetic tape). These cards were sorted by race (ethnic group) and
geographic location so that the following relevant groups were formed:
Loans to Blacks in Suffolk County, Massachusetts;
Loans to Whites in Suffolk County, Massachusetts;
Loans to Blacks in New York City;
Loans to Whites in New York City;
Loans to Blacks in Cook County, Illinois;
Loans to Whites in Cook County, Illinois;
Loans to Eskimos, Indians, Puerto Ricans, Spanish Americans, and Asians
were dropped from further consideration.
The above data processing operations produced a group of 1074 loans to
Blacks from which a final sample of 559 Black businesses was formed. The

32
following series of steps illustrates the processes by which 515 potential
observations were dropped from consideration; the same general pattern is
applicable to the White sample of businesses:
Number of observations according to the'SBA computer
A. Automatic deletions:
1074
1. Loan proceeds never disbursed2. Second or third loan to a business already in
the sample; no business was included more thanonce
3. Loan numbers listed by the SBA computer whichcorresponded to nothing listed with theregional offices; error in SBA records
4. Loan file never located; these primarilyconsisted of new businesses that changed namesbetween the date of loan application and finalapproval
5. Loan repayment deferred; repayment status wastherefore irrelevant
6. Miscellaneous; included declined loans,borrowers that were not Black, and borrowerswhose businesses had left the geographic areaunder consideration
B. Relevant sample for data collection:
90
69
15
23
10
6 213
1. 50% of the new businesses in New York andChicago randomly selected and dropped fromfurther consideration 202
2. Observations dropped because of missing orinadequte information: 94
a. personal financial statementb. profit and loss statementc. business balance sheetd. other
3832
816 296
C. Business for which data was collected from loanfiles and punched onto cards:
Observations having unexplainable inconsistencies
Non-profit educational institutions
Final sample size
565
4
2
559
------ -------- ------------------------------ ----- -------------------------------------_ .. _-

33
Data collected on each existing business included balance sheet
and.income statement items, personal financial statement of the firm owners,
loan terms at the time the loan was made and loan repayment status on the
date the file was coded. Data that have been collected from the Washington
headquarters and from the regional offices of the SBA are, by their nature,
highly confidential. These data were made available subject to specific
conditions imposed by the SBA and cannot be given to othe~ interested
researchers.
------------ ---


