The non-linear response of film to strong signals is caused by the statistics of silver grain activation. Most
researchers are aware that strong signals cause saturation of film, a point at which all silver grains have
been activated. Once saturation is reached, no further signals can be recorded, regardless of their intensity.
However, it is also important to recognize that film response begins to plateau well before saturation is
reached. As the film becomes progressively more exposed and more silver grains are activated, each new
photon of light is statistically less likely to strike an unactivated grain.2,4 This under-represents strong sig-
nals, causing a logarithmic, non-linear response in darkening and OD prior to saturation (Fig. 4). As strong
signals approach the maximum possible density, they lose their ability to show tonal variations on the de-
veloped film. This “overexposure” causes high- and moderate-intensity bands to appear similarly dark and
dense. The non-linear response of film to strong signals contributes to its narrow linear range.4
The tendency of strong bands to blur and spread on film (“blow-out”) also makes quantification difficult.
Stronger bands do not have clear margins; they obscure adjacent bands and cannot be accurately sepa-
rated (Fig. 5). This is especially problematic when stronger bands are located near faint bands, because
the longer exposures required for detection of faint bands increase the spreading of stronger bands.
Figure 4. Strong signals plateau and become saturated. Akt was detected in serial dilutions of NIH-3T3 cell lysate,
using SuperSignal® West Dura substrate and 5-min film exposure. Strong signals are underestimated (boxed region);
they plateau and fail to show tonal variation. Densitometry clearly shows the lack of linear response at higher con-
centrations. The linear range in this experiment spans only 3-4 dilutions (4- to 8-fold).
Figure 5. On film, strong signals blur and
spread to obscure adjacent bands. ARNO
protein was detected in cell lysates, using
ECL Plus substrate and 90-sec film exposure.
Spreading of bands is especially problematic
when longer exposures are required to de-
tect faint bands (right side of blot).
Chemiluminescent Westerns: How film and photochemistry affect experimental results – Page 4
LI-COR Biosciences www.licor.com
The nuances of photochemistry introduce variability into Western blot analysis.
The nuances of photochemistry introduce variability into Western blot analysis. Optical density (OD) is not
a direct function of light generation by the chemiluminescent substrate. It is an indirect function that de-
pends on the response of the film to light.2 The accuracy of densitometry depends on the sensitivity, linear
response range, and exposure time of the film. Reciprocity failure introduces error and limits the ability of
film to present a complete picture of the data. To complicate matters further, reciprocity failure can occur
differently at different locations on the photographic emulsion.
2.3 Image clarity and resolution
When chemiluminescent Western blots are documented with film, band resolution and clarity are often
compromised. Several key factors are involved.
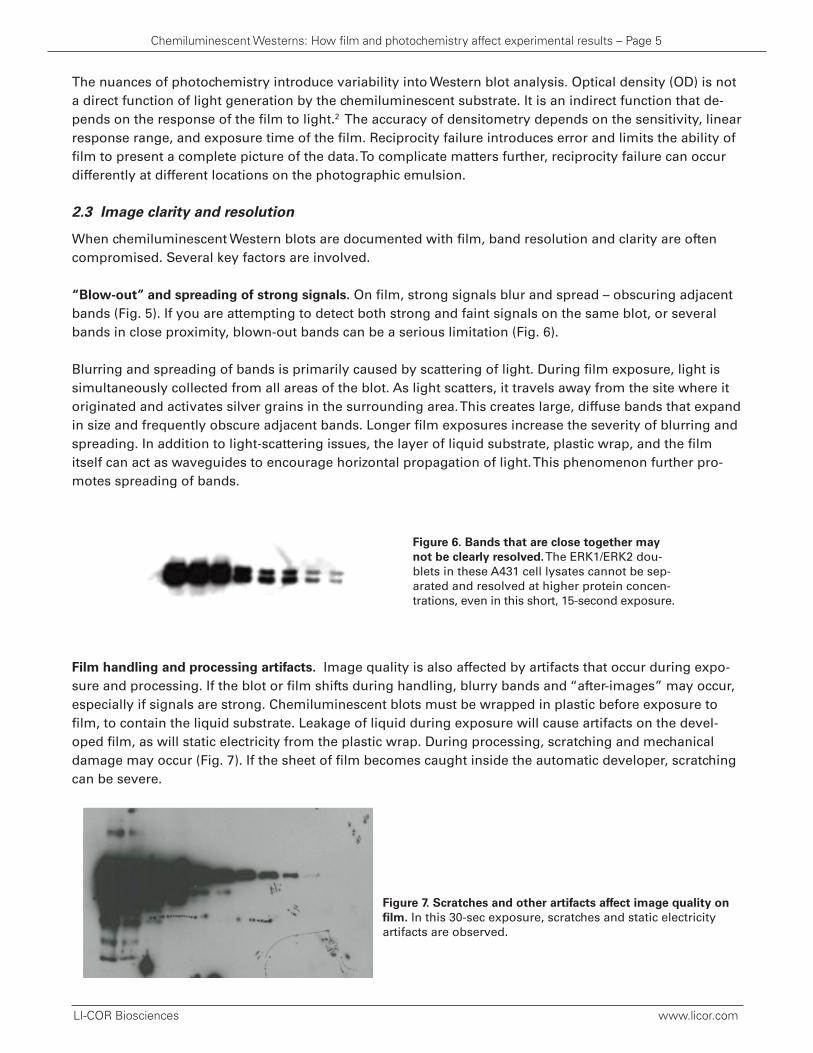
“Blow-out” and spreading of strong signals. On film, strong signals blur and spread – obscuring adjacent
bands (Fig. 5). If you are attempting to detect both strong and faint signals on the same blot, or several
bands in close proximity, blown-out bands can be a serious limitation (Fig. 6).
Blurring and spreading of bands is primarily caused by scattering of light. During film exposure, light is
simultaneously collected from all areas of the blot. As light scatters, it travels away from the site where it
originated and activates silver grains in the surrounding area. This creates large, diffuse bands that expand
in size and frequently obscure adjacent bands. Longer film exposures increase the severity of blurring and
spreading. In addition to light-scattering issues, the layer of liquid substrate, plastic wrap, and the film
itself can act as waveguides to encourage horizontal propagation of light. This phenomenon further pro-
motes spreading of bands.
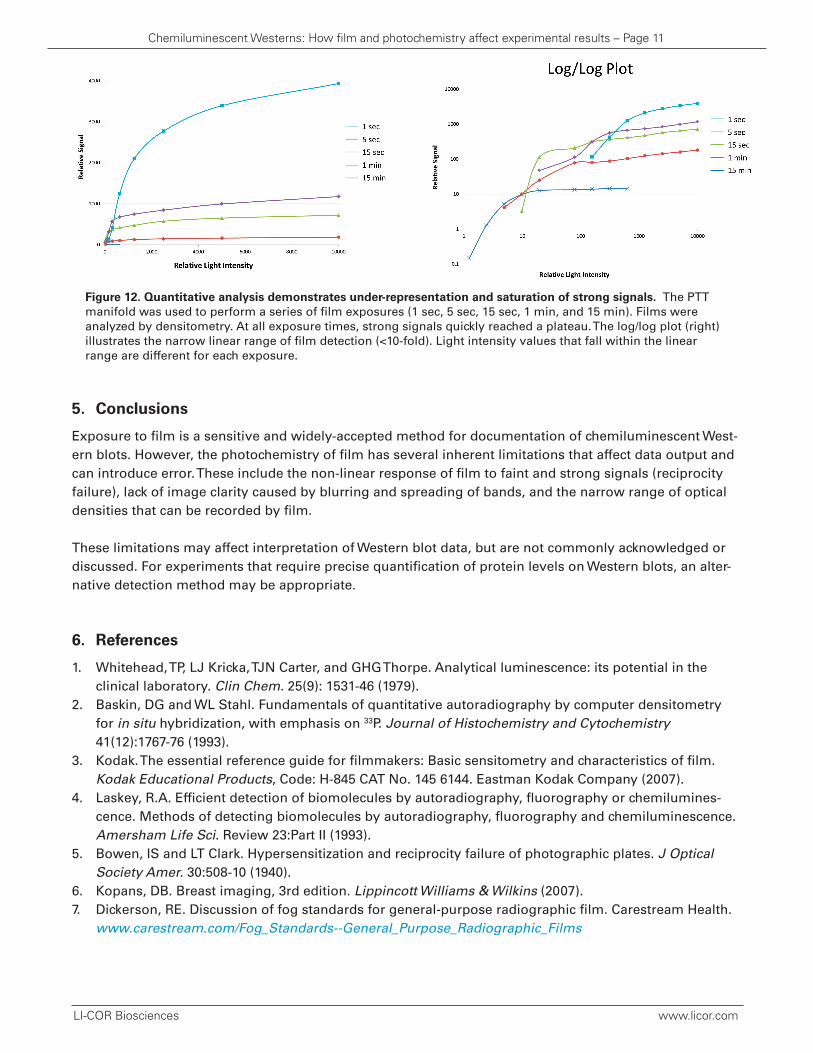
Film handling and processing artifacts. Image quality is also affected by artifacts that occur during expo-
sure and processing. If the blot or film shifts during handling, blurry bands and “after-images” may occur,
especially if signals are strong. Chemiluminescent blots must be wrapped in plastic before exposure to
film, to contain the liquid substrate. Leakage of liquid during exposure will cause artifacts on the devel-
oped film, as will static electricity from the plastic wrap. During processing, scratching and mechanical
damage may occur (Fig. 7). If the sheet of film becomes caught inside the automatic developer, scratching
can be severe.
Figure 6. Bands that are close together may
not be clearly resolved.The ERK1/ERK2 dou-
blets in these A431 cell lysates cannot be sep-
arated and resolved at higher protein concen-
trations, even in this short, 15-second exposure.
Chemiluminescent Westerns: How film and photochemistry affect experimental results – Page 5
LI-COR Biosciences www.licor.com
Figure 7. Scratches and other artifacts affect image quality on
film. In this 30-sec exposure, scratches and static electricity
artifacts are observed.
Parallax. Most commercial X-ray film is double-emulsion (light-sensitive emulsion coatings are applied to
both sides of the film). This provides maximum sensitivity and ease of use, but reduces image clarity and
sharpness. When a Western blot is exposed to double-emulsion film, images are created on both emul-
sions (both sides of the film), then superimposed. This enhances sensitivity, but causes an unwanted paral-
lax effect. Because the two images have different path lengths, the image on the far side of the film is
slightly larger than the image on the near side. When the two images are superimposed, the parallax effect
causes blurring of the edges and reduces the sharpness of the resulting bands.6 If single-emulsion film is
used to avoid parallax, detection sensitivity will be reduced.
3. Types of X-ray film used for chemiluminescent Westerns
Many brands and varieties of X-ray film are available for documentation of chemiluminescent Westerns.
Commercially available X-ray films have many similarities. Most films:
• Use a polyester base to support the light-sensitive photographic emulsion, with an outer layer of
supercoat material to protect the emulsion from scratching, mechanical damage, and static.
• Are double-emulsion (the film is coated with photographic emulsion and anti-scratch material on
both sides). This increases film speed and sensitivity, but may cause blurring due to parallax.
• Are sensitive to blue and green light (orthochromatic). They are not sensitive to red light and are
compatible with red darkroom safelights, although safelights may cause fogging.7
The polyester support layer is typically grey or blue in color. Blue-tinted film has been used for many
years. The blue color is believed to reduce glare and eyestrain during transillumination, and may improve
visualization.7 Some newer, high-performance films are made with a clear base that is thought to improve
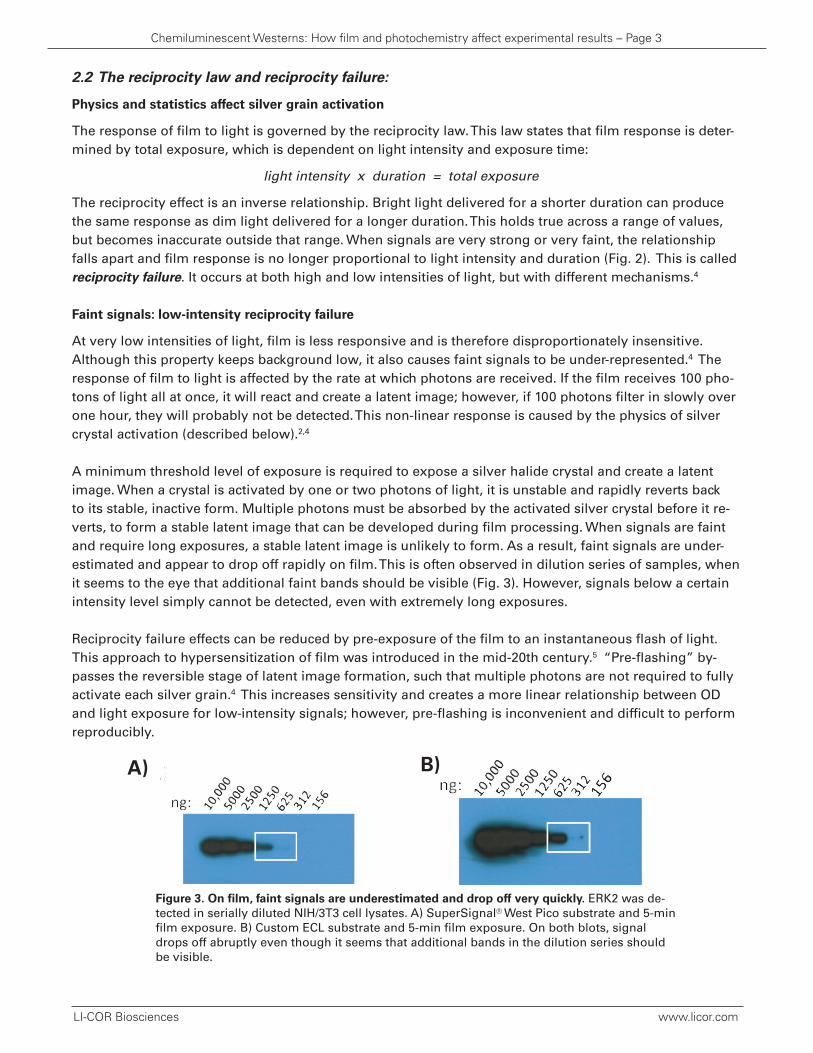
visualization of very faint bands.
Choosing an X-ray film. Proper film choice is determined by the speed (sensitivity) and resolution re-
quired. Speed and resolution are determined by the size of the silver halide crystals and thickness of the
photographic emulsion. Larger crystals and thicker emulsions enhance sensitivity, but at the expense of
resolution. Finer crystals and thinner layers provide greater detail. Maximum-resolution films are best
suited to lower energy β-emitters such as 33P and 14C. High-performance films such as BioMax Light and
Hyperfilm ECL are recommended for chemiluminescence and high-energy emitters such as 32P.
Film sensitivity varies widely, and high-performance films are considerably more expensive. Price varies
widely, ranging from ~ $0.50 to $10 per sheet. Individually-wrapped films are much more expensive than
those in standard, alternate-interleaved packaging. Blue-tinted film is typically more economical but some-
what less sensitive. For maximum performance, a more expensive grey- or clear-base film may be pre-
ferred. Because limited technical specifications are provided, it is very difficult to compare different film
products without side-by-side testing.
4. Quantification of chemiluminescent signals
Chemiluminescent Western blots are sometimes used for quantification. Densitometry of exposed films is
a common approach. The accuracy and dynamic range of this method are variable, and proper controls
are critical for data interpretation.
Chemiluminescent Westerns: How film and photochemistry affect experimental results – Page 6
LI-COR Biosciences www.licor.com
4.1 Variables that influence quantification
Two important variables affect accuracy when chemiluminescent Western blots are quantified.
Detection chemistry (enzyme/substrate kinetics). Chemiluminescence is chemical reaction that releases
energy in the form of light. Enzymatic amplification of signal provides high sensitivity, but signal intensity
is dynamic and transient. Intensity peaks shortly after substrate is applied, and then fades exponentially
with time as the chemical reaction slows. Persistence of signal depends on the chemiluminescent sub-
strate used. Extended-stability substrates are typically more expensive than substrates that fade quickly.
Substrate availability and exhaustion are also significant concerns.1 Substrate distribution and accessi-
bility are never uniform across the entire surface of the blot. Unevenly distributed substrate, pooled sub-
strate, and bubbles can affect substrate availability and cause localized variation in signal intensity (shown
in Fig. 8). Because enzyme/substrate kinetics govern the generation of signal, intensity is unlikely to be
proportional to the amount of target present, or its proportionality may change as the reaction proceeds.
Strong bands with high concentrations of HRP enzyme may cause rapid local depletion of the substrate,
generating central “white-outs” in strong bands where light can no longer be generated.
The limitations of enzymatic detection are intrinsic to chemiluminescent Westerns, regardless of the signal
capture method used. Non-enzymatic detection, such as fluorescent detection with fluorophore-labeled
secondary antibodies, eliminates this source of variability.
Signal capture and densitometry. Chemiluminescent signals are often captured by exposure to X-ray film.
This method is very sensitive, because long exposures can be used to detect low-intensity signals; how-
ever, the response of film to light intensity is non-linear. Because of reciprocity failure, strong and faint
signals may not be accurately captured and the range of linear response is quite narrow.4
Several film exposures of different lengths are typically required to capture the desired image. Exposure
time must be long enough to detect the desired target, but short enough to limit undesired background.
Figure 8. Substrate availability can affect signal intensity on chemiluminescent Westerns. The same pair of
samples was loaded three times on a single blot (10 μg or 5 μg of C32 cell lysate; circled areas). SuperSig-
nal West Pico substrate was used for detection, with 5 min film exposure. Non-uniform distribution of sub-
strate across the blot made some signals noticeably stronger than others (orange circle).
Chemiluminescent Westerns: How film and photochemistry affect experimental results – Page 7
LI-COR Biosciences www.licor.com
A single exposure can only provide optimal detection across a narrow range of signal intensities. If the
exposure is too long, background may begin to obscure the signal. Stronger bands merge and blur to-
gether, and “blown-out” bands make quantification difficult. Reciprocity failure causes faint signals and
strong signals to be under-represented (Fig. 9). Saturation prevents measurement of further change in
signal intensity, and prevents accurate comparison of band intensities.
4.2 Densitometry
After film exposure, densitometry is sometimes used to quantify protein levels on Western blots. This
method measures the optical density (OD), or degree of darkness, of photographic material. It is important
to remember that OD is not a direct function of light generation by the chemiluminescent substrate.2 It is
an indirect function that depends on the response of film to light, which is non-linear. The accuracy of den-
sitometry is therefore dependent on the sensitivity, linear response range, and exposure time of the film.
Densitometry measures the degree of darkness of the image as a function of light transmission; density
equals the logarithm of the reciprocal of transmittance. For example, if a region transmits one-tenth of the
incident light, its density is equal to 1 (Table I).10
Figure 9. Densitometry of film is limited by signal saturation. A) Purified AKT was detected on a Western blot
with chemiluminescence and exposure to film. B) Signals were quantified by densitometry of the exposed film.
The sigmoid curve indicates signal saturation and limited dynamic range using densitometry and film.
Reprinted from Wang et al, 2011.9
Chemiluminescent Westerns: How film and photochemistry affect experimental results – Page 8
LI-COR Biosciences www.licor.com
OD is not a direct function of light generation by the chemiluminescent substrate. It is an indirect function that
depends on the response of film to light, which is non-linear.
% Light Transmitted Optical Density (OD)
80% 0.1
60% 0.2
40% 0.4
20% 0.7
10% 1.0
5% 1.3
1% 2.0
Table I. Relationship between light transmittance and OD.10
A) B)
For Western blot analysis, the useful range of densities is approximately 0.2 – 2.0 (roughly 10-fold).2 When
unexposed film is processed, it has an OD of 0.15 - 0.20. This is called the gross fog density of the film, and
signals must exceed this density to be recorded. An OD of 1.0 indicates a medium grey tone (halfway be-
tween white and black). High ODs (above 2.0) appear black and indicate saturation; they cannot be discrim-
inated from one another. The overall response of film is non-linear, but approaches linearity over narrow
ranges (Fig. 9). A standard curve is strongly recommended to confirm the linear range of film
response for each experiment.
Important factors in densitometry
The variable nature of Western blot densitometry methods was examined in detail by Gassmann et al(2009).11 This study correlated plasma Epo (erythropoietin) values for various mammalian species, deter-
mined by radioimmunoassay (RIA) and Western blot densitometry. Densitometry was performed under
28 different conditions. Variables included method of image acquisition (office scanner or CCD system),
background correction, software, and definition of OD value. The comparison was based on the p-value
of the linear regression between RIA and Western blot values. Depending on the densitometry conditions
used, the p-value of the regression line ranged from 0.000013 to 0.76. The same data could be used to
make statistically valid, but completely contradictory statements about the correlation between RIA and
Western blot results.
This 2009 study describes two key pitfalls in densitometry.11
• First, variability can arise during digitization of films. Office scanners are frequently used, but may
provide limited dynamic range and uneven illumination of the scan area. More importantly, many
desktop scanners have automatic gain controls that make the OD of a band also a function of the
surrounding image structure. Automatic gain control resulted in 1.5- to 105-fold variation in the
measured OD of identical spots, due to differences in the structure of the rest of the image. Auto-
matic gain controls should not be used when scanning films for densitometry.
• The second pitfall involves the method of measurement. Important factors include the background
correction algorithm, the sample tool size relative to lane width, and the definition of OD value (the
integral or sum of all peak heights is recommended). The authors consider image acquisition and
software parameters to be an important aspect of Western blot densitometry and analysis.
4.3 Examination of film response using an LED light source
To examine signal capture issues and reciprocity failure in more detail, it is helpful to use a model system
that eliminates all variability contributed by detection chemistry. One approach is to replace the enzyme/
substrate reaction with a light-generating LED performance test target (PTT) manifold.12 The PTT emits
calibrated light across a wide range of intensities, using an LED backlight panel with regulated brightness
levels that decrease in two-fold steps (Fig. 10). There are four duplicate slots for each brightness level, and
a total of 18 brightness levels. The PTT is ideal for direct testing of film response because detection chem-
istry is eliminated, creating consistent and reproducible light intensities that are unaffected by timing.
Chemiluminescent Westerns: How film and photochemistry affect experimental results – Page 9
LI-COR Biosciences www.licor.com
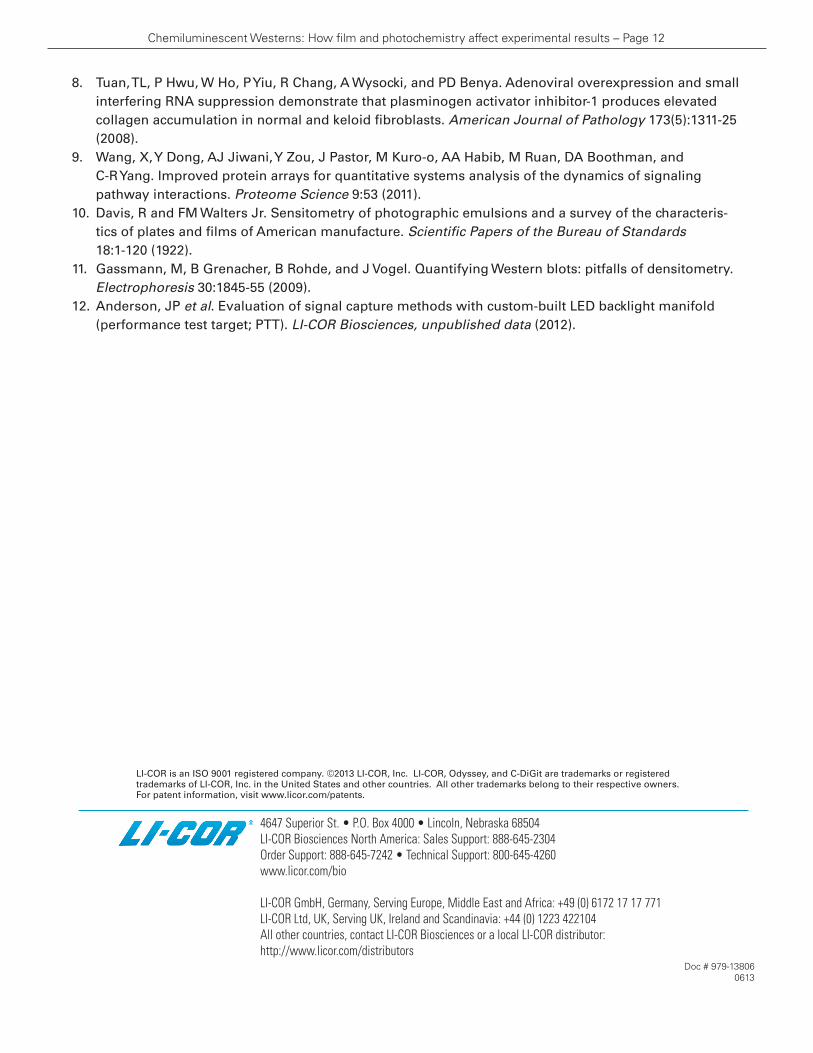
The PTT manifold was used to generate a series of film exposures (Fig. 11) that were analyzed by densito-
metry.12 High-intensity reciprocity failure was clearly observed. As strong signals caused film to become
progressively more exposed, the optical density of bands began to plateau. Because each new photon of
light was statistically less likely to strike an unactivated silver grain, strong signals were under-represented
on film. Near the saturation point, bands no longer showed tonal variations on the developed film. “Over-
exposure” caused strong and moderate bands to appear similarly dark and dense (Fig. 11A).
Quantification of signals from the PTT manifold is shown in Fig. 12. All exposure times (1 sec - 15 min)
demonstrated plateau and saturation of strong signals – even when exposure time was limited to 1 sec.
Each exposure displays a narrow range of linear response (4 - 8-fold), but the boundaries of that range
are different for each exposure. This illustrates the importance of using an appropriate standard curve for
analysis of protein levels with film and densitometry.
Figure 10. Layout of the PTT light manifold.The
LED backlight panel emits regulated levels of
brightness, decreasing in two-fold steps. There
are four duplicate slots for each brightness level.
Each slot is 8 mm x 1 mm. Slots are spaced 1 mm
apart within each brightness level, and 1.5 mm
from one level to another.
Figure 11. Saturation of strong signals on film. A) 15-second film exposure of PTT light manifold. Strong and mod-
erate signals appeared similarly dark and dense. The strongest signals (top left) were saturated, and had begun to
blur and spread. Weaker signals (A, right) were not visible in this short film exposure. B) 1-minute film exposure.
All strong bands appeared dark and dense. The strongest signals (B left) showed significant blurring. Weaker sig-
nals (B, right) began to be detected. C) 15-minute film exposure. This long exposure allowed weaker signals to be
detected (C, right), but those began to saturate and blur at the top. Strong signals (B, left) were saturated and
blurred together completely.
Chemiluminescent Westerns: How film and photochemistry affect experimental results – Page 10
LI-COR Biosciences www.licor.com
One brightness level
5. Conclusions
Exposure to film is a sensitive and widely-accepted method for documentation of chemiluminescent West-
ern blots. However, the photochemistry of film has several inherent limitations that affect data output and
can introduce error. These include the non-linear response of film to faint and strong signals (reciprocity
failure), lack of image clarity caused by blurring and spreading of bands, and the narrow range of optical
densities that can be recorded by film.
These limitations may affect interpretation of Western blot data, but are not commonly acknowledged or
discussed. For experiments that require precise quantification of protein levels on Western blots, an alter-
native detection method may be appropriate.
6. References
1. Whitehead, TP, LJ Kricka, TJN Carter, and GHG Thorpe. Analytical luminescence: its potential in the