HLT07 MeDD Report Status: PU Public Final Publishable JRP Report Issued: July 2016 Version V1.5 1 of 30 JRP-Contract number HLT07 JRP short name MeDD JRP full title Metrology for drug delivery Version numbers of latest contracted Annex Ia and Annex Ib against which the assessment will be made Annex Ia: V1.5 Annex Ib: V1.3 Period covered (dates) From 1 st June 2012 To 31 st May 2015 JRP-Coordinator Name, title, organisation Peter Lucas, Dr. ir., VSL Tel: +31 15 2691538 Email: [email protected]JRP website address www.drugmetrology.com Other JRP-Partners Short name, country CETIAT, France CMI, Czech Republic DTI, Denmark METAS, Switzerland IPQ, Portugal TUBITAK, Turkey REG-Researcher (associated Home Organisation) Researcher name, title (Home organisation Short name, country) Annemoon Timmerman, Dr. ir. UMC Utrecht, Netherlands Start date: 1 st October 2012 Duration: 24 months Researcher name, title (Home organisation Short name, country) Stephan Klein, Prof. FH L, Germany Start date: 1 st October 2012 Duration: 32 months Researcher name, title (Home organisation Short name, country) Annemoon Timmerman, Dr. ir. UMC Utrecht, Netherlands Start date: 1 st October 2012 Duration: 32 months FINAL PUBLISHABLE JRP REPORT
Transcript
HLT07 MeDD
Report Status: PU Public
Final Publishable JRP Report
Issued: July 2016
Version V1.5 1 of 30
JRP-Contract number HLT07
JRP short name MeDD
JRP full title Metrology for drug delivery
Version numbers of latest contracted Annex Ia and Annex Ib against which the assessment will be made
Annex Ia: V1.5
Annex Ib: V1.3
Period covered (dates) From 1st June 2012 To 31st May 2015
JRP-Coordinator
Name, title, organisation Peter Lucas, Dr. ir., VSL
1 Executive Summary .............................................................................................................. 3 2 Project context, rationale and objectives ............................................................................... 4 3 Research results ................................................................................................................... 5
3.1 Development and characterisation of primary standards .................................................... 5 3.1.1 Introduction ........................................................................................................................ 5 3.1.2 Steady flow from 5 µl/h to 100 ml/h .................................................................................... 5 3.1.3 Steady flow from 60 nl/h to 600 nl/h ................................................................................... 6 3.1.4 Varying and dynamic operating conditions ......................................................................... 9 3.1.5 Validation ........................................................................................................................... 9 3.1.6 Calibration services .......................................................................................................... 11 3.1.7 CONCLUSION ................................................................................................................. 11
3.2 Characterisation of commercially available flow meters.................................................... 12 3.2.1 Introduction ...................................................................................................................... 12 3.2.2 Reproducibility ................................................................................................................. 12 3.2.3 Impact of temperature, back pressure and viscosity on the metering accuracy ................ 13 3.2.4 Impact of dynamic flow on the metering accuracy ............................................................ 14 3.2.5 Economic calibration procedure ....................................................................................... 16 3.2.6 CONCLUSION ................................................................................................................. 17
3.3 Metrological assessment and characterisation of drug delivery systems .......................... 17 3.3.1 Introduction ...................................................................................................................... 18 3.3.2 Response time for single pump infusion ........................................................................... 18 3.3.3 Dosing accuracy single pump infusion ............................................................................. 21 3.3.4 Dosing accuracy multiple pump infusion .......................................................................... 23 3.3.5 Other infusion devices as well as testing equipment ........................................................ 25 3.3.6 CONCLUSION ................................................................................................................. 25 4 Actual and potential impact ................................................................................................. 27
4.1 Dissemination activities .................................................................................................... 27 4.2 Early impact ..................................................................................................................... 27
5 Website address and contact details ................................................................................... 28 6 List of publications ............................................................................................................... 28 References ................................................................................................................................... 30
HLT07 MeDD
Final Publishable JRP Report
- 3 of 30 -
Issued: February 2017 Version V1.5
1 Executive Summary
Introduction
Dosing errors in drug delivery can result in adverse patient incidents, for example dangerous under and overshoot of blood pressure in pre-term newborns. The project focused on developing and using metrological tools to characterise complete drug delivery systems for drug administration by means of infusion technology. At the start of the project these metrological tools were underdeveloped in Europe. Furthermore, the lack of metrology infrastructure was not sufficiently recognised, leading to unawareness of dosing errors, potentially leading to adverse incidents in patient treatment. The metrological tools developed in this project, together with a greater awareness on the causes and impact of dosing errors are now available for the health care community, ultimately leading to a reduced number of dosing errors.
The Problem Drug delivery is the process of administering a pharmaceutical compound to achieve a therapeutic effect. Drug delivery by infusion therapy deals with all aspects of fluid and medication infusion, usually via the intravenous route (infusion directly into a vein). For certain medication schedules (e.g. drugs that are only therapeutically active over short timescales or within a narrow range of delivered concentrations or drugs that require a very small blood concentration) the actual flow rate of the infusion equipment is important to ensure the delivery of known quantities of a drug for safe and efficient patient treatment.
Drug delivery by infusion is being given much attention by the health care community because recent studies have identified underestimated risks. Adverse incidents in patients’ treatment are believed to be caused by i) poor understanding of the performance characteristics of the complete drug delivery system, ii) under developed metrological infrastructure and iii) lack of awareness of the impact of the potential dosing error.
The characteristics of a drug delivery system (i.e. start-up behaviour, flow rate error and stability, and potential dependency on physical and environmental parameters) follow from the pump type and disposables used. The metrological infrastructure involves procedures and equipment such as flow meters and high-end syringe pumps and the establishment of primary and secondary standards that allow the performance of clinical measurement components and systems to calibrated ensuring they are accurate when used in practice.
In addition, for low flow rates, lower than 100 ml/h, the existing metrological infrastructure had not been validated and characterised, and for ultra-low flow rates, lower than 0.5 ml/h, the infrastructure did not exist before this project. This meant that drug delivery involving low and ultra-low flow rates could not be measured traceably, which posed a risk in achieving the required accuracy (for critical drug delivery typically 5% accuracy is requested on the dosing rate).
The lack of the required metrological infrastructure (i.e. primary and secondary standards) and the poor understanding of the characteristics of drug delivery systems poses risks in drug delivery and must be addressed.
The Solution The project focused on developing and using metrological tools to characterise complete drug delivery systems for drug administration by means of infusion technology. The project has delivered the required metrological infrastructure for low liquid flow calibrations. Several calibration facilities have been developed across Europe that have been validated by means of an intercomparison. In addition to the developed metrological tools, the project has characterised a few infusion devices. The results show that accessories (e.g. filters, infusion lines) and operating conditions (e.g. temperature, back pressure) can have a significant impact on the response time of the complete drug delivery set up.
Impact The metrological infrastructure is now fully in place and the new calibration services are already being used by several customers. This infrastructure can facilitate development in microfluidic related applications because developers have an independent and reliable check for the quality of their products. Furthermore, the infrastructure enables hospitals to perform high quality and reliable checks on infusion pumps. This gives
HLT07 MeDD
Final Publishable JRP Report
- 4 of 30 -
Issued: February 2017 Version V1.5
hospitals the possibility to check whether a certain combination of infusion pump and disposable yields an acceptable dosing accuracy. The experience and knowledge generated with the assessment of various drug delivery systems have been collated in a best practice guide and preliminary E-learning module. Both are available from the project website and describe which effects can cause dosing errors and how they can be avoided. Different hospitals have shown an interest in adopting this know-how to further educate their staff. In addition, the European Society for Intensive Care Medicine (ESICM), have shown an interest in an E-learning module based on the best practices. This E-learning module would be freely available to all ESICM members to offer additional training on the risks of infusion technology.
2 Project context, rationale and objectives
Drug delivery is the process of administering a pharmaceutical compound to achieve a therapeutic effect. Drug delivery by infusion therapy deals with all aspects of fluid and medication infusion, usually via the intravenous route (infusion directly into a vein). In most cases, the amount of drug delivered and the drug itself are the most important parameters. However, for some drugs, the actual flow rate is important for a safe and sound patient treatment. This is, in particular, the case for fast acting and potent drugs that have a short half-life and a narrow therapeutic band width, or for drugs that require a very small blood concentration for reasons of toxicity. The half-life is the time in which the concentration of a drug in a human is decreased by 50% and a short half-life is considered to be in the order of 1 minute.
Infusion technology is being given much attention because recent studies have identified that there are underestimated risks involved [1 – 4]. There have been examples where adverse incidents, i.e. morbidity and/or mortality, are believed to be caused by inadequate administration of drugs. Therefore, the ultimate goal of this project has been to contribute to a more reliable drug delivery. The aforementioned events can be traced back to not fully understood characteristics of the complete drug delivery system (including disposable), an under developed metrological infrastructure and to a lesser extent a lack of awareness. These specific issues are discussed below.
The characteristics of a drug delivery system refer to the start-up behaviour, flow rate error and stability, and potential dependency on physical parameters such as the environmental temperature, back pressure and fluid temperature and viscosity. The startup delay of single syringe pumps without any disposables is fairly well known; however the impact of adding disposables (infusion lines, filters, check valves, etc.) is not well known and can be quite significant. Furthermore, the potential impact of temperature, back pressure and viscosity is not well known. Flow rate (and concentration) accuracy can further deteriorate if multi-pump infusion is involved. Multi-pump infusion involves more than one pump delivering a certain drug through the same line and injection point.
The metrological infrastructure consists of the equipment, procedures and qualified personal to carry out the necessary calibrations and performance tests. For low flow rates, e.g. lower than 100 ml/h, the existing metrological infrastructure has never been validated, whereas for ultra-low flow rates, e.g. lower than 0.5 ml/h, the infrastructure does not even exist. Yet, low flow rates are required for certain medication schedules. For example, current medication schedules can require flow rates down to 0.5 ml/h or even 0.1 ml/h. Furthermore, highly effective drugs for pain treatment must be administered as a continuous infusion via an intrathecal catheter at starting doses of 4 µl/h. As a result, drug delivery involving low and ultra-low flow rates cannot be traceably measured and equipment cannot be traceably calibrated, which poses risk in achieving the required accuracy (for critical drug delivery typically 5 % accuracy is requested on the dosing rate).
The lack of an appropriate metrological infrastructure and the incompletely understood characteristics of drug delivery devices pose risks in drug delivery. The goal of this JRP was therefore to develop the infrastructure that is required by the health care community and to conduct performance tests for several drug delivery devices. The specific project objectives are:
1. Development and characterisation of primary standards for liquid flow at atmospheric conditions for flow rates from 600 ml/h down to 60 nl/h with a target uncertainty better than 0.5 %.
HLT07 MeDD
Final Publishable JRP Report
- 5 of 30 -
Issued: February 2017 Version V1.5
2. Characterisation of commercially available flow meters. The focus was on pulsation; however the influence of various physical parameters and connectors were also investigated.
3. Metrological assessment and characterisation of drug delivery systems. This included the delivery systems as well as the tubing and needles to actually deliver the drugs.
3 Research results
In this section the research results are presented and discussed. The subsections closely follow the objectives listed above: Section 3.1 and 3.2 discuss the research conducted to develop the required metrological infrastructure (respectively the primary and secondary standards), whereas Section Error! Reference source not found. discusses the assessment of drug delivery systems. This section is a summary of the technical aspects of the best practice guide developed.
3.1 Development and characterisation of primary standards
In this section the development of the metrological infrastructure for health care is discussed. In Section 3.1.1 the motivation and description of the work is given. In Sections 3.1.2 to 3.1.4 the developed facilities are discussed. Next, in Section 3.1.5 it is discussed how these facilities have been validated. Finally, in Section 3.1.6 the developed calibration services are discussed.
The metrological infrastructure needed upgrading to enable traceable liquid flow rate calibrations for flows ranging from 100 ml/h down to 0.1 ~ 1 µl/h. Therefore various primary standards have been developed. Here, ‘primary’ means the facility enables a direct link to the SI units; for example ml/h. A common method for traceable flow calibrations is the gravimetric method. However, with this method it is very difficult to measure flow rates lower than roughly 5 µl/h. Therefore two other approaches were considered for flows down to 0.1 ~ 1 µl/h.
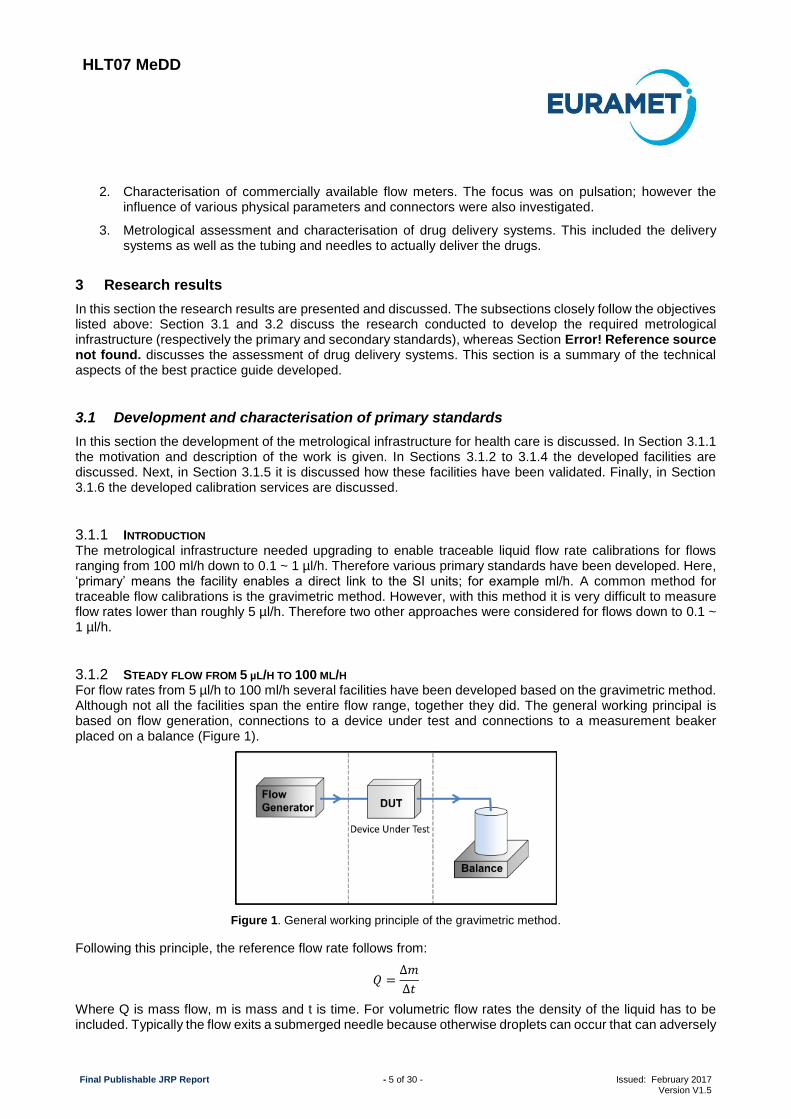
For flow rates from 5 µl/h to 100 ml/h several facilities have been developed based on the gravimetric method. Although not all the facilities span the entire flow range, together they did. The general working principal is based on flow generation, connections to a device under test and connections to a measurement beaker placed on a balance (Figure 1).
Figure 1. General working principle of the gravimetric method.
Following this principle, the reference flow rate follows from:
𝑄 =∆𝑚
∆𝑡
Where Q is mass flow, m is mass and t is time. For volumetric flow rates the density of the liquid has to be included. Typically the flow exits a submerged needle because otherwise droplets can occur that can adversely
3.1.1 INTRODUCTION
3.1.2 STEADY FLOW FROM 5 µL/H TO 100 ML/H
HLT07 MeDD
Final Publishable JRP Report
- 6 of 30 -
Issued: February 2017 Version V1.5
affect the calibration uncertainty. The following procedures, amongst others, are required to get meaningful uncertainties in the reference flow rate:
Reduce evaporation, for example by means of an oil-layer on top of the water surface or (nearly) saturated air near the measurement beaker. A more sophisticated approach is to use a very narrow and small water bridge between the dispensing needle and water absorbing foam. Additionally, place the measurement beaker inside a draft shielded environment.
Use demineralized or distilled and degassed water to avoid entrapped and dissolved air. Travelling air bubbles will greatly affect the measurement or can (partly) block the flow. Additionally, purge sufficiently to remove entrapped or dissolved air. A good measure of a fully degassed system is a quick response of a flow meter when the flow is started or halted.
For a common setup the most important sources of uncertainty are on the:
Correction for the combined forces due to buoyancy and surface tension on the immersed needle;
Correction for evaporation;
Correction for the buoyancy of the measurement beaker;
Repeatability of the measurements.
Within this project, facilities and gravimetric methods have been developed or upgraded at CETIAT, DTI, IPQ, METAS and VSL. Differences among these facilities include the following aspects:
Reduction, control and correction for evaporation.
Flow generation and control.
Consequently, all set ups are different which enabled a proper validation of the facilities. This is because (very) similar setups may lead to the same systematic errors leading to improper conclusions following an intercomparison. Probably the most important difference between these facilities is how evaporation is treated: IPQ, VSL and CETIAT minimise evaporation by having a fully saturated air surrounding the measurement beaker, whereas DTI uses an oil layer to avoid evaporation. METAS, on the other hand, uses a glass filter in combination with very porous material to minimise evaporation. Three project partners (VSL, METAS and IPQ) have claimed Calibration and Measurement Capability (CMC) entries at the BIPM or country-specific accreditation and other partners (DTI and CETIAT) validated their existing claim. Table 1 shows the flow and accompanying uncertainty ranges for the different developed facilities which correspond to the accreditation (the ranges for which the validation has been performed are somewhat larger, namely 6 µl/h to 200 ml/h, see also Section 3.1.5).
Table 1. Summary of the flow ranges and accompanying uncertainties for the facilities developed. Note: The results correspond to those ranges for which the partners have claimed or validated their CMC entry.
Organisation Mass flow rate range Volumetric flow rate range Uncertainty (k=2)
For flow rates lower than approximately 6 µl/h (6000 nl/h), the gravimetric method is less appropriate because either the calibration uncertainty or the required measurement time becomes too large for practical application.
3.1.3 STEADY FLOW FROM 60 NL/H TO 600 NL/H
HLT07 MeDD
Final Publishable JRP Report
- 7 of 30 -
Issued: February 2017 Version V1.5
Therefore two other principles have been investigated in this project: front tracking of a meniscus in a capillary with known dimensions and flow generation by means of volumetric expansion. In this section these principles are briefly discussed.
Front tracking of a meniscus in a capillary of known dimensions
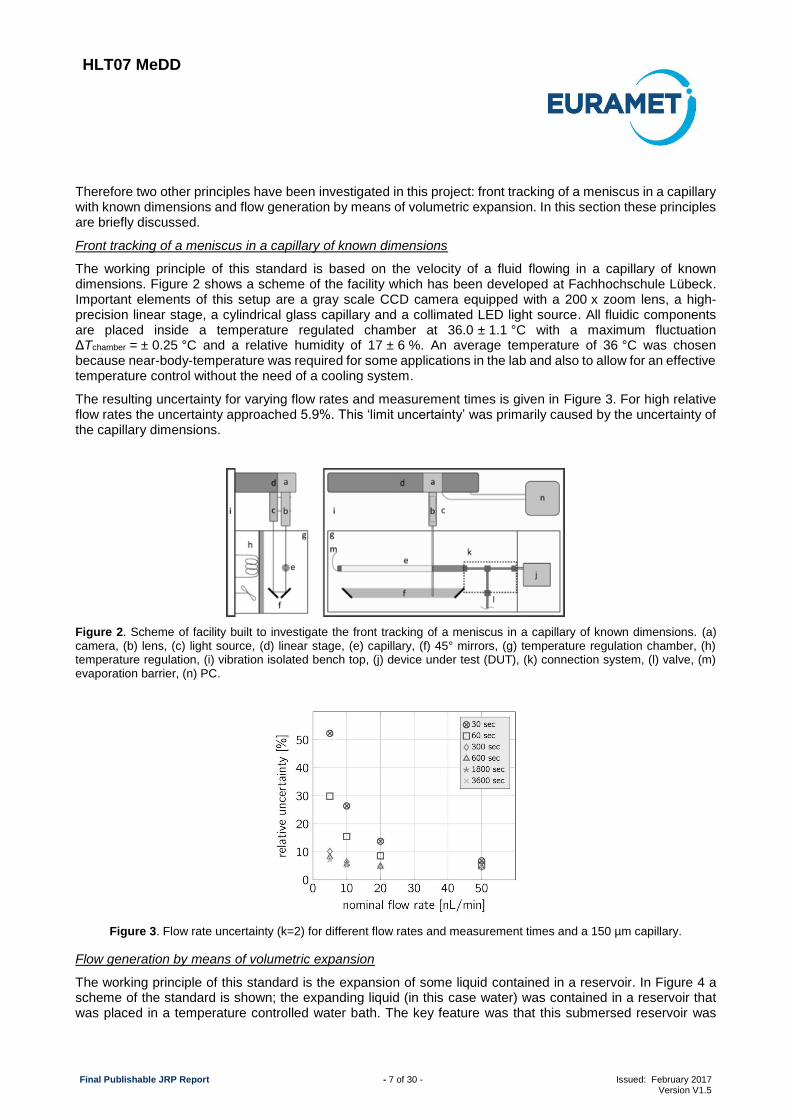
The working principle of this standard is based on the velocity of a fluid flowing in a capillary of known dimensions. Figure 2 shows a scheme of the facility which has been developed at Fachhochschule Lübeck. Important elements of this setup are a gray scale CCD camera equipped with a 200 x zoom lens, a high-precision linear stage, a cylindrical glass capillary and a collimated LED light source. All fluidic components are placed inside a temperature regulated chamber at 36.0 ± 1.1 °C with a maximum fluctuation ΔTchamber = ± 0.25 °C and a relative humidity of 17 ± 6 %. An average temperature of 36 °C was chosen because near-body-temperature was required for some applications in the lab and also to allow for an effective temperature control without the need of a cooling system.
The resulting uncertainty for varying flow rates and measurement times is given in Figure 3. For high relative flow rates the uncertainty approached 5.9%. This ‘limit uncertainty’ was primarily caused by the uncertainty of the capillary dimensions.
Figure 2. Scheme of facility built to investigate the front tracking of a meniscus in a capillary of known dimensions. (a) camera, (b) lens, (c) light source, (d) linear stage, (e) capillary, (f) 45° mirrors, (g) temperature regulation chamber, (h) temperature regulation, (i) vibration isolated bench top, (j) device under test (DUT), (k) connection system, (l) valve, (m) evaporation barrier, (n) PC.
Figure 3. Flow rate uncertainty (k=2) for different flow rates and measurement times and a 150 µm capillary.
Flow generation by means of volumetric expansion
The working principle of this standard is the expansion of some liquid contained in a reservoir. In Figure 4 a scheme of the standard is shown; the expanding liquid (in this case water) was contained in a reservoir that was placed in a temperature controlled water bath. The key feature was that this submersed reservoir was
HLT07 MeDD
Final Publishable JRP Report
- 8 of 30 -
Issued: February 2017 Version V1.5
subjected to an increasing temperature over a given time, e.g. 10 minutes. Hence, during this time, the temperature increased with a constant temperature increase rate, e.g. 1.0 °C/min.
The results discussed in this report were obtained with a reservoir with a nominal volume of 1000 mm3. For temperature increase rates that were feasible with the current temperature controlled water bath (roughly 60 degrees Celsius), this resulted in flow rates in the range of 3.6 µl/h to 18 µl/h. Larger flow rates are possible using a larger reservoir volume, or at the expense of an increased uncertainty. In case a different flow rate range was required, the setup could be equipped with a different reservoir, e.g. volumes of 500 mm3 and 5000 mm3, which would scale the flow rate range accordingly.
Figure 4. Scheme of the standard for nanoflow rates (left) and technical drawing set up (right). When the surrounding water (orange) of the reservoir (blue) is heated, the temperature in the reservoir will slowly increase, which will result in expansion of the liquid inside the reservoir and thus generate a flow rate. In the picture on the right the submerged reservoir is in the ‘bay’ of the temperature controlled water bath (white area below the (pink) insulation material).
In Error! Reference source not found.Error! Reference source not found. it is shown that the volumetric flow rate follows from:
𝑸(𝒕) = −𝑽𝑯𝟎
(𝑻𝑴𝑼𝑻)⌊(𝟏 + 𝜷(𝑻𝑹(𝒕) − 𝑻𝟎)) { 𝑨(𝑻𝑴) (𝒌𝟏(𝒕) +
𝒅𝒄(𝒕)
𝒅𝒕) + 𝑩(𝑻𝑴)𝒌𝟏(𝒕)𝒄(𝒕)} + 𝝆(𝑻𝑹)𝜷𝒌𝟐(𝒕)⌋
where
𝐴(𝑇𝑀) and 𝐵(𝑇𝑀) are respectively the first and second order partial derivatives of the density with respect to temperature measured in the reservoir. Hence, 𝐴(𝑇𝑀) can be regarded as the thermal expansion coefficient.
𝑘1(𝑡) and 𝑘2(𝑡) are the temperature increase rates measured in the reservoir (thus of the expanding liquid) and of the reservoir (thus of the reservoir itself). After startup we have 𝑘1 ≈ 𝑘2≈ constant.
𝑐(𝑡) is defined as the difference between the actual average temperature of the expanding liquid and the temperature measured, thereby covers for the spatial temperature gradient (the measurement position is discussed later).
𝑇𝑀 and 𝑇𝑅 are respectively the temperature measured in the reservoir (thus of the expanding liquid)
and of the reservoir (thus of the reservoir itself). 𝑇0 is defined as the reference temperature.
𝑉𝐻0 is the volume of the water contained in the reservoir and capillaries that are inside the temperature
controlled bath, at the defined reference temperature.
𝛽 is the volumetric thermal expansion coefficient of the reservoir (capillaries neglected) and 𝜌 is the density.
Because of the nature of the setup the flow rate increases over time for a constant temperature increase rate (the fluid properties of water depend on temperature). Following numerical simulations performed by CMI, for a constant temperature, the resulting uncertainty is between 2.5% and 3% for flow rates between 1.8 µl/h and 90 µl/h. For a flow rate change of 10% and 25% per minute the flow limits are given in
HLT07 MeDD
Final Publishable JRP Report
- 9 of 30 -
Issued: February 2017 Version V1.5
Table 2. The maximum flow rate is limited by the maximum temperature increase during calibration. The minimum flow rate is limited by the accuracy of the required correctionsError! Reference source not found..
Table 2. Practical flow rate range for varying reservoir dimensions (uncertainty lower than 3%). The maximum flow rate is limited by the maximum temperature increase during calibration. The minimum flow rate is limited by the accuracy of the correction for the inhomogeneous temperature (spatial gradient) and the impact of the volume between the reservoir and meter under test.
Reservoir volume (mm3)
Minimum flow rate (µl/h)
Maximum flow rate for a 10% change in flow rate per
minute (µl/h)
Maximum flow rate for a 25% change in flow rate per minute
(µl/h)
500 1.8 9 180
1000 3.6 180 36
5000 180 90 1800
The primary standards, or calibration facilities, briefly discussed in the previous sections, all can handle liquid flow rates at ambient conditions (room temperate and pressure). In order to investigate the impact of operating and elevated conditions for e.g. temperature and viscosity, several of these standards can also handle varying operating conditions, see Table 3. In principle, all of the developed primary standards can handle dynamic conditions and varying viscosities, however only METAS and IPQ have used varying viscosities for the research into flow metering and drug delivering accuracy. Further, only DTI and METAS have verified their method for pulsating flow by means of a cross check and numerical modelling performed by CMI. The cross check was based on determining the flow rate error and pulsation (amplitude and frequency) for a syringe pump known to yield pulsating flow. Within the uncertainty the results of METAS and DTI were found to be consistent. The numerical simulations focused on estimating the error of the mass indication caused by pulsating flow.
Table 3. Range of operating and environmental conditions primary standards.
Dynamic
conditions
Water
temperature (°C)
Environmental temperature (°C)
Pressure range upstream DUT (bar)
Dynamic viscosity range (mPa·s)
CETIAT no 10 – 50 10 – 50 0 – 10 1
DTI yes Ambient Ambient 0 – 5 1
IPQ no Ambient Ambient 0 – 2 1 – 4
METAS yes Ambient Ambient 0 – 2.5 1 – 4
VSL no Ambient Ambient 0 – 5 1
In order to validate a primary standard, or calibration facility, it is common practice to perform an intercomparison between various standards Common practice is that all labs calibrate a certain transfer standard after which the results are compared with each other. In case the calibration results between the various labs are ‘not significantly different’ compared with the calibration uncertainty, the standards are consistent and thus validated. Here, ‘not significantly different’ is determined with the so-called En value, defined as:
3.1.4 VARYING AND DYNAMIC OPERATING CONDITIONS
3.1.5 VALIDATION
HLT07 MeDD
Final Publishable JRP Report
- 10 of 30 -
Issued: February 2017 Version V1.5
𝐸𝑛𝑙𝑎𝑏−𝑖=
𝜀𝑙𝑎𝑏−𝑖 − 𝜀𝑅𝑉
√𝑈2(𝜀𝑙𝑎𝑏−𝑖) − 𝑈2(𝜀𝑅𝑉)
where 𝜀𝑙𝑎𝑏−𝑖 is the measured error of lab-i for a certain flow point, 𝜀𝑅𝑉 is the comparison reference value (RV)
for the error and 𝑈(𝜀𝑙𝑎𝑏−𝑖) and 𝑈(𝜀𝑅𝑉) are the expanded uncertainties (k=2) of those values. The value of 𝐸𝑛 has the following meaning:
The results of a laboratory for a certain flow point are consistent (passed) if 𝐸𝑛 ≤ 1.
The results of a laboratory for a certain flow point are inconsistent (failed) if 𝐸𝑛 > 1.2.
For results between 1 < 𝐸𝑛 ≤ 1.2 a “warning level” is defined. For this particular situation the particular lab is recommended to check the procedures and methodology.
The comparison reference value is the uncertainty weighted average of the error and is determined as follows:
𝜀𝑅𝑉 =∑ 𝜀𝑙𝑎𝑏−𝑖
𝑈2(𝜀𝑙𝑎𝑏−𝑖)⁄𝑛
𝑖=1
∑ 1𝑈2(𝜀𝑙𝑎𝑏−𝑖)
⁄𝑛𝑖=1
where n is the number of participating labs. The uncertainty of the RV follows from:
𝑢(𝜀𝑅𝑉) =1
√∑ 1𝑈2(𝜀𝑙𝑎𝑏−𝑖)
⁄𝑛𝑖=1
For the validation of the primary standards of Section 3.1.2 and 3.1.3, 4 transfer standards have been used, see Table 4. Different standards have been used because one transfer standard could not cover the whole flow rate range. Furthermore, various types of standards have been used to validate the standards for different types and to have the possibility for trouble shooting in case inconsistency was found. In Table 5 the results following multiple intercomparisons are shown, which include a collaborator and a third party (Bronkhorst High-Tech and VTT). Flow meter 3 and the syringe pump are used in the same intercomparison, while for the other artifacts different intercomparisons were organised. In Table 5 it is also shown the participants in each intercomparison. From this table it follows that all developed facilities have been validated for the intercomparison in which they participated, except for the highest flow rate of one lab (CETIAT, Flow meter 3). Upon this validation the European metrological infrastructure for liquid micro flow calibrations has significantly progressed beyond the state of art.
Table 4. Transfer standards used for validation of the primary standards. The flow range between parentheses is the equivalent in volumetric or mass flow rate.
Transfer standard Type Volumetric flow range Mass flow range
Flow meter 1 Chip-based Coriolis flow meter (6 µl/h – 200 µl/h) 6 mg/h – 200 mg/h
Flow meter 2 Thermal volume flow meter 3.6 µl/h – 30 µl/h (3.6 mg/h – 30 mg/h)
Flow meter 3 Coriolis flow meter (480 µl/h – 200 ml/h) 0.5 g/h – 200 g/h
Table 5. Validation following the multiple intercomparisons based on the transfer standards and flow rates given in Table 4. N/A implies the lab did not participate in the particular intercomparison using this artifact.
Organisation Flow meter 1 Flow meter 2 Flow meter 3 Syringe pump
Following the development and validation of the primary standards, several labs have applied for national or international accreditation. VSL and a collaborator, Bronkhorst, have already been granted accreditation for ISO 17025 from the Dutch accreditation body (RvA), whereas the registration of the Calibration and Measurement Capabilities (CMC) at the BIPM is pending for METAS and IPQ. At the start of the project DTI and CETIAT were already accredited (national or internationally), yet the intercomparison reinforced their CMCs. Following the work carried out in this project and the partners accreditation, customer services are now available at CETIAT, DTI, IPQ, METAS, VSL either under the MRA (Mutual Recognition Agreement) or ISO 17025.
3.1.7 CONCLUSION In order to realise the required metrological infrastructure several primary standards for liquid flow have been developed. These standards are based on the gravimetric principle, front-tracking of a meniscus in a capillary or volume expansion. The gravimetric standards use different principles to minimise, or correct for, evaporation.
Multiple intercomparisons were organised to study the consistency of the primary standards. These intercomparisons were based on several flow meters and a syringe pump and revealed that all standards are consistent with each other within the claimed uncertainties and for a flow range of 3 mg/h to 600 g/h (equivalent to 3 µl/min to 600 ml/h) (except for one lab for the largest flow point). Following these intercomparisons, three project partners (VSL, METAS and IPQ) have claimed Calibration and Measurement Capabilitiy (CMC) entries at the BIPM or country-specific accreditation. The uncertainties obtained range from 0.6% for the lowest flow rate (6 mg/h, equivalent to 6 µl/h) to 0.05% for the highest flow rate (6000 g/h, equivalent to 6 l/h). (Note 1, depending on the institute the calibration uncertainty varies, see also Table 1. Note 2, calibrations down to 60 nl/h are possible at METAS, however these are not included in the CMC scope.
The metrological infrastructure developed is aimed at facilitating research and development and it is available to research institutes, flow meter manufacturers and the health care community. Other users can include those working on HPLC (high performance liquid chromatography), lab-on-chip, plant development via down-scaling, and process technology.
3.1.6 CALIBRATION SERVICES
HLT07 MeDD
Final Publishable JRP Report
- 12 of 30 -
Issued: February 2017 Version V1.5
3.2 Characterisation of commercially available flow meters
In this section the flow metering accuracy is discussed. For several types of commercial flow meter it was investigated how the metering accuracy was influenced by varying operating and environmental conditions. Section 3.2.1 describes the motivation and description of the work.
The growing market of microfluidic applications requires a deeper understanding of micro fluidic flow meters, in particular flow meter performance as function of varying operating conditions and reproducibility. In this project we have investigated the robustness (e.g. reproducibility and accuracy) of different flow meters. Table 6 lists the flow meters that have been used for the investigations. In the following sections the reproducibility, the impact of the temperature, back pressure, viscosity and dynamic effects on the flow metering accuracy is discussed.
Table 6. Different types of flow meters that have been used for the investigations.
Name Manufacturer Type Flow range Accuracy
specifications Other
Mini Cori-flow M12
Bronkhorst High-Tech
Coriolis 200 g/h – 2.0
g/h (200 ml/h – 2 ml/h)
± (0.2 + ZS / (flow rate in g/h)
*100) %, ZS zero stability 0.1 g/h
SLI-0430 Sensirion AG Thermal 3.0 ml/h – 0.12
ml/h ± 5 %
L-0.5CCM-D Alicat Scientific
Inc. pressure drop
30 ml/h – 0.6 ml/h
± 2 %
Possible temperature
range 10 °C – 30 °C
SLG 1430-025 Sensirion AG Thermal 3 µl/h – 90
µl/min 5%
M10.7n Bronkhorst High-Tech
(chip-based) Coriolis 20 mg/h - 2 g/h
± (0.2 + ZS / (flow rate in g/h)
*100) %, ZS zero stability 2 mg/h
Mini Cori-flow M12p
Bronkhorst High-Tech
Coriolis 200 g/h – 2.0
g/h (200 ml/h – 2 ml/h)
± (0.2 + ZS / (flow rate in g/h)
*100) %, ZS zero stability 0.02 g/h
When carrying out the intercomparison to validate the developed primary standards (section 3.1), information has been obtained on the reproducibility, or drift and stability, of the used transfer standard because one lab determined the calibration curve at the beginning and end of the intercomparison (to quantify the stability of the transfer standard). This was required to make sure that potential discrepancies were not caused by the transfer standard itself.
Table 7 shows the results obtained for the reproducibility of different flow meters following the intercomparison for micro and nano flow rates. The results from the micro flow intercomparison revealed that the reproducibility of the used Coriolis type flow meters is within the specifications given for a flow rate of 0.5 to 60 g/h. For a flow rate of 200 g/h the reproducibility was found to be slightly higher (0.07%, corresponding to 0.08 g/h), however this could also be caused by the calibration uncertainty. For the nano flow intercomparison the reproducibility for the thermal flow meter has been measured for 13.2 µl/h. The value determined (0.4%) is well within the specifications (5%). The reproducibility of the chip-based Coriolis flow meter could not be determined because
3.2.1 INTRODUCTION
3.2.2 REPRODUCIBILITY
HLT07 MeDD
Final Publishable JRP Report
- 13 of 30 -
Issued: February 2017 Version V1.5
of time constraints. However, because the facilities were found to be consistent, it is reasoned that the reproducibility should at least be better than the indicated zero stability (ZS).
Table 7. Measured reproducibility various flow meters.
Name Type Manufacturer Flow rates Accuracy specifications
Measured reproducibility
SLG 1430-025
Thermal Sensirion 3 µl/h – 90 µl/h
5% 0.4% at roughly 13 µl/h
M10.7n (chip-based) Coriolis
Bronkhorst High-Tech
20 mg/h - 2 g/h
± (0.2 + ZS / (flow rate in g/h) *100) %, ZS zero stability 2 mg/h
estimated to be better than 2 mg/h for 6 mg/h to 200 mg/h
Mini Cori-flow M12p
Coriolis Bronkhorst High-Tech
200 g/h – 2.0 g/h (200 ml/h
– 2 ml/h)
± (0.2 + ZS / (flow rate in g/h) *100) %, ZS
zero stability 0.02 g/h
better than 0.02 g/h for 0.5 g/h to 60 g/h
Figure 5 to Figure 7 show the impact of temperature on the flow meter error (deviation) for the Coriolis flow, thermal and pressure drop flow meters, respectively. For these experiments, the environmental and water temperature were made equal, hence the water and surrounding temperature were controlled. In brief, these figures show that the impact of the temperature is not significant.
The general trend for the deviation as function of the flow rate is not typical for all of these types for flow meters. The Coriolis flow meter (Figure 5) has a rather flat calibration curve, whereas the larger variance at low flow rates is due to the zero stability of the meter. The calibration curves for the thermal flow meter (Figure 6) are atypical as the deviation decreases for an increasing flow rate. The measurement results performed at 20 °C were not consistent among laboratories. Therefore only the relative change in the deviation as a function of temperature should be taken into account. Usually the calibration curve for this type of flow meter is flat and some non-linearity at the lower end of the flow rate range leads to larger deviations. As expected, the calibration curves of the pressure drop meter (Figure 7) were flat with larger deviations at the lower flow rate limit. The range of viscosities investigated was 1, 2 and 4 mPa·s, whereas an elevated back pressure of 170 mbar has been used.
Figure 5. Measured deviations of the Coriolis flow meter Mini Cori-flow M12 in the flow rate range from 1.3 g/h up to 200 g/h (1.3 ml/h up to 200 ml/h) at temperatures of 10 °C, 20 °C and 30 °C. The Coriolis flow meter has a rather flat calibration curve, whereas the larger variance at low flow rates is due to the zero stability of the meter.
3.2.3 IMPACT OF TEMPERATURE, BACK PRESSURE AND VISCOSITY ON THE METERING ACCURACY
HLT07 MeDD
Final Publishable JRP Report
- 14 of 30 -
Issued: February 2017 Version V1.5
Figure 6. Measured deviations of the thermal flow meter SLI-0430 in the flow rate range from 0.4 ml/h up to 3 ml/h at temperatures of 10 °C, 20 °C and 30 °C.
Figure 7. Measured deviations of the pressure drop flow meter L-0.5CCM-D in the flow rate range from 1.2 ml/h up to 30 ml/h at temperatures of 10 °C, 20 °C and 30 °C. The calibration curves of the pressure drop meter are rather flat with larger deviations at the lower flow rate limit.
The results for the impact of viscosity and back pressure on the metering accuracy revealed very similar results (data not shown in this report) and one can conclude that varying the perturbation parameters lead to an insignificant impact on the metering accuracy (from the calibration uncertainty and metering accuracy specifications point of view).
In this project the impact of dynamic flow (i.e. flow pulsations) on metering accuracy was also investigated. Figure 8 to Figure 10 show the impact of different types of flow pulsations on the flow meter error (deviation) for the Coriolis flow, thermal and pressure drop flow meters, respectively.
The flow meters have been tested using 2 different types of pulsating flow: one following from a standard syringe pump (Aladdin) and other following from a double syringe pump (Tecan). The standard syringe pump (Aladdin) has a rotating spindle that presses the plunger in the plastic syringe forward in order to generate a flow. The spindle rotation causes the flow rate to pulsate with a periodicity equal to the revolutions of the spindle.
The double syringe pump (tecan) consists of two small glass syringes. The syringes work in an opposite
3.2.4 IMPACT OF DYNAMIC FLOW ON THE METERING ACCURACY
HLT07 MeDD
Final Publishable JRP Report
- 15 of 30 -
Issued: February 2017 Version V1.5
manner, which means that one of the syringes is pumping (being emptied) while the other syringe is being filled. This allows for a continued flow although the volume of each syringe is very small. In order to make a continued flow the two syringes switch from filling to pumping with an overlapping session. This switching session causes a pulsation in the flow as the switching is not very smooth.
From these results it is possible to conclude that the metering accuracy of the Coriolis and thermal principle are not affected by different types of pulsations, see Figure 58 to Figure 710. We have also shown that the flow meter accuracy is not affected by changing from steady to pulsating flow. The absolute deviation of the Coriolis flow meter in the lower flow rate range strongly depended on the zero procedure prior to the measurements and the zero stability. Reported deviations of the Coriolis and the thermal flow meter are within the accuracy specified by the manufacturers. This implies those flow meters are in general quick enough to tackle these types of pulsating flows. The metering accuracy of the pressure drop type meter is somewhat more affected, see Figure 10. Potentially the response time of this meter is not quick enough to capture the pulsations.
Figure 8. Measured deviations of the Coriolis flow meter Mini Cori-flow M12 in the flow rate range from 0.6 g/h up to 10 g/h for two different pulsating flows at ambient temperature.
Figure 9. Measured deviations of the thermal flow meter SLI-0430 in the flow rate range from 1.0 ml/h up to 2.0 ml/h for two different pulsating flows at ambient temperature.
HLT07 MeDD
Final Publishable JRP Report
- 16 of 30 -
Issued: February 2017 Version V1.5
Figure 10. Measured deviations of the pressure drop flow meter L-0.5CCM-D in the flow rate range from 1 ml/h up to 10.0
ml/h for two different pulsating flows at ambient temperature.
Flow meters can be quite sensitive to changes in the Reynolds number and velocity profile. However, as shown in section 3.2.3, for the flow meters and flow ranges studied, the temperature, viscosity and back pressure do not have a significant impact on the metering accuracy. Hence, the obtained results indicate that the Reynolds number is not relevant for these flows.
This can be shown by looking at the velocity profile of a Poiseuille flow, given by:
𝑢(𝑦) = 1
2𝜇(
𝑑𝑝
𝑑𝑥) (𝑦2 − 𝐷𝑦)
where y is the distance perpendicular to the wall, 𝑑𝑝
𝑑𝑥 is the horizontal pressure gradient (driving force) and µ is
the dynamic viscosity. A Poiseuille is defined as fully developed and laminar flow between two infinite parallel plates. Because of the very small dimensions of the capillaries and tubing used in the microfluidic applications and flow meters, a fully developed laminar flow is a very good assumption. Therefore, for the same flow rate, one will have the same velocity profile. In case the viscosity changes (either directly or for example through temperature), the pressure gradient will have to compensate. In the literature it had not yet been shown micro flow meters are indeed insensitive to the Reynolds number.
We further confirmed the virtual independency of the flow meters on the Reynolds number by numerical solutions and micro particle image velocimetry (µPIV) experiments. The flow in a rectangular pipe was modeled by means of computational fluid dynamics (CFD) and visualized by means of µPIV. The CFD results are shown in Figure 11 and show that the velocity profile is virtually insensitive to the Reynolds number. The µPIV results are shown in Figure 12 and show that the velocity profile qualitatively matches the analytical, fully developed laminar, flow. The observed discrepancies are thought to be caused by the resolution of the µPIV or flow unsteadiness caused by the flow generator.
3.2.5 ECONOMIC CALIBRATION PROCEDURE
HLT07 MeDD
Final Publishable JRP Report
- 17 of 30 -
Issued: February 2017 Version V1.5
Figure 11. Velocity profile in rectangular capillary following the CFD simulations. For flows in the range of 0.5 g/h to 10 g/h the velocity profiles are essentially identical. This shows that the flow is a fully developed laminar flow. Consequently, the
Reynolds number does not impact the velocity profile and thus meter performance.
Figure 12. Comparison fully developed profile with results from µPIV measurements (left 10 g/h, right 2 g/h). The results show a qualitative match, however some local discrepancies.
3.2.6 CONCLUSION The primary standards for liquid flow have been used to characterise several commercially available flow meters. The results revealed that the metering accuracy is not significantly affected, with respect to the claimed accuracy, by the operating conditions such as the temperature, back pressure and viscosity. Therefore, existing micro flowmeters can be readily used to assist the health care community in the realisation of the required level of accuracy (provided the pressure drop is not too high). Furthermore, existing micro flow meters can be readily used for varying process conditions and ranges of fluids (viscosities up to 4 times that of water did not show a significant impact on mass based flow meters), which can be beneficial in different application fields (semiconductor processing, fuel cell technology, food, chemical and pharmaceutical industries). Because of the very small dimensions of the capillaries and tubing used in the micro fluidic applications, a fully developed laminar flow is a very good assumption. Consequently, for the same flow rate, despite potentially different fluid properties, one will find a very similar velocity profile. This was confirmed by numerical simulations as well as µPIV measurements (micro Particle Image Velocimetry). As in general flow meters are sensitive to the flow profile, this is a clear advantage for microfluidic applications.
3.3 Metrological assessment and characterisation of drug delivery systems
In this section the assessment of drug delivery systems is presented and discussed. In Section 3.3.1 the motivation and description of the work is given while in the other subsections the accuracy for single and multi-pump, and other infusion systems is discussed.
HLT07 MeDD
Final Publishable JRP Report
- 18 of 30 -
Issued: February 2017 Version V1.5
Although there are in the literature many articles on the characterisation of drug delivery devices [5 – 9], some aspects require further study. These are, amongst others, the impact of accessories and operating conditions (e.g. temperature, viscosity, back pressure) on the start-up delay and flow rate error. Furthermore, the interaction between multiple pumps was still under investigated. The organisations participating in this project have brought together the required expertise, facilities and network to study the aforementioned aspects. See for example Table 3 for the lab capabilities with respect to varying operating conditions. UMC Utrecht and FH Lübeck complemented the consortium with expertise, facilities and network on multiple pumps, nano flow measurement and implantable infusion pumps.
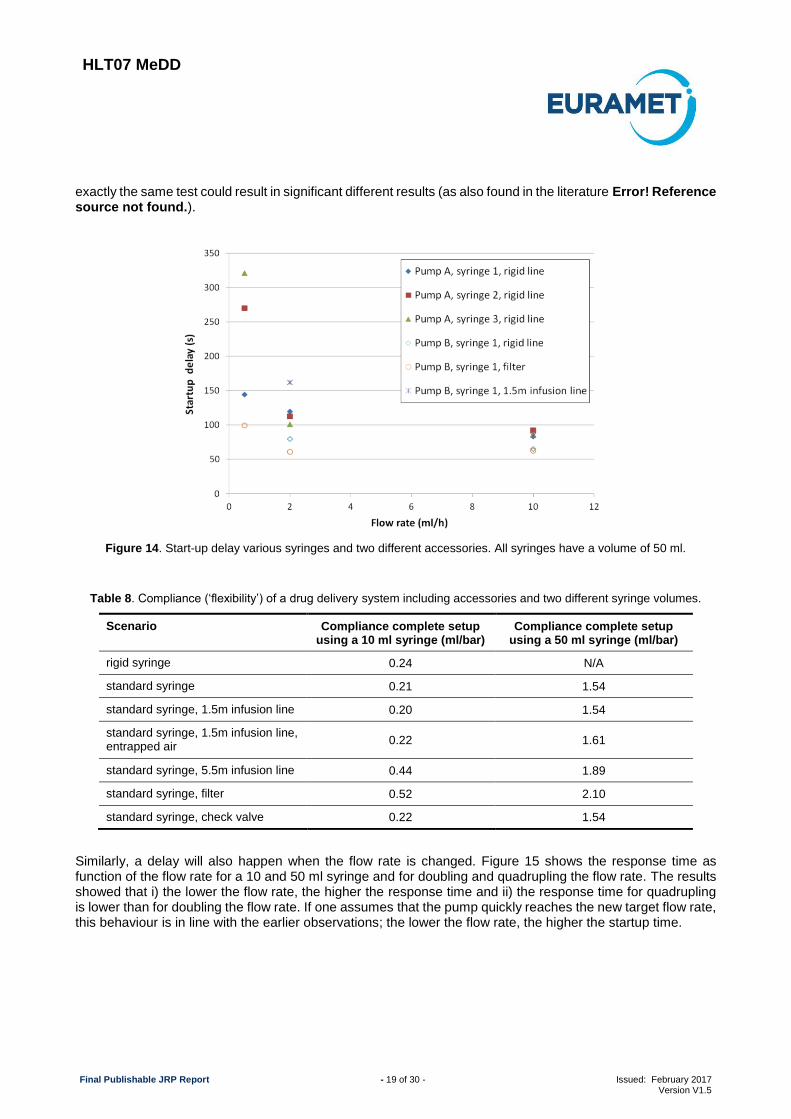
When a pump is started, or when the infusion rate is changed, it takes a while before the new set point is reached. Even when the infusion line is pre-filled, the start-up delay (also called delayed onset) can be considerably long, especially when a narrow catheter or cannula is used. In Figure 13 an example of a start-up delay is shown; only after 1 hour the flow reaches 95% of its target value. (Note, this very long start-up delay is due to a high flow resistance and high back pressure of infusion in an artery.)
Figure 13. Start-up delay; the red arrow indicates when the flow rate has reached 95% of its target.
For single pump infusion, the delay in response time is caused by the mechanical compliance, or flexibility, of the system (defined as the volume increase for a unit increase in pressure).Typically when an infusion pump is started, or when the flow rate is increased, the line pressure increases (the pump ‘pushes harder on the fluid’). Because of the flexibility of the system, this pressure increase will cause the syringe, infusion line and potential accessories to expand (the internal volume increases). Hence, initially the infusion fluid is not delivered to the patient, however fills the additional volume caused by the expansion of the syringe, infusion line and potential accessories.
Error! Reference source not found. shows start-up delays for various syringes, pumps and accessories. As it can be seen, start-up delays in general increased when decreasing the flow rate. Error! Reference source not found. shows the measured compliance for various accessories and pump B. By comparing Figure 14 and Table 8 it follows that the larger the compliance, the larger the start-up delay, which is consistent with the literature. From this table it follows that the syringe has the largest impact on the total compliance. Further, the measured compliance given in Error! Reference source not found. shows that from the accessories (infusion line, entrapped air, filter and check valve), a long infusion line and a filter have the biggest impact on the compliance. However, from Error! Reference source not found. it follows that the measured start-up delay does not always follow a clear trend, for example adding a filter or infusion line lowered the start-up time for ‘Syringe 1’. This was probably caused by the significant spread in measurement results, i.e. repetitions of
3.3.1 INTRODUCTION
3.3.2 RESPONSE TIME FOR SINGLE PUMP INFUSION
HLT07 MeDD
Final Publishable JRP Report
- 19 of 30 -
Issued: February 2017 Version V1.5
exactly the same test could result in significant different results (as also found in the literature Error! Reference source not found.).
Figure 14. Start-up delay various syringes and two different accessories. All syringes have a volume of 50 ml.
Table 8. Compliance (‘flexibility’) of a drug delivery system including accessories and two different syringe volumes.
Scenario Compliance complete setup using a 10 ml syringe (ml/bar)
Compliance complete setup using a 50 ml syringe (ml/bar)
rigid syringe 0.24 N/A
standard syringe 0.21 1.54
standard syringe, 1.5m infusion line 0.20 1.54
standard syringe, 1.5m infusion line, entrapped air
0.22 1.61
standard syringe, 5.5m infusion line 0.44 1.89
standard syringe, filter 0.52 2.10
standard syringe, check valve 0.22 1.54
Similarly, a delay will also happen when the flow rate is changed. Figure 15 shows the response time as function of the flow rate for a 10 and 50 ml syringe and for doubling and quadrupling the flow rate. The results showed that i) the lower the flow rate, the higher the response time and ii) the response time for quadrupling is lower than for doubling the flow rate. If one assumes that the pump quickly reaches the new target flow rate, this behaviour is in line with the earlier observations; the lower the flow rate, the higher the startup time.
HLT07 MeDD
Final Publishable JRP Report
- 20 of 30 -
Issued: February 2017 Version V1.5
Figure 15. Delay in response time in doubling or quadrupling the flow rate.
Varying the operating conditions can have a significant impact on the start-up delay and response time. To investigate that impact we tested different operating conditions:
Viscosity: up to 4 times the viscosity of water;
Back pressure: 24 mbar (roughly equivalent to the back pressure of a vein) and 170 mbar (roughly equivalent to 1-2 times the mean arterial pressure in an adult);
Temperature: 10 to 30 degrees Celsius (steady state, no temperature gradients).
From these measurements it can be observed that varying operating conditions has a higher impact on 50 ml than on 10 ml syringes, which is consistent with literature [5, 7 – 9]. In Figure 16 the impact of the back pressure and temperature are shown. We observed that both temperature and back pressure significantly affect the start-up delay. Although this was expected, not much had been published on the quantitative effects of the back pressure and temperature. The impact of viscosity on the start-up delay did not have a significant impact for the conditions tested and is not shown.
HLT07 MeDD
Final Publishable JRP Report
- 21 of 30 -
Issued: February 2017 Version V1.5
Figure 16. Impact of back pressure (left) and temperature (right) on the start-up delay for a syringe pump with a 50 ml syringe and no additional accessories.
In order to minimise the start-up delay (for low flow rates) one can use low compliance (rigid) infusion components (especially syringes) or lines with a smaller volume. Alternatively, one can use small volume (e.g. 10 ml) syringes. (Note: small volume syringes are not advised for ‘large’ flow rates as this would require often replacements.)
Flow rate errors may be significant not only during the startup phase, but also during normal operation if, for example, the syringe or the syringe pump are imperfect. In this study we have considered as normal operating conditions: steady state conditions (after start-up), a temperature of 20 degrees Celsius and near zero back pressure.
The relative flow rate is determined by:
𝜀 = 100%𝑞𝑝𝑢𝑚𝑝 𝑠𝑒𝑡 𝑝𝑜𝑖𝑛𝑡 − 𝑞𝑎𝑐𝑡𝑢𝑎𝑙
𝑞𝑎𝑐𝑡𝑢𝑎𝑙
where 𝑞𝑝𝑢𝑚𝑝 𝑠𝑒𝑡 𝑝𝑜𝑖𝑛𝑡 is the target flow rate set in the pump and 𝑞𝑎𝑐𝑡𝑢𝑎𝑙 follows from the balance measurements.
Therefore, a positive error means 𝑞𝑝𝑢𝑚𝑝 𝑠𝑒𝑡 𝑝𝑜𝑖𝑛𝑡 > 𝑞𝑎𝑐𝑡𝑢𝑎𝑙, or, the set point is larger than the actual flow rate.
Hence, the pump is delivering less than its set point. Similarly, for a negative error the pump is delivering too much.
Error! Reference source not found. and Error! Reference source not found. show the flow rate error during normal operation conditions for a syringe pump containing a 10 ml and a 50 ml syringe, respectively. The bars given in Error! Reference source not found. and Error! Reference source not found. are the ‘uncertainty of the calibration’ per flow point. This uncertainty follows from the uncertainty in reference flow rate and the spread in the measurement results. The uncertainty in the reference flow rate is the result of resolution, variations in operating and environmental conditions, noise and nonlinearity of the balance, amongst others. The true error is within the uncertainty bar with a confidence of 95%. The flow rates tested were 0.5 ml/h, 2 ml/h and 10 ml/h. In the figures the flow rates have been given an artificial offset to visualise the results. As an example, the last series of measurements were all for a flow rate of 10 ml/h.
In our experiments, the measured flow rate error was between -2 and +2 % for 2 ml/h and 10 ml/h. However, for a flow rate of 0.5 ml/h the measured errors and their spread were larger. Because of the measurement uncertainty it could not be stated whether or not the pump was functioning within the 2% error bandwidth (which is the typical criterion used by manufacturers). This was because the true error could be anywhere within the given range Error! Reference source not found. (uncertainty bar) (95% confidence level). Hence, the maximum possible error was given by the measured error plus the uncertainty (95% confidence level).
3.3.3 DOSING ACCURACY SINGLE PUMP INFUSION
HLT07 MeDD
Final Publishable JRP Report
- 22 of 30 -
Issued: February 2017 Version V1.5
The maximum possible error never exceeds 5% for a 10 ml syringe (95% confidence level) (Error! Reference source not found.) and the errors are typically within the 5% error bandwidth (95% confidence level) (Error! Reference source not found.), however in exceptional cases the maximum possible error can be as large as 7% (95% confidence level). In agreement with the literature, we observed that errors and their spread are larger for the 50 ml syringe, especially for the lower flow rates [5, 7 – 9]. The spread in the measurement results was an artifact of the disposable syringe system because this spread was much smaller when more rigid syringes are used.
In this project we have also investigated the flow rate stability which was found to be insignificant compared to the measurement spread, i.e. the flow rate instability was typically smaller than the variations between syringes and tests.
Figure 17. Flow rate error during normal operation and steady operating conditions (10 ml syringe).
HLT07 MeDD
Final Publishable JRP Report
- 23 of 30 -
Issued: February 2017 Version V1.5
Figure 18. Flow rate error during normal operation and steady operating conditions (50 ml syringe).
In brief it was concluded that, within the range of test conditions, the impact of varying operating conditions on the flow rate accuracy was in general limited. Specific observations were as follows:
The temperature and viscosity did not noticeably influence the flow rate error. There were variations in the measured flow rate; however these variations were not significant when the measurement uncertainty was taken into account.
For the 10 ml syringe tested, an increased back pressure did not affect the delivered flow rate accuracy. However, for the 50 ml syringe tested, a back pressure of 170 mbar, was enough to slightly affect the flow rate accuracy (up to 1.5%). Nevertheless, the syringe pump kept functioning within the 5% bandwidth (95% confidence level).
In addition to the same effects known to impact single pump infusion systems, two other effects will cause a delay or (temporal) offset in the target infusion (concentration) when multiple pumps are used to administrate some drug via the same injection point. These two effects are the ‘dead volume’ and ‘interaction between pumps’. In order to get a deeper understanding of these effects experimental and numerical work has been performed in collaboration with UMC Utrecht. For the experimental work, 2 to 4 pumps could be used together to determine the interaction between them. A weighing scale and flow meters in the individual lines have been used to study the individual and total flow rates. The numerical work is based on the Hagen-Poisseuille law. In the next two subsections this interaction and dead volume are further discussed and some results are presented, see [12] for more information.
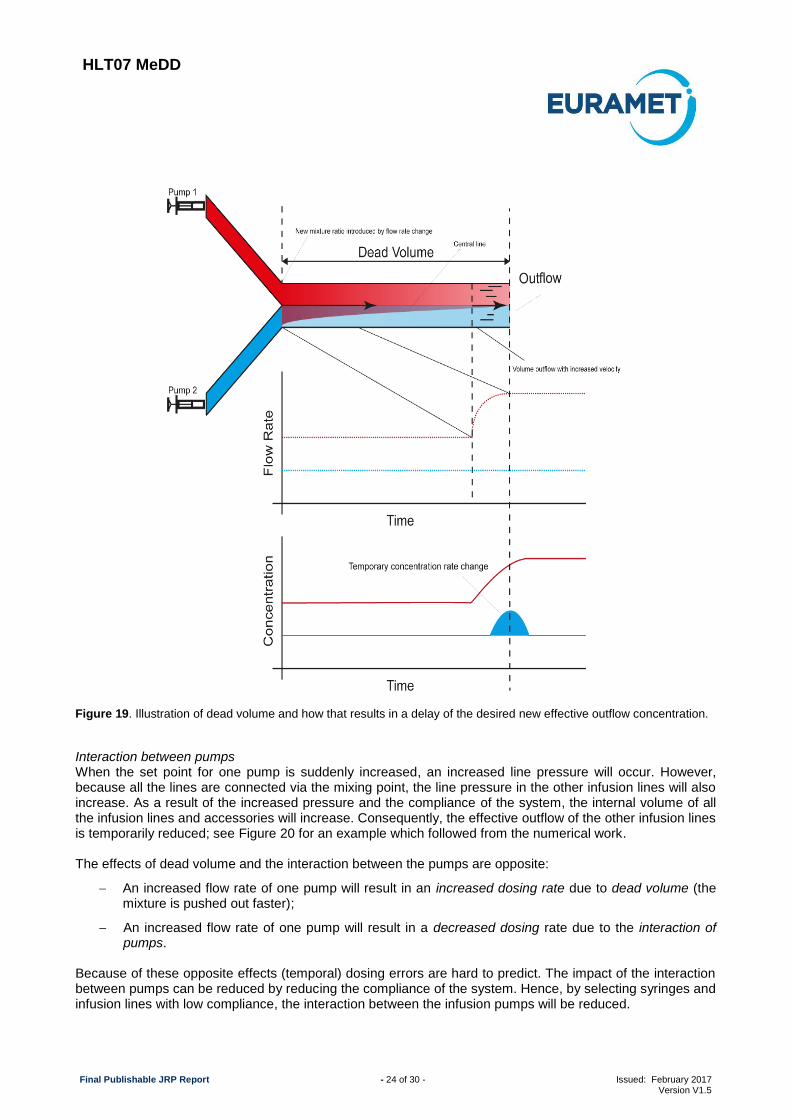
Dead volume The dead volume is the total volume between the mixing and the injection point. Every particular mixture of drugs has to travel through this volume before it reaches the patient. Consequently, in case the flow rate of one particular pump is changed, it will take some time before the new concentration (mixture) is felt by the patient because first the previous mixture needs to travel through the dead volume. These phenomena are illustrated in Figure 19.
The increase of the flow rate in one line leads to a temporary change of the flow rate in the other infusion line(s). This is because the old concentration is infused at a higher total flow rate. The time it takes for the new concentration rate to arrive at the patient can be estimated by:
∆𝑡 =𝑉𝑜𝑙𝑢𝑚𝑒
𝐹𝑙𝑜𝑤 𝑟𝑎𝑡𝑒=
𝜋𝑙𝑟2
∑ 𝑞𝑖𝑛𝑖=1
where 𝑙 is the distance between the mixture and injection point, 𝑟 is the internal radius of the infusion line, 𝑞𝑖
is the volumetric flow rate of pump 𝑖 and 𝑛 is the number of pumps. Disposables that minimise the dead volume reduce the response time and unintended boluses. Depending on the flow rate and type of drug, this phenomenon can be clinically very relevant. For example, unintended high dosing rates of Noradrenaline can potentially be lethal and can occur if a residual of this drug is pushed out a high flow rate (the intended dosing of Noradrenaline may have stopped earlier).
3.3.4 DOSING ACCURACY MULTIPLE PUMP INFUSION
HLT07 MeDD
Final Publishable JRP Report
- 24 of 30 -
Issued: February 2017 Version V1.5
Figure 19. Illustration of dead volume and how that results in a delay of the desired new effective outflow concentration.
Interaction between pumps When the set point for one pump is suddenly increased, an increased line pressure will occur. However, because all the lines are connected via the mixing point, the line pressure in the other infusion lines will also increase. As a result of the increased pressure and the compliance of the system, the internal volume of all the infusion lines and accessories will increase. Consequently, the effective outflow of the other infusion lines is temporarily reduced; see Figure 20 for an example which followed from the numerical work. The effects of dead volume and the interaction between the pumps are opposite:
An increased flow rate of one pump will result in an increased dosing rate due to dead volume (the mixture is pushed out faster);
An increased flow rate of one pump will result in a decreased dosing rate due to the interaction of pumps.
Because of these opposite effects (temporal) dosing errors are hard to predict. The impact of the interaction between pumps can be reduced by reducing the compliance of the system. Hence, by selecting syringes and infusion lines with low compliance, the interaction between the infusion pumps will be reduced.
HLT07 MeDD
Final Publishable JRP Report
- 25 of 30 -
Issued: February 2017 Version V1.5
Figure 20. Interaction between pumps resulting in temporal infusion errors. An increase of the infusion rate of pump 1
results in a temporarily decrease in the infusion rates of the other two pumps.
In addition to the infusion devices tested and discussed, other devices have also been tested: master calibrators, insulin pumps and an implanted infusion pump.
Master calibrators are typically used by hospitals to perform cross checks on the accuracy of infusion devices. However, they can also be used to verify whether adding a new disposable (syringe, accessory) can result in expected dosing errors (combining accessories, syringes and infusion devices of different poses a known risk for dosing errors). The calibration of the master calibrators showed that in general the master calibrators perform within specs (depending on type and make between 1% to 5% accuracy). However, for the lower flow rates the master calibrators could be off by several percent. This shows the importance of having the traceability properly established.
The calibration of the implantable infusion pump revealed an under dosing rate of approximately 6% at 18 µl/h (0.45 ml/day, averaged of 6 measurements of 3000 to 1200 seconds), whereas the infusion devices typically performed within specs. Nevertheless, also these examples show the importance of having traceable calibration services for health care because dosing errors of more than 5% can result in adverse patient incidents as shown and discussed earlier.
Finally, a few insulin pumps have been tested. The pumps obtained for the project were all dedicated to one specific flow rate: 0.1 µl/min and 0.3 µl/min. In a 3 days test the pumps showed a very good stability. The reproducibility could not be tested as the pumps are disposable and not sufficient pumps were available.
3.3.6 CONCLUSION The primary standards have been used to characterise several complete drug delivery systems (infusion pump plus one or more accessories, e.g. filters, check valves and varying infusion lines. The results revealed that the total system compliance (‘flexibility’) greatly depends on the syringe volume, infusion line length and filling procedure of the syringe. Furthermore, it was found that the infusion rate was not significantly affected by the viscosity and back pressure (for a pump without accessories).
Typically, the infusion devices operate within specifications, however for large syringes (50 ml) and very low flow rates (lower than e.g. 2 ml/h) there was more variance in the results and the measured error was not always within the claimed specifications of the components. Finally, the start-up delay scaled with the compliance and was in the order of half a minute to a few minutes. The knowledge and experience have been
3.3.5 OTHER INFUSION DEVICES AS WELL AS TESTING EQUIPMENT
HLT07 MeDD
Final Publishable JRP Report
- 26 of 30 -
Issued: February 2017 Version V1.5
collated in a best practice guide which can help the users of infusion technology to get a better understanding on the causes of dosing errors and ways to minimise or even avoid those errors.
HLT07 MeDD
Final Publishable JRP Report
- 27 of 30 -
Issued: February 2017 Version V1.5
4 Actual and potential impact
4.1 Dissemination activities
The project outputs have been shared widely with the metrology, instrumentation and clinical communities. The project has resulted in 10 peer-reviewed publications, 43 presentations or conference proceedings. E-learning material for creating awareness on physical aspects of multi-pump infusion has been developed. 6 technical reports and one good practice guide have been written. These documents can be downloaded from the project website www.drugmetrology.com or the EURAMET repository. A special issue of the Journal of Biomedical Engineering was published and contains many results from this project.
The good practice guide describes what can cause dosing errors, when to expect them and how they can be avoided or circumvented. This guide is tailored at clinical users and it is hoped it will facilitate a reduction of dosing errors. Various hospitals (mainly Dutch and Portuguese) have shown an interest in using it to educate their staff. In addition, other organisations such as the European Society for Intensive Care Medicine, have shown an interest in an e-learning module based on this best practice guide. This e-learning module is
available to all ESICM members to offer additional training on the risks of infusion technology.
A project workshop in 2013 at METAS in Switzerland attracted the most important manufacturers of micro flow meters. Two 1-day conferences have been organised by the project in 2014 (Lübeck, Germany) and 2015 (UMC Utrecht, Netherlands). For both conferences roughly 80 delegates participated who represented the medical sector, academia, industry and the metrology sector.
The knowledge gained in the project has been integrated in existing metrology training courses provided by METAS, UMC and VSL to professionals in flow metrology. In addition technical consultancy has been given to third parties as well as other National Metrology Institutes (NMIs) in Europe and Asia to help them in realising and/ or validating primary standards for microfluidic calibrations.
4.2 Early impact
Following the intercomparisons of the primary standards carried out in this project, three project partners (VSL, METAS and IPQ) have claimed CMC entries at either the BIPM or country-specific accreditation board, and two other partners (DTI and CETIAT) could provide evidence for their existing claim. This is an important part of the international system of quality assurance of primary standards held at NMIs. Furthermore, the intercomparisons conducted in the project have enabled the project collaborators VTT and Bronhorst High-Tech to validate their uncertainty budget which enables them to get accreditation for their calibration services too. Finally, several NMIs outside Europe have shown interest in carrying out low flow rate intercomparison(s) to validate their facilities.
The metrological infrastructure developed in this project is now fully in place and the new calibration capabilities are being used. International flow meter manufacturers and NMIs have shown an interest in the services to calibrate their facilities or to help validate their calibration, and the number of requests for calibration services are increasing.
The metrological infrastructure developed in this project enables hospitals to perform high quality checks on infusion pumps. So far two hospitals in Europe have used the derived-standards realised in this project to perform a cross check on their in-house reference meters. It also enables hospitals to check whether a certain combination of infusion pump and disposable equipment yields an acceptable dosing accuracy. This is important because the combination of disposables and equipment from various manufacturers is prone to dosing errors. For those cases, existing master calibrators can directly be used to investigate whether the combination does or does not result in dosing errors.
Drug delivery by infusion is necessary to deliver e.g. anaesthetics, insulin and vasoactive drugs to millions of patients every year. Wider uptake of traceable calibrations of low and ultra-low flow infusion (master) devices and improved knowledge of calibrating infusion equipment in clinical environments will lead, over time, to reduced errors in precision drug delivery. Reduced dosing errors will reduce the number of adverse incidents in patients’ treatment. Hence, ultimately, the project in the long term will improve the robustness and reliability of drug delivery and support the delivery of better healthcare.
Finally, the metrological infrastructure developed in this project may have benefits for the microfluidics sector, such as lab-on-a-chip, high performance liquid chromatography or process industry; because developers of
The project has resulted in 10 peer reviewed publications, 43 (poster) presentations and/ or conference proceedings and 8 technical reports. The technical reports as well as the conference proceedings are freely available from the EURAMET repository: http://www.euramet.org/research-publications-repository/publication-repository.
Peer reviewed publications
• M Ahrens, St Klein, B Nestler and C Damiani, Design and uncertainty assessment of a setup for calibration of microfluidic devices down to 5 nL min−1, Measurement Science and Technology, 25, 2014, doi:10.1088/0957-0233/25/1/015301
• Hugo Bissig, Martin Tschannen, Marc de Huu, Micro-flow facility for traceability in steady and pulsating flow, Flow Measurement and Instrumentation, 44, 2015
• Peter Lucas, Martin Ahrens, Jan Geršl, Wouter Sparreboom and Joost Lötters, Primary standard for liquid flow rates between 30 and 1500 nl/min based on volume expansion, Biomed. Eng.-Biomed. Tech. 2015; 60(4): 317–335, DOI 10.1515/bmt-2014-0132
• Elsa Batista, Nelson Almeida, Andreia Furtado, Eduarda Filipe, Luis Sousa, Rui Martins, Peter Lucas, Harm Tido Petter, Roland Snijder and Annemoon Timmerman, Assessment of drug delivery devices, Biomed. Eng.-Biomed. Tech. 2015; 60(4): 347–357, DOI 10.1515/bmt-2014-0138
• Annemoon M. Timmerman, Roland A. Snijder, Peter Lucas, Martine C. Lagerweij, Joris H. Radermacher and Maurits K. Konings, How physical infusion system parameters cause clinically relevant dose deviations after setpoint changes, Biomed. Eng.-Biomed. Tech. 2015; 60(4): 365–376, DOI 10.1515/bmt-2014-0139
• Hugo Bissig, Harm Tido Petter, Peter Lucas, Elsa Batista, Eduarda Filipe, Nelson Almeida, Luis Filipe Ribeiro, João Gala, Rui Martins, Benoit Savanier, Florestan Ogheard, Anders Koustrup Niemann, Joost Lötters and Wouter Sparreboom, Primary standards for measuring flow rates from 100 nl/min to 1 ml/min – gravimetric principle, Biomed. Eng.-Biomed. Tech. 2015; 60(4): 301–316, DOI 10.1515/bmt-2014-0145
• Annemoon M. Timmerman, Suzanne M. Oliveira-Martens, Roland A. Snijder, Anders K. Nieman and Toine C. Egberts, How to use current practice, risk analysis and standards to define hospital-wide policies on the safe use of infusion technology, Biomed. Eng.-Biomed. Tech. 2015; 60(4): 381–387, DOI 10.1515/bmt-2014-0147
• Roland A. Snijder, Maurits K. Konings, Peter Lucas, Toine C. Egberts and Annemoon D. Timmerman, Flow variability and its physical causes in infusion technology: a systematic review of in vitro measurement and modeling studies, Biomed. Eng.-Biomed. Tech. 2015; 60(4): 277–300, DOI 10.1515/bmt-2014-0148
• Martin Ahrens, Bodo Nestler, Stephan Klein, Peter Lucas, Harm Tido Petter and Christian Damiani, An experimental setup for traceable measurement and calibration of liquid flow rates down to 5 nl/min, Biomed. Eng.-Biomed. Tech. 2015; 60(4): 337–345, DOI 10.1515/bmt-2014-0153
• Peter Lucas and Stephan Klein, Metrology for drug delivery, Biomed. Eng.-Biomed. Tech. 2015; 60(4): 271–275, DOI 10.1515/bmt-2014-0155
• E. Batista, J. Gala, L. Ribeiro, N. Almeida, E. Filipe, R. F. Martins, Development of a microflow primary standard, 5th National meeting of the Portuguese Society of Metrology
• E. Batista, N. Almeida, E. Filipe, A. Costa, Calibration and use of syringe pumps, II Meeting - Metrology in health
• E. Batista, E. Filipe, A. Bandeira, H. Navas, Improvement of the microflow primary gravimetric standard, 4th meeting of Portuguese quality researchers
• E. Batista, J. Gala, L. Ribeiro, N. Almeida, E. Filipe, R. F. Martins, Development of a microflow primary standard, FLOMEKO, Paris, 2013
• E. Batista, N. Almeida, E. Filipe, A. Costa, Calibration and use of syringe pumps, CIM 2013
• E. Batista et al, Development of a microflow gravimetric System 2nd European Coriolis and ultrasonic workshop
• E.Batista et al, Uncertainty calculation in gravimetric microflow measurements, AMCTM 2014
• Batista, E., Bissig, H., Petter, H.T., Lucas, P., Ogheard, F., Niemann, A.K., IPQ, METAS, VSL, CETIAT, DTI European Research Project on Microflow Measurements – MeDD, ISFFM, Washington DC, USA 2015
• Bissig, H., Tschannen, M., Huu, M. de, Primary standard in Micro Flow for Traceability in Steady and Pulsating Flow Regime ISFFM, Washington DC, USA 2015
• Hugo Bissig, Martin Tschannen, Marc de Huu, Traceability in micro flow for steady and pulsating flow, IMRET13 conference
• Hugo Bissig, Martin Tschannen, Marc de Huu, Micro flow standard for steady and pulsatiing Flow, 2nd International Conference on MicroFluidic Handling Systems, Germany 2014
• Hugo Bissig, Martin Tschannen, Marc de Huu, Calibration of infusion pumps using liquids whose physical properties differ from those of water, TC 13 IMEKO
• David, C. et al, Interlaboratories comparison for small liquid flow rate, FLOMEKO, Paris, 2013
• David, C. et al, European Metrology Research Program 2011-2015, Metrology for Drug Delivery (MeDD), CIM 2013
• P. Lucas, H.T. Petter, W. Sparreboom, J.C. Lötters, Primary standards for nanoflow rates, 2nd International Conference on MicroFluidic Handling Systems, Germany 2014
• Lucas, P., Nielsen, I.J., Melvad, C., Standards for low to ultra-low flow rates for drug delivery applications, 1st conference on Micro Fluidics and Handling Systems, Netherlands, 2012
• Lucas, P. et al, Primary standard for nanoflow rates, FLOMEKO, Paris, 2013
• Lucas, P., Petter, H.T., Smits, E., Primary Standards for Liquid Flow Rates from 2 mg/h to 1000 g/h, ISFFM, Washington DC, USA 2015
• Lucas, P. et al, Flow Source Based on Expansion Principle as Primary Standard for Flow rates Above 10 nL/min, 8th Workshop Low Flows in Medical Technology, 2014, Germany
• C. Melvad, J. Frederiksen, The progress of gravimetric primary standards for liquid flow calibration at the Danish technological institute from 500 m3/h to 1E-9 m3/h FLOMEKO, Paris, 2013
• Bissig, H. et al, Micro flow facility for traceability in steady and pulsating flow, FLOMEKO, Paris, 2013
Good practice guide and technical reports
• Bissig, H. and Niemann, A.K., Cross check of the pulsating flow tester at DTI and METAS, technical report, 2015, available from www.drugmetrology.com
HLT07 MeDD
Final Publishable JRP Report
- 30 of 30 -
Issued: February 2017 Version V1.5
• Gersl, J., Numerical simulations of pulsating flow, technical report, 2015, available from www.drugmetrology.com
• Gersl, J., Numerical simulations for a nano-flow generator, technical report, 2015, available from www.drugmetrology.com
• Lucas, P., Bissig, H., Comparison of primary standards for lilquid nano flow rates, technical report, 2015, available from www.drugmetrology.com
• Lucas, P. David, C., Ogheard, F., Bissig, H., Comparison of primary standards for liquid micro flow rates, technical report, 2015, available from www.drugmetrology.com
• Lucas, P. David, C., Ogheard, F., Bissig, H., Comparison of primary standards for liquid micro flow rates, EURAMET report, 2015Lucas, P., Snijder, R.A., Timmerman, AMDE, Batista, E. Bissig, H. and Ogheard, F., Best practice guide, technical report, 2015, available from www.drugmetrology.com
References
• [1] IGZ, Risks of medical technology underestimated (original title ‘Risico’s van medische technologie onderschat’), The Hague, October, 2008
• [2] Riphagen, B., Multi-infusion, multiple problems. Development, validation and application of a system based on spectral-photometry for measuring fluid dynamics of multi-infusion systems in Neonatal Intensive Care Units. Graduation thesis, University of Twente, 2009
• [3] Sound mistrust of infusion pumps (original title: ‘Gezond wantrouwen bij infuuspompen’, Nursing 30, 2008
• [4] Spieth S, Schumacher A, Trenkle F. Approaches for drug delivery with intracortical probes. Biomed Tech 2014; 59(4):291-303
• [5] Capes D., Kimble R., Fluctuations in syringe-pump infusions: Association with blood pressure
variations in infants. Am J Health-Syst Pharm 1995; 52(Aug 1): 1646-1653
• [6] Kim, D.W. and Steward, D.J., “The effect of syringe size on the performance of an infusion pump,” Paediatr. Anaesth., vol. 9, no. 4, pp. 335–337, 1999.
• [7] Neal, D. and Lin, J. A., “The effect of syringe size on reliability and safety of low-flow infusions,” Pediatr. Crit. Care Med., vol. 10, no. 5, pp. 592–596, 2009
• [8] Neff, S.B., Neff, T.A., Gerber, S. and Weiss, M.M., “Flow rate, syringe size and architecture are critical to start-up performance of syringe pumps,” Eur.J.Anaesthesiol., vol. 24, no. 0265–0215 (Print), pp. 602–608, Jul. 2007
• [9] Schmidt, N., Saez, C.., Seri, I. and Maturana, A., “Impact of syringe size on the performance of infusion pumps at low flow rates,” Pediatr.Crit Care Med., vol. 11, no. 1529–7535 (Print), pp. 282–286, Mar. 2010
• [10] Kim, D.W. and Steward, D.J., “The effect of syringe size on the performance of an infusion pump,” Paediatr. Anaesth., vol. 9, no. 4, pp. 335–337, 1999.
• [12] Schmidt, N., Saez, C.., Seri, I. and Maturana, A., “Impact of syringe size on the performance of infusion pumps at low flow rates,” Pediatr.Crit Care Med., vol. 11, no. 1529–7535 (Print), pp. 282–286, Mar. 2010