242
FINAL REPORT - 2020
FINAL REPORT - 2020

Comprehensive Mobility Plan for Bengaluru
Page i
TABLE OF CONTENTS
Chapter Description Page Nos.
EXECUTIVE SUMMARY ............................................................................................................. I-XX
1 INTRODUCTION .................................................................................................................. 1-1
1.1 Sustainable Mobility Principles ...................................................................................... 1-2
1.1.1 Access .................................................................................................................... 1-2
1.1.2 People and Communities .......................................................................................... 1-2
1.1.3 Environmental Quality .............................................................................................. 1-3
1.1.4 Economic Viability .................................................................................................... 1-3
1.2 Impact of Regional/National Framework ....................................................................... 1-4
1.2.1 National Framework ................................................................................................. 1-4
1.2.2 Regional Framework ................................................................................................ 1-6
1.3 National Urban Transportation Policy (NUTP) ................................................................ 1-7
1.4 Delineation of Planning Area ........................................................................................ 1-8
1.5 Vision, Mission and Objectives of the Mobility Plan ........................................................ 1-8
1.5.1 Vision: Efficient and Sustainable Transportation for All ............................................... 1-8
1.5.2 Mission: Build a multi-modal transport system for equitable mobility access and minimized negative externalities ........................................................................................... 1-9
1.6 Review of Available Resources ................................................................................... 1-10
1.7 Stakeholder’s Identification ........................................................................................ 1-16
1.8 Approach and Methodology ........................................................................................ 1-19
2 Review of City Profile ........................................................................................................... 2-1
2.1 Brief Profile of the Study Area ...................................................................................... 2-1
2.2 Review of Existing Transport System ............................................................................ 2-3
2.2.1 Road Network ......................................................................................................... 2-3
2.2.2 Public Transport System ........................................................................................... 2-6
2.2.3 Non-Motorized Transport ....................................................................................... 2-10
2.2.4 Intermediate Public Transport ................................................................................ 2-13
2.2.5 Vehicle Growth in the City ...................................................................................... 2-14
2.2.6 Goods Transport .................................................................................................... 2-15
2.2.7 Parking ................................................................................................................. 2-15
2.2.8 Road Accidents ...................................................................................................... 2-17
Comprehensive Mobility Plan for Bengaluru
Page ii
2.3 Review of Energy and Environment ............................................................................ 2-18
2.4 Review of Existing Land Use Pattern ........................................................................... 2-20
2.5 Traffic Surveys .......................................................................................................... 2-22
2.5.1 Classified Volume Count ......................................................................................... 2-23
2.5.2 Outer Cordon Road Side Interview .......................................................................... 2-31
2.5.3 Parking surveys ..................................................................................................... 2-35
2.5.4 Boarding / Alighting Surveys .................................................................................. 2-43
2.5.5 Terminal Surveys ................................................................................................... 2-44
2.5.6 Household Interview Survey ................................................................................... 2-48
2.5.7 Modal Share .......................................................................................................... 2-50
2.5.8 Road Network Inventory ........................................................................................ 2-52
2.6 Summary of Existing Traffic and Transport Conditions ................................................. 2-55
2.6.1 Traffic Characteristics............................................................................................. 2-56
2.6.2 Public Transport Characteristics .............................................................................. 2-57
2.6.3 Household Interview Survey ................................................................................... 2-57
2.6.4 Road Inventory and Speed & Delay Survey Characteristics ....................................... 2-58
2.7 Service Level Benchmarking ....................................................................................... 2-58
3 TRANSPORT DEMAND ASSESSMENT AND DEVELOPMENT OF SUSTAINABLE URBAN TRANSPORT SCENARIOS ............................................................................................................................... 3-1
3.1 BUSINESS AS USUAL (BAU) SCENARIO ........................................................................... 3-1
3.1.1 Travel Demand Model Development .......................................................................... 3-1
3.1.2 Socio-Economic Transitions ...................................................................................... 3-1
3.1.3 Land use Transitions ................................................................................................ 3-2
3.1.4 Business as Usual Scenario (Do Minimum) ................................................................ 3-5
3.1.5 Summary of BAU Scenario ........................................................................................ 3-6
3.2 Development of Sustainable Urban Transport Scenario .................................................. 3-8
3.2.1 Strategic Framework for the Scenarios ...................................................................... 3-8
3.2.2 Alternate Strategies for Sustainable Urban Transport ............................................... 3-13
3.2.3 Comprehensive Mobility Strategy .......................................................................... 3-14
3.3 Analysis and Indicators .............................................................................................. 3-15
3.4 Conclusions ............................................................................................................... 3-16
4 Development of Comprehensive Mobility Plan ....................................................................... 4-1
4.1 Integrated Land use and Mobility Plan .......................................................................... 4-1
4.1.1 Revised Master Plan 2031 ........................................................................................ 4-1 4.1.2 Transit Oriented Development Policy 2019 ............................................................... 4-2

Comprehensive Mobility Plan for Bengaluru
Page iii
4.1.3 Recalibration of the RMP 2031 ................................................................................. 4-3
4.2 Public Transport Improvement Plan .............................................................................. 4-4
4.2.1 Rail-based Public Transport ...................................................................................... 4-5
4.2.2 Road Based Public Transport .................................................................................... 4-9
4.2.3 Overall Public Transport Network-2031 ................................................................... 4-14
4.2.4 Intermediate Para-transit and New Mobility ............................................................. 4-16
4.3 Road Network Development Plan ............................................................................... 4-17
4.3.1 Throughput and Quality Improvement Measures ..................................................... 4-17
4.3.2 Capacity Addition ................................................................................................... 4-28
4.3.3 Parking Infrastructure ............................................................................................ 4-34 4.3.4 Road Safety .......................................................................................................... 4-38
4.4 Non-Motorized Transport Plan .................................................................................... 4-39
4.4.1 Area Mobility Improvement Plan (AMIP) .................................................................. 4-40
4.4.2 Station Area Access Plan (SAAP) ............................................................................. 4-41
4.4.3 Pedestrain Streets.................................................................................................. 4-41
4.5 Multi Modal Mobility Plan (MMMP) .............................................................................. 4-42
4.5.1 Multi Modal Mobility Infrastructure .......................................................................... 4-42
4.5.2 Multi Modal Mobility Fare System ............................................................................ 4-45
4.5.3 Inter City Mobility .................................................................................................. 4-45
4.6 Private Transport Management Plan ........................................................................... 4-47
4.7 Freight Movement Plan .............................................................................................. 4-47
4.8 Technological Measures ............................................................................................. 4-49
4.8.1 Intelligent Transport Systems ................................................................................. 4-50
4.8.2 Traffic Management Center .................................................................................... 4-51
4.8.3 Smart Signalization ................................................................................................ 4-51
4.8.4 Vehicle Technology ................................................................................................ 4-52
4.9 Travel Demand Management Plan .............................................................................. 4-52
4.10 Regulatory Measures ................................................................................................. 4-52
4.10.1 Levy of Usage of Road Resourse ............................................................................. 4-53
4.10.2 Fare Regulations for Urban Transport ..................................................................... 4-53
4.10.3 Data Sharing Standards for Urban Transport ........................................................... 4-53
4.11 Governance Measures................................................................................................ 4-54
4.12 Fiscal Measures ......................................................................................................... 4-55
4.13 Action Plan and Budget Plan ...................................................................................... 4-55
4.14 Monitoring and Evaluation Plan .................................................................................. 4-58

Comprehensive Mobility Plan for Bengaluru
Page iv
4.15 Engagament of Stakeholders including citizens ............................................................ 4-58
4.16 Mobility Improvement Measures and NUTP Objectives ................................................. 4-58
4.17 Impact of Proposed Measures on Service Level bench Marks ........................................ 4-60
4.17.1 Public Transport facilities ........................................................................................ 4-60
4.17.2 Travel Speed (Motorized and Mass Trasnsit) along Major Corridors ........................... 4-61
4.17.3 Availability of Parking Spaces ................................................................................. 4-61
4.17.4 Road Safety .......................................................................................................... 4-61
4.17.5 Pollution Levels...................................................................................................... 4-62
4.17.6 Integrated Land Use Transport Systems .................................................................. 4-62
4.17.7 Sustainability of Public Transport ............................................................................ 4-62
5 IMPLEMENTATION PLAN...................................................................................................... 5-1
5.1 Phasing of Implementation Plan ................................................................................... 5-1
5.2 Funding of Projects ..................................................................................................... 5-7
5.2.1 Funding Options ...................................................................................................... 5-7
5.2.2 Funding Options for Urban Transport Project ........................................................... 5-14
5.3 Monitoring of CMP ..................................................................................................... 5-16
5.4 Stakeholder's Consultation ......................................................................................... 5-21

Comprehensive Mobility Plan for Bengaluru
Page v
LIST OF TABLES
Table 1-1: Proposed Bangalore Sub-urban Rail Network 1-13Table 2-1: Highlights of Master Plans of BMA 2-1 Table 2-2: Growth of Population in Bangalore Metropolitan Area 2-2 Table 2-3: Population of BIAAPA 2-2Table 2-4: Comparison of Work Force in BMA 2-3 Table 2-5: Green Time Wasted at Signalized junctions 2-5 Table 2-6: BMTC Performance 2-6Table 2-7: BMTC Buses Per Lakh Population-Chart 2-7 Table 2-8: Metro Corridors along with the Stretches and their Status 2-8 Table 2-9: Road Accident Scenario of Bangalore City 2-17Table 2-10: Total Emissions 2-19 Table 2-11: ELU Area Statement 2-20 Table 2-12: Survey Particulars 2-22Table 2-13: Peak hour Traffic volume at Screen line Locations 2-24 Table 2-14: Total Volume for 24 hours and peak hour on surveyed location 2-28 Table 2-15: Turning Volume Count Locations exceeding 10000 PCUs 2-29Table 2-16: Passenger Traffic at Outer Cordon Locations 2-31 Table 2-17: Share of Passenger and Goods traffic at outer cordon Locations 2-32 Table 2-18: Daily Goods Traffic volume coming in to Bangalore 2-33Table 2-19: Daily Goods Traffic Volume going from Bangalore 2-33 Table 2-20: Summary of Goods Traffic Movement 2-34 Table 2-21: Summary of On-Street Parking Accumulation 2-41Table 2-22: Details of Parking fee at some Off-street Parking Areas 2-42 Table 2-23: Distribution of Bus Stop Passengers by Trip Purpose 2-44 Table 2-24: Distribution of Daily Passengers at Major Bus Terminals 2-44Table 2-25: Mode wise Bus Passenger Dispersal Distribution 2-45 Table 2-26: Distribution of Passengers by Travel Time to Reach Bus Terminals 2-46 Table 2-27: Distribution of Passengers by Travel Frequency at Bus Terminals 2-46Table 2-28: Distribution of Air passengers by trip per purpose 2-47 Table 2-29: Mode wise Distribution of air passengers dispersal 2-48 Table 2-30: Mode wise Average Trip Length 2-52Table 2-31: Distribution of Road Length by Right of Way 2-52 Table 2-32: Distribution of Road Network as per Carriageway Width 2-53 Table 2-33: Distribution of Road Length by Availability of Service Road 2-53Table 2-34: Distribution of Road Length by Availability of Footpath 2-54 Table 2-35: Entry / Exit of Goods Vehicle at Surveyed Location 2-54 Table 2-36: Modal Split (Motorised Trips) 2-58Table 2-37: Summary of Service Level Bench Mark 2-65 Table 3-1: Summary of forecasted Population 3-2 Table 3-2: Proposed Land use-2031 3-3Table 3-3: Comparison on Travel characteristics between Base Year and Horizon 3-7 Table 3-4: Forecast Modal Share (Option 1) 3-13 Table 3-5: Forecast Modal Share (Option 2) 3-14Table 3-6: Forecast Modal Share (Option 3) 3-15

Comprehensive Mobility Plan for Bengaluru
Page vi
Table 3-7: Comparison of Emissions (in Tonnes) 3-15 Table 3-8: Service Level Benchmarking Summary 3-16 Table 4-1: Mass Transit System Capacities 4-4 Table 4-2: Metro Rail Projects (2031) 4-5 Table 4-3: Suburban Railway Projects 2031 4-8 Table 4-4: Bus Priority Corridors 4-12 Table 4-5: Bus Fleet Requirement 4-13 Table 4-6: Public Transport Network 4-16 Table 4-7: Corridor Improvement Plans 4-18 Table 4-8: List of Junction Improvement 4-21 Table 4-9: List of Foot Over Bridges 4-22 Table 4-10: Road Widening Plan 4-31 Table 4-11: Existing Off Street Parking in Core Area to be Refurbished 4-36 Table 4-12: Proposed Off Street Parking In Core Area to be Developed 4-37 Table 4-13: NMT Improvement Plan 4-40 Table 4-14: Metro SAAP 4-41 Table 4-15: Pedestrain Streets 4-42 Table 4-16: Elevated Walkways 4-43 Table 4-17: Inter modal Interchange Hubs 4-45 Table 4-18: Strategy Action Plan Matrix 4-56 Table 4-19: NUTP Objective and CMP proposals 4-58 Table 4-20: Summary of Service level Bench Marks 4-63 Table 5-1: Classification of Short Term, Medium Term and Long Term Projects 5-1 Table 5-2: Phase 1 Projects and Cost 5-4 Table 5-3: Phase 2 Projects and Cost 5-5 Table 5-4: Phase 3 Projects and Cost 5-6 Table 5-5: Total CMP Project Cost 5-7 Table 5-6: Characteristics of Management Contracts 5-11 Table 5-7: Characteristics of Lease Contracts 5-12 Table 5-8: Characteristics of Concessions 5-12 Table 5-9: Characteristics of BOT Contracts 5-13 Table 5-10: Characteristics of BOOT Contracts 5-13 Table 5-11: Potential Funding Options 5-14 Table 5-12: Action Plan - Lead Agency 5-18

Comprehensive Mobility Plan for Bengaluru
Page vii
LIST OF FIGURES
Figure 1-1: CMP Study Area ........................................................................................................ 1-9 Figure 2-1: Existing Road Network Map ....................................................................................... 2-4 Figure 2-2: Trend in Bus Fleet Size .............................................................................................. 2-7 Figure 2-3: Bangalore Metro Network .......................................................................................... 2-9 Figure 2-4: Pedetrain Crossing Data at Selected junctions .......................................................... 2-10 Figure 2-5: PBS operation clusters in Bengaluru ......................................................................... 2-11 Figure 2-6: PBS Ride Pattern on a Typical weekday .................................................................... 2-12 Figure 2-7: Cumulative Bicycling length Data from #CycletoWork ............................................... 2-12 Figure 2-8: Growth of Taxis in Bengaluru .................................................................................. 2-13 Figure 2-9: Vehicular Growth in Bangalore ................................................................................. 2-14 Figure 2-10: Composition of Registered Private Vehicles in Bangalore ......................................... 2-15 Figure 2-11: BMTC and BBMP Parking Spaces in Bengaluru ........................................................ 2-16 Figure 2-12: Trend of Road Accidents in Bangalore .................................................................... 2-18 Figure 2-13: Source of PM10 and PM2.5 emissions in Bangalore (Source: TERI) .......................... 2-19 Figure 2-14: Existing Land Use Map of BMA ............................................................................... 2-21 Figure 2-15: Types of Goods at outer cordon points ................................................................... 2-34 Figure 2-16: Trip frequency- Passenger Vehicle at Outer Cordon Location ................................... 2-35 Figure 2-17: Trip purpose- passenger vehicle at outer cordon location ........................................ 2-35 Figure 2-18: Average Journey Speeds on Primary Arterial Roads ................................................. 2-43 Figure 2-19: Distributions of Households According to Size ......................................................... 2-49 Figure 2-20: Distributions of Households According to Average Monthly Income .......................... 2-49 Figure 2-21: Distributions of Households According to Average Monthly Expenditure on Transport 2-50 Figure 2-22: Modal Split - 2015 (Including NMT Trips)................................................................ 2-51 Figure 2-23: Purpose wise Distribution of Trips .......................................................................... 2-51 Figure 2-24: Types of Goods at Goods Focal Point ..................................................................... 2-55 Figure 3-1: Land-Use Proposed for 2031 (BMA Area) .................................................................... 3-4 Figure 3-2: Metro Phase-1 and 2 Corridors .................................................................................. 3-5 Figure 3-3: V/C Ratio on all the links (BMA Area) - 2031 ............................................................... 3-6 Figure 3-4: Strategic Framework for Efficient and Sustainable Tansport ......................................... 3-9 Figure 4-1: Transit Oriented Development ................................................................................... 4-3 Figure 4-2: Metro Rail Network 2031 ........................................................................................... 4-6 Figure 4-3: Sub-Urban Rail Network 2031 .................................................................................... 4-9 Figure 4-4: Bus Priority Corridors .............................................................................................. 4-11 Figure 4-5: BRTS / Metrolite Network ........................................................................................ 4-14 Figure 4-6: Public Transport Corridors ....................................................................................... 4-15 Figure 4-7: Corridor Improvement Plan ..................................................................................... 4-19 Figure 4-8: Foot Over Bridges ................................................................................................... 4-27 Figure 4-9: Road Widening Plan ................................................................................................ 4-30 Figure 4-10: Elevated Road Corridors ........................................................................................ 4-32 Figure 4-11: Peripheral Ring Road ............................................................................................ 4-33 Figure 4-12: Proposed Off Street Parking in Core Areas to be Developed ..................................... 4-36 Figure 4-13: NMT Improvement Plans ....................................................................................... 4-40 Figure 4-14: Pedestrian Zone .................................................................................................... 4-42 Figure 4-15: Elevated Walkways ............................................................................................... 4-43

Comprehensive Mobility Plan for Bengaluru
Page viii
Figure 4-16: Intermodal Interchange Hubs ................................................................................ 4-44 Figure 4-17: Intercity Mobility Hubs .......................................................................................... 4-46 Figure 4-18: Freight Logistics Centers ....................................................................................... 4-49 Figure 4-19: Schematic Representation of ITS ........................................................................... 4-50 Figure 4-20: Schematic Representation of TMC .......................................................................... 4-51
LIST OF ANNEXURES
Annexure 3.1: Transport Demand Model Annexure 3.2: Population Projections Annexure 4.1: Executive Summary of TOD Policy Annexure 4.2: Design and Monitoring Framework

Comprehensive Mobility Plan for Bengaluru
Page ix
ABBREVIATIONS:
ATC - Area Traffic Control
ATIS - Advanced Traveler Information System
ATMS - Advanced Traffic Management System
AVCS - Advanced Vehicle Control Systems
BAU - Business as Usual
BBMP - Bruhat Bengaluru Mahanagara Palike
BDA - Bangalore Development Authority
BIAA – LPA - Bangalore International Airport Area – Land Planning Authority
BIAL - Bangalore International Airport Limited
BMA - Bangalore Metropolitan Area
BMICAPA - Bangalore-Mysore Infrastructure Corridor Area Planning Authority
BMLTA - Bangalore Metropolitan Land Transport Authority
BMR - Bangalore Metropolitan Region
BMRCL - Bangalore Metro Rail Corporation Limited
BMRDA - Bangalore Metropolitan Region Development Authority
BMTC - Bangalore Metropolitan Transport Corporation
BRTS - Bus Rapid Transit System
CAGR - Compound Annual Growth Rate
CBD - Central Business District (Measured from Bangalore City Railway Station)
CFS - Container Freight Station
CDP - Comprehensive Development Plans
CIRT - Central Institute of Road Transport
CMP - Comprehensive Mobility Plan
CNG - Compressed Natural Gas
CONCOI - Container Corporation of India
CSE - Centre for Science and Environment
CTTP - Center for Training Transportation Professionals
CTTS - Comprehensive Traffic and Transportation Studies
DULT - Directorate of Urban Land Transport
DUTF - Dedicated Urban Transport Fund
ECS - Electronic Clearing Service
EIRR - Economic Internal Rate of Return
ELU - Existing Land Use

Comprehensive Mobility Plan for Bengaluru
Page x
FAME - Faster Adoption and Manufacturing of Electric
FAR - Floor Area Ratio
GDP - Gross Domestic Product
GoK - Government of Karnataka
GPRS - General Pocket Radio Service
GPS - Global Positioning System
GR - Growth Rate
GSDP - Gross State Domestic Product
HCV - Heavy Commercial Vehicles
ICCC - Integrated Command Control Centre
ICD - Inland Container Depot
IFC - Integrated Freight Complexes
IPT - Information Processing and Technology
IRR - Intermediate Ring Road
ITS - Intelligent Transportation Systems
KIA - Kempegowda International Airport
KRDCL - Karnataka Road Development Corporation Limited
KSRTC - Karnataka State Road Transport Corporation
KTCPA - Karnataka State Town Planning Act
KUIDFC - Karnataka Urban Infrastructure Development and Finance Corporation
LCV - Light Commercial Vehicles
LoS - Level of Service
LPA - Local Planning Area
LRT - Light Rail Transit
LTA - Land Transport Authority
MAV - Micro Air Vehicle
MCTC - Mysore Road Satellite Bus Station
MoHUA - Ministry of Housing and Urban Affairs
MOUD - Ministry of Urban Development
MRTS - Mass Rapid Transit System
NEMMP - National Electric Mobility Mission Plan
NGT - National Green Tribunal Act
NMSH - National Mission on Sustainable Habitat

Comprehensive Mobility Plan for Bengaluru
Page xi
NMT - Non-Motorized Transport
NTDPC - National Transport Development Policy Committee
NUTP - National Urban Transportation Policy
ORR - Outer Ring Road
PBS - Public Bike Sharing
PCU - Passenger Car Units
PIS - Passenger Information System
PPP - Public Private Partnership
PRR - Peripheral Ring Road
PWD - Public Works Department
RMP - Revised Master Plan
RSW - Rail Side Warehousing
RSP - Revised Structural Plan
RSPM - Respirable Suspended Particulate Matter
RWIS - Road Weather Information System
SLB - Service Level Benchmarks
SO2 - Sulpher di Oxide
SPM - Suspended Particulate Matter
STRR - Satellite Town Ring Road
SUT - Sustainable Urban Transport
TDM - Transportation Demand Management
TDR - Transfer of Developments Rights
TFL - Transport for London
TMC - Traffic Management Centre
TOD - Transit Oriented Development
TTMC - Traffic and Transit Management Centre
UT - Urban Transport
UMTA - Unified Metropolitan Transportation Authority
VGF - Visibility Gap Funding
VKT - Vehicle Kilometers Travelled
VPC - Vehicle Parking Certificate
Comprehensive Mobility Plan for Bengaluru
I
EXECUTIVE SUM M ARY
1 . Back grou n d
Bengaluru is one of the major engines of economic growth for the entire country. For the state of Karnataka, the city accounts for almost 36% of the Gross State Domestic Product. With its robust and extensive eco-system for professional education, scientific and technical research, information technology, electronics design, and start-up opportunities, the city has been generating huge economic opportunities and jobs for highly skilled to semi-skilled populations, attracted from within the state as well as outside. The massive pace of growth of the city’s population necessitates expansion and upgradation of the city’s infrastructure, housing stock for different income segments and public services. In particular, the urban mobility infrastructure has fallen behind the curve, with the increasing road congestion, longer commute times and environmental stresses emerging as the binding constraints for the city’s march towards achieving its ecologically sustainable economic potential.
A coordinated effort to improve mobility in Bengaluru by setting-up efficient and sustainable transportation eco-system is critically relevant. The comprehensive mobility plan is the first step in that direction to provide the overall framework for integrating various transport sub-systems and addressing the needs of various segments of population.
2 . Vision , M ission an d Ob j ectiv es of the M ob il ity Pl an
Vision : Efficient and Sustainable Transportation for All
M ission : Build a multi-modal transport system for equitable mobility access and minimized negative externalities
Goal 1: Increase mode share of public transport in meeting transport demand Goal 2: Regain road infrastructure as public good Goal 3: Reduce transport sector contribution to air pollution and GHG emissions
3 . Stu d y Area
The study area includes whole of Bengaluru Metropolitan Area (LPA area: 1294.00 Sq.km), part of Bangalore - Mysore Infrastructure Corridor Area (BMICAPA part area: 79.14 Sq.km.) and part of Bangalore International Airport Area Local Planning Authority (BIAA-LPA part area: 227.85 Sq.km). The access controlled NICE Road on West-South periphery of the city as part of the BMI corridor has facilitated opening of new areas of urban development; a part of the BMICAPA has been included in the study area accordingly. The development of Airport near Devanahalli and transport infrastructure development in the form of 6 lane access controlled road between Hebbal and Airport has triggered development around airport and near Devanahalli. To ensure planned development, BIAA-LPA has been established to oversee the development of the identified area. The BIAA-LPA study area reveals that most of the developments are in two administrative areas namely Jala Hobli and Kasba Hobli. Considering this and to account its impact on the city development part of BIAA-LPA area extending 227.85 Sq.km has been included in the planning area for CMP.

Comprehensive Mobility Plan for Bengaluru
II
4 . Approach an d M ethod ol ogy
A brief methodology adopted for preparation of Comprehensive Mobility Plan for Bengaluru is presented below:
STAGE 1 : Def in in g NEED an d SCOPE f or Com prehen siv e M ob il ity Pl an f or Ben gal u ru Stage 1.1: Establishing Need, Defining Vision & Objectives for Bengaluru • Review of vision for Bengaluru
from Master Plan and Other Economic studies
• Defining Need for preparation of CMP
• Defining Vision ( in coherence to the vision for Bengaluru from Master plan and other Economic plans)
• Objectives of CMP for Bengaluru
Stage 1.2: Delineation of Planning area • Reconnaissance of Bengaluru
Region • Delineation of planning area to
plan CMP
Stage 1.3: Defining Planning Horizon • Short term • Long term • Medium term
STAGE 2 : Ex istin g Situ ation An al y sis & Data Col l ection Stage 2.1: Review of existing population characteristics through secondary sources • Review of Regional Profile • Review of land use patterns,
characteristics of population, population density
• Review of Socio economic profile • Review of Energy and
Environment
Stage 2.2: Review of existing transport characteristics through secondary sources • Review of Road infrastructure • Assessment of public Transport
infrastructure • Review of IPT infrastructure • Review of Mass transit
infrastructure
Stage 2.3: Study of Existing travel pattern and Behaviour through surveys and data collected for revised master plan 2015 • Road network inventory • Classified turning volume
counts. • Speed and delay • Pedestrian count surveys • Parking surveys • Bus boarding alignment
survey • IPT survey • Cordon survey • Rail passenger survey
STAGE 3 : Def in in g Ben chm ark s Defining Benchmarks for various scenarios in order to come up with best scenario
STAGE 4 : Scen ario Dev el opm en t Stage 4.1: Development of Business as Usual scenario Stage 4.2: Development of Sustainable Urban
Transport Scenario STAGE 5 : Fou r Stage M od el in g to test BAU an d other Su stain ab l e Urb an Tran sport Scen ario
STAGE 6: DEVELOPMENT OF URBAN MOBILITY PLAN Stage 6.1: Formulation of Plans
• Integrated land use and urban mobility plan • Public transport improvement plan • Road network development program • NMT facility improvement plan • Multimodal integration plan • Intermodal public transport plan • Traffic engineering and Management plan • Travel demand measures for Bengaluru
STAGE 7 : Form u l ation Im pl em en tation Program For CM P Stage 7.1: Formulation of REGULATORY MEASURES Stage 7.2: Formulation of INSTITUTIONAL STRATEGY Stage 7.3: Formulation of FISCAL STRATEGY
Comprehensive Mobility Plan for Bengaluru
III
5 . Data col l ection an d Su rv ey Fin d in gs
The purpose of conducting traffic surveys is to assess the traffic and the transport characteristics of the study area and provide inputs to develop the transport model. The data collected from earlier studies like Revised Master Plan -2031, RITES Revised Final Report of Phase-III Corridors of Bangalore Metro, 2016, Comprehensive Traffic and Transportation Study for Bangalore Metropolitan Region (BMR)-2018 and Parking Action Plan for Bangalore have been used for the current study.
Important observations from the survey analyses are presented in the following section:
Traf f ic Characteristics
The major road network is congested uniformly. The highest peak hour traffic at screen line locations is 10,699 PCUs (11,989 vehicles).
The traffic volumes at most of junctions have already exceeded capacity. Junctions i.e. Central Silk Board, KR Puram, Hebbal are having more than 3 lakhs vehicles per day.
The major traffic enters the city through NH-7 (Hosur road). The highest percentage of goods vehicles enters the city through NH-4 (Tumkur Road)
Pu b l ic Tran sport Characteristics
About 2.9 lakhs commuters use the inter or intra city bus terminals daily. Majestic bus terminal caters to the maximum number of passengers i.e. 70000 passengers. About 56% passengers are dispersing through buses. Share of passenger dispersal by walk and auto rickshaw is about 39% and 2% respectively.
The City Railway Station handles 1.05 Lakh numbers of passengers daily. Out of 1.1 lakh trips of passengers, work & business purpose trips are about 25% followed by about 4% for education purpose. About 65% passengers are dispersing through buses. Share of passenger dispersal by Auto is about 20% .
The Kempegowda Airport caters to about 90,000 passengers per day. About 72% passengers are dispersing through Car and Taxis/IPT. Share of passenger dispersal by buses is about 28% .
H ou sehol d In terv iew Su rv ey
Nearly 84% of households have motor vehicles. About 20% of the household have one car. About 60% of households have at least 1 scooter/motor cycle.
Average household income per month in the study area was observed to be Rs. 32374.
Average expenditure on transport per household is estimated as Rs 2473 per month, which is about 7.6% of average household income.
A total of 12.60 Lakh peak hour trips are being performed everyday by the residents of study area. The public transport has contributed almost 48% of total trips followed by two wheelers (23.5% ) and car/taxi (21% ).
Per capita trip rate including walk is 1.24, excluding walk is 0.92 and for motorized trips is 0.91.
Average trip length for walk is 1.0 Km, for 2-wheeler 9.8 km, for car and taxi is 10.2 km and 13.1 km and for Bus it is about 12 km.

Comprehensive Mobility Plan for Bengaluru
IV
Road In v en tory an d Speed & Del ay Su rv ey Characteristics
About 43% of roads have ROW up to 10 m and 13% has ROW between 20 to 30 m. This indicates the limitation of widening for most of the roads.
About 74% of surveyed road network length has carriageway width upto 2 lanes and only about 20% of road network 4 lanes and more.
Footpaths are available along about 47% of the road length. Thus the majority length of road network is without footpaths.
It is observed that the speeds on the city road network are mostly less than 20 kmph while the core area of Bangalore operates at very low speeds (less than 11 kmph) in the peak hour.
6 . Serv ice Lev el Ben chm ark in g
Description Ex istin g LOS Rem ark s
Pu b l ic Tran sport Facil ities 2
The city has Public Transport system which needs considerable improvements in terms of supply of buses/coaches and coverage as many parts of the city are not served by it. The frequency of the services also needs to be improved.
Non M otorised Tran sport ( NM T) f acil ities 4 The city lacks adequate NMT facilities.
Trav el speed ( M otoriz ed an d M ass Tran sit) al on g m aj or corrid ors
4
Significant approach delays and average travel speed of 1/3rdor lower of the free flow speed. Such condition is causing combination of one or more reasons such as high signal density, extensive queuing at critical intersection and appropriate signal timing.
Park in g spaces 4 The city authority need to initiate immediate actions with respect to providing paid parking spaces and demand management for parking.
Road Saf ety 3
Need considerable improvements in Road design and available road infrastructure, traffic management and in other such reasons which significantly contribute to road safety.
Pol l u tion l ev el s 2 Needs improvement in emission standards, checking pollution etc.
In tegrated l an d u se tran sport sy stem
3 Faint coherence between study area structure and public transport system.
Su stain ab il ity of Pu b l ic Tran sport 2
The Public transport is financially sustainable but needs some improvement.

Comprehensive Mobility Plan for Bengaluru
V
7 . Trav el Dem an d Assessm en t
The main focus of the study is to develop a long-term transportation strategy for Bengaluru with the help of an urban transport planning model. Transport Demand Modelling has been carried out to replicate the Bengaluru “ real” transportation system and forecasting the state of the system for the targeted horizon year (2051) under various scenarios.
Socio- econ om ic Tran sition
The Revised Master Plan-2031 has carried out projections for the spatially constant Bengaluru Metropolitan Area. The projected population for the BMA and the extended area is shown below:
Forecasted Popu l ation in the Stu d y Area
2 0 1 5 2 0 3 1 2 0 4 1 2 0 5 1
BMA 11,227,977 20,313,499 25,709,017 31,636,758
Extended Area 255,449 550,000 895,892 1,604,406
Total 1 1 , 4 8 3 , 4 2 6 2 0 , 8 6 3 , 4 9 9 2 6 , 6 0 4 , 9 0 9 3 3 , 2 4 1 , 1 6 5
Bu sin ess as Usu al Scen ario ( Do M in im u m )
In Do Minimum Business as Usual (BAU-DM) scenario, the existing road network with committed development projects are considered. The committed projects proposed by various departments are Metro Phase 2, Peripheral Ring Road, Elevated Corridors and Augmentation of BMTC buses to double the existing fleet. The results of BAU-DM scenario are presented in the table below
Com parison on Trav el characteristics b etw een Base Y ear an d H oriz on Y ear
Modes
Base Year (2015) BAU (2031) Peak Hour Trips Mode Share Peak Hour Trips Mode Share
Car+ Tax i 26 4 , 6 4 9 21% 6 8 9, 6 7 3 30% Tw o W heeler 296 , 4 6 8 24 % 6 6 6 , 6 8 5 29% A u to Rick shaw 96 , 6 5 5 8 % 114 , 94 6 5 %Pu blic Transport 6 01, 8 6 1 4 8 % 8 27 , 6 08 36 %
Total 1,259,633 2,298,912 Average Trip length in KM
Car 10. 2 16 Tw o W heeler 9. 8 16 . 8 I PT 3. 7 8 . 4 Pu blic Transit 12. 0 13. 1
Emissions in Tonnes CO2 Per Day 29204 6 906 2H C Per Day 5 1 126 SPM Per Day 9 24

Comprehensive Mobility Plan for Bengaluru
VI
N OX Per Day 323 7 6 8 CO Per Day 198 4 6 4
8 . Su stain ab l e Urb an Tran sport Scen arios
As shown in the earlier section, the BAU scenario results in increased private trips and decreased Public Transport trips. As per the Ministry of Housing and Urban Affairs guidelines, a sustainable scenario has to be considered to reduce congestion and pollution, while conserving resources like urban space and capital expenditure. Hence, a strategic framework has been developed for the CMP vision of “ efficient and sustainable transport for all”
9 . Strategic Fram ew ork f or the Scen arios Strategy 1 : Ex pan d reach an d au gm en t capacity of pu b l ic tran sport
sy stem s The high share of public transport usage in the past has experienced a significant decline in recent decades due to lowering of speed of busses in view of the congestion caused by private vehicles, and aging and overburdened fleet of busses. The areas of operations of existing public transport systems, both road-based and rail-based, should be expanded throughout the city to provide convenient mobility options for commuters. At the same time, capacity of existing systems should also be expanded to provide frequent and reliable transit services for commuters during peak and off-peak hours.
Strategy 2 : Im prov e operation al ef f icien cy of pu b l ic tran sport sy stem s While the creation of infrastructure and capacity of public transport is critical, these systems also need to achieve operational efficiency to enhance commuter convenience and to optimize throughput. Bengaluru Metro has high potential capacity for throughput and BMTC can optimize the frequency of services on time performance to provide more reliable services to commuters. Upgradation of the aging bus fleet and driver training, ITS system for data-driven decision making and route rationalisation exercises on a periodic basis will ensure viability and operational efficiency.
Strategy 3 : Prom ote m u l ti- m od al m ob il ity option s As urban mobility in the city has experienced a shift towards greater personal vehicle ownership and usage, it is necessary to arrest this trend and achieve more efficient, sustainable and equitable mobility by building a multi-modal transport system that provides integrated, seamless and safe mobility. This requires infrastructure investments that go beyond road networks for vehicles and include investments in public transport, NMT networks, and rail-based infrastructure.
Strategy 4 : Prom ote Tran sit Orien ted Dev el opm en t A strategic goal of bringing at least 25% area of BMA under Transit-oriented development (TOD) is recommended. The TOD would bring together the closely-related urban planning and transport planning sectors, which are currently governed in silos, for facilitating development, including redevelopment of existing areas,

Comprehensive Mobility Plan for Bengaluru
VII
through a mix of residential, commercial and recreational land-uses in dense and walkable layouts that are centred around high-quality mass transit networks. Other land use related policies such as mixed land use, job decentralization and urban compaction were analysed for sustainable goals.
Strategy 5 : Im prov e ef f icien cy of road in f rastru ctu re A large part of the capacity of the road network in the city is blocked in unproductive and inefficient usage, due to improper planning as well as unregulated behaviours. Parking is a key problem. Other factors impacting the throughput efficiency of urban roads include the design of cross roads and junctions. For efficient road networks that work at full capacity and improve the management of traffic flows, it is necessary to free up road space from unproductive uses and enhance throughput of the road infrastructure.
Strategy 6 : Au gm en t capacity of road in f rastru ctu re In addition to inefficient use of road infrastructure, the overall capacity of the road network is also a major constraint. There is a need for augmenting the capacity of arterial roads in the CBD areas, as well as that of the ORR. Planned road infrastructures in the rapidly developing peripheral areas such as Whitefield are also necessary for more equitable road densities across the city. All further augmentation of urban road capacity, be it at-grade or along elevated corridors, should pay particular attention to the equitable allocation of road space, and should prioritize movements of public transport vehicles, pedestrians and bicyclists.
Strategy 7 : M ak e com m u ters b ear f u l l cost of ex tern al ities of m ob il ity m od es There are several negative externalities attributed to low-occupancy transport modes such as personal vehicles and certain IPT modes that contribute to increased vehicle kilometres travelled and fuel consumed, With the current laissez faire approach to regulating the usage of inefficient transport modes, the costs of the resulting negative externalities are not borne by the users themselves and also costs fall disproportionately on commuters. Based on the principles of fairness and polluter-pays, a new approach is needed which imposes the full costs of negative externalities of given modes on their users in a proportionate manner, to mitigate their impacts on the city and influence more efficient mode choices.
Strategy 8 : In f l u en ce m ob il ity choice throu gh regu l atory , f iscal an d pricin g m easu res Individuals choose to fulfil their mobility needs using a wide variety of transport modes ranging from single-occupancy personal vehicles to high-occupancy public transport services. These mode choices are often shaped by the regulatory and fiscal framework governing the urban transport system, which has traditionally favoured car-based personal transport. However, the goal of mobility systems should be the efficient movement of people and not that of vehicles, and the governance of the urban transport sector needs to evolve to reflect this objective. Regulatory, fiscal and pricing instruments should be designed to restructure the incentives and dis-incentives that influence commuter mode choices, with efficient and sustainable modes being favoured and prioritised over inefficient ones.

Comprehensive Mobility Plan for Bengaluru
VIII
Strategy 9 : Prom otin g u se of el ectric an d cl ean er f u el v ehicl es In spite of favourable climatic conditions, air pollution caused by transport vehicles is becoming a major challenge as the incremental pollution load in Bengaluru is assessed to be the third-highest among all major cities in the country. While the case of e-vehicles, when charged by electricity generated from fossil fuel, in mitigating overall greenhouse gas emissions is debatable, those vehicles certainly can help in mitigating air pollution in a big manner in the city. The strategic intervention should be to set-up measures for increasing use of e-vehicles and CNG vehicles and appropriate electricity pricing for charging of e-vehicles at homes through smart meters.
Strategy 1 0 : Estab l ish m echan ism f or pl an n in g, capacity b u il d in g an d accou n tab il ity Fragmentation in the governance of urban transport leads to conflicting objectives, and inequitable distribution of transport investments. The establishment of a single organization at the city level is necessary for integrated planning of mobility infrastructure, coordination among different public agencies responsible for mobility services, capacity building in transit agencies for optimization of mobility services, development of a framework for accountability of those agencies, advisory role to State Government for regulatory functions, and the setting up of infrastructure common to different service providers for greater multi-modal integration. Such an organisation should have a legislative mandate and its scope should be wider than being merely advisory.
1 0 . Option s f or Su stain ab l e Urb an Tran sport
Option 1 : Pu b l ic Tran sport Au gm en tation an d Ef f icien cy Im prov em en t, an d M u l ti-m od al Tran sport ( Strategy 1 , 2 & 3 )
This scenario is premised on augmenting reach and capacity of public transport system, mainly from the projects already on the approval or planning stage and taking measures for multi-modal transport options through commuter rail, expansion of metro network along outer ring road and radial roads, and bus fleet augmentation.
The Model was run for this option and the PT Share showed an improvement to 59% . However, the street network continued to show distress as the vehicles would nearly double to what is there today. As a result, first and last mile connectivity would continue to be problematic.
Forecast M od al Share ( Option 1 )
Modes
BAU (2031) Option 1
Peak Hour Trips Mode Share Peak Hour Trips Mode
Share Car+ Tax i 6 8 9, 6 7 3 30% 5 7 2, 6 38 25 % Tw o W heeler 6 6 6 , 6 8 5 29% 304 , 7 8 0 13%
A u to Rick shaw 114 , 94 6 5 % 7 1, 4 06 3%
Pu blic Transport 8 27 , 6 08 36 % 1, 35 0, 08 8 5 9%
Total 2,298,912 2,298,912

Comprehensive Mobility Plan for Bengaluru
IX
Option 2 : Pu b l ic Tran sport Au gm en tation pl u s En han ced capacity an d Ef f icien cy of Road In f rastru ctu re ( Strategy 1 to 3 an d 6 )
This scenario envisages improving efficiency of existing road infrastructure and augmenting the road capacity through junction improvements and smoothening bottlenecks, at-grade road widening and elevated roads while earmarking a part of the new capacity for bus-based public transport besides more ambitious expansion of the public transport.
Forecast M od al Share ( Option 2 )
Modes
BAU (2031) Option 2
Peak Hour Trips Mode Share Peak Hour Trips Mode
Share Car+ Tax i 6 8 9, 6 7 3 30% 5 32, 5 8 1 23%
Tw o W heeler 6 6 6 , 6 8 5 29% 26 1, 24 0 11% A u to Rick shaw 114 , 94 6 5 % 6 7 , 922 3%
Pu blic Transport 8 27 , 6 08 36 % 1, 4 37 , 16 8 6 3%
Total 2,298,912 2,298,912
Option 3 : Com prehen siv e M ob il ity Strategy : Tran sit Orien ted Dev el opm en t, Factorin g- in f u l l cost of ex tern al ities, Regu l ation s on priv ate v ehicl es, b esid es Pu b l ic Tran sport Au gm en tation pl u s En han ced Capacity an d Ef f icien cy of Road In f rastru ctu re, an d Cl ean er techn ol ogy v ehicl es ( Strategy 1 to 1 0 )
The scenario is premised on all future developments and redevelopments being guided by Transit Oriented Development so that the residents live and work closer to high capacity and efficient public transit corridors reducing the demand for long-distance mobility. By imposing the cost of negative externalities, largely through economic means, on the commuters opting for less efficient transport options, the usage of private vehicles is envisaged to be discouraged significantly and thereby regaining the road infrastructure as public good. While these two measures influence the demand, the supply side is to be taken care by expansion and improve efficiency of public transport systems and methodical efforts for multi-modal integration measures.
Forecast M od al Share ( Option 3 )
Modes
BAU (2031) Option 3
Peak Hour Trips Mode Share Peak Hour Trips Mode
Share Car+ Tax i 6 8 9, 6 7 3 30% 394 , 4 7 2 17 %
Tw o W heeler 6 6 6 , 6 8 5 29% 18 1, 126 8 %
A u to Rick shaw 114 , 94 6 5 % 4 2, 6 6 9 2%
Pu blic Transport 8 27 , 6 08 36 % 1, 6 8 0, 6 4 4 7 3% Total 2,298,912 2,298,912

Comprehensive Mobility Plan for Bengaluru
X
Com parison of Em ission s ( in Ton n es)
Emissions in Tonnes
Base Year
(2015)
BAU (2031)
Option 3
Option 2
Demand Management
NMT
All Buses and Cars Run on Electricity
CO2 Per Day 29204 6 906 2 17 8 8 0 16 092 128 7 4 6 4 37
H C Per Day 5 1 126 28 25 20 10
SPM Per Day 9 24 7 6 5 3
N OX Per Day 323 7 6 8 17 3 15 6 125 6 2
CO Per Day 198 4 6 4 120 108 8 6 4 3
1 1 . Dev el opm en t of Com prehen siv e M ob il ity Pl an
The comprehensive mobility plan covering first ten strategies recommended as part of Option 3 in the previous section has been arranged in following twelve themes under which projects have been identified:
Them e 1 : In tegrated Lan d Use an d M ob il ity Pl an
Tran sit Orien ted Dev el opm en t A draft TOD policy has been prepared and placed in the public domain for suggestions. The policy envisages the vision of “ Bengaluru becoming a public transport oriented city that is compact, people friendly, environment friendly and support economic growth while offering a good quality of life. The goals of the policy are aligned to that of the CMP with the major goals being achievement of 70% share of public transport in motorized trips and 60% of the city population living within intense TOD zone. The policy assesses that the goals may require about 600 km of mass transit corridors and development of adequate infrastructure so as to achieve the gross density ranging from 250 to 400 pph (persons per hectare) along the mass transit corridors by 2031.The major components of TOD framework are density, diversity, design, destination accessibility, distance to transit and demand management. The required changes to the Revised Master Plan 2031 should be made to align with the TOD policy.
Them e 2 : Pu b l ic Tran sport Im prov em en t Pl an
Rail - b ased Pu b l ic Tran sport The CMP envisages setting up 317 km metro rail network by 2031. In addition, four corridors of suburban rail with a length of 149 km within the city on dedicated tracks and their 165 km extension to suburban areas through tracks shared with the railways are suggested as part of this CMP.
Road - b ased Pu b l ic Tran sport 11 corridors with high demand have been identified as priority corridors (202 kms) with exclusive lanes for public transport buses. The bus fleet size is proposed to be expanded to 16582 by 2031. 40 new depots and TTMC/Bus Terminals have been
Comprehensive Mobility Plan for Bengaluru
XI
identified within the newly planned areas of BMA. The BRTS or Metrolite system has been suggested for Peripheral Ring Road (PRR) and NICE Road.
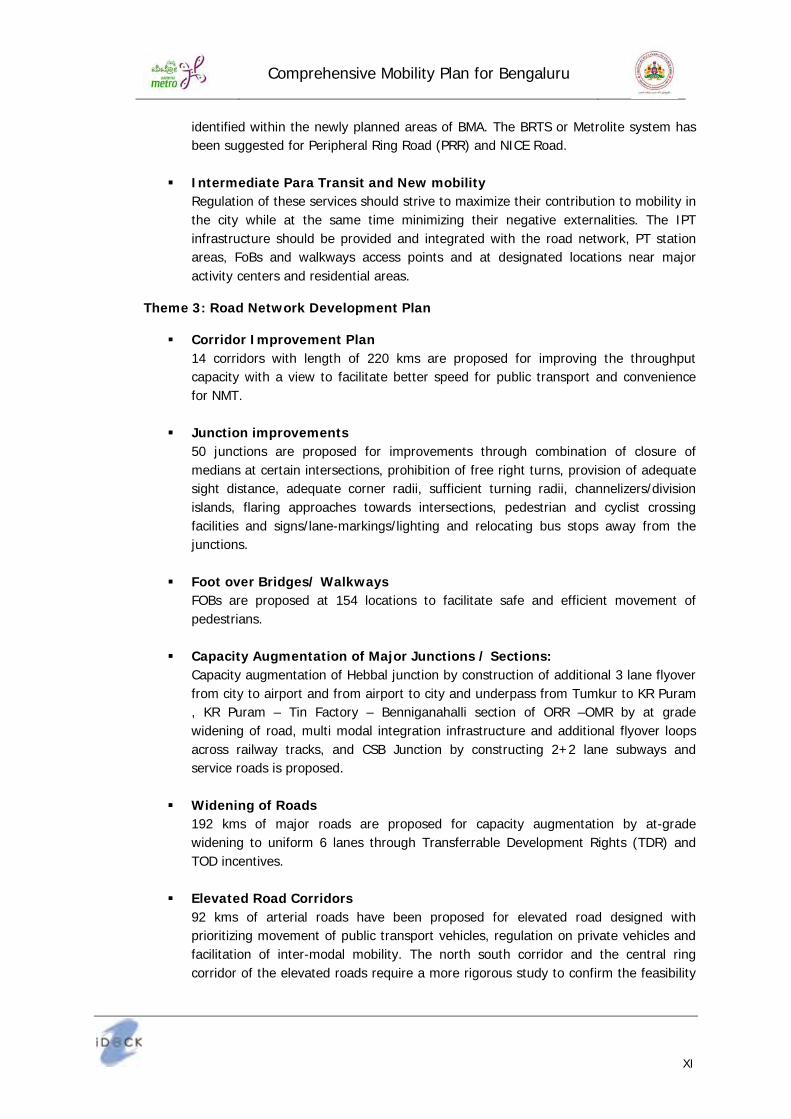
In term ed iate Para Tran sit an d New m ob il ity Regulation of these services should strive to maximize their contribution to mobility in the city while at the same time minimizing their negative externalities. The IPT infrastructure should be provided and integrated with the road network, PT station areas, FoBs and walkways access points and at designated locations near major activity centers and residential areas.
Them e 3 : Road Netw ork Dev el opm en t Pl an
Corrid or Im prov em en t Pl an 14 corridors with length of 220 kms are proposed for improving the throughput capacity with a view to facilitate better speed for public transport and convenience for NMT.
J u n ction im prov em en ts 50 junctions are proposed for improvements through combination of closure of medians at certain intersections, prohibition of free right turns, provision of adequate sight distance, adequate corner radii, sufficient turning radii, channelizers/division islands, flaring approaches towards intersections, pedestrian and cyclist crossing facilities and signs/lane-markings/lighting and relocating bus stops away from the junctions.
Foot ov er Brid ges/ W al k w ay s FOBs are proposed at 154 locations to facilitate safe and efficient movement of pedestrians.
Capacity Au gm en tation of M aj or J u n ction s / Section s: Capacity augmentation of Hebbal junction by construction of additional 3 lane flyover from city to airport and from airport to city and underpass from Tumkur to KR Puram , KR Puram – Tin Factory – Benniganahalli section of ORR –OMR by at grade widening of road, multi modal integration infrastructure and additional flyover loops across railway tracks, and CSB Junction by constructing 2+ 2 lane subways and service roads is proposed.
W id en in g of Road s 192 kms of major roads are proposed for capacity augmentation by at-grade widening to uniform 6 lanes through Transferrable Development Rights (TDR) and TOD incentives.
El ev ated Road Corrid ors 92 kms of arterial roads have been proposed for elevated road designed with prioritizing movement of public transport vehicles, regulation on private vehicles and facilitation of inter-modal mobility. The north south corridor and the central ring corridor of the elevated roads require a more rigorous study to confirm the feasibility

Comprehensive Mobility Plan for Bengaluru
XII
with reference to alternate modes including metrolite (elevated) and impact on the traffic flow.
Peripheral Rin g Road Peripheral Ring Road of 78 km length and 80-meter width is proposed on the north-west periphery of the city with complementary connectivity to NICE Road on the south-east periphery and provision in the middle for BRTS or traction guided at-grade Metrolite. The entire road should be access-controlled, signal free, elevated U & right turns. In addition, the area of 2 km width on either side should be developed following TOD norms.
Park in g in f rastru ctu re Apart from refurbishing the existing off-street parking lots, development of 50 new parking lots within the core area is proposed.
Them e 4 : Non - M otoriz ed Tran sport Pl an
Footpath, Cy cl e Track an d Ten d er Su re Road s 974 kms of footpath are proposed to be constructed with 600 kms of cycle track and 103 kms of Tender Sure Roads.
Pu b l ic Bicy cl e Sharin g 550 hubs have been identified for public bicycle sharing.
Ped estrian on l y streets 8 streets having significantly pedestrian and commercial establishment are recommended to be declared as pedestrian only streets on Saturday, Sunday, other holidays and special days.
Them e 5 : M u l ti- M od al M ob il ity Pl an
El ev ated w al k w ay s con n ectin g pu b l ic tran sport station s Elevated walkways of 300 meter to 1500 meter are proposed at 10 locations to provide better connectivity between metro, railway and bus stations.
In ter- m od al In terchan ge H u b s 32 intermodal interchange stations have been proposed where intersection of two or more public transit corridors is envisaged
M u l ti- m od al m ob il ity f are sy stem National Common Mobility Card is proposed to be the primary mode of fare system of public transport operators, intermediate para-transit operators, and parking stations in the city
In ter- City M ob il ity A total of six intra and inter-state bus terminals are proposed on Tumkur Road, Mysore Road, Old Madras Road, Hosur Road, Bellary Road and Magadi Road so that intercity traffic will not get mixed with the city traffic. These terminals will cater to KSRTC as well as private busses plying from neighboring states. 85 Depots/terminals

Comprehensive Mobility Plan for Bengaluru
XIII
are proposed for extended BMTC bus operations and 4 existing terminals are proposed for redevelopment.
Them e 6 : Priv ate Tran sport M an agem en t Pl an
Proof of parking for vehicle ownership, congestion fee to mitigate negative externalities, strengthening PUC checks and penalties on polluting vehicles, insurance premium based on usage, enforcement norms for safety are major proposals for private transport management.
Them e 7 : Freight M ov em en t Pl an
High-volume freight deliveries & truck movements to market areas are to be restricted to night-time or off-peak hours. Eight freight logistic centers are proposed at locations close to intersections of PRR and NICE road with arterial roads of the city.
Them e 8 : Techn ol ogical M easu res
Smart signalling at intersections, Integrated Command Control Centre, adoption of CNG and electric for IPT vehicles and public transport buses respectively are technological measures suggested for better traffic management and reduction in CO2 emissions.
Them e 9 : Trav el Dem an d M an agem en t Pl an
The proposed TDM strategies are road space reallocation aiming to re-balance provision between private cars and other sustainable modes, road space rationing by restricting travel at certain times and places, car parking controls and pricing, parking strategies, flexi-time work schedules with employers to reduce congestion at peak times, workplace travel plans, introducing active trip reduction programs, and public education and awareness programs.
Them e 1 0 : Regu l atory M easu res
The proposed regulatory measures are permit conditions and number of permits for different mobility services, linking new registrations to self-owned or rented parking space, fare regulations, vehicle specifications for fuel consumption and emission levels, vehicle testing and maintenance standards, speed and other safety regulations, data sharing standards and integrated planning requirements- all comprise different tools available to the state regulator for providing access to safe and sustainable mobility for the maximum number of people.
Them e 1 1 : Gov ern an ce M easu res
The governance measures include strengthening of BMLTA as an Authority with statutory powers, enabling integration of the city bus services with the rail-based metro and suburban train networks for seamless transit connectivity and capacity building for data-driven decision making and integrated planning among transit agencies and the BMLTA are the recommended measures.

Comprehensive Mobility Plan for Bengaluru
XIV
Them e 1 2 : Fiscal M easu res
The proposed fiscal measures include dynamic pricing for infrastructure usage, cess on tax on fuel, linking motor vehicle tax to fuel efficiency, friendlier tax environment on inputs and revenues for public transport operators, annual renewal for vehicle registration that is linked to pollution emission and fuel efficiency, and value capture financing of public transport through transit oriented development measures, etc.
1 2 . Im pl em en tation Pl an
The implementation plan provides prioritization of proposed projects and various financial options to be looked at towards implementing the proposed projects. A proper Institutional Frame Work is of utmost importance for the successful implementation and monitoring of all the schemes. In this regard, an Institutional set up is also recommended.
1 3 . Prioritiz ation of Proj ects
The CMP shall be implemented in phases. The phasing of projects has been carried out on the basis of the city needs and readiness of the city for implementing the proposed projects. The phases are defined as follows:
Phase 1 indicates projects that would be taken up from 2020 to 2022 Phase 2 indicates projects that would be taken up from 2023 to 2027 Phase 3 indicates projects that would be taken up from 2028 to 2035
Accordingly, projects prioritized in phase 1, 2 and 3 proposals for Bangalore are shown in Tables below:
Phase 1 Proj ects an d Cost
SN Proj ects Un it Q u an tity Rates ( Rs in crore)
Total Cost ( Rs in crore)
1 Metro Rail Km 58 275 15,950
2 Sub-urban Rail - Shared Track Km 28 10 280
3 Sub-urban Rail - Dedicated Track Km 46 126 5,781
4 Bus priority corridors Km 54 5 270
5 Bus fleet (augmentation/replacement) Nos 4,250 0.7 3,000
6 Corridor improvements Km 50 30 1,500
7 Junction improvements Nos 51 10 510
8 Construction of FoBs Nos 50 2 100
9 Major Junction Capacity Augmentation Nos 3 600 1,800

Comprehensive Mobility Plan for Bengaluru
XV
10 Widening of Roads Km 50 100 5,000
11 Peripheral ring road (PRR) Km 20 154 3,080
12 Multimodal mobility fare system 25 25
13 Parking Refurbishment Nos 10 20 200
14 Parking infrastructure Nos 10 50 500
15 Construction of footpaths Km 200 2 400
16 Cycle track Km 50 1.5 75
17 Public bicycle sharing - hubs Nos 250 0.5 125
18 Elevated walkways Nos 5 10 50
19 Redevelopment of terminals Nos 2 35 70
20 Smart signalization Nos 29 5 145
21 Public education and awareness 5 5
22 Priced parking management Sq. Km 20 4 80
Total Phase 1 Project Cost 3 8 , 9 4 6
Phase 2 Proj ects an d Cost
S.No. Proj ects Un it Q u an tity Rates ( Rs in crore)
Total Cost ( Rs in crore)
1 Transit Oriented Development Km 160 100 16,000
2 Metro Rail Km 30 275 8,250
3 Metrolite Elevated Km 13 180 2,340
4 Sub-urban Rail - Dedicated Track Km 67 126 8,420
5 Bus priority corridors Km 95 5 475
6 Bus fleet (augmentation/replacement) Nos 6,350 0.83 5,250
7 Bus depots/terminals/charging infrastructure Nos 40 40 1,600
8 Corridor improvements Km 100 30 3,000
9 Construction of FoBs Nos 104 2 208
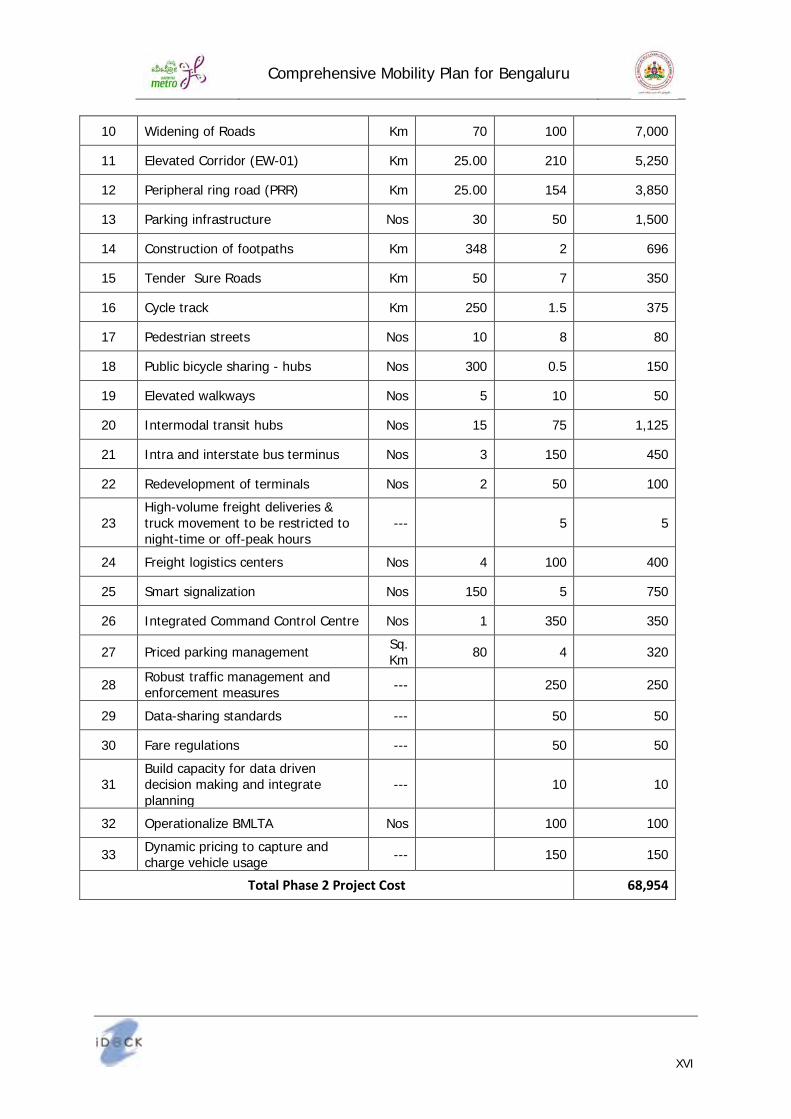
Comprehensive Mobility Plan for Bengaluru
XVI
10 Widening of Roads Km 70 100 7,000
11 Elevated Corridor (EW-01) Km 25.00 210 5,250
12 Peripheral ring road (PRR) Km 25.00 154 3,850
13 Parking infrastructure Nos 30 50 1,500
14 Construction of footpaths Km 348 2 696
15 Tender Sure Roads Km 50 7 350
16 Cycle track Km 250 1.5 375
17 Pedestrian streets Nos 10 8 80
18 Public bicycle sharing - hubs Nos 300 0.5 150
19 Elevated walkways Nos 5 10 50
20 Intermodal transit hubs Nos 15 75 1,125
21 Intra and interstate bus terminus Nos 3 150 450
22 Redevelopment of terminals Nos 2 50 100
23 High-volume freight deliveries & truck movement to be restricted to night-time or off-peak hours
--- 5 5
24 Freight logistics centers Nos 4 100 400
25 Smart signalization Nos 150 5 750
26 Integrated Command Control Centre Nos 1 350 350
27 Priced parking management Sq. Km 80 4 320
28 Robust traffic management and enforcement measures --- 250 250
29 Data-sharing standards --- 50 50
30 Fare regulations --- 50 50
31 Build capacity for data driven decision making and integrate planning
--- 10 10
32 Operationalize BMLTA Nos 100 100
33 Dynamic pricing to capture and charge vehicle usage --- 150 150
Total Phase 2 Project Cost 68,954
Comprehensive Mobility Plan for Bengaluru
XVII
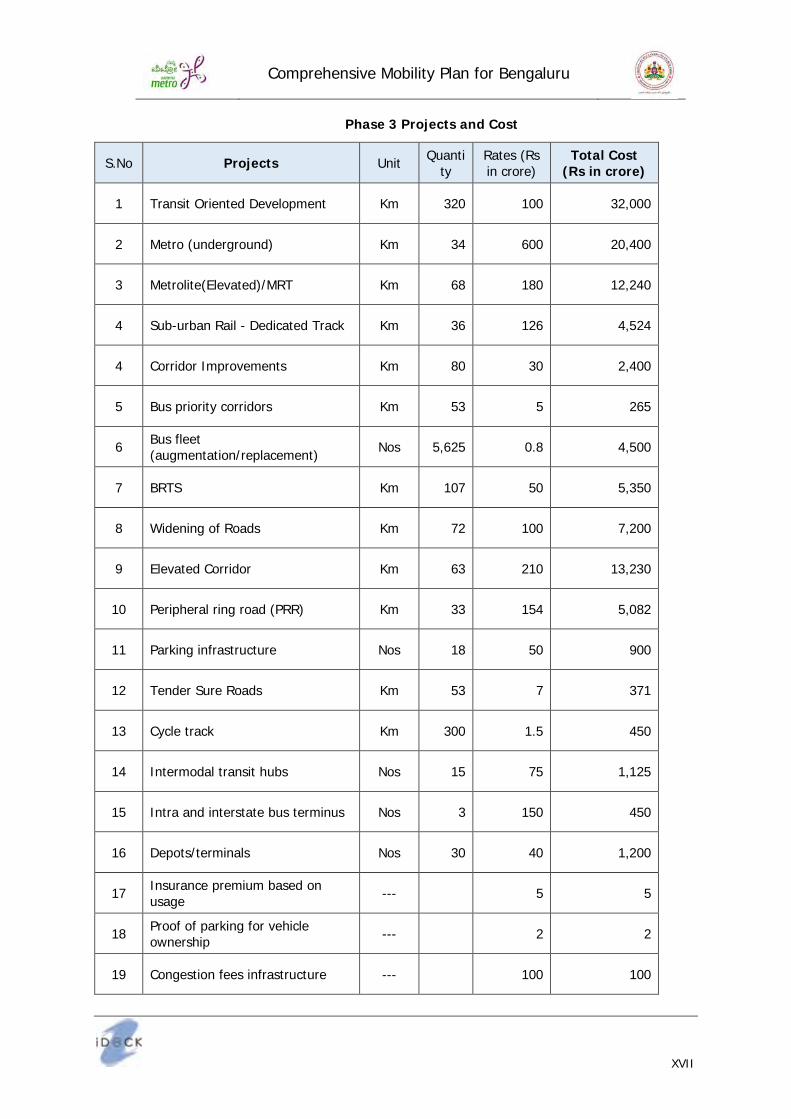
Phase 3 Proj ects an d Cost
S.No Proj ects Unit Quantity
Rates (Rs in crore)
Total Cost ( Rs in crore)
1 Transit Oriented Development Km 320 100 32,000
2 Metro (underground) Km 34 600 20,400
3 Metrolite(Elevated)/MRT Km 68 180 12,240
4 Sub-urban Rail - Dedicated Track Km 36 126 4,524
4 Corridor Improvements Km 80 30 2,400
5 Bus priority corridors Km 53 5 265
6 Bus fleet (augmentation/replacement) Nos 5,625 0.8 4,500
7 BRTS Km 107 50 5,350
8 Widening of Roads Km 72 100 7,200
9 Elevated Corridor Km 63 210 13,230
10 Peripheral ring road (PRR) Km 33 154 5,082
11 Parking infrastructure Nos 18 50 900
12 Tender Sure Roads Km 53 7 371
13 Cycle track Km 300 1.5 450
14 Intermodal transit hubs Nos 15 75 1,125
15 Intra and interstate bus terminus Nos 3 150 450
16 Depots/terminals Nos 30 40 1,200
17 Insurance premium based on usage --- 5 5
18 Proof of parking for vehicle ownership --- 2 2
19 Congestion fees infrastructure --- 100 100

Comprehensive Mobility Plan for Bengaluru
XVIII
20 Freight logistics centers Nos 4 80 320
21 ITS - demand management Nos 1 350 350
22 Adoption of CNG and electric for IPT vehicles and public transport buses respectively
Nos 6,500 1.5 9,750
23 Priced parking management Sq. Km 60 4 240
24
New vehicle & annual renewal for vehicle registration that is linked to pollution emission and fuel efficiency
--- 10 10
25
Institute friendlier tax environment on inputs and revenues for public transport operators
--- 2 2
Total Phase 3 Proj ect Cost 1 , 2 2 , 4 6 6
Total CM P Proj ect Cost
Proj ect Priority Cost ( Rs. Crores)
Phase-1 Projects 38,946
Phase-2 Projects 68,954
Phase-3 Projects 1,22,466
Total CM P Im pl em en tation Cost 2,30,366
1 4 . Fu n d in g of Proj ects
The mobility infrastructure being public good, the bulk of the investment funding has to come from fiscal resources. However, the same can be complemented by appropriate levies on commuters and residents in general based on their mobility choices and on economic transactions in Bengaluru having implications on the mobility.
Fiscal Resou rces from Government of Karnataka and Government of India. Ad d ition al Resou rce M ob il iz ation ( ARM ) from Land Value Capture, Parking Fee,
Congestion Fee, Revenues from advertisement on public transport infrastructure, Public-Private Partnership with Corporate for metro station naming rights and direct access, TOD at metro stations and depots and Roof-top solar power plants at metro stations and depots and cess of state taxes.
Lev y of cess an d su rcharge u n d er Section 1 8 A of K arn atak a Tow n an d Cou n try Pl an n in g ( K TCP) Act, 1 9 6 1 : Such levy to be imposed while granting permission for development of land and buildings should be used for augmenting water supply and sewer systems, construction of PRR and widening of arterial roads, establishing mass rapid transit systems and improving slums.
Ben gal u ru In f rastru ctu re Fu n d ( BIF) : The proceeds of levy under section 18-A of KTCP Act, and select ARM’s like land value capture through premium FAR,

Comprehensive Mobility Plan for Bengaluru
XIX
congestion fee, mobility related cess on state taxes should be managed through Bengaluru Infrastructure Fund to be maintained in Public Account of the State Government and managed by BMLTA. The funding from State Urban Transport Fund (SUTF) should complement BIF resources.
Fu n d in g f rom l ocal an d parastatal b od ies: Resou rces of m u n icipal b od y ( BBM P) , pl an n in g b od y ( BDA) an d parastatal b od ies ( BW SSB, BESCOM , BM RCL, BM TC, etc.) shou l d b e au gm en ted throu gh period ic rev ision s in their tax es, f ees an d u ser charges. Su ch resou rces com pl em en ted b y their b orrow in gs f rom the f in an cial m ark et shou l d b e pl ou ghed - in f or im pl em en tation of CM P.
Pu b l ic Priv ate Partn ership ( PPP) : Projects like development of bus terminals, logistic hubs, truck terminals, parking infrastructure, dedicated suburban rail and select metro rail projects, either as a whole or on unbundled asset class basis, etc. can be implemented through PPP.
Tran sf erab l e Dev el opm en t Rights ( TDR) : TDR scheme should be the primary mode for funding the lands required for widening of the roads. An electronic platform for trading of TDR should be established.
M on etiz ation of Lan d Assets: M on etiz ation of l an d assets of l ocal an d pl an n in g b od ies an d parastatal organ iz ation s shou l d b e tak en u p to m ob il iz e f u n d s f or their in f rastru ctu re proj ects.
1 5 . M on itorin g of CM P
An efficient monitoring system for the implementation of development in an integrated manner would be required for the success of the any implementation plan. It is therefore important to have one unified authority, which can stitch all the various agencies involved in the development of city, and ensure the overall objectives and development goals are met. Bengaluru Metropolitan Land Transport Authority (BMLTA) with legislative mandate and served by the existing Directorate of Land Transport (DULT) has been suggested as unified transport authority for regulation of the developments, operations, maintenance, monitoring, supervision and provision of urban transport with Bengaluru mobility area. A design and monitoring framework (DMF) has been suggested for monitoring of individual project.
This document should be treated as a dynamic document for meeting the evolving needs of the city. Its revision can be taken up as and when required, and on periodic basis not exceeding five years.

Comprehensive Mobility Plan for Bengaluru
XX
Pu b l ic Tran sport Corrid ors

Comprehensive Mobility Plan for Bengaluru
Page 1-1
1 INTRODUCTION
Bengaluru, an early cosmopolitan city in the country and the capital city of Karnataka, is one of the fastest growing cities in India. Bengaluru City is more prominently known as the ‘ Silicon Valley of India’ for spearheading the growth of Information and Communication Technology (ICT) based industries. Bengaluru has become a cosmopolitan city attracting people and business alike, within India and internationally and has become a symbol of India’s integration with the global economy.
Bengaluru is the fifth largest metropolis in India, with a total population of 8.5 Million (Bengaluru Urban Agglomeration) as per Census 2011. Bengaluru was the fastest-growing Indian metropolis after Delhi between 1991 and 2001, with a growth rate of 38% during the decade and now is the fastest growing metropolis between 2001 and 2011 with a growth rate of 49.4% .
Development of IT/ITES industries, large public sector undertakings like BEL, BEML and HAL, along with major hardware and garment industries has led to in-migration and rapid growth of the city.
Bengaluru, with its strong economic base, contributes about 36% 1 to Karnataka’s GSDP (2016-17). Bengaluru has the highest contribution in secondary and tertiary sector’s GSDP due to high concentration of major industries and infrastructure facilities. The Metropolis houses about 40% of urban population of Karnataka and has witnessed 49.4% growth in population during the decade 2001-2011, thus playing the role of a primate city in the State. In context of the State, the Population in the city of Bengaluru accounts for nearly 14.6% of the state’s population concentrated in only about 0.64% of the land area.
The number of registered vehicles has crossed 80 lakhs, an increase of 20 lakhs in the past 3 years. Various schemes to rid Bengaluru of its traffic problems are being considered but these are not being implemented in a coordinated manner.
The growing population, vehicle numbers and economic activities, have seriously aggravated the traffic problems in Bengaluru. The limited road space of Bengaluru is not able to handle the current traffic generated by the ever burgeoning population. Consequently, traffic in Bengaluru has become a scourge and is only worsening day by day. Network speeds are dropping at an alarming rate as capacity of the Junctions and links have exceeded the limits. These have contributed towards increasing traffic congestion, travel times and pollution levels.
In view of this, in order to have a coordinated effort to improve mobility in the city, a comprehensive mobility plan integrating various transport infrastructures addressing the needs of various segments of population becomes critically relevant.
The Directorate of Urban Land Transport (DULT), established in line with the recommendations of NUTP 2006, which is secretariat to BMLTA (UMTA for Bengaluru) along with BMRCL has prepared this CMP.
This document should be treated as a dynamic document for meeting the evolving needs of the city. Its revision can be taken up as and when required, and on periodic basis not exceeding five years.
1 Economic Survey of Karnataka 2018-19

Comprehensive Mobility Plan for Bengaluru
Page 1-2
1 .1 Su stain ab l e M ob il ity Prin cipl es
1 .1 .1 Access
Prin cipl e 1 : Accessib il ity
Accessibility to people, places, goods and services is important to the social and economic sustainability
Strategies to manage this is through
a) Demand Management: Reduce the need for travel while protecting social and economic needs for access through careful planning of urban form, promoting and adopting new communication technologies etc.
b) Diversifying Options: Improve accessibility through cost effective and efficient transportation options giving people more choices as to how they meet their access needs.
1 .1 .2 Peopl e an d Com m u n ities
Transportation systems are critical elements for a strong economy, which can also contribute directly to building community and enhancing quality of life. The mobility principles around people and community are:
Prin cipl e 2 : Eq u ity
Ensure basic transportation related needs of all people including women, the poor and the differently abled are met and treated with equal importance
Prin cipl e 3 : H eal th an d Saf ety
Transportation systems should be designed and operated in a way that protects the health (physical, mental and social well-being), safety of all people and enhances the quality of life
Prin cipl e 4 : Respon sib il ity
People and the community have a responsibility to act as stewards of the natural environment, undertaking to make sustainable choices with regard to personal movement and consumption of resources. The proposed systems should be in a position to encourage people towards this.
Prin cipl e 5 : In tegrated Pl an n in g
Pursue integrated approaches to planning
A strategy to manage this is through Urban and Transportation Planning:
a) Compact City form, through urban structure and land use policies and promote nodes with sustained mix of land use. This would reduce demand (especially for vehicular trips) by moving origins and destinations closer and also help reduce habitat destruction and loss of agricultural and recreational lands.

Comprehensive Mobility Plan for Bengaluru
Page 1-3
b) Priority for less polluting, lower impact modes of transportation in the design of urban areas and transportation systems. Pedestrian and cycling paths should be provided as attractive and safe alternatives to private transport
c) Integration of transport modes, whether for passengers or goods, in order to provide more efficient movement and to increase the availability of lower impact transportation options such as public transit; and
d) Protect historical sites and archaeological resources, reduce noise pollution with due consideration to aesthetics in the planning, design and construction of transportation systems
1 .1 .3 En v iron m en tal Q u al ity
Prin cipl e 6 : Pol l u tion Prev en tion
Transportation needs must be met without generating emissions that threaten public health, global climate, biological diversity or the integrity of essential ecological processes.
Prin cipl e 7 : Lan d an d Resou rce Use
Efficient use of land and other natural resources to be ensured to preserve environment and vital habitats
Strategies to manage Environmental Quality:
a) Encouraging use of less polluting transportation systems and modes b) Emphasize compact urban form in order to reduce habitat destruction and loss of
agricultural and recreational lands around urban areas c) Integrate recreational spaces with natural habitat existing to protect environment d) Reduce fossil fuel consumption and emissions through improved efficiency and demand
management e) Promote the use of alternative and renewable energy
1 .1 .4 Econ om ic Viab il ity
Prin cipl e 8 : Fu l l er cost accou n tin g
Fuller cost accounting to reflect the true social, economic and environmental costs, in order to ensure user pays their equitable share of costs
Strategies under consideration:
a) Identify and recognize public subsidies (hidden or otherwise) to all modes of transport and make transportation decisions accordingly;
b) Reflect the full social, economic and environmental costs (including long term costs) of each mode of transport in the assessment;
c) Ensure users pay share of all costs with due consideration to equity concerns; d) Promote research and development of innovative alternative technologies that improve
access and help protect the environment; and e) Emphasis on providing a wide range of transportation options

Comprehensive Mobility Plan for Bengaluru
Page 1-4
1 .2 Im pact of Region al / Nation al Fram ew ork
The Comprehensive Mobility Plans (CMP) need to be in cognizance with the national and regional frameworks and guidelines to enhance mobility, promote pedestrians and traffic safety. The existing national policy framework has been considered for framing the strategies for Bengaluru.
1 .2 .1 Nation al Fram ew ork
Comprehensive Mobility Plan for Bengaluru Metropolitan Area has been carried out in accordance with the National Urban Transport Policy Guidelines suggested by the Ministry of Housing and Urban Affairs (MoHUA). Accordingly, the focus is on the following:
1. Focus on the mobility of people rather than that of vehicles 2. Focus on improvement and promotion of Public Transport, NMVs and pedestrians as
important city transport modes 3. Focus on integrating Land use and Transport Planning 4. Recommend an urban transport strategy that is in line with the National Urban
Transport Policy (NUTP)
Thus, considering the overall traffic and transportation related perspectives, both regional and national level guidelines and approaches have been gaining momentum for promotion of sustainable urban transport framework for 30-year horizon period.
The other documents that have been referred to that provide frameworks, guidelines and macro-level action plans to achieve sustainable transportation and mobility in the City include:
NATIONAL MISSION ON SUSTAINABLE HABITAT
Under the National Action Plan for Climate Change, the National Mission on Sustainable Habitat has been launched to cover various aspects which inter alia include better urban planning and modal shift to public transport. Regarding Urban Transport, the ob j ectiv es of the Nation al M ission on Su stain ab l e H ab itat ( NM SH ) are “ To address the issue of mitigating climate change by taking appropriate action with respect to the transport sector such as evolving integrated land use and transportation plans, achieving a modal shift from private to public mode of transportation, encouraging the use of non-motorized transport, improving fuel efficiency, and encouraging use of alternate fuels, etc. To evolve strategies for adaptation in terms of realignment and relocation, design standards and planning for roads, rail and other infrastructure to cope with warming and climate change” .
Accordingly, NMSH postulated 8 principles for sustainable urban transport planning:
o Walk: Develop neighborhoods that promote walking. o Cycle: Prioritize cycle networks. o Connect: Create dense networks of streets and paths. o Transit: Support high quality transit. o Density, Diversity and Compactness: Optimize density and match transit capacity;
Create compact regions with short commutes.

Comprehensive Mobility Plan for Bengaluru
Page 1-5
o Shift: Shift from unsustainable mobility to sustainable modes by using technology, regulating road use, parking and fiscal measures.
o Urban Transport Fund: Institutionalise fiscal and funding mechanisms to ensure financial sustainability of investments in public transport and non-motorised transport.
o Impact Assessment: Evaluation and assessment measures to effectively measure impacts of urban transport policies and projects.
METRO RAIL POLICY 2017
Metro rail projects provide high capacity public transit and are capital intensive. It is in this context that the need for a policy on metro rail is necessary to ensure that such systems are proposed, appraised and decided upon in a comprehensive manner and implemented in the most sustainable manner from the social, economic and environmental perspectives.
The Union Cabinet approved the Metro Rail Policy in August 2017. The following are some of the salient features of the 2017 policy:
o Recognition of the fast-growing need for improvements in the public transport system in a large number of cities
o Evaluation of various options of Mass Rapid Transit Systems (MRTS), along with a comparative analysis of alternate modes of transport to be a vital part
o Metro Rail system is often considered the most suitable urban transport system due to high capacity and speed, along with comfort
o Comprehensive Mobility Plan (CMP) a pre-requisite for planning metro rail systems in any city
o Integration of suburban systems with the proposed metro rail o The Economic Internal Rate of Return (EIRR) of 14% and above essential requirement
for sanctioning of metro rail, since metro rail projects have significant economic and social benefits
o Feeder systems up to a catchment area of 5 km of each metro station, and last mile connectivity to be included in metro rail project proposals
o Increased focus on maximizing non-fare box revenue and revenue through commercial development at stations and allocated land
o Efforts to be made towards reducing costs of construction and operations, with the aim to standardize sub-systems and components
o Exploration of various PPP models and encouragement for all forms of PPP, whether for full provisioning or for unbundled components
o Appraisal by an independent agency as identified by the Ministry of Housing and Urban Affairs (MoHUA).
National Electric Mobility M ission Plan 2020 (NEMMP)
In 2013, Government of India introduced the National Electric Mobility Mission Plan 2020 to achieve National fuel security by promoting hybrid and electric vehicles in the country. Government aims to provide fiscal and monetary incentives to kick start this technology. The target is to achieve sales of 6 – 7 million in the hybrid and electric vehicles sector from 2020. Under the NEMMP, the Government has launched the Faster Adoption and Manufacturing of Electric (FAME) vehicles scheme. This scheme is expected to provide a major thrust towards early adoption of electric and hybrid vehicles.
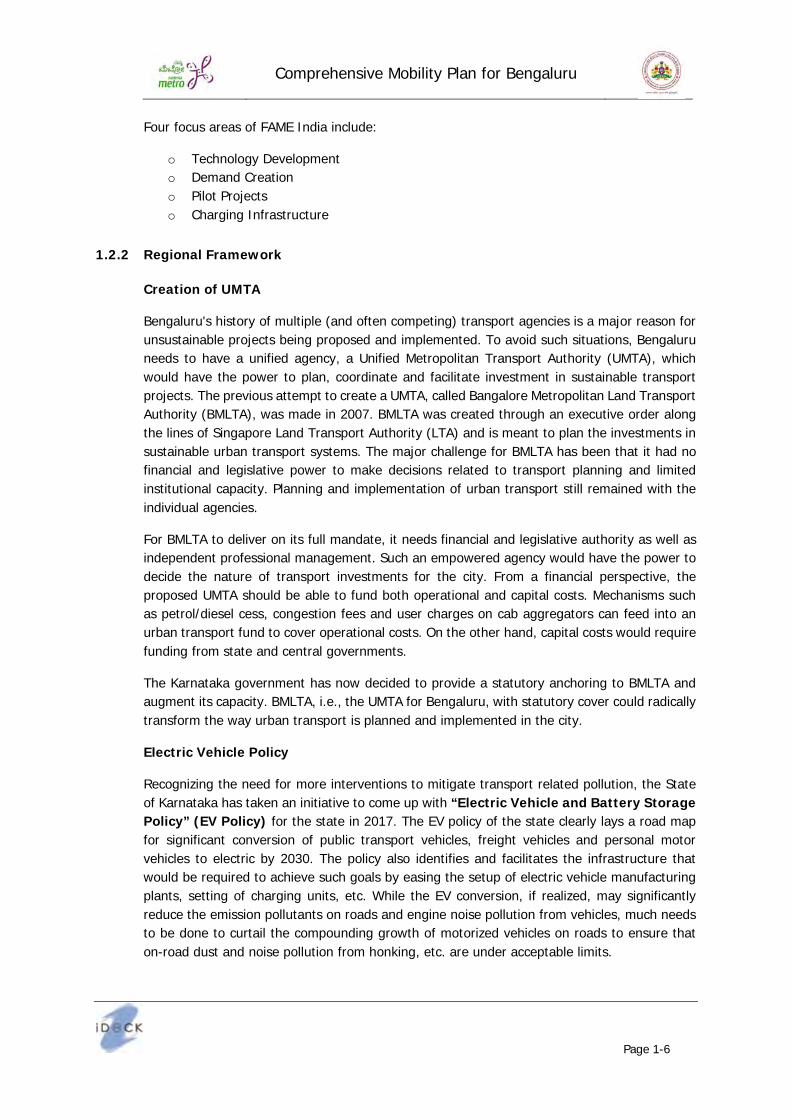
Comprehensive Mobility Plan for Bengaluru
Page 1-6
Four focus areas of FAME India include:
o Technology Development o Demand Creation o Pilot Projects o Charging Infrastructure
1 .2 .2 Region al Fram ew ork
Creation of UM TA
Bengaluru's history of multiple (and often competing) transport agencies is a major reason for unsustainable projects being proposed and implemented. To avoid such situations, Bengaluru needs to have a unified agency, a Unified Metropolitan Transport Authority (UMTA), which would have the power to plan, coordinate and facilitate investment in sustainable transport projects. The previous attempt to create a UMTA, called Bangalore Metropolitan Land Transport Authority (BMLTA), was made in 2007. BMLTA was created through an executive order along the lines of Singapore Land Transport Authority (LTA) and is meant to plan the investments in sustainable urban transport systems. The major challenge for BMLTA has been that it had no financial and legislative power to make decisions related to transport planning and limited institutional capacity. Planning and implementation of urban transport still remained with the individual agencies.
For BMLTA to deliver on its full mandate, it needs financial and legislative authority as well as independent professional management. Such an empowered agency would have the power to decide the nature of transport investments for the city. From a financial perspective, the proposed UMTA should be able to fund both operational and capital costs. Mechanisms such as petrol/diesel cess, congestion fees and user charges on cab aggregators can feed into an urban transport fund to cover operational costs. On the other hand, capital costs would require funding from state and central governments.
The Karnataka government has now decided to provide a statutory anchoring to BMLTA and augment its capacity. BMLTA, i.e., the UMTA for Bengaluru, with statutory cover could radically transform the way urban transport is planned and implemented in the city.
El ectric Vehicl e Pol icy
Recognizing the need for more interventions to mitigate transport related pollution, the State of Karnataka has taken an initiative to come up with “ El ectric Vehicl e an d Battery Storage Pol icy ” ( EV Pol icy ) for the state in 2017. The EV policy of the state clearly lays a road map for significant conversion of public transport vehicles, freight vehicles and personal motor vehicles to electric by 2030. The policy also identifies and facilitates the infrastructure that would be required to achieve such goals by easing the setup of electric vehicle manufacturing plants, setting of charging units, etc. While the EV conversion, if realized, may significantly reduce the emission pollutants on roads and engine noise pollution from vehicles, much needs to be done to curtail the compounding growth of motorized vehicles on roads to ensure that on-road dust and noise pollution from honking, etc. are under acceptable limits.
Comprehensive Mobility Plan for Bengaluru
Page 1-7
Data Sharin g Fram ew ork
Urban transport systems are seeing a profusion of data being generated that could significantly improve evidence-based urban and transport planning, and enable unobtrusive enforcement of regulations. Data sets include trip data of modern transport aggregator services and public transport services held with the respective companies or transit agencies; license, vehicle registration and permits data held with the Transport Department; road network, parking, land-use and plot level data held with the BBMP and BDA; traffic violations and accidents data with the BTP. Bringing together these data sets currently held in silos by various public and private agencies, as well as opening up anonymized transport data to the public, can promote integrated mobility planning as well as innovation for the development of better commuter services. Citiz en Aw aren ess Program s
In addition to promoting sustainable infrastructure in cities, one of the directives of the government of Karnataka is to create greater awareness among public on choices of mode they can opt for commuting (like use of public transport, carpooling, cycling, use of electric vehicles, etc.) and carbon footprints they leave when using different commuting modes, which in the long-term are necessary to bring about behavioural changes in commuters.
1 .3 Nation al Urb an Tran sportation Pol icy ( NUTP)
There is an urgent need to conserve energy and land, control pollution and ‘ greenhouse gas emissions’, and to alleviate poverty. Urban transport (UT) is a significant cause and also a solution to these issues. The growth story of Urban India is highly depended on planned urban development and sustainable urban mobility solutions. Cities are important as they contribute most to the ‘ gross domestic product’ (GDP) of a country. By 2030 this figure is estimated to grow to about 70% . Urban Transport is a key urban service that imparts efficiency to the city by providing mobility to the workforce and enables them to work at their productive best. Considering this, planning and management of UT services and infrastructure require immediate attention. The vision of NUTP is:
To recognize that people, occupy center-stage in our cities and all plans would be for their common benefit and well-being;
To make our cities the most livable in the world and enable them to become the “ engines of economic growth” that power India’s development in the 21st century;
To allow our cities to evolve into an urban form that is best suited for the unique geography of their locations and is best placed to support the main social and economic activities that take place in the city; and
To encourage growth of urban transport along low carbon path
NUTP suggests and encourages plan the urban transportation system for the people rather than vehicles by providing sustainable mobility and accessibility to all citizens to jobs, education, social services and recreation at affordable cost and within reasonable time. The Objectives of NUTP include:
Integrating urban transportation in to urban/ land-use planning for effectiveness and efficient one of the transportation system

Comprehensive Mobility Plan for Bengaluru
Page 1-8
Proposed transportation system to focus on moving people than vehicles through more equitable allocation of road space
Integrated Public Transport to cover the entire city for providing safe, seamless, user friendly, reliable service to the people
Priority to non-motorized transport as Walk and cycle Leveraging technology through adoption of Intelligent Transport Systems for an efficient
traffic management Incorporate adequate measures for improved road safety and trauma response system Establishing institutional mechanisms for enhanced coordination in the planning and
management of transport systems including establishing UMTA Building capacity (institutional and manpower) to plan for sustainable urban transport and
establishing knowledge management system
With this in the backdrop, the study has been undertaken and progressed.
1 .4 Del in eation of Pl an n in g Area
The study area includes the Bengaluru Metropolitan Area (LPA area) i.e. 1294.00 Sq.km. (including part BMICAPA area – 79.14 Sq.km.) The development of Airport near Devanahalli and transport infrastructure development in the form of 6 lane access controlled road between Hebbal and Airport has triggered development around airport and near Devanahalli. To ensure planned development, BIAA-LPA has been established to oversee the development of the identified area. The BIAA-LPA study area reveals that most of the developments are in two administrative areas namely Jala Hobli and Kasba Hobli. Considering this and to account its impact on the city development part of BIAA-LPA area extending 227.85 Sq.km has been included in the planning area for CMP.
The study area for preparation of Comprehensive Mobility Plan is shown in Figure 1.1.
1 .5 Vision , M ission an d Ob j ectiv es of the M ob il ity Pl an
1 .5 .1 Vision : Ef f icien t an d Su stain ab l e Tran sportation f or Al l
The vision of the Comprehensive Mobility Plan for Bengaluru is to achieve " Efficient and Sustainable Transportation for All” , with a system that serves to help fulfil the economic and social needs of residents and visitors. The achievement of this vision is expected to help mitigate the most significant constraint to the city's role as one of the major economic engines for development of the state and the country.

Comprehensive Mobility Plan for Bengaluru
Page 1-9
Figu re 1 - 1 : CM P Stu d y Area
1 .5 .2 M ission : Bu il d a m u l ti- m od al tran sport sy stem f or eq u itab l e m ob il ity access an d m in im iz ed n egativ e ex tern al ities
Achieving efficient and sustainable transport for all requires comprehensive data-driven reforms to our existing urban mobility paradigm which favours inefficient and unsustainable modes of transport that provide personal mobility but negatively impact system-wide mobility. There is

Comprehensive Mobility Plan for Bengaluru
Page 1-10
a need to build a robust multi-modal transport system that provides options of high-quality, safe and integrated mobility for all users, regardless of income and gender. Further, it is necessary to reduce the negative externalities of the transport sector, by incentivizing sustainable modes of transport and investing in future-proof infrastructure. This mission statement may be further expressed in the form of the following three short-term and medium-term goals or objectives.
Goal 1: Increase mode share of public transport in meeting transport demand
Develop public transit system in conformity with the land use that is accessible, efficient and effective. Aim to increase the share of public transport in Bengaluru to at least 60% by 2031 and to 70% beyond that.
Goal 2: Regain road infrastructure as public good
Regaining road infrastructure as a public good, which non-excludable and non-rivalrous at all times, should be the primary goal of the comprehensive mobility plan for the city as the road infrastructure is currently skewed in favour of those using their private vehicles, with commuters who are dependent on more efficient and sustainable modes such as NMT and public transport getting excluded from the equitable use of roads and being subjected to the negative externalities imposed by excess private vehicle usage.
Goal 3: Reduce transport sector contribution to air pollution and GHG emissions
Reduce the negative externalities imposed by transportation, by regulating transport demand by way of congestion pricing, priced parking system, linking vehicle registration with pollution emission etc., investing in cleaner technologies and prioritizing more sustainable modes of transport.
Aim to reduce the contribution of the transport sector to air pollution and GHG emissions should be reduced by 30 per cent by 2025. By 2031, the target should be to reduce pollution levels by 50 per cent from 2019 levels.
1 .6 Rev iew of Av ail ab l e Resou rces
Earl ier Stu d ies
To match with the master plan efforts, comprehensive traffic and transportation plans were prepared to ensure and incorporate road development proposals in line with the population and development projections in Bengaluru City. Below are the major studies conducted earlier in the city.
Comprehensive Traffic and Transportation Plan for Bengaluru City, RITES, 2011 Comprehensive Traffic and Transportation Study for Bengaluru Metropolitan Region, WSA,
2018 Transport Demand Forecast Study and Identification of Phase-III Corridors of Bengaluru
Metro, RITES, 2016 DPR for Implementation of Bengaluru Suburban Rail System, RITES, 2016 Revision of Master Plan 2031 for Bengaluru, BDA Sustainable Transport measures for livable Bengaluru (IISc 2018)

Comprehensive Mobility Plan for Bengaluru
Page 1-11
The Urban Commute by CSE 2018 Parking Policy for Clean Air and Livable Cities (CSE 2016) Sustainable Practices in Other Countries
Com prehen siv e Traf f ic an d Tran sportation Pl an f or Ben gal u ru City ( 2 0 1 1 )
The comprehensive transportation study was undertaken by KUIDFC to prepare development plan for the traffic and transportation plan for the Bengaluru City. The Vision of the CTTP was to have efficient, people friendly transport system with minimum travel time and maximum safety and comfort. Elaborate study of travel demand in the city and travel pattern has been used to develop robust multi-modal transportation system for meeting travel needs of the city’s population. The major outcome of the study is identification of projects proposals for implementation to address the transportation needs for the short term, medium term and long term.
• Identification of network for the development of mass transport system covering the major corridors of movement in the City and interchange facilities with other modes of transport
• Identify network for development of medium level mass transport system such as BRT to cover the areas beyond the Mass Transit network and act as second level Public Transportation System
• Land use adjustments and densification of corridors along mass transport corridors where possible to best utilize the transportation system as catalyst for development
• Extension of commuter rail system up to the BMRDA’s New Townships & beyond up to Tumkur, Hosur etc. to act as sub-urban services.
• Providing transport hubs for Interstate passenger and freight traffic near the junctions of Peripheral Ring Road with important radials such as; the National Highways and other heavily loaded roads.
• Transport integration of various modes. • Strengthening of existing institutions dealing with various aspects of urban transport
and formation of a unified transport authority for inter-agency coordination.
Com prehen siv e Traf f ic an d Tran sportation Stu d y f or Ben gal u ru M etropol itan Region ( 2 0 1 8 )
The Comprehensive Traffic and Transportation Study was undertaken by BMRDA by extending the study area to areas beyond the City and included satellite towns around the City. The vision of the CTTS was to prepare transportation master plan with an aim to provide an efficient transportation system catering to the needs of population in the BMR region. The major outcome of the study is identification of projects proposals for implementation to address the needs for long term, medium term and short term.
Long Term Proposals
• Development of Multi-Modal Public Transport System • Development of 341km of Mass transit corridors covering the major corridors of
movement in the City and interchange facilities with other modes of transport • Development of 231km of dedicated high capacity BRTS corridors to cover the areas
beyond the Mass Transit network and act as second level Public Transportation System • Development of intermodal stations for better integration

Comprehensive Mobility Plan for Bengaluru
Page 1-12
• Land use adjustments and densification of corridors along mass transport corridors where possible to best utilize the transportation system as catalyst for development
• Extension of commuter rail system up to the BMRDA’s New Townships & beyond up to Tumkur, Hosur etc.to act as sub-urban services.
• Providing transport hubs for Interstate passenger and freight traffic near the junctions of Peripheral Ring Road with important radials such as; the National Highways and other heavily loaded roads.
• Transport integration of various modes. • Strengthening of existing institutions dealing with various aspects of urban transport
and formation of a unified transport authority for inter-agency coordination. • Road Network Improvement Proposals
Development of New Roads totaling a length of about 515km Development of Missing Links totaling to about 530km Augmentation of capacity of existing roads
Tran sport Dem an d Forecast Stu d y an d Id en tif ication of Phase- III Corrid ors of Ben gal u ru M etro
Transport Demand Forecast Study and Identification of Phase III Corridors of Bengaluru Metro was undertaken by Bengaluru Metro Rail Corporation Limited (BMRCL) to extend the metro system in Phase-III for the areas not covered by Phase-I & II and interconnect the metro system network.
The study area includes the Bengaluru Metropolitan Area (BMA area) i.e. 1306.1 Sqkm. (including part BMICAPA area – 65.31 Sqkm.) and adjoining areas around Bengaluru International Airport Area Local Planning Authority (BIAA-LPA). Adjoining BIAA-LPA area has been included in the study area as public transport corridors are connecting Bengaluru International Airport and some of the localities where proposed development have been listed out in BIAA-LPA Master Plan. Horizon year for the study will be 2041. The effect of traffic coming from outside Bengaluru and using Bengaluru’s transport system shall also be taken into account. The major outcome of the study includes:
• Transport Demand Forecast for Phase I & II Corridors of Bengaluru Metro • Development of Mass Transport Networks • Development of Alternative Mass Transport Networks • Evaluation of Alternative Mass Transport Networks • Transport Demand Forecast for Recommended Mass Transport Network
DPR f or Su b u rb an Rail Sy stem f or Ben gal u ru RITES
DPR for Suburban Rail System for Bengaluru was undertaken by Indian Railways.Considering the growing pressure on Bengaluru City and to provide impetus to (satellite) towns in the immediate neighbourhood, development of which would ease pressure on the Bengaluru city, a robust high capacity sub-urban rail system has been planned. Accordingly, following sub-urban services are proposed to be implemented in three phases. The proposed sub-urban rail system is expected to run services as below:
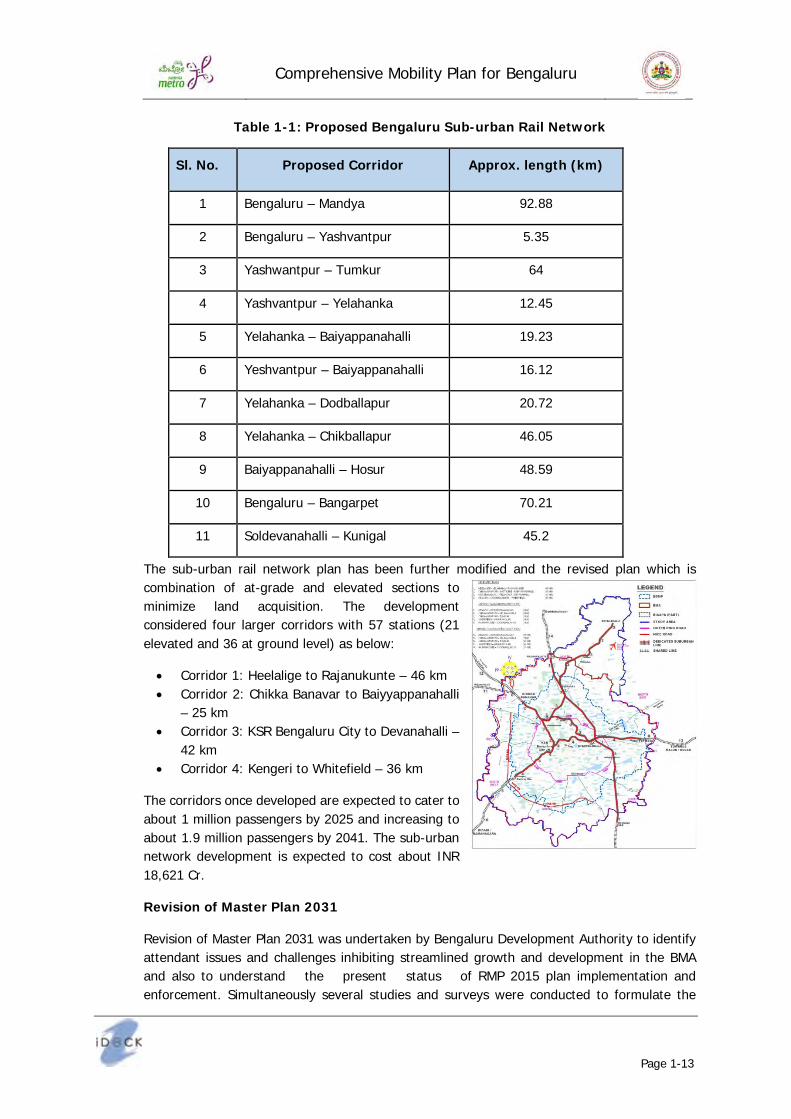
Comprehensive Mobility Plan for Bengaluru
Page 1-13
Tab l e 1 - 1 : Proposed Ben gal u ru Su b - u rb an Rail Netw ork
Sl . No. Proposed Corrid or Approx . l en gth ( k m )
1 Bengaluru – Mandya 92.88
2 Bengaluru – Yashvantpur 5.35
3 Yashwantpur – Tumkur 64
4 Yashvantpur – Yelahanka 12.45
5 Yelahanka – Baiyappanahalli 19.23
6 Yeshvantpur – Baiyappanahalli 16.12
7 Yelahanka – Dodballapur 20.72
8 Yelahanka – Chikballapur 46.05
9 Baiyappanahalli – Hosur 48.59
10 Bengaluru – Bangarpet 70.21
11 Soldevanahalli – Kunigal 45.2
The sub-urban rail network plan has been further modified and the revised plan which is combination of at-grade and elevated sections to minimize land acquisition. The development considered four larger corridors with 57 stations (21 elevated and 36 at ground level) as below:
• Corridor 1: Heelalige to Rajanukunte – 46 km • Corridor 2: Chikka Banavar to Baiyyappanahalli
– 25 km • Corridor 3: KSR Bengaluru City to Devanahalli –
42 km • Corridor 4: Kengeri to Whitefield – 36 km
The corridors once developed are expected to cater to about 1 million passengers by 2025 and increasing to about 1.9 million passengers by 2041. The sub-urban network development is expected to cost about INR 18,621 Cr.
Rev ision of M aster Pl an 2 0 3 1
Revision of Master Plan 2031 was undertaken by Bengaluru Development Authority to identify attendant issues and challenges inhibiting streamlined growth and development in the BMA and also to understand the present status of RMP 2015 plan implementation and enforcement. Simultaneously several studies and surveys were conducted to formulate the

Comprehensive Mobility Plan for Bengaluru
Page 1-14
baseline scenario. This preliminary analysis facilitated demographic projections and associated demand for land, infrastructure and services for the horizon year 2031, which in turn helped in arriving at the master plan scenarios of how the city should grow.
The BDA has endeavored to revise the Master Plan for Bengaluru for 2031 as a spatial-policy framework to guide the future growth of the city especially keeping the aspirations of the citizens.
RMP for Bengaluru-2031 evolved 3 alternative Growth Scenarios namely: 1. Containment Scenario 2. Corridor Driven Scenario 3. Differential Scenario
Following are the key considerations for the conceptualization of options and scenarios for the city:
• Existing Developments and Present Situation • Regional Growth Direction • The spatial differentiation and associated growth and development trends as noticed
in the different zones of the city: a) Core Area (inside ORR or the erstwhile BMP), b) Outer
• Core (ORR to BBMP Limits) and c) Transition Area (251 Villages in the BMA) • Population projections for the city for 2031 • In addition, the growth scenarios adopt following critical non-negotiables
- Circulation Network (Road Network and Commuter Rail System) with focus on public transport system
- Green network as consistent with the city’s topography - Promotion of Public Transport - Provision of Affordable Housing
Following are the major transport Projects and Programmes identified by Master Plan for implementation:
• Road Dev el opm en t Pl an : This includes following component: - Demarcation of Master Plan Roads (18m above only) on Ground - Upgradation/ Widening of Existing Roads - Development of New Links - Junction Improvement Programme and Development of Flyovers/ Railway Bridges - Preparation of Parking plans for Streets/ Areas
• Pu b l ic Tran sport Netw ork Dev el opm en t: This includes following component:
- Development of Commuter Rail Service - Development of Metro Network - Development of LRT/Mono Rail/ BRTS - Development of Intermodal Interchanges - Development ISBTs - Development of Bus Stations/ Terminals
• Dev el opm en t of Logistic Facil ities: This includes following components:
- Demarcation of Land for Logistic Facilities

Comprehensive Mobility Plan for Bengaluru
Page 1-15
- Development of Logistic Hubs/ Truck Terminals - Rejuvenation of Lakes and Streams - This includes following components - Prioritise Lakes for Rejuvenation - Demarcation of Lakes Extent
Su stain ab l e Tran sport M easu res f or Liv ab l e Ben gal u ru ( IISc 2 0 1 8 )
Sustainable Transport Measures for Livable Bengaluru was undertaken by Transportation Engineering Lab, Department of Civil Engineering, IISc, Bengaluru. The main objectives of the study are:
• Developing mitigation strategies for transportation sector which are aimed at reducing the GHG emissions, local pollutants and traffic congestion from a baseline condition
• Identifying transportation infrastructure that is vulnerable to climate change and assess the impacts of climate change on the transportation infrastructure
• Developing adaption strategies for the base year and horizon years 2030 and 2050 to evaluate the vulnerability, scope and extent, severity of each flood event caused by climate change to transportation sector.
• Improving the overall livability of Bengaluru
The Urb an Com m u te CSE 2 0 1 8
The report titled ‘ The Urban Commute and How, it Contributes to Pollution and Energy’, compiled by the Centre for Science and Environment (CSE) evaluated fourteen Indian cities [ Six megacities (Delhi, Mumbai, Kolkata, Chennai, Bengaluru and Hyderabad) and eight metropolitan cities (Bhopal, Lucknow, Jaipur, Chandigarh, Ahmedabad, Pune, Kochi and Vijayawada)] for emissions caused by urban commuting. The cities were ranked based on how they fare when it comes to pollution and energy consumption from urban commuting.
In the study, with an aggregate of toxic emissions from urban commuting practices, such as particulate matter and nitrogen oxides, the cities were ranked based on calculations of heat trapping (CO2). The study took two approaches to rank the cities — one based on overall emission and energy consumption and the other on per person trip emissions and energy consumption. Bengaluru ranked 12 among the 14 cities evaluated.
K ey Con cl u sion :
It is important to combine sustainable mobility strategies with clean vehicle technology and fuels.
Park in g Pol icy f or Cl ean Air an d Liv ab l e Cities ( CSE 2 0 1 6 )
Parking Policy for Clean Air and Livable Cities was undertaken by Centre for Science and Environment. This policy guidance is a primer that lays bare the essential elements of parking policy that can help to decongest as well as reduce pollution and fuel guzzling in cities.

Comprehensive Mobility Plan for Bengaluru
Page 1-16
Urban local bodies and urban development departments across Indian cities are now expected to change the focus of parking policy based on principles of restraint. But there is very little policy or public understanding of the key elements and principles that make parking policy and can reduce parking demand and car usage to cut congestion and pollution and ensure climate mitigation.
This document is based on emerging principles from global experiences and practices, literature review and field assessment of local initiatives in cities.
Su stain ab l e Practices in Other Cou n tries.
• “ Tran sport an d Cl im ate Chan ge – A rev iew ” b y Lee Chapm an talks about the how the technological and behavioral changes can reduce the fossil fuel consumption and reduction in greenhouse gas emissions.
• “ Estim ation of Bu s Stops Spacin g on Pu b l ic Tran sport Rou tes in K an o M etropol is Usin g M in ib u s Stop Tim e In terv al ” b y M u ttak a Na’ iy a Ib rahim an d Y u n u sa Ism a’ il – This paper talks about the inter stop distance between two bus stops and reviews about various inter stop distances used across the world.
• “ Issu es in su stain ab l e tran sportation ” b y Tod d Litm an an d Dav id Bu rw el l talks about the problems that arise due to misunderstanding of sustainable transportation system. Misunderstanding the concept of sustainability and setting wrong goals, objectives and improper decision-making process will not favour sustainable transport. This paper also highlights the important indicators that should be considered to assess the city’s level of sustainability.
• “ Tran sport an d cl im ate chan ge: Sim u l atin g the option s f or carb on red u ction in Lon d on ” b y Rob in H ick m an , Ol u Ashiru & Dav id Ban ister shows the development and simulation of various policies like low emission vehicles, alternative fuels, pricing regimes, public transport, walking and cycling, strategic and local urban planning, information and communication technologies, smarter choices, ecological driving and slower speeds, long distance travel substitution, freight transport and international air. The model helps in setting the level of application of the variable to achieve a desired CO2 emission target.
• “ Ev al u atin g Tran sportation Eq u ity : Gu id an ce f or In corporatin g Distrib u tion al Im pacts in Tran sportation Pl an n in g” b y Tod d Litm an explains the importance of equity in transportation system. This work shows various indicators of vertical and horizontal equity which can be evaluated to check if the city’s transport policies are equitable or not. This report is one of the important reports with respect to equity in transportation system.
1 .7 Stak ehol d er’ s Id en tif ication
Identifying the stakeholders and understanding their role in the process is important to achieve the overall goals of Comprehensive Mobility Planning. The Stakeholders involvement helps in understanding other various activities or projects carried out in the city and also helps in improving the planning process in terms of geographical coverage, policy integration, resource availability and overall legitimacy.

Comprehensive Mobility Plan for Bengaluru
Page 1-17
There are many stakeholders for urban transport Development and Implementation in Bengaluru.
Road Infrastructure
Bruhat Bengaluru Mahanagara Palike (BBMP), owns the road infrastructure within its jurisdiction covering about 800 sq. km. (i.e. BBMP limits) and are responsible for construction and maintenance of these roads, including Non-motorized transport infrastructure such as footpath, FoBs, etc.
Bengaluru Development Authority (BDA) is principal Planning Authority in Bengaluru which is responsible in preparing Master Plan for Bengaluru Metropolitan Area. BDA was established under Karnataka Town and Country Planning Act of 1961 (KTCPA). It also oversees planning and development of infrastructure, provision of development-related sites and services, the housing needs of underprivileged citizens in Bengaluru and is currently the city's largest land developer. Within Bengaluru (BMA), the PWD manages road network outside the purview of BBMP.
Public Works Department (PWD) is entrusted with the responsibility of maintenance of road works including the National Highways, State Highways and Major District roads in the state of Karnataka
Karnataka Road Development Corporation Limited (KRDCL) is a company under the Public Works, Ports & Inland Water Transport Department. This Company was established to promote road transport infrastructure such as Road Works, Bridges etc., and to improve road network construction, widening and strengthening of roads, construction of bridges, maintenance of roads etc.; KRDCL is also entrusted to take up projects on PPP mode such as BOT, BOOT, and BOLT etc.
Urban Mass Transport
Bengaluru Metro Rail Corporation Limited (BMRCL) is a Special Purpose Vehicle entrusted with the responsibility of planning, designing and implementation of Bengaluru Metro Rail Project in Bengaluru and is a joint venture of Government of India and Government of Karnataka.
BMRCL has completed the first phase of East-West and North-South metro corridor and is currently operational. Phase II is taken up for implementation. Planning of extension of Phase II and Phase III Metro Corridors is underway.
Bengaluru Metropolitan Transport Corporation (BMTC) is responsible for operations of bus services in the city. BMTC owns 6634 buses and caters to around 6143 schedules daily in the city. BMTC has 45 bus depots and 54 bus stations. BMTC recently started using ITS systems for better operational efficiency of fleet and also rolled out smart cards.
Regional Connectivity
Karnataka State Road Transport Corporation (KSRTC) caters to intra-city (through its subsidiary BMTC), interstate and intercity bus service for the state of Karnataka. KSRTC services covers 92% villages in Karnataka. KSRTC operates with a total fleet of 23829 buses (KSRTC 8348, NEKRTC-4343, NWKRTC-4716) and BMTC–6634.

Comprehensive Mobility Plan for Bengaluru
Page 1-18
It transports, on an average about 74.6 lakh passengers per day. It also operates to the neighboring states of Maharashtra, Andhra Pradesh, Telangana, Tamil Nadu, Puducherry, Goa and Kerala.
South Western Railway (SWR) was created by amalgamating the re-organized Hubli division from South Central Railway and Bengaluru& Mysore divisions from Southern Railway. It has been operational from 1st April 2003 having the headquarters at Hubli in the state of Karnataka. The Railway comprises of 03 divisions, viz. Hubli, Bengaluru& Mysore and primarily caters to Karnataka state with 84% of its jurisdiction located there.
Regulation and Licensing
Transport Department, is mainly responsible for regulation of the use of Motor Vehicles in the State and collection of tax on Motor Vehicles, Road Safety, Control of Air and Noise pollution in accordance with the provisions of the Motor Vehicles Act 1988 (Central Act 59 of 1988), Central Motor Vehicles Rules, 1989, The Karnataka Motor Vehicles Rules, 1989, The Karnataka Motor Vehicles Taxation Act 1957 (Karnataka Act 35 of 1957), The Karnataka Motor Vehicles Taxation Rules, 1957. Transport Department also houses Road Safety Authority.
Enforcement
Bengaluru Traffic Police (BTP) is responsible for traffic enforcement/management in the city of Bengaluru. BTP manages traffic at junctions (about 44 thousand) and roads (11 thousand kms) including High Density Corridors (HDC) in the city. Traffic police has established a technologically advanced Control center through which it manages accidents, traffic violations and other traffic related situations.
Road Safety
Road Safety Authority is established in Transport department and is the Lead Agency for implementation of all road safety measures in the state in co-ordination with all the concerned stake holding departments viz., Transport, Police, Public Works, Education, Health, Urban Development, National Highway Authority of India, Rural Development and Panchayat Raj, Excise, BBMP, Directorate of Municipal Administration etc.
Planning
Directorate of Urban Land Transport (DULT) is functioning under the Urban Development Department of Government of Karnataka. DULT is mandated to coordinate planning and implementation of all urban transport matters in the State. The directorate has been set up in 2007 by the State Government close on the heels of the National Urban Transport policy.
Freight Operators
Devaraj Urs Truck Terminal Limited is the principal government freight operators apart from Pvt. Operators
Other Stakeholders
• Residents / Commuters • Industry / Traders • Academic and Research Institutes

Comprehensive Mobility Plan for Bengaluru
Page 1-19
• Taxi Operators • KSPCB
1 .8 Approach an d M ethod ol ogy
‘ Comprehensive Mobility Plan’ envisages the Planning Area as a unified city with well-defined integrated multi-modal transportation system catering to all cross-sections of the society. The document is a comprehensive study entailing a series of physical interventions and policies to reinforce the regional connectivity and increase the mobility within the city.
Transportation being the backbone of all urban development activities, inadequately envisioned, or poorly delivered, can stunt growth for city and take capital investment to other cities. Therefore, the mobility plan is not only analytical, but also takes a long term view of the financial implications of the transportation mechanism on the city, including but not limited to the cost of congestion and quality of life and health of the citizens.
The following methodology has been derived to achieve the above mentioned objectives through a series of interrelated tasks in a comprehensive manner:
A brief methodology adopted for preparation of Comprehensive Mobility Plan for Bengaluru is presented below:

Comprehensive Mobility Plan for Bengaluru
Page 1-20
STAGE 1 : Def in in g NEED an d SCOPE f or Com prehen siv e M ob il ity Pl an f or Ben gal u ru Stage 1.1: Establishing Need, Defining Vision & Objectives for Bengaluru • Review of vision for Bengaluru
from Master Plan and Other Economic studies
• Defining Need for preparation of CMP
• Defining Vision (in coherence to the vision for Bengaluru from Master plan and other Economic plans)
• Objectives of CMP for Bengaluru
Stage 1.2: Delineation of Planning area • Reconnaissance of Bengaluru
Region • Delineation of planning area to
plan CMP
Stage 1.3: Defining Planning Horizon • Short term • Long term • Medium term
STAGE 2 : Ex istin g Situ ation An al y sis & Data Col l ection Stage 2.1: Review of existing population characteristics through secondary sources • Review of Regional Profile • Review of land use patterns,
characteristics of population, population density
• Review of Socio economic profile • Review of Energy and
Environment
Stage 2.2: Review of existing transport characteristics through secondary sources • Review of Road infrastructure • Assessment of public Transport
infrastructure • Review of IPT infrastructure • Review of Mass transit
infrastructure
Stage 2.3: Study of existing travel pattern and behaviour through surveys and data collected for revised master plan 2015 • Road network inventory • Classified turning volume
counts. • Speed and delay • Pedestrian count surveys • Parking surveys • Bus boarding alignment
survey • IPT survey • Cordon survey • Rail passenger survey
STAGE 3 : Def in in g Ben chm ark s Defining Benchmarks for various scenarios in order to come up with best scenario
STAGE 4 : Scen ario Dev el opm en t Stage 4.1: Development of Business as Usual scenario Stage 4.2: Development of Sustainable Urban
Transport Scenario STAGE 5 : Fou r Stage M od el l in g to test BAU an d other Su stain ab l e Urb an Tran sport Scen ario
STAGE 6 : Dev el opm en t Of Urb an M ob il ity Pl an Stage 6.1: Formulation of Plans
• Integrated land use and urban mobility plan • Public transport improvement plan • Road network development program • NMT facility improvement plan • Multimodal integration plan • Intermodal public transport plan • Traffic engineering and Management plan • Travel demand measures for Bengaluru
STAGE 7 : Form u l ation Im pl em en tation Program For CM P Stage 7.1: Formulation of REGULATORY MEASURES Stage 7.2: Formulation of INSTITUTIONAL STRATEGY Stage 7.3: Formulation of FISCAL STRATEGY

Comprehensive Mobility Plan for Bengaluru
Page 2-1
2 Rev iew of City Prof il e
2 .1 Brief Prof il e of the Stu d y Area
The Comprehensive Mobility Plan (CMP) is prepared for Bengaluru study area, which comprises Bangalore Metropolitan Area (LPA Area), part of BMICAPA Area and 2 Hoblis of BIAPPA Area (Jala Hobli and Kasba Hobli) which include the Airport and most of the proposed development of BIAAPA areas. The extent of the study area is 1594.99 Sq.km and houses a total population of 89.44 lakhs as per 2011 census and current population of 130 lakhs. Bangalore Metropolitan Area comprises the major part of the Bruhat Bangalore Mahanagara Palike (excluding area under BMICAPA) and 251 villages in the periphery of BBMP.
The city has experienced an unprecedented population growth translating into varied challenges of urbanisation and urban management in general and urban land management in particular.
City P lanning
In order to give direction to the growth of city, development authorities have prepared master plans in earlier years.
Tab l e 2 - 1 : H ighl ights of M aster Pl an s of BM A
Sl . No.
M aster Pl an ODP CDP 2 0 0 0 RCDP 2 0 1 1
RM P 2 0 1 5
1 Plan period 1961-1976 1984-2000 2000-2011 2005-2015
2 Projected Population (lakh) 19 70 70 88.0
3 LPA Extent (Sq.km) 500 1279 1279 1219.5*
4 Conurbation (Sq.km) 264 440 564 804.0*
5 Agriculture Zone 236 866 742 415.5
6 Existing Land use (Sq.km) 142 202 284 420.0
7 Existing Density (PPH) 116 144 143 138.0
8 Proposed Density PPH 72 159 125 110.0
* - Area under LPA of BDA as per RMP-2015 excluding the area under BMICAPA
Earlier this year, Revised Master Plan 2031 has been prepared for the Bangalore Metropolitan Area with an LPA extending 1294.0 Sq.km and submitted to the Govt. of Karnataka for approval and adaptation for implementation.

Comprehensive Mobility Plan for Bengaluru
Page 2-2
Popu l ation
Population of Bangalore Metropolitan Area has been growing at the rate of about 3% per annum since independence as shown in Tab l e 2 .2 . The BMA area, which had a population of about 17 Lakh in 1971, reached 85 lakhs in 2011. Bangalore was one of the fastest-growing Indian metropolises for the decade 1991–2011. It has an average density of about 148 people / hectare.
Tab l e 2 - 2 : Grow th of Popu l ation in Ban gal ore M etropol itan Area
Y ear Popu l ation ( Lak h)
Decad al Grow th ( % )
An n u al Grow th ( % )
1971 16.64 37.88 3.26 1981 29.22 75.56 5.79 1991 41.37 41.60 3.54 2001 57.01 37.81 3.26 2011 85.20 49.44 4.10 2018* 122.98
Source: Census of India 2011, * Estimated
As per Census 2011 data, the literacy rate of BMA area is 89.56% which is higher than national urban average of 85% and second highest for an Indian metropolis after Mumbai. The city's workforce structure is predominantly non-agrarian with only 6% of workforce being engaged in agriculture-related activities. Roughly, 10% of Bangalore's population lives in slums - a relatively low proportion when compared to other cities in the developing world.
BIAAPA which has been considered in the planning for CMP has picked up pace in development in the recent years. As on 2018, the estimated population in BIAPPA area is about 5.8lakhs. The historical population in areas under BIAPPA is presented in Tab l e 2 .3 .
Tab l e 2 - 3 : Popu l ation of BIAAPA
S.N. Y ears Popu l ation ( Lak h)
Decad al Grow th ( % )
An n u al Grow th
( % )
1 1991 3.28 - - 2 2001 4.05 19.01 2.13 3 2011 5.00 19.00 2.13 4 2018* 5.78 2.09
Source: Census of India, * Estimated

Comprehensive Mobility Plan for Bengaluru
Page 2-3
Em pl oy m en t
The workforce participation rate for BMA, as per Census, in 2011, is 43.9% , which has increased from33.4% in 1991, indicating 5% increase in over previous decade and can be primarily attributed to high growth in IT sector and in migration. As per Census 2011, the male workforce participation is at 61.87% , whereas female work participation is 24.42% . The female participation rate has increased from 11.88% in 1991 to 24.42% in 2011. Tab l e 2 .4 present the workers by gender for past three decades in BMA Region.
Tab l e 2 - 4 : Com parison of W ork Force in BM A
S.N. Y ear W ork ersM al e % of
M al e Fem al e % of
Fem al e Total % of Total
Popu l ation
1 1991 12,58,609 52.8 2,55,214 11.8 15,13,823 33.4 2 2001 18,77,261 57.7 5,33,701 18.1 24,10,962 38.9 3 2011 29,17,774 61.8 10,57,196 24.4 39,74,970 43.9 4 2018*
52,60,098
Source: RMP 2031, Bangalore * Estimated
2 .2 Rev iew of Ex istin g Tran sport Sy stem
2 .2 .1 Road Netw ork
Bangalore is endowed with a ring radial pattern of road network in the core area of the city. Bangalore's road network, spanning 14,000 km of the road network consists of ring roads, major roads (arterial roads, sub-arterial roads and other mobility corridors) and residential streets. However, there is no clear hierarchy of roads and this situation has resulted in low speeds, increased conflicts of traffic, etc. Though there is large network of roads in the city, the major road network comprised less than 20% of the total road network in the city.
Review of road network in the city revealed that there are quite a few missing links, which once developed would improve connectivity in the city. Some of them are:
• Missing links within the Intermediate Ring Road which include connecting CIL Main Road and Pottery Main Road, connecting Baiyappanahalli Main Road and Pottery Main Road and augmentation of Banashankari 50 feet road that connects to BMIC Expressway
• Inner Peripheral Ring Road, which is a newly identified ring in between ORR and PRR. The alignment is a combination of existing and new roads. It connects suburbs such as Yelahanka, Jakkur, RK Hegde Nagar, Horamavu, Kithaganur, Sonnenahalli, Kadugodi, Varthur, ChikkaBegur, Hulimavu, Kengeri, Ullal, Nagasandra and Chikbanavara. This is a critical link as it connects areas which will further densify in the coming years.
• Peripheral Ring Road (PRR) is critical to BMA, the master plan also proposes that the PRR be extended and developed complimenting existing NICE corridor.
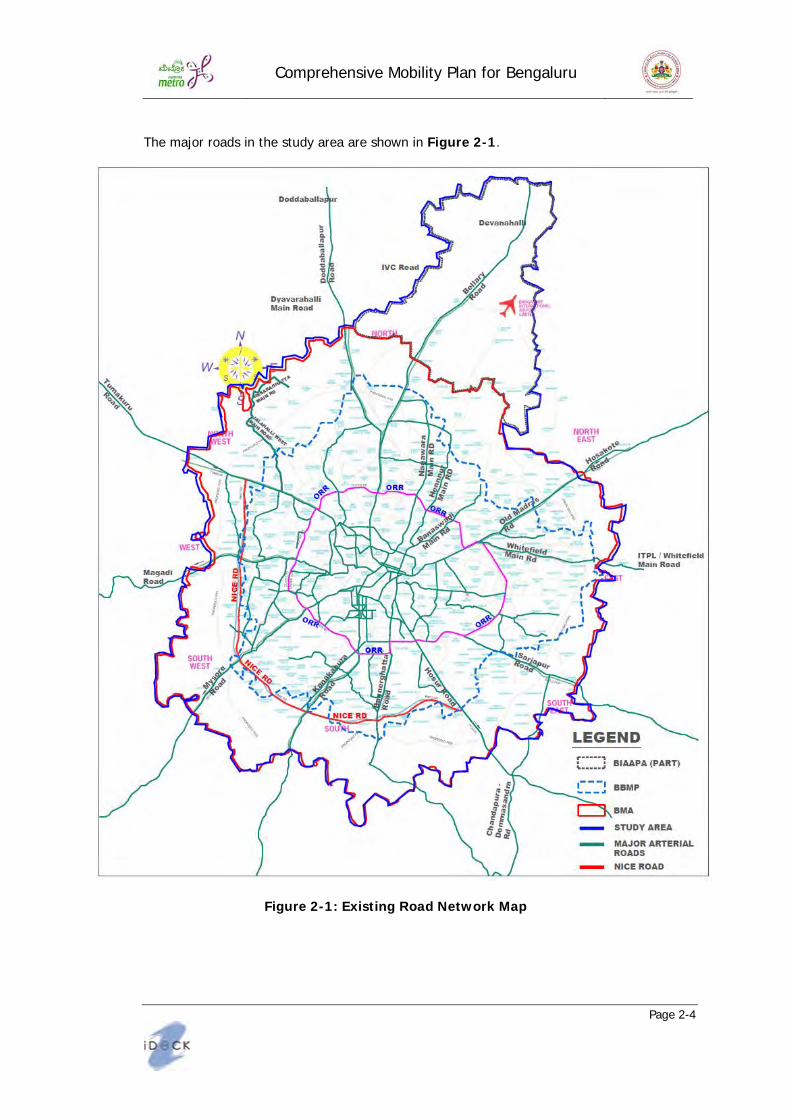
Comprehensive Mobility Plan for Bengaluru
Page 2-4
The major roads in the study area are shown in Figu re 2 - 1 .
Figu re 2 - 1 : Ex istin g Road Netw ork M ap

Comprehensive Mobility Plan for Bengaluru
Page 2-5
Intersections
There are an estimated 40,000 intersections in the city of which about 398 are signal controlled and approximately 600 intersections are being manually controlled during peak hours. Grade separators have been constructed at 59 intersections, which includes 38 flyovers and 21 underpasses, to provide uninterrupted movement for the through traffic along major roads. The balance intersections are uncontrolled which is one of the reasons for congestion and unsafe crossings. While most of these controlled intersections are on major corridors of movement, it may be safe to consider, an equal number of intersections on these major roads are left un-controlled which are causing congestion and resulted into reduced safety.
Bangalore Traffic Police have undertaken improvements at some of the intersections under BTrac program which is aimed at providing geometric improvements, standardization of signs etc. Under B-TRAC program, police are undertaking following:
Minor Junction Improvement Intelligent Transportation Systems Surveillance / Enforcement cameras Street Furniture Traffic Enforcement Cameras Education / Awareness & capacity building
Traffic Management Center has been setup by integrating various components of road marking, signages, Enforcement Cameras, Surveillance Cameras, and up gradation of Signals including Vehicle Actuation for effective and efficient management of traffic. As part of the ITS program, it is envisaged to install vehicle actuated, networked and adaptive traffic signals at about 440 intersections which will be monitored and controlled at Traffic Management Center, installation of traffic enforcement cameras at about 400 locations. Data collected at selected signalized junctions indicate that the signal operations are not optimal and are resulting in undue delays. Table 2-5 indicates percentage of green time wasted during the observation period at selected junction in central parts of the city.
Tab l e 2 - 5 Green Tim e W asted at Sign al iz ed J u n ction s
S.No J u n ction Nam e
Operatin g hou rs per d ay
( in M in )
Green tim e w asted
M in u tes Percen tage 1 Queens junction (MG Road) 930 281 30%
2 Cauvery Art & Craft junction (MG road) 960 179 19%
3 Trinity circle (MG road) 960 329 34%
4 Kamaraj junction 870 127 15%
5 Opera road junction 930 144 15%
6 Vellara junction (Hosur road) 240* 81 34%
7 Bhaskaran junction (Old Madras road) 900 510 57%
‘ * ’ surveyed time and not full day operational time.
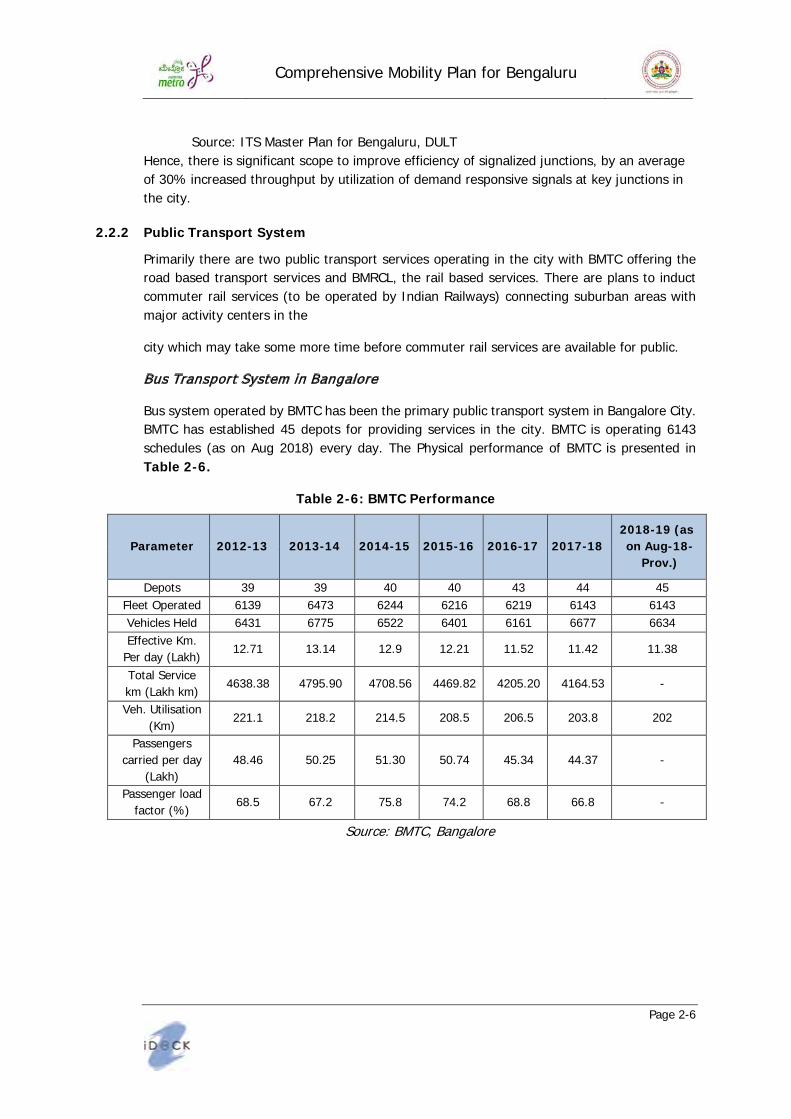
Comprehensive Mobility Plan for Bengaluru
Page 2-6
Source: ITS Master Plan for Bengaluru, DULT Hence, there is significant scope to improve efficiency of signalized junctions, by an average of 30% increased throughput by utilization of demand responsive signals at key junctions in the city.
2 .2 .2 Pu b l ic Tran sport Sy stem
Primarily there are two public transport services operating in the city with BMTC offering the road based transport services and BMRCL, the rail based services. There are plans to induct commuter rail services (to be operated by Indian Railways) connecting suburban areas with major activity centers in the
city which may take some more time before commuter rail services are available for public.
Bus Transport System in Bangalore
Bus system operated by BMTC has been the primary public transport system in Bangalore City. BMTC has established 45 depots for providing services in the city. BMTC is operating 6143 schedules (as on Aug 2018) every day. The Physical performance of BMTC is presented in Tab l e 2 - 6 .
Tab l e 2 - 6 : BM TC Perf orm an ce
Param eter 2 0 1 2 - 1 3 2 0 1 3 - 1 4 2 0 1 4 - 1 5 2 0 1 5 - 1 6 2 0 1 6 - 1 7 2 0 1 7 - 1 8 2 0 1 8 - 1 9 ( as on Au g- 1 8 -
Prov .)
Depots 39 39 40 40 43 44 45 Fleet Operated 6139 6473 6244 6216 6219 6143 6143 Vehicles Held 6431 6775 6522 6401 6161 6677 6634 Effective Km.
Per day (Lakh) 12.71 13.14 12.9 12.21 11.52 11.42 11.38
Total Service km (Lakh km) 4638.38 4795.90 4708.56 4469.82 4205.20 4164.53 -
Veh. Utilisation (Km) 221.1 218.2 214.5 208.5 206.5 203.8 202
Passengers carried per day
(Lakh) 48.46 50.25 51.30 50.74 45.34 44.37 -
Passenger load factor (% ) 68.5 67.2 75.8 74.2 68.8 66.8 -
Source: BMTC, Bangalore

Comprehensive Mobility Plan for Bengaluru
Page 2-7
The trend of increase in BMTC Bus Fleet Size over the years is shown in Figu re 2 - 2 .
Figu re 2 - 2 : Tren d in Bu s Fl eet Siz e
BMTC buses per lakh population are presented in Tab l e 2 - 7 . As per the Central Institute of Road Transport (CIRT) report Bus Transport Supply Index (buses per lakh of population) must be approximately 50. Though the fleet supply is adequate the efficiency of BMTC bus service is declining over the years.
Tab l e 2 - 7 : BM TC Bu ses Per Lak h Popu l ation - Chart
Y ear Popu l ation BM TC Bu s Fl eet Siz e
Bu ses Per Lak h Popu l ation
2001 61.9 2658 43 2011 90.44 5949 66 2018 122.98 6143 50
As can be seen from Figu re 2 .2 the fleet size was increasing rapidly from 2001 to 2011. However, off late the number of buses have not kept pace with the growing population and the buses per lakh population now stands at 50. Further the bus utilization has been reducing due to the ever rising private vehicular population in city, leading to congestion affecting the overall turnaround time. This has impacted the revenue generation.
Metro Network
Two corridors of Metro Rail are in operation in Bangalore. One is the East-West corridor and the other is the North-South corridor. The East-West Corridor starts at Baiyappanahalli (Reach 1) and ends at Mysore Road (Reach 2). The North-South Corridor starts at Nagasandra (Reach 3) and ends at Puttenahalli (Reach 4). The total length of the Metro Rail network under operation is 42.30 Km. Extensions on East-West Corridor, North-South Corridor & two new lines

Comprehensive Mobility Plan for Bengaluru
Page 2-8
Reach 5 & Reach 6 under Phase 2 (72.1km) are under implementation. Tab l e 2 - 7 presents reach wise lengths for Phase 1 and Phase 2.
Tab l e 2 - 8 : M etro Corrid ors al on g w ith the Stretches an d their Statu s
Sl . No. Corrid or Len gth
( k m ) Statu s
Phase 1
1 Baiyappanahalli to Mysore Road (East – West Corridor- Purple Line) (R1 & R2) 18.1 Operational
2 Nagasandra to Yelachenahalli (North- South Corridor- Green Line) (R3 & R4) 24.2 Operational
Phase 2
1 N-S Line Extension from Puttenahalli Cross to Anjanapura Township (R 4B) 6.29 Construction in
progress
2 N-S Line Extension from Hesarghatta Cross to BIEC (R3C) 3.77 Construction in progress
3 E-W Line Extension from Baiyappanahalli to ITPL- Whitefield (R 1A, R 1B) 15.5 Construction in
progress
4 E-W Line Extension from Mysore Road Terminal to Kengeri (R2A , R2B) 6.465 Construction in
progress
5 New N-S Line IIMB to Nagawara (R6) 21.25 Construction in progress
6 New E-W Line to R.V.Road to Bommasandra (R5) 18.82 Construction in progress
Average daily ridership in the two corridors under Phase 1 has increased to 4.05 lakhs in the year 2019. The metro was predominantly operating with 3 car trains which were running completely packed during the peak hours. BMRCL is now introducing 6 car trains in a phased manner and this move is expected to improve the capacity, and attract increased ridership.

Comprehensive Mobility Plan for Bengaluru
Page 2-9
Figu re 2 - 3 : Ban gal ore M etro Netw ork
Metro expansion under Phase 2 covering 72 km is under construction.
Sub-Urban Railway Network
Bangalore city has a fairly good rail network of about 62 km within the city. There are a few diesel operated passenger trains that connect to Bangalore City with Tumkur, Mysore and Kuppam (Andhra Pradesh). The trains run in the morning and return in the evening catering to commuters from suburban areas, satellite towns and neighboring cities. They are well

Comprehensive Mobility Plan for Bengaluru
Page 2-10
patronized and in the recent past the patronage has shown good growth rate. But their frequency and availability are not adequate to make this as primary / preferred mode of transportation.
The utilization of existing railway network in the city for running robust sub-urban rail services connecting the peripheral areas and settlements around Bangalore is being explored and a detailed study has been made by Indian Railways to introduce a commuter rail services including identifying the improvement requirement to the railway network.
2 .2 .3 Non - M otoriz ed Tran sport
The major components of non-motorized infrastructure include pedestrian and bi-cycle infrastructure.
Pedestrian Infrastructure Bicycle Network Public Bike Sharing
Footpath of narrow width is available on most of the road network; however, the use is limited on large parts due to encroachment, unscientific ramps/access to properties, disconnected network, uneven surface etc. The road widening projects taken up in the city have resulted in the reduction of footpath widths inconveniencing pedestrians. Despite all constraints, pedestrian movement is significant on all major roads and intersections in the city. Figure 2-4 shows pedestrian volumes during peak hours at few important junctions in the city.
Figu re 2 - 4 : Ped estrian Crossin g Data at Sel ected J u n ction s
In order to improve the situation, BBMP has taken up Tender Sure works in the Central Business District incorporating wider footpaths and proper accommodation for utilities. Under this

Comprehensive Mobility Plan for Bengaluru
Page 2-11
program, the city corporation is developing NMT network for the convenient and safe mobility of pedestrians and cyclists .
Public bike sharing (PBS) is operational in parts of the city and DULT is in the process of extending the public bike sharing system to the entire city. The PBS system is focused around the metro stations and the residential areas/ activity centers to help in providing last mile connectivity. As part of the program, docking/parking stations are developed and bicycles equipped with GPS are included for use by general public which can be booked through a mobile application.
In Phase 1, implementation of Cycle Parking Hubs and Cycle Tracks is proposed on MG Road, near Vidhanasoudha and in areas like Koramangala, HSR Layout, Indiranagar, Banaswadi, HRBR Layout, HBR Layout, Kacharkanahalli, etc. In all about 270 cycle parking hubs are being taken up, each located at a spacing of 300-500m for easy accessibility for the public. PBS is also operational around IT clusters like Whitefield area, Electronic city and Outer Ring Road corridor.
Source: Yulu
Figu re 2 - 5 : PBS Operation Cl u sters in Ben gal u ru .
Introduction of PBS system in the city has fueled usage of bicycles, despite non-existent network infrastructure for bicycling in the city. Currently more than 4,700 bicycles are operated with an average of 10,000 rides per day catered by PBS system. The average distance of trips on PBS is about 2km. An estimated 60% of trips on PBS happen for work place connectivity, 15% of the trips happen as first or last mile to metro & suburban rail and rest of the trips are leisure trips typically within residential areas. Figure 2-6 shows snapshot of ride pattern during typical weekday evening peak travel period in PBS operation areas.

Comprehensive Mobility Plan for Bengaluru
Page 2-12
Source: Yulu
Figu re 2 - 6 : PBS Rid e Pattern on a Ty pical W eek d ay .
#CycleToWork is another platform started in October 2018 that collects data from registered users who commute to their work place by bi-cycle. More than 990 users track their bicycle ride on a regular basis on this platform. Data published from this platform (shown in Figure 2-7) shows that the cumulative trip lengths made on bicycle has been steadily increasing over time, which is an indication of gaining popularity of bicycling in the city for commute purposes.
Source: Bicycle Mayor Bengaluru
Figu re 2 - 7 : Cu m u l ativ e Bicy cl in g Len gth Data f rom # Cy cl etoW ork

Comprehensive Mobility Plan for Bengaluru
Page 2-13
Hence, there is a clear indication that with better infrastructure for non-motorized vehicles like dedicated path, parking provision, etc., more trips in the city could be catered by non-polluting modes like walking and cycling.
2 .2 .4 In term ed iate Pu b l ic Tran sport
Auto rickshaws and taxis are offering the Intermediate Public Transport facility in the city. Off-late, taxi aggregators namely Ola, Uber etc. have expanded their services and fleet considerably. Being convenient and easily available and accessible, utilization of IPT has grown considerably in the last 3-5 years.
The city has an estimated 1.57 lakh taxis as of March 2018.
Source: Transport Department, Government of Karnataka
Figu re 2 - 8 : Grow th of Tax is in Ben gal u ru
Auto-rickshaws with their new found competitors (taxi aggregators) are generally providing the last mile connectivity near metro stations. However, there has not been any reduction in the number of vehicles in the city. Auto-rickshaws cater to a substantial 13% of total trips but constitute only 3% of total vehicular numbers.
With the availability of limited organized auto-rickshaw stands in the city areas, these are parked along the roads and near bus stops for picking up passengers there by occupying precious road space. This situation is resulting in avoidable congestion. The need for stands/ dedicated parking/waiting spaces across the city is very much there as they are an important component in the transportation system in the city.

Comprehensive Mobility Plan for Bengaluru
Page 2-14
2 .2 .5 Vehicl e Grow th in the City
The Bangalore Metropolitan Region has a total registered vehicular count of approximately 74 lakh vehicles, with two wheelers constituting the highest percentage of vehicular composition. Between 2008 and 2018, the number of vehicles registered in Bangalore has increased from 32.4 lakhs to 74.06 lakhs ( Figu re 2 - 9 ) . The v ehicl e ow n ership has in creased f rom 2 8 4 v ehicl es per thou san d person s in 2 0 0 1 to 4 1 9 v ehicl es per thou san d person s in 2 0 1 1 an d f u rther to an estim ated 6 4 0 in 2 0 1 8 . This mean the vehicle population is increasing at much higher rate compared to rate of growth in population.
Source: Annual Report 2017-2018, Transport Dept. GoK
Figu re 2 - 9 : Vehicu l ar Grow th in Ben gal u ru
Composition of Vehicle Categories in the City
Two-wheelers dominate the vehicular composition with a share of 69% in the total registered vehicles, followed by cars and jeeps at 19% .
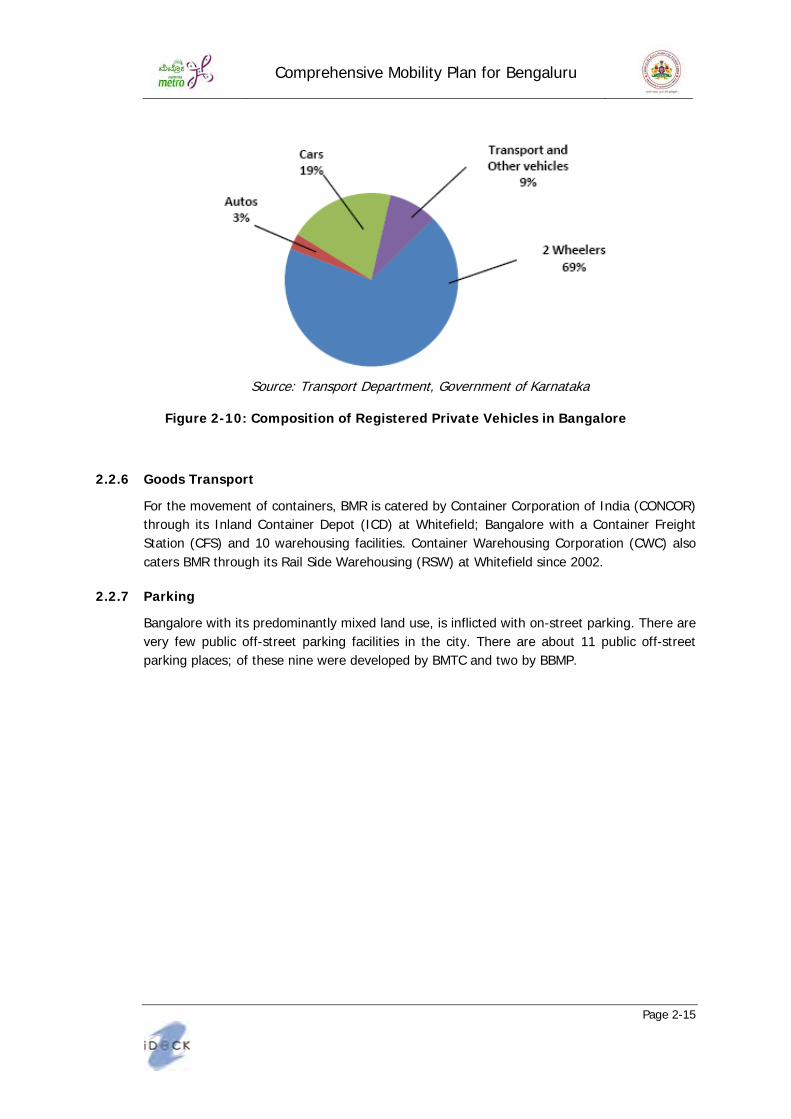
Comprehensive Mobility Plan for Bengaluru
Page 2-15
Source: Transport Department, Government of Karnataka
Figu re 2 - 1 0 : Com position of Registered Priv ate Vehicl es in Ban gal ore
2 .2 .6 Good s Tran sport
For the movement of containers, BMR is catered by Container Corporation of India (CONCOR) through its Inland Container Depot (ICD) at Whitefield; Bangalore with a Container Freight Station (CFS) and 10 warehousing facilities. Container Warehousing Corporation (CWC) also caters BMR through its Rail Side Warehousing (RSW) at Whitefield since 2002.
2 .2 .7 Park in g
Bangalore with its predominantly mixed land use, is inflicted with on-street parking. There are very few public off-street parking facilities in the city. There are about 11 public off-street parking places; of these nine were developed by BMTC and two by BBMP.

Comprehensive Mobility Plan for Bengaluru
Page 2-16
Figu re 2 - 1 1 : BM TC an d BBM P Park in g Spaces in Ban gal ore
Apart from these, there is one parking place developed on PPP basis adjacent to Garuda mall. Two parking complexes - one in Maharaja complex on KG road and another by BDA in Jayanagar have off-street parking spaces available for public.
In all the total capacity of off-street parking spaces available in the city for general public is about 1300 cars and 4000 two wheelers. However, the numbers do not include parking spaces provided in shopping malls.
A parking policy has been developed for Bangalore which restricts total demand as one of the means to increase Public Transport Ridership.

Comprehensive Mobility Plan for Bengaluru
Page 2-17
As part of the station planning, at few metro station locations, parking is made available which is essentially serving the metro users.
With on-street parking available in almost all roads and for free, the utilization of off-street parking spaces is limited except a few.
2 .2 .8 Road Accid en ts
Injuries and death associated with road crashes cause considerable economic loss to affected individuals, families and the nation as a whole. Road accident data pertaining to the Bangalore city for the period from 2007 to 2018 has been presented in Tab l e 2 - 9 .
Tab l e 2 - 9 : Road Accid en t Scen ario of Ban gal ore City
Y ear Fatal Non - Fatal Total 2007 957 7,469 8,426 2008 864 6,908 7,772 2009 737 6,138 6,875 2010 816 5,667 6,483 2011 727 5,297 6,024 2012 740 4,767 5,507 2013 737 4,493 5,230 2014 711 4,293 5,004 2015 714 4,114 4,828 2016 754 6,752 7,506 2017 609 4,455 5,064 2018 661 3,950 4,611 2019 744 3,944 4,688
Source: Bangalore Traffic Police
Significant number of fatalities from road accidents involves vulnerable road users like pedestrians and two-wheelers. Of the total road traffic fatalities in 2018, motorcyclists and pedestrians comprise of 46% and 40% respectively. Although Table 2-9 indicates declining trend in the number of accidents and fatalities, the absolute number of fatalities still is quite high and all possible measures need to be taken to arrest high number of fatalities happening from road accidents. Measures should include better and safer facilities for vulnerable road users; better enforcement of violations such as over speeding vehicles, drunken driving, and road rage; road user education, etc.

Comprehensive Mobility Plan for Bengaluru
Page 2-18
Figu re 2 - 1 2 : Tren d of Road Accid en ts in Ban gal ore
As can be seen from the Figu re 2 - 1 2 , the number of accidents has shown decreasing trend. While reduction in accidents is a welcome trend, the reason for the reduction is primarily attributed to interventions by Bangalore Traffic Police in enforcement and declining speeds due to congestion on the city roads (lower speeds lead to reduction in accidents is a well proven theory). The frequent presence of road humps, table tops, intersections, congestion lead to reduction in speeds in the city which is contributed significantly to safer roads in Bangalore.
Further, traffic police department is also undertaking a road safety program to identify accident prone areas, carryout detailed cause analysis and prepare improvement proposals to address the problem. As per the information available, Banaswadi, Madivala, Electronic City, Mico Layout, Whitefield, Peenya, RT Nagar, Hebbal, Yelahanka, Chikkajala and Devanahalli continue to be the most accident-prone areas in Bangalore.
2 .3 Rev iew of En ergy an d En v iron m en t
Transport sector has been identified as one of the main contributors to air pollution in cities. Contribution of automobiles in total air pollution in Indian cities is reported between 40–80 % [ Solanki HK, 2016] . Nearly 20% of passenger transport emission is by private automobiles although they only contribute 4% total passenger transport activity in Indian cities.
As per paper on “ Air quality, emissions and source contributions analysis for Greater Bengaluru region of India” (By Sarath K Guttikunda et. al., 2019) vehicle exhaust and on-road dust resuspension account for 56 % and 70 % of total PM2.5 and PM10 emissions respectively.
- 1, 000 2, 000 3, 000 4 , 000 5 , 000 6 , 000 7 , 000 8 , 000 9, 000
2007 2008 2009 2010 2011 2012 2013 2014 2015 2016 2017 2018
No.
of A
ccui
dent
sF atal N on- F atalTotal L inear ( Total)

Comprehensive Mobility Plan for Bengaluru
Page 2-19
Figu re 2 - 1 3 : Sou rce of PM 1 0 an d PM 2 .5 em ission s in Ban gal ore
The total Vehicle Kilometers Travelled (VKT) by the vehicles in the BMR region is about 31 million for the base year and is estimated to increase to about 48 million and 72 million for the years 2030 and 2050 respectively which is about 60% growth rate of VKT in 2050 from base year. The emissions estimated for the base year and future years are shown in Tab l e 2 - 1 0 .
Tab l e 2 - 1 0 : Total Em ission s
Pol l u tan t Em ission s in Ton / Y ear ( % chan ge w .r.t Base Y ear)
Base Y ear ( 2 0 0 8 )
2 0 3 0 2 0 5 0
CO 15743 18179 (15% ) 23567 (50% ) HC 7315 2930 (-60% ) 3841 (-47% ) NOx 6985 28864 (313% ) 22962 (229% ) CO2 695617 16782759 (2313% ) 17662478 (2439% ) PM 973 2009 (106% ) 1519 (56% )
Source: Verma A, Harsa V., Hemanthini AR. (2018), “ Sustainable Transport Measures for Livable Bengaluru” , Project Sub Report, IISc, Bangalore, India
Since Bangalore has the highest number of two-wheelers and second highest number of four wheelers in India, the fuel consumption is also very high. Bangalore stands second in fuel consumption in the country only behind Delhi. According to Indian Oil, on an average, the petrol consumption in Bangalore is about 70,000 KL a month.
However, it is long way before the city moves to alternate fuels in a large way. High utilisation vehicles as taxis, public transport modes are the most preferred to move to cleaner fuels. Steps in that direction are needed.

Comprehensive Mobility Plan for Bengaluru
Page 2-20
2 .4 Rev iew of Ex istin g Lan d Use Pattern
The Existing Land Use (ELU) is the next critical input in devising the future growth strategy of any city/town. The ELU maps show various current land uses at the specified and reasonable scale indicating residential, commercial, industrial, public & semi- public uses, recreational (parks & playgrounds), open spaces, vacant land, land under agriculture, water bodies, utilities & services facilities, circulation system, conservation areas, special areas, committed land uses, reservations and mixed land uses etc.
The Master Plan document (RMP-2031) has been reviewed for the existing land use in the BDA Planning area with reference to the proposed land use and as per RMP-2015. This analysis helps in understanding the development pattern in the city.
While the shape and structure of the transport network is dependent on land use, land use itself cannot happen as planned if the transport network is not provided. In other words, land use and the network strategy must go hand in hand.
The Existing Landuse Map (ELU) is presented in Figu re 2 - 1 4 , whereas the ELU Area Statement for LPA of BDA is given in Tab l e 2 - 1 1 .
Tab l e 2 - 1 1 : ELU Area Statem en t
Lan d Use Ex istin g Lan d u se - 2 0 1 5
Area ( Sq .k m ) Share ( % ) Residential 212.83 17.63% Commercial 38.27 3.17% Industrial 45.63 3.78% Public & Semi-public 64.82 5.37% Un-classified 42.32 3.51% Public Utilities 4.86 0.4% Parks & Open Spaces 20.67 1.71% Transport Communication 87.85 7.28% Vacant 305.28 25.29% Agriculture land 300.42 24.89% Quarry/Mining Sites 7.39 0.61% Forest 27.53 2.28% Water Bodies and Streams 49.1 4.07% Total LPA of BDA 1206. 97 100. 0%
Source: Revised Master Plan for Bangalore - 2031 (Draft): Volume-3
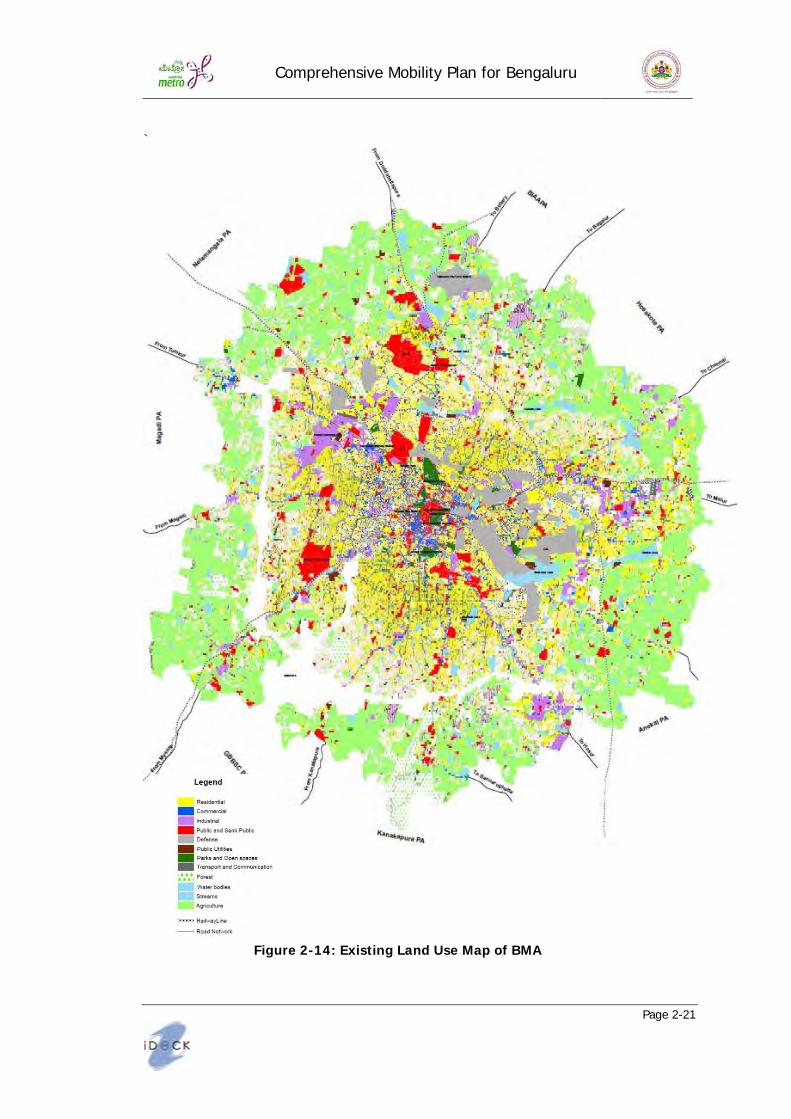
Comprehensive Mobility Plan for Bengaluru
Page 2-21
`
Figu re 2 - 1 4 : Ex istin g Lan d Use M ap of BM A

Comprehensive Mobility Plan for Bengaluru
Page 2-22
The Area allocated for transportation and communications falls very short of the requirements. The general norm is 20% but most cities achieve at least 15% and what Bangalore is bestowed with is only 7.3% . Densification shall be done as per the TOD policy. The peripheral areas will be able to imbibe development beyond 2041. The green areas especially in the North East (Arkavathi) and the South East and the South (Bannerghatta) are environmentally sensitive zones and will not be available for development. The thrust in growth hence will be essentially to the north and north-west. BIAPPA and the Airport zone at Devanahalli would be prime destinations for future growth.
2 .5 Traf f ic Su rv ey s
The compilation of data for modelling and demand forecasting is a massive task. This includes both primary data and secondary data. The purpose of conducting traffic surveys is to assess the traffic and transport characteristic of the study area (base line scenario) and provide inputs to developing the transport model. Focus of the surveys is on obtaining traffic volume data at select locations and major corridors.
The data collected from earlier studies like Revised Master Plan -2031, RITES Revised Final Report of Phase-III Corridors of Bangalore Metro 2016, Comprehensive Traffic and Transportation Study for Bangalore Metropolitan Region (BMR)-2018 and Parking Action Plan for Bangalorehave been used for the current study.
The survey particulars (type of survey, time period, duration and number of locations) are presented in Tab l e 2 - 1 2 .
Tab l e 2 - 1 2 : Su rv ey Particu l ars
Sl . No. Su rv ey s Du ration Location s
1 Screen Line Volume Count 16 hours 45
2 Turning Volume Counts at Junctions (Source: Revised Master Plan 2031 for Bangalore (Draft))
24 hours 14
3 Turning Volume Counts at Junctions (Source: CTTS for Bangalore Metropolitan Region )
12 hours 75
4 Outer Cordon Counts 24 hours 13 5 Roadside Interview Survey 24 hours 13
6 On-street Parking Survey 7 Areas (Core Bangalore)
7 Speed and Delay Survey Primary Arterial Roads 8 Household Interview Survey 10167 households 9 Road Inventory Survey Primary Arterial Roads 10 Goods Focal Point Survey 8

Comprehensive Mobility Plan for Bengaluru
Page 2-23
2 .5 .1 Cl assif ied Vol u m e Cou n t
Screen line Volume Count Survey
Three Screen lines have been identified for the study NSW, NSE, EW, thus making a total of 45 locations and 16-hour video graphical survey had been used to captured the traffic numbers. Primary traffic volume counts surveys on screen lines had been conducted to collect the traffic data for the urban transport demand model validation. The vehicles counted were converted to Passenger Car Units (PCU) by adopting equivalent PCUs. The PCUs corresponding to urban roads as per IRC: 106-1990 are used and the Peak Hour Traffic Volumes at screen Line location are presented in Tab l e 2 - 1 3 .
It is interesting to note that traffic flows are equally high on orbital roads such as the Chord Road and the outer ring road compared to some of the radial corridors. The very uniform spatial development of the city in nearly a circular growth pattern has led to this. In normal conditions this would have been an ideal situation for distribution of traffic, however the size of the city unfortunately has spared none and has congested all corridors (Radials and orbitals).

Comprehensive Mobility Plan for Bengaluru
Page 2-24
Tab l e 2 - 1 3 : Peak hou r Traf f ic v ol u m e at Screen l in e Location s
Sl . No. ID Location Nam e Direction Total Total
( PCU) Both
Direction ( Vehicl es)
BothDirection
( PCU)
1 NSW1 Old Outer Ring Road Towards Mysore Road 1459 1317
2734 2425
Towards Satellite town 1275 1108
2 NSW2 80 Feet Road (Dubasipalya
Road)Towards Mysore Rd 768 500
1129 800
Towards Dubasipalya 361 300
3NSW3 Bangalore University
Road Towards University 904 647
30542084
Towards Mysore rd 2150 1437
4 NSW4 Outer Ring Road Towards Mysore road 6139 4575
10129 7720
Towards Chandra layout 3990 3145
5 NSW5 Chord Road Towards Vijayanagar 3348 2371
8564 5961
Towards Mysore road 5216 3590
6NSW6 Hosahalli Main Road Towards Mysore road 4880 3035
66934189
Towards Chord road 1813 1154
7 NSW7 Tank Bund Road Towards Magadi Road 2142 1647
4905 3856
Towards Mysore Road 2763 2209 8 NSW8 Old Mysore Road Towards Khodays 9071 8189 11989 10699
Towards Okalipuram 2918 2510 9 NSW9 Puttaswamy Road and Mill
Corner Road Intersection Towards Sampige Road 3191 1877 4062 2502 Towards 5th Main Road 871 625
10 NSW10 5th Cross Road Towards Raj Kumar Road 5703 3796 8307 5576 Towards Sampige Road 2604 1780
11 NSW11 17th Cross Road (GP Rajarathnam Road)
Towards Raj Kumar Road 1487 1025 5096 3359 Towards Canara Union Road 3609 2334

Comprehensive Mobility Plan for Bengaluru
Page 2-25
Sl . No. ID Location Nam e Direction Total Total
( PCU) Both
Direction ( Vehicl es)
BothDirection
( PCU)
12 NSW12 Tumkur Road Towards Tumkur Road 4435 3663 10158 8019 Towards Chikkabanavara 5723 4356
13 NSW13 Outer Ring Road Towards ORR 1840 1399 4023 3099 Towards BEL Circle 2183 1700
14 NSW14 Jalahalli Road Towards Gangamma Circle 1689 1180 2637 2331 Towards Tumkur Road 948 1151
15 NSW15 Hesaragatta Main Road Towards Tumkur Road 897 783 1737 1472 Towards Chikkabanavara Post Office 840 689
16 EW1 Platform Road Towards Seshadri Road 1923 1806 3431 3057 Towards Malleshwaram 1508 1251
17 EW2 SC Road Towards Anand Rao Circle 2772 1806 4244 3128 Towards Malleshwaram circle 1472 1322
18 EW3 Hare Krishna Road Towards Race Course Road 3377 2267 5060 3608 Towards Sheshadripuram 1683 1341
19 EW4 Sankeys Road Towards Bellary road 6638 5145 10459 8473 Towards Baswesvara circle 3821 3328
20 EW5 Palace Road Towards Cunningham Road 3503 2827 5951 4821 Towards Bellary road 2448 1994
21 EW6 Jayamahal Road (Cantonment Junction)
Towards Thimmaiah road 7958 5351 9905 6824 Towards palace 1947 1473
22 EW7 Millers Road Towards Coles park 3112 2120 4472 3110 Towards Jayamahal road 1360 990
23 EW8 Tannery Road Towards Richards town 5983 3819 7715 4958 Towards St John’s Church Road 1732 1139

Comprehensive Mobility Plan for Bengaluru
Page 2-26
Sl . No. ID Location Nam e Direction Total Total
( PCU) Both
Direction ( Vehicl es)
BothDirection
( PCU)
24 EW9 Pottery Road Towards Clarence Road 2289 1650 2289 1650 25 EW10 Lazar Road Towards MM road 6022 4071 7919 5388
Towards Thomas road 1897 1317 26 EW11
Wheeler Road Flyover Towards Doddabanaswadi 2334 1684 5742 3906 Towards St John Church Road 3408 2222
27 EW12 Jeevanahalli Main Road
Towards PSK Naidu Road 1686 1007 2458 1529 Towards Park Road 772 522
28 EW13 Bayappanahalli Road Towards Old Madras Road 1527 885 1952 1124 Towards Doddabanaswadi Main road 425 239
29 EW14 NGEF Main Road Towards Satellite town 3293 2224 3525 2362 Towards Old Madras Road 232 138
30 EW15 Hoodi Main Road Towards Hoodi 2888 1850 3468 2276 Towards Devasandra 580 426
31 EW16 Kadugodi Flyover Towards White Field 1818 1594 2740 2445 Towards Sai Baba Ashram 922 851
32 NSE1 Yelahanka Towards NH-7 3113 2567 4629 3824 Towards Yelahanka 1516 1257
33 NSE2 NH-7 Towards Airport Road 3822 3456 8654 8023 Towards Hebbal 4832 4567
34 NSE3 Agrahara Towards Jakkur 696 552 1401 1113 Towards Sampige Halli 705 561
35 NSE4 Thanisandra Main Road Towards ORR 1870 1454 3593 2818 Towards K Narayanapura Main road 1723 1364
36 NSE5 Hennur- Bagalur Road Avallahalli Main Rd 1798 1332 4001 2972

Comprehensive Mobility Plan for Bengaluru
Page 2-27
Sl . No. ID Location Nam e Direction Total Total
( PCU) Both
Direction ( Vehicl es)
BothDirection
( PCU)
ORR Road 2203 1640 37 NSE6 Hormavu- Agara Road Hormavu road 348 278 813 629
ORR 465 351 38 NSE7 Hormavu Main Road Towards Outer Ring Road 1772 1195 3164 2192
Towards Ramamurthy Nagar road 1392 997 39 NSE8 Ramamurthy Nagar
Main Road Towards Outer Ring Road 3049 2199 5626 4002 Towards Ramamurthynagar Police Station 2577 1803
40 NSE9 Kagdaspura Main Road Towards Mahadevapura 1426 901 2359 1521 Towards C V Ramannagar 933 620
41 NSE10 ORR Dodannekundi Towards Maratha halli 5640 4607 9316 7823 Towards Dodannekundi 3676 3216
42 NSE11 SGR Dental college Road
Towards Outer ring road 1323 776 2371 1473 Towards Munnekollal main road 1048 697
43 NSE12 Panathur Main Road Towards outer ring road 1157 937 1816 1663Towards Varthur police station 659 726
44 NSE13 Gunjur Road Towards Sarjapur road 342 262 798 627 Towards Gunjur Palya 456 365
45 NSE14 Sarjapur Road Towards Outer ring road 1322 1057 2131 1740 Towards Ambedkar nagar 809 683
Source: Revised Master Plan 2031 for Bangalore (Draft)

Comprehensive Mobility Plan for Bengaluru
Page 2-28
Turning Volume Counts at Junctions
Classified Turning Volume Counts were carried out at 14 intersections. The peak hour PCUs observed indicate that the some of the critical junctions include Silk board junction, Hebbal junction and Hennur junction on the ring road. The peak hour traffic volumes and 24 hours traffic are given in Tab l e 2 - 1 4 .
Tab l e 2 - 1 4 : Total Vol u m e f or 2 4 hou rs an d peak hou r on su rv ey ed l ocation
Sl . No. J u n ction Nam e
Peak H ou r
Vol u m e Vehicl es
PCUs 2 4 - H ou r Vol u m e Vehicl es
PCUs Ty pe of J u n ction
1 Kundalahalli Junction 6280 5656 89599 80770 4 – Legged 2 Doddanakundi Junction 8728 7032 101324 91960 5 - Legged 3 Hennur Cross 16559 35852 200921 426855 5 – Legged 4 Nagawara Junction 14207 11686 167711 153725 4 – Legged 5 BEL Circle 10856 9195 126475 117178 4 – Legged 6 Gorgunte Palya 6067 6451 104271 111723 3 – Legged
7 Subhash Chandra bose Junction 9163 6899 148589 143204 4 – Legged
8 Sumanahalli Junction 11916 9640 153735 138470 4 – Legged 9 Devegowda Petrol Bunk 10415 8650 167096 139267 4 – Legged 10 Sarakki 8356 6760 103590 89102 4 – Legged 11 Silk Board Junction 22634 18180 323099 281521 4 – Legged
12 HSR Layout 27th Main Junction 15282 12773 172375 149113 3 – Legged
13 Tin Factory 15311 16919 242638 268529 4 – Legged- staggered
14 Hebbal Junction 23924 18154 273755 253689 3 – Legged Source: Revised Master Plan 2031 for Bangalore (Draft)
From Table 2-14, it can be observed that, nearly all the junctions are operating beyond capacity resulting in considerable delays. Absence of left slip roads is adding to the inefficiency in leading to longer queue lengths at the intersections.
Data of the Turning Volume Count from CTTS 2015 at 75 intersections where the peak hour traffic was exceeding 10000 PCUs is presented in Tab l e 2 - 1 5 .

Comprehensive Mobility Plan for Bengaluru
Page 2-29
Tab l e 2 - 1 5 : Tu rn in g Vol u m e Cou n t Location s ex ceed in g 1 0 0 0 0 PCUs
Location No Location Peak hou r
Peak H ou r Vol u m e In
Vehicl esIn
PCUs1 K R Circle 10.00 - 11.00 10885 12629 2 Maharanis College Intersection 10.00 - 11.00 9620 10582 3 Seshadri Road - 1st Main Road Intersection 10.00 - 11.00 11263 13427 4 Subanna Circle 10.00 - 11.00 14618 17264 5 Anand Rao Circle 10.00 - 11.00 19255 23686 6 Link next to Ayurvedic Hospital 10.00 - 11.00 9030 12708 7 Khoday's Circle 10.00 - 11.00 9381 10528 8 Platform Road - Old Mysore Road Intersection 10.00 - 11.00 16185 17907 9 BMTC Underpass Road Intersection 17.00 - 18.00 8264 10563 10 Karnataka Bhavan Intersection 18.00 - 19.00 16109 17852 11 Srirampura Intersection 18.00 - 19.00 15282 17156 12 Minsk Square 18.00 - 19.00 19079 20573 13 Infantry Road - Queen's Road Intersection 9.00 - 10.00 9492 10116 14 Balekundri Intersection 10.00 - 11.00 8568 10156 15 GPO Circle 10.00 - 11.00 10304 11649 16 Rajbhavan Road - Ali Askar Road Intersection 18.00 - 19.00 11760 12504 17 Millers Road - Sankey Road Intersection 10.00 - 11.00 12148 12764 18 Millers Road - Cunningham Road Intersection 9.00 - 10.00 10194 11281 19 High Grounds Police Station Intersection 9.00 - 10.00 10764 10699 20 Palace Road - Palace Cross Road Intersection 9.00 - 10.00 11296 12759 21 Sankey Road - Cunningham Road Intersection 9.00 - 10.00 14412 13890 22 Sankey Road - Kumarakrupa Road Intersection 18.00 - 19.00 13414 13754
23 Bellary Road - Railway Line Parallel Road Intersection 18.00 - 19.00 13088 13244
24 Bellary Road - Palace Cross Road Intersection (BDA Circle) 18.00 - 19.00 16287 16415
25 Swastik Circle 10.00 - 11.00 10623 1285226 Central Talkies 18.00 - 19.00 10156 12658 27 Nehru Nagar Park Intersection 18.00 - 19.00 10926 10858 28 Seshadripuram Police Station Intersection 18.00 - 19.00 10013 10778 29 Shivanada Circle 18.00 - 19.00 10841 12093 30 Gururaja Kalyana Mantapa Intersection 17.00 - 18.00 10111 10363 31 Trilite Junction 10.00 - 11.00 10062 11487 32 Race View Intersection 17.00 - 18.00 8955 11008 33 Jantadal Office Intersection 17.00 - 18.00 8905 10207 34 Basaveshwara Circle 10.00 - 11.00 21669 23329 35 Accountant General Office Intersection 10.00 - 11.00 11574 12114

Comprehensive Mobility Plan for Bengaluru
Page 2-30
Location No Location Peak hou r
Peak H ou r Vol u m e In
Vehicl esIn
PCUs 36 Mysore Bank Circle 17.00 - 18.00 10557 14105 37 K G Circle 17.00 - 18.00 11115 14354 38 Tank Bund Road - Dhanvantri Road Intersection 18.00 - 19.00 11483 13548 39 Tank Bund Road - Bashyam Road Intersection 17.00 - 18.00 12924 16579 40 Hudson Circle 18.00 - 19.00 19318 23320 41 Halasuru Gate Police Station Intersection 10.00 - 11.00 10537 14249 42 J C Road - Mission Road Intersection 10.00 - 11.00 11521 14908 43 Town Hall Intersection 10.00 - 11.00 12293 15295
44 J C Road - Arumugam Mudaliar Road Intersection (Bharat Circle) 10.00 - 11.00 16422 17565
45 Minerva Circle 10.00 - 11.00 17104 18165 46 Sajjan Rao Circle 9.00 - 10.00 22435 22763 47 National College Intersection 10.00 - 11.00 12008 12645 48 Lalbagh West Gate Circle 18.00 - 19.00 16398 17838 49 South End Circle 19.00 - 20.00 23955 25964
50 Lalbagh Road - H Siddaiah Road Intersection (near Urvashi Theatre) 19.00 - 20.00 12798 15956
51 Lalbagh Main Gate & Lalbagh Fort Road - Krumbigal Road Intersection 19.00 - 20.00 13444 17159
52 Subbaiah Circle 17.00 - 18.00 9481 10468 53 Richmond Circle 18.00 - 19.00 11094 12687 54 Residency Road - Brigade Road Intersection 16.00 - 17.00 10334 11452 55 B R V Complex Intersection 18.00 - 19.00 15415 16100 56 Cubbon Road - Kamraj Road Intersection 9.00 - 10.00 16893 17298 57 Brigade Road - M G Road Intersection 18.00 - 19.00 13752 15195 58 M G Road - Residency Road Intersection 17.00 - 18.00 9809 11695 59 M G Road - Dickenson Road Intersection 18.00 - 19.00 16761 18199 60 Cubbon Road - Dickenson Road Intersection 9.00 - 10.00 13630 13828 61 Cubbon Road - Dickenson Road Intersection 9.00 - 10.00 13630 13828 62 Trinity Church Intersection 9.00 - 10.00 11213 11712 63 Victoria Road - Airport Road Intersection 9.00 - 10.00 13037 13065 64 Vellara Intersection 9.00 - 10.00 12230 12392 65 Forum Mall Junction 19.00 - 20.00 9374 10602 66 Dairy Circle 18.00 - 19.00 18304 20772 67 Bannerghatta - Tilak Nagar Road Intersection 18.00 - 19.00 11397 13516 68 Jayadeva Hospital Intersection 18.00 - 19.00 12425 13817 69 Silk Board Intersection 9.00 - 10.00 11713 12118 70 Electronic City Intersection 8.00 - 9.00 12696 18662

Comprehensive Mobility Plan for Bengaluru
Page 2-31
Location No Location Peak hou r
Peak H ou r Vol u m e In
Vehicl esIn
PCUs 71 Hoodi Intersection 17.00 - 18.00 6600 10035 72 Hope Farm Intersection 9.00 - 10.00 5855 10297 73 BEL Circle 19.00 - 20.00 18917 21476 74 Jalhalli Intersection 9.00 - 10.00 16432 20957 75 Chord Road - Mysore Road Intersection 9.00 - 10.00 15926 18941
Source: CTTS for Bangalore Metropolitan Region
2 .5 .2 Ou ter Cord on Road Sid e In terv iew
Classified traffic volume counts along with road side interviews had been carried out to assess the quantum of travel across the cordon. Origin-Destination/Road side interview survey was conducted at 13 locations to capture travel patterns. Tab l e 2 - 1 6 presents the Passenger Traffic at outer cordon locations.
Tab l e 2 - 1 6 : Passen ger Traf f ic at Ou ter Cord on Location s
Sl . No. Location
Peak H ou r Vol u m e 2 4 - H ou r Vol u m e
Vehicl es PCUs Vehicl es PCUs
1 NH-7 Bangalore- Hyderabad Road) 3036 3141 53609 58618
2 SH-9 (Doddaballapur Rd) 1046 1121 17926 24420
3 Hesaragatta Main Road 219 189 3839 3589
4 NH-4 (Tumkur Road) 1750 2821 37680 61325
5 Magadi Road 2150 1930 41221 41276
6 Mysore Road 1917 2347 33937 45525
7 Kanakapura Road 1370 1385 22695 24676
8 Banneraghatta Main Road 685 702 17304 17845
9 NH-7 (Hosur Road) 3733 4418 71374 97339
10 SH-35 (Sarjapur Main Rd) 1252 1393 19094 21538
11 Channasandra Main Rd 710 875 9022 11281
12 Thanisandra Main Road 834 1174 15182 21969
13 NH-4 (Old Madras Road) 1774 2719 58611 76626 Source: Revised master Plan for Bangalore-2031
As can be seen from Table 2-16, major traffic enters the city through NH7 (Hosur Road). The share of cars varies between 16% and 75% for the different locations and two wheelers vary from 8% to 59% . The percentage of trucks/ multi axle vehicles varies from 6% to 29% at various locations. Tumkur Road (NH4) has the highest percentage of goods vehicles at 29% .

Comprehensive Mobility Plan for Bengaluru
Page 2-32
The percentage share of Passenger and Goods traffic at the surveyed locations are 83 % and 17 % respectively and location wise Passenger/ Goods Traffic share for 24hour volume and peak hour volume is presented in Tab l e 2 - 1 7 .
Tab l e 2 - 1 7 : Share of Passen ger an d Good s traf f ic at ou ter cord on Location s
Cod e Location
2 4 - H ou r Vol u m e Peak H ou r Vol u m e
Pass
enge
r Ve
hicl
es
Goo
ds
Vehi
cles
Vehi
cles
(%
)
Goo
ds
(%)
Pass
enge
r Ve
hicl
es
Goo
ds
Vehi
cles
Vehi
cles
(%
)
Goo
ds
(%)
OD1 NH-7 (Bangalore- Hyderabad Road) 50929 3216 94% 6% 2914 91 97% 3%
OD2 SH-9 (
Doddaballapur Rd)
14342 3406 81% 19% 941 84 92% 8%
OD3 Hesaragatta Main Road 3416 230 94% 6% 208 6 97% 3%
OD4 NH-4 (Tumkur Road) 26753 10927 71% 29% 1278 525 71% 29%
OD5 Magadi Road 36275 5358 87% 13% 2043 130 94% 6%
OD6 Mysore Road 27489 6447 81% 19% 1687 231 88% 12%
OD7 Kanakapura Road 19518 3178 86% 14% 1179 192 86% 14%
OD8 Banneraghatta Main Road 9269 2147 81% 19% 528 151 78% 22%
OD9 NH-7 (Hosur Road) 54957 16417 77% 23% 3099 634 83% 17%
OD10 SH-35 (Sarjapur Main Rd) 16422 2483 87% 13% 1077 176 86% 14%
OD11 Channasandra Main Rd 7218 1713 81% 19% 625 78 89% 11%
OD12 Thanisandra Main Road 11084 4251 72% 28% 584 249 70% 30%
OD13 NH-4 (Old Madras Road) 48647 9377 84% 16% 1295 461 74% 26%
Total 326319 69150 83% 17% 17458 3008 85% 15%
Source: Revised Master Plan for Bangalore-2031
The inbound and outbound Goods Traffic volumes at surveyed locations observed are 30,209 and 34,773 respectively. The detailed tables showing inbound and out bound traffic volume with types of commercial vehicles are presented in Tab l e 2 - 1 8 , Tab l e 2 - 1 9 and Tab l e 2 - 2 0 .

Comprehensive Mobility Plan for Bengaluru
Page 2-33
Tab l e 2 - 1 8 : Dail y Good s Traf f ic v ol u m e com in g in to Ban gal ore
Location Cod e
Location Direction LCV Tru ck M AV TOTAL
OD1 NH-7 (Bangalore-Hyderabad Road) In Bound 733 348 192 1273 OD2 SH-9 (Doddaballapur Rd) In Bound 724 822 250 1796 OD3 Hesaragatta Main Road In Bound 32 91 1 334 OD4 NH-4 (Tumkur Road) In Bound 813 2891 782 4486 OD5 Magadi Road In Bound 1316 1095 396 2807 OD6 Mysore Road In Bound 545 1827 221 2593 OD7 Kanakapura Road In Bound 481 877 140 1498 OD8 Banneraghatta Main Road In Bound 426 402 42 870 OD9 NH-7 (Hosur Road) In Bound 2117 4264 1260 7641 OD10 SH-35 (Sarjapur Main Rd) In Bound 311 642 197 1150 OD11 Channasandra Main Rd In Bound 77 172 9 258 OD12 Thanisandra Main Road In Bound 92 515 122 729 OD13 NH-4 (Old Madras Road) In Bound 783 3794 407 4984
Total In Bou n d 8 4 5 0 1 7 7 4 0 4 0 1 9 3 0 , 2 0 9 Source: Revised Master Plan for Bangalore-2031
Tab l e 2 - 1 9 : Dail y Good s Traf f ic Vol u m e goin g f rom Ban gal ore
Location Cod e Location Direction LCV Tru ck M AV TOTAL
OD1 NH-7 (Bangalore-Hyderabad Road) Out Bound 687 593 181 1461
OD2 SH-9 (Doddaballapur Rd) Out Bound 711 850 183 1744 OD3 Hesaragatta Main Road Out Bound 20 94 3 117 OD4 NH-4 Tumkur Road Out Bound 392 4749 1336 6477 OD5 Magadi Road Out Bound 990 769 240 1999 OD6 Mysore Road Out Bound 883 2136 361 3380 OD7 Kanakapura Road Out Bound 569 743 36 1348 OD8 Banneraghatta Main Road Out Bound 654 390 50 1094 OD9 NH-7 (Hosur Road) Out Bound 1749 5129 1315 8193 OD10 SH-35 (Sarjapur Main Rd) Out Bound 263 441 106 810 OD11 Channasandra Main Rd Out Bound 414 735 105 1254 OD12 Thanisandra Main Road Out Bound 390 1730 384 2504 OD13 NH-4 (Old Madras Road) Out Bound 804 3217 371 4392
Total Ou t Bou n d 8 5 2 6 2 1 5 7 6 4 6 7 1 3 4 , 7 7 3
Source: Revised Master Plan for Bangalore-2031

Comprehensive Mobility Plan for Bengaluru
Page 2-34
Tab l e 2 - 2 0 : Su m m ary of Good s Traf f ic M ov em en t
Description Total Nu m b er of
Good s v ehicl es per d ay
Percen tage ( % )
External To Internal(Inbound) 28898 44% Internal to External(Out Bound) 23197 36%
External To External(By passable Traffic) 12886 20% Total 6 4 9 8 1
Source: Revised Master Plan for Bangalore-2031
The total goods movement observed from the outer cordon survey was 64981 out of which 44% was the inbound traffic (External to Internal movement) and 36% was out bound goods movement (Internal to External) and rest of 20% is the by passable traffic. The numbers presented in Table 2-20 shows that almost 12000 goods movement is just through traffic, which gives the clear indication that the city requires more logistic hubs outside the city limits.
Ty pe of Good s
The majority of the goods that the commercial vehicles carried in the study area include Industrial material, manufactured goods, perishables (food grains, diary product and vegetables) and Tankers as shown in Figu re 2 .1 5 .
Source: Revised Master Plan for Bangalore-2031,2015
Figu re 2 - 1 5 : Ty pes of Good s at ou ter cord on poin ts
Trip Freq u en cy - Passen ger Vehicl es
Daily trips formed majority of the trips at the outer cordons, followed by alternate day and weekly trips. The trip frequency for all locations is presented in Figu re 2 - 1 6 .
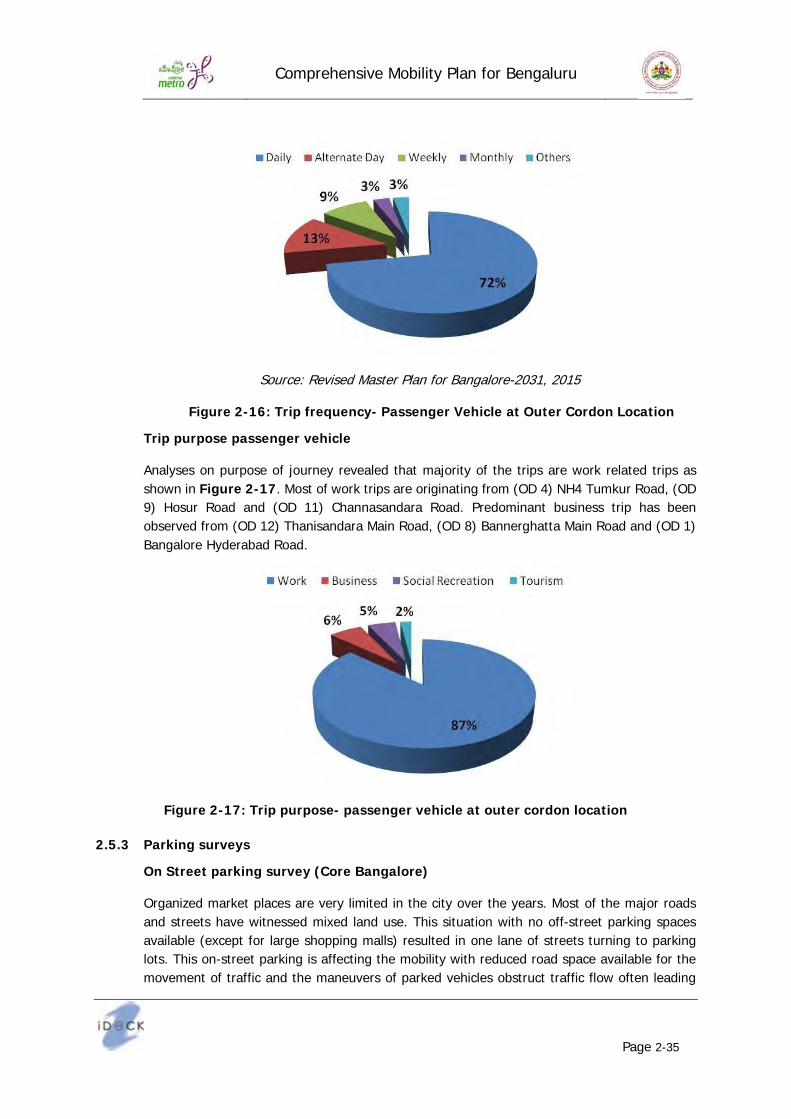
Comprehensive Mobility Plan for Bengaluru
Page 2-35
Source: Revised Master Plan for Bangalore-2031, 2015
Figu re 2 - 1 6 : Trip f req u en cy - Passen ger Vehicl e at Ou ter Cord on Location
Trip pu rpose passen ger v ehicl e
Analyses on purpose of journey revealed that majority of the trips are work related trips as shown in Figu re 2 - 1 7 . Most of work trips are originating from (OD 4) NH4 Tumkur Road, (OD 9) Hosur Road and (OD 11) Channasandara Road. Predominant business trip has been observed from (OD 12) Thanisandara Main Road, (OD 8) Bannerghatta Main Road and (OD 1) Bangalore Hyderabad Road.
Figu re 2 - 1 7 : Trip pu rpose- passen ger v ehicl e at ou ter cord on l ocation
2 .5 .3 Park in g su rv ey s
On Street park in g su rv ey ( Core Ban gal ore)
Organized market places are very limited in the city over the years. Most of the major roads and streets have witnessed mixed land use. This situation with no off-street parking spaces available (except for large shopping malls) resulted in one lane of streets turning to parking lots. This on-street parking is affecting the mobility with reduced road space available for the movement of traffic and the maneuvers of parked vehicles obstruct traffic flow often leading

Comprehensive Mobility Plan for Bengaluru
Page 2-36
to congestion. Surveys are carried out in some of the areas covering major streets/roads where on-street parking is observed.
Location- A
Most of the commercial/ shopping complexes in this location do not have required parking facilities to meet the parking demand of the visitors. It was observed that the road users parked their vehicles on Avenue road, KR market road, SJP road and S.P road. The central business district part of Bangalore, comprising Gandhinagar, Avenue Road, Chickpet, B.V.K. Iyengar Road and surrounding areas, records the highest number of business transactions but lacks adequate parking space. Two wheelers form the major component of the parked vehicles with a share of 82% followed by cars with a share of 7% . From the surveys, it has been observed that the average duration of parking is found to be one hour. On-street parking has reduced the capacity of roads by about 18% to 48% . High parking demand is observed on AS Char Street, BVK Iyengar road, Banappa park road, Chickpet main road, Nagarthpet road, RT Street, SJP road, SP road.
The total Parking accumulation in Location-A is 1795 PCE and high parking accumulation is observed on SJP road, Chickpet Main Road and BVK Iyengar Road.
Location B
The area is predominantly a mixed land use with commercial establishments such as several Corporate Offices, Railway Station, Bus Stand and Government Establishments. Bangalore City Railway station is located across the Kempegowda Bus Station in Bangalore.
Two wheelers form the major component of the parked vehicles with a share of 64% followed by cars with 30% share. From the surveys, it has been observed that the average duration of parking is found to be about one hour. On street parking has reduced the capacity of roads by about 8% to 60% on these streets.

Comprehensive Mobility Plan for Bengaluru
Page 2-37
High parking accumulation is observed on Kempegowda Road to Seshadri Road, Kalidasa Marg Road to 5th Main Road and SC road. The total Parking accumulation in the roads surveyed in Location-B is 366 PCE.
Location - C
The area is the Central Administrative Heritage Zone of the City which is the administrative complex for the Government of Karnataka with heritage buildings such as Vidhana Soudha, High Court, Public and Government buildings such as GPO, RBI, PWD Office, Karnataka Police Headquarters Offices and various institutions such as Government Arts and Sciences College, Central College, Home Science College, Seshadri Iyer Memorial Hall or the State Libraryetc.
In Location-C, cars form the major component of the parked vehicles with a share of 50% followed by two wheelers with 27% share. From the surveys, it has been observed that the average duration of parking is found to be about two hours. On street parking has reduced the capacity of roads by about 7% to 50% .
High parking accumulation is observed on Devraj Urs Road, Link road and Ramchandra Road, Race Course Loop Road. The total Parking accumulation in the roads considered under Location-C is 705 PCE.

Comprehensive Mobility Plan for Bengaluru
Page 2-38
Location-D
The area is one of the oldest and most prominent areas of Bangalore. It is basically commercial area and the traffic within the zone is moderate since most of the roads are broad. Cars form the major component of the parked vehicles with a share of 45% followed by two wheelers with share of 41% . From the surveys, it has been observed that the average duration of parking is about two hours.
High parking accumulation is observed on Railway Parallel Road, Race Course Road, 8th Main Road, Ali Askar Road and Edward Road. The total Parking accumulation at the surveyed streets in Location-D is 2259 PCE.

Comprehensive Mobility Plan for Bengaluru
Page 2-39
Location-E
The area is an important commercial center of Bangalore. Major traffic generators in this zone are the shopping haven Commercial Street, Russell Market Square, St Mary’s Church, Shivajinagar Bus Terminal and educational institutions along St. John’s Church Road. Two wheelers form the major component of the parked vehicles with a share of 65% followed by cars with 22% share. From the surveys, it has been observed that the average duration of parking is found to be about two hours.
High parking accumulation is observed on Anna Swamy Road, Kamraj Road, Osborne Road, Thimmaiah Road, Broadway Road and Seppings Road. The total Parking accumulation at the surveyed roads in Location-E is 2934 PCE.
Location-F
The area is predominantly Commercial (Business) land use surrounded by various Government, Institutional, Commercial and Private Properties. The major traffic generators include Mayo Hall and Municipal Offices, Manipal Center, Kanteerava Stadium, Cubbon Park, Mallya Hospital, St. Joseph’s College etc.
In Location-F, two wheelers form the major component of the parked vehicles with a share of 52% followed by cars with 43% share. From the surveys, it has been observed that the average duration of parking is found to be about two hours.
High parking accumulation is observed on MG road, Brigade road, Castle street, Lavelle road, Residency road, Church street. The total Parking accumulation observed in the streets surveyed under Location-F is 1243 PCE.

Comprehensive Mobility Plan for Bengaluru
Page 2-40
Location-G
In Location G, two wheelers form the major component of the parked vehicles with a share of 48% followed by car with 27% share. From the surveys, it has been observed that the average duration of parking is found to be about one hour. On street parking has reduced the capacity of roads by about 12% to 55% .
High parking in Location-G is observed on Lalbagh road, 2nd main road, Lalbagh fort road, NR road and Albert victor road. The total Parking accumulation in the roads section studied in Location-G is 875 PCE.

Comprehensive Mobility Plan for Bengaluru
Page 2-41
Tab l e 2 - 2 1 : Su m m ary of On - Street Park in g Accu m u l ation
S. No. Location Stu d y Areas Total Park in g Accu m u l ation
( PCE)
1 A Avenue Road, KR Market Road, SJP Road, S.P Road, Kasturba Road, Sultanpet Main Roadetc. 1795
2 B Kalidasa Marg Road, Anand Rao Circle, Dhanvanthari Road And S C Road 366
3 C Devraj Urs Road, District Office Road, Kalidasa Marg Road, Kasturba Road, Palace Road, Nrupathunga Road etc.
705
4 D Race Course Road, Crescent Road, Palace Cross Road, Millers Road, Cunningham Road 2, Aliasker Road, Jasma Bhavan Road, Edward Road, Union Street etc.
2259
5 E
Kensington Road, Annaswamy RD, Dickenson Rd, Kamaraj Rd, Veerapillai Street, Gangadhar Shetty Rd, Osborne Rd, Thimmaiah Road, Chick Bazaar Road, Haines Rd etc.
2934
6 F M G Road, Brigade Road, Brunton Road, Lavelle Road 1, Residency Road, Kasturba Cross Road, Mallya Hospital Road
1243
7 G Lalbagh Road, Pampa Maha Kavi Road, Lalbagh Fort Road, Nr Road, Albert Victor Road 876
Source: Parking Action Plan for Bangalore, 2015
Currently the on-street parking is highly unorganized and there is no physical infrastructure or enforcement to ensure orderly parking. The on-street parking being free of charge, the off-street parking facilities (where available) are not used to their full potential. Further, it is to be noted that there are no major off-street parking facilities in these areas.
Further the on-street parking reduces the effective road width available for traffic movement and the ingress/egress operations of parked vehicles obstruct flow of traffic in the available road way width and there by leading to reduced travel speeds and at times accidents. Organized parking would only help in limited way to restrict parking to small known road sections (which are required to be provided through recess in the footpath where space is available) but may not help in eliminating the traffic disturbance due to ingress and egress. Therefore, as far as possible on-street parking should not be allowed on major mobility travel corridors. Where space is available these need to be provided on the service road in an organized manner to limit the impact on traffic movement.
However, the implementation of organized parking and use of Technology has been observed for on-street parking management on brigade road, where local shop association have installed parking meters clearly marking car parking slots on the road space.
Park ing Fee
Parking today in Bangalore is virtually free on most roads. The parking fee charged on some major roads in the city centre is about Rs. 10 per hour. Parking is charged in most Commercial establishments/ office places and is in the range of Rs. 15 to 30 per hour which is much higher than the on-street parking fees.

Comprehensive Mobility Plan for Bengaluru
Page 2-42
Study of some Off-street parking facilities in the Study Area such as Maharaja complex, Janatha Bazaar, Railway Station, Freedom Park, MS Building, Hotel Taj, Shivajinagar Bus Stand, Russel Market,Unity Building and Town Hall was carried and the following Tab l e 2 - 2 2 provides the prevailing pricing for parking at these locations. The facilities are managed by private agencies appointed by Bruhath Bangalore Mahanagara Palike (BBMP).
Tab l e 2 - 2 2 : Detail s of Park in g f ee at som e Of f - street Park in g Areas
Sl .No. Location Park in g Fee ( Rs./ hou r)
Car TW
1 Maharaja Complex 10 3 Hazarath Hamid Shah complex 10 5
2Janatha Bazaar 10 5 Opposite to Sukh Sagar Mall 10 5 Railway Station front side 10 3
3 M S Building 10 3
4
Cantonment railway station 10 5 Shivajinagar bus stand 15 10 Russel market 20 10 Taj hotel Shivajinagar 10 5
5 Utility Building 20 10
6 Shantinagar bus stand 10 5 Unity building 10 5 Source: Parking Action Plan for Bangalore, 2015
As discussed earlier in Section 2.5.3, there is limited availability of off-street parking which are not being used to their fullest capacity. This is resulting due to uncontrolled and unorganized and free on-street parking facility available for the users. Predominant on-street parking affects the level of service on these roads. Speed and Delays Surveys
Floating car survey (Speed and Delay Survey) was carried out on major arterial roads. It is observed that the speeds in the city road network during peak hours are less than 11 kmph Figu re 2 - 1 8 presents the average journey speed on Primary Arterial Roads.
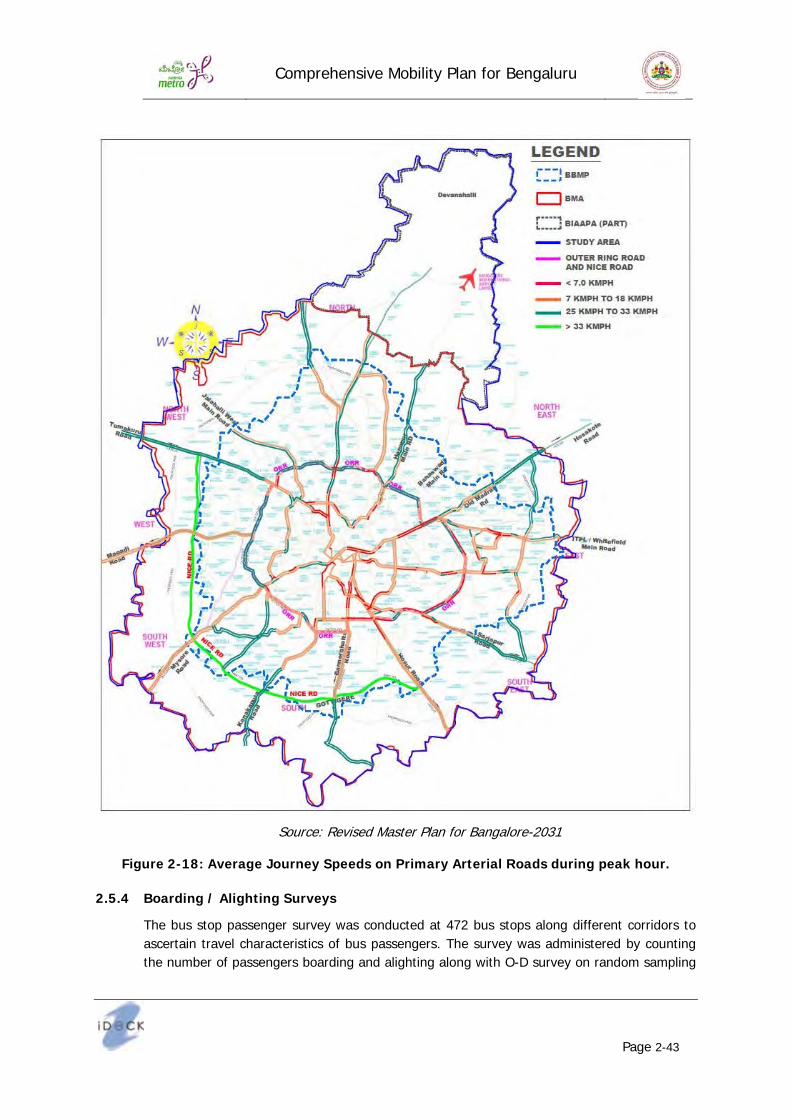
Comprehensive Mobility Plan for Bengaluru
Page 2-43
Source: Revised Master Plan for Bangalore-2031
Figu re 2 - 1 8 : Av erage J ou rn ey Speed s on Prim ary Arterial Road s d u rin g peak hou r.
2 .5 .4 Board in g / Al ightin g Su rv ey s
The bus stop passenger survey was conducted at 472 bus stops along different corridors to ascertain travel characteristics of bus passengers. The survey was administered by counting the number of passengers boarding and alighting along with O-D survey on random sampling

Comprehensive Mobility Plan for Bengaluru
Page 2-44
basis by interviewing passengers. This survey was conducted at 472 bus stops within the study area for a period of 16 hours. The information included:
• Trip purpose and travel time • Travel frequency of passengers
Tab l e 2 - 2 3 shows that about 65% of trips are contributed by work and business purpose and about 17% of trips are other purposes.
Tab l e 2 - 2 3 : Distrib u tion of Bu s Stop Passen gers b y Trip Pu rpose
Sl . No. Trip Pu rpose Percen tage ( % )
1 Service 49.1
2 Business 15.7
3 Education 11.8
4 Social 6.0
5 Others 17.4
TOTAL 1 0 0 Source: RITES Phase III Corridors of Bangalore Metro, 2016
2 .5 .5 Term in al Su rv ey s
Bus Passenger Survey
The OD data collected and analyzed at the 16 bus terminals indicates Majestic bus terminal caters to the maximum number of passengers i.e. 70000 passengers as shown in Tab l e 2 - 2 4 . The table further indicates that 2.9 lakh commuters use the bus terminals daily.
Tab l e 2 - 2 4 : Distrib u tion of Dail y Passen gers at M aj or Bu s Term in al s
Nam e of Bu s Term in al
Dail y Peak H ou r Passen ger
In f l ow Passen ger Ou tf l ow
Total Passen ger
Peak Arriv al
Peak Departu re
Total Passen gers
Jayanagar 9th Block Bus Terminal 2295 887 3182 225 116 341
Majestic Bus Terminal 42050 27959 70009 4363 4268 8631
Banashankari Bus Terminal 16423 13395 29818 2164 836 3000
Kengeri Bus Terminal 9169 1405 10574 1063 143 1206
Yelahanka Bus Terminal 15064 5362 20426 1707 272 1979
Shivaji Nagar Bus Terminal 24073 16296 40369 2330 1661 3991
Shanti Nagar Bus Depot 6614 4571 11185 627 679 1306
Kadugodi Bus Depot 2007 1399 3406 269 115 384

Comprehensive Mobility Plan for Bengaluru
Page 2-45
Nam e of Bu s Term in al
Dail y Peak H ou r Passen ger
In f l ow Passen ger Ou tf l ow
Total Passen ger
Peak Arriv al
Peak Departu re
Total Passen gers
Yeshwantpur Bus Depot 12699 9174 21873 1152 946 2098
Vijay Nagar Bus Depot 1482 1627 3109 161 117 278
Domlur Bus Depot 1282 945 2227 200 69 269 Jaynagar 4th Block Bus Depot
2047 1672 3719 170 211 381
KR Puram Railway Terminal 10353 9998 20351 1691 796 2487
Yaswantpur Railway Station 11256 9201 20457 1186 1237 2423
K.R.Market Bus Depot 12830 8726 21556 1380 857 2237
I.T.P.L. Bus Depot 7022 4350 11372 516 256 772 Source: RITES Phase III Corridors of Bangalore Metro, 2016
Tab l e 2 - 2 5 shows that about 56% passengers are dispersing through buses. Share of passenger dispersal by walk and auto rickshaw is about 39% and 2% respectively.
Tab l e 2 - 2 5 : M od e w ise Bu s Passen ger Dispersal Distrib u tion
Sl .No. M od e Trips Percen tage ( % )
1 Car 1276 0.7 2 Taxi 1217 0.7 3 Two Wheeler 3051 1.7 4 Auto 3502 2 5 Bus 99284 56.26 Walk 68336 38.7
TOTAL 1 7 6 6 6 6 1 0 0 Source: RITES Phase III Corridors of Bangalore Metro, 2016
It is observed from Tab l e 2 - 2 6 that about 53% of total passengers take less than 20 minutes and about 47% passengers take more than 20 minute to reach bus terminals from their initial origins.

Comprehensive Mobility Plan for Bengaluru
Page 2-46
Tab l e 2 - 2 6 : Distrib u tion of Passen gers b y Trav el Tim e to Reach Bu s Term in al s Sl . No. Trav el Tim e Trips Percen tage ( % )
1 < 10 1775 1 2 10--20 90919 51.5 3 20-30 26338 14.9 4 30-45 20677 11.7 5 45-60 20594 11.7 6 60-90 10667 6 7 > 90 5696 3.2
TOTAL 1 7 6 6 6 6 1 0 0 Source: RITES Phase III Corridors of Bangalore Metro, 2016
It is observed from Tab l e 2 - 2 7 that about 56% of total passengers at bus terminals are daily and about 23% are occasional travelers.
Tab l e 2 - 2 7 : Distrib u tion of Passen gers b y Trav el Freq u en cy at Bu s Term in al s
Sl . No. Trav el Freq u en cy Trips Percen tage ( % )
1 Daily 98588 55.8 2 Weekly 23135 13.1 3 Monthly 13647 7.7 4 Occasionally 41296 23.4
TOTAL 1 7 6 6 6 6 1 0 0 Source: RITES Phase III Corridors of Bangalore Metro, 2016
Rail Passenger Surveys
The rail passenger surveys were conducted to ascertain travel characteristics of railway passengers within the study area. The survey was administered by counting the number of passengers boarding and alighting the trains along with O-D survey on random sampling basis
by interviewing passengers waiting to board the train at railway stations. This survey was
Service13.4%
Business11.2%
Education3.7%
Social14.4%
Others57.3%
Disrib u tion of Passen gers b y Pu rpose
Car0.9%
Taxi1.5%
Two Wheeler2.8%
Auto Rickshaw20.1%
Bus65.1%
Walk9.5%
Disrib u tion of Passen gers b y M od e of Dispersal

Comprehensive Mobility Plan for Bengaluru
Page 2-47
conducted at one railway station within the study area for a period of 24 hours. The key findings of the survey are presented below.
It is observed from the analysis of rail terminal survey that City Railway Station handling 105210 numbers of passengers with about 8000 passengers boarding/ alighting during the peak hour.
Salient findings are as below:
Of the total trips, service and business trips are about 25% Education trips account for about 4% of the total trips In line with the purpose, about 20 % trips are daily commuters while another 11% travel
weekly Over 65% of passengers reach railway station by bus followed by Auto which has a share
of about 20% A little over 70% spend up to Rs 40 for reaching to or dispersal from station
Air Passenger Surveys
The air passenger survey is conducted to ascertain travel characteristics of air passengers. The survey was administered by counting the number of passengers boarding and alighting along with O-D survey on random sampling basis by interviewing passengers. This survey was conducted at Kempegowda Airport Terminal Bangalore within the study area for a period of 24 hours. It is observed that Kempegowda Airport caters to about 90,000 passengers per day.
Table 2-28 shows that about 43% of trips are contributed by service and business purpose and about 55% of trips are other purposes.
Tab l e 2 - 2 8 Distrib u tion of Air Passen gers b y Trip Pu rpose
Sl . No. Trip Pu rpose Total Passen gers Percen tage ( % )
1 Service 1518 10.0 2 Business 4931 32.6 3 Education 90 0.6 4 Social 272 1.8 5 Others 8324 55.0
Total 1 5 1 3 5 1 0 0 .0
Source: RITES Phase III Corridors of Bangalore Metro, 2016
Table 2-29 shows that about 72% passengers are dispersing through car and taxi/IPT. Share of passenger dispersal by buses is about 28% .

Comprehensive Mobility Plan for Bengaluru
Page 2-48
Tab l e 2 - 2 9 M od e w ise Distrib u tion of Air Passen ger Dispersal
Sl . No. M od e Trips Percen tage ( % )
1 Car 3442 22.74 2 Taxi/IPT 7480 49.42 3 Tw 23 0.15 4 Bus 4189 27.68
Total 15134 100.0 Source: RITES Phase III Corridors of Bangalore Metro, 2016
2 .5 .6 H ou sehol d In terv iew Su rv ey
Household Interview Survey was carried out on a sample basis as part of the study to get the information spread over the study area. A total of 10167 households have been drawn from all the traffic zones by random sampling method. Stratification of the sample was done to cover various income groups.
The survey format covered the socio-economic profile of the household providing details like household size, education levels, income, vehicle ownership etc. The individual trip information of the members of the household, which provides the details of the trips performed on the previous day, by the household members has also been collected.
The following outputs were derived from the analysis of the household survey.
Distribution of Household by Size
Distribution of households according to its family size is presented in Figu re 2 - 1 9 . The figure indicates that about 8% of the households have upto 2 members and about 16% of the households belong to the category of households which have 5-6 persons per household. Majority of households (75% ) have between3to 4 persons per households. The average household size is 3.7 which is less than the average household size in similar sized cities in India.

Comprehensive Mobility Plan for Bengaluru
Page 2-49
Source: RITES Study, 2016
Figu re 2 - 1 9 : Distrib u tion s of H ou sehol d s Accord in g to Siz e
Household Income and Expenditure
It is observed that about nearly 21% of households have monthly income less or equal to Rs. 15000 and another 28% have income between Rs. 15001 – 25,000 per month. The percentage of household having monthly income more than Rs. 25,000 was observed about 51% . Average household income per month in the study area was observed to be Rs. 32374/-
Source: RITES Study, 2016
Figu re 2 - 2 0 : Distrib u tion s of H ou sehol d s Accord in g to M on thl y In com e
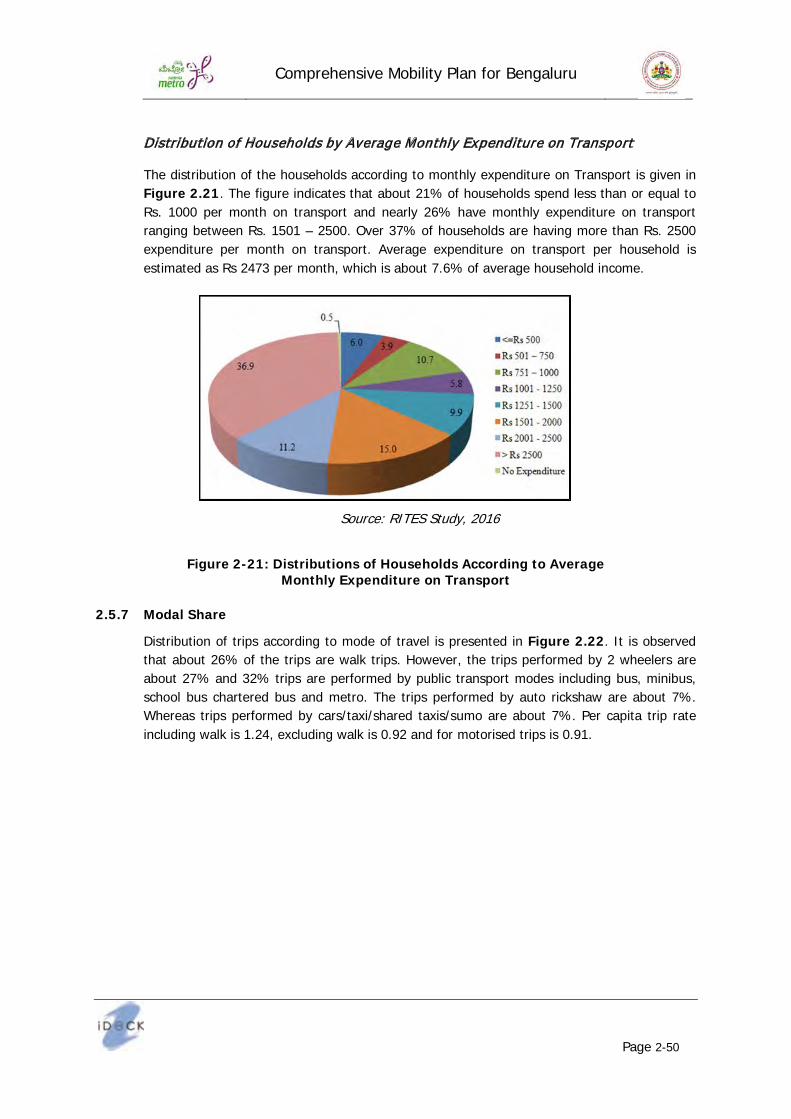
Comprehensive Mobility Plan for Bengaluru
Page 2-50
Distribution of Households by Average Monthly Expenditure on Transport
The distribution of the households according to monthly expenditure on Transport is given in Figu re 2 .2 1 . The figure indicates that about 21% of households spend less than or equal to Rs. 1000 per month on transport and nearly 26% have monthly expenditure on transport ranging between Rs. 1501 – 2500. Over 37% of households are having more than Rs. 2500 expenditure per month on transport. Average expenditure on transport per household is estimated as Rs 2473 per month, which is about 7.6% of average household income.
Source: RITES Study, 2016
Figu re 2 - 2 1 : Distrib u tion s of H ou sehol d s Accord in g to Av erage
M on thl y Ex pen d itu re on Tran sport
2 .5 .7 M od al Share
Distribution of trips according to mode of travel is presented in Figu re 2 .2 2 . It is observed that about 26% of the trips are walk trips. However, the trips performed by 2 wheelers are about 27% and 32% trips are performed by public transport modes including bus, minibus, school bus chartered bus and metro. The trips performed by auto rickshaw are about 7% . Whereas trips performed by cars/taxi/shared taxis/sumo are about 7% . Per capita trip rate including walk is 1.24, excluding walk is 0.92 and for motorised trips is 0.91.

Comprehensive Mobility Plan for Bengaluru
Page 2-51
Source: RITES Study, 2016
Figu re 2 - 2 2 : M od al Spl it - 2 0 1 5 ( In cl u d in g NM T Trips)
Purpose w ise Distribution of Trips
The Figu re 2 .2 3 gives the purpose wise distribution of the trips. It is observed that about 25% of the trips are performed for work and business purpose together, where as 15% trips are education and about 10% trips which includes shopping, social, health and recreation. About 50% trips are return trips.
Source: RITES Study, 2016
Figu re 2 - 2 3 : Pu rpose w ise Distrib u tion of Trips

Comprehensive Mobility Plan for Bengaluru
Page 2-52
Mode w ise Distribution of Trips by Trip Length
Average trip length by mode of travel is presented in Tab l e 2 - 3 0 . Average trip length for walk is 1.0 Km, for 2-wheeler 8.0 km, for car and taxi is 12.8 km and 13.1 km respectively and for Bus it is about 10.7 km.
Tab l e 2 - 3 0 : M od e w ise Av erage Trip Len gth
S. No. M od e Av erage Trip Len gth ( K m )
1 Car 12.8 2 Taxi 13.1 3 Shared Taxi 15.4 4 2- Wheelers 8.0 5 Auto 3.7 6 Bus 10.7 7 Mini Bus 10.7 8 School Bus 5.1 9 Chartered Bus 15.1 10 Cycle 2.6 11 Walk 1.0
Source: RITES Study, 2016
The City sprawl has resulted in increasing average trip length significantly.
2 .5 .8 Road Netw ork In v en tory
The main objective of Road Inventory survey is to assess the physical characteristics and conditions of major road network in the study area, identify physical constraints and bottlenecks and to identify the potential future development.
Right of W ay ( ROW )
About 43% of length of roads has ROW up to 10 m and 13% have ROW between 20 to 30 m as indicated in Tab l e 2 - 3 1 . This indicates the limitation of widening on most of the roads.
Tab l e 2 - 3 1 : Distrib u tion of Road Len gth b y Right of W ay
Right Of W ay ( m ) Road Len gth ( in k m ) Percen tage ( % )
Up to 10 1078.7 42.5 10-20 965.7 38.1 20-30 329.9 13.0 > = 30 163.1 6.4 Total 2 5 3 7 .4 1 0 0 .0
Source: RITES Phase III Corridors of Bangalore Metro, 2016

Comprehensive Mobility Plan for Bengaluru
Page 2-53
Carriagew ay W id th
The distribution of road network as per carriageway width is presented in Tab l e 2 - 3 2 . It can be observed that about 74% of surveyed road network length has carriage way width up to 2 lanes and about 20% of road network 4 lane and more.
Tab l e 2 - 3 2 : Distrib u tion of Road Netw ork as per Carriagew ay W id th
S. No. Carriagew ay Road Len gth ( K m ) Percen tage ( % )
1 Upto 2-Lane 1871.0 73.8
2 3 Lane 160.9 6.3
3 4-Lane 319.7 12.6
4 6- Lane and More 185.8 7.3
Divided 567.3 22.4
Undivided 1970.0 77.6
Total 2 5 3 7 .4 1 0 0 .0
Source: RITES Phase III Corridors of Bangalore Metro, 2016
Serv ice Road s
It is observed from Tab l e 2 - 3 3 that merely 5% of the road network has service lanes and rest of the network is without service lane. Thus it may be safely concluded that almost all of the primary roads in the city do not have a service road which affects their capacity adversely due to intervention from the activities on the roadside.
Tab l e 2 - 3 3 : Distrib u tion of Road Len gth b y Av ail ab il ity of Serv ice Road
Serv ice Road Road Len gth ( in k m ) Percen tage ( % )
Present 117.6 4.6
Absent 2419.8 95.4
Total 2 5 3 7 .4 1 0 0 .0
Source: RITES Phase III Corridors of Bangalore Metro, 2016
Key findings of the Road Inventory are as following:
Only 20% of the road network has 4 lanes or more, however when effective width available is considered, the length is very less
Ring Road network is weak or discontinuous at many locations. Parking interference has been observed at many locations in almost all major roads
resulting in to reduced effective width available for traffic movement Bus bays are not provided on most of the major Roads

Comprehensive Mobility Plan for Bengaluru
Page 2-54
Non - m otoriz ed Tran sport
Footpaths are available along about 47% of the road length as presented in Tab l e 2 - 3 4 . More than half of the road network is without footpaths.
Tab l e 2 - 3 4 : Distrib u tion of Road Len gth b y Av ail ab il ity of Footpath
Footpath Road l en gth ( k m ) Percen tage ( % )
Present 1183.7 46.7
One-side 41.1 1.6
Both-side 1142.6 45.0
Absent 1353.6 53.3 Source: RITES Phase III Corridors of Bangalore Metro, 2016
While almost 50% of the road network has foot path on one side or both sides, utility is limited to much lesser length due to encroachment by shopkeepers and parking, unevenness, damaged footpath etc. Goods Focal Point Survey
Goods Focal Point survey has been carried out to assess the characteristics of movement of goods from large operators. This would act as input for model development, preparation of truck routing /terminal planning. Entry exist surveys at 8 major facilities have been carried out; the details have been presented in Tab l e 2 - 3 5 .
Tab l e 2 - 3 5 : En try / Ex it of Good s Vehicl e at Su rv ey ed Location
Sl . No. J u n ction Cod e Location LCV/ Tem po Tractor 2 - Ax l e 3 - Ax l e M AV OTH ER
1 Concor Entry 37 14 124 19 6 6
Exit 4 6 178 2 0 0
2 Devraj URS Entry 216 63 210 37 0 0
Exit 190 56 102 111 5 0
3 Tumkur TCI Entry 11 16 16 9 8 0
Exit 11 9 29 1 8 1
4 Tumkur VRL Entry 3 5 126 1 0 0
Exit 6 0 131 9 0 0
5 Yeswanthpura Entry 116 29 14 7 5 0
Exit 63 16 10 12 2 0
6 Mysore Road Entry 56 57 25 3 0 0
Exit 51 48 15 2 0 0
7 Bidadi Entry 0 11 0 0 0 30
Exit 2 8 0 0 0 35

Comprehensive Mobility Plan for Bengaluru
Page 2-55
Sl . No. J u n ction Cod e Location LCV/ Tem po Tractor 2 - Ax l e 3 - Ax l e M AV OTH ER
8 Kadugodi -
White Field
Entry 22 10 10 2 2 0
Exit 37 14 124 19 6 6
Source: Revised master Plan for Bangalore-2031,2015
Good s Ty pe
It has been observed that most of commodity type goods coming and going from Bangalore is perishable goods followed by Industrial material, manufactured materials and tankers, refer Figu re 2 .2 4 .
Source: Revised master Plan for Bangalore 2031
Figu re 2 - 2 4 : Ty pes of Good s at Good s Focal Poin t
M od e- w ise Occu pan cy
Average Bus occupancy varied from 36 to 39 with overall average occupancy at 37.5. Average occupancy for cars, two wheelers and auto rickshaws is about 2.3, 1.5 and 1.8 respectively. The mini buses have an average occupancy of about 15.
K ey f in d in gs:
More than 20% truck entering or exiting Bangalore are originating from these eight locations.
Average Loading Capacity at these facilities is 10.80 Tonnes Limited parking at these goods facilities have forced trucks to be parked on street
2 .6 Su m m ary of Ex istin g Traf f ic an d Tran sport Con d ition s
The key findings of all the surveys indicate that all roads within the outer ring road boundary are facing severe congestion during the peak hours leading to gridlocks. One of the primary

Comprehensive Mobility Plan for Bengaluru
Page 2-56
reasons for traffic congestion is the low capacity of Bangalore roads that are facing the brunt of the ever-bludgeoning traffic growth.
Even the smaller roads intersecting the main arteries are congested leading to large delays at intersections, reducing the speeds significantly. With on street parking being rampant and haphazard there is a severe reduction in the available road capacity for vehicular movement.
Lack of off-street parking is one of the major banes of Bangalore and needs immediate attention to regain the dead capacity because of on-street parking. The parking and non-parking maneuvers cause severe impedance to smooth flow of traffic.
The signalized intersections throughout the city are operating on fixed time mode that is hampering smoother and speedier clearance of traffic at intersections As evident from the traffic congestion on the city roads, the operating speeds are dismally low in the city road network within the outer ring road boundary. The inner and outer ring roads are no exception as far as congestion goes. A few radials (Bannergatta Road, Magadi Road, Kanakapura Road and old Madras Road) on stretches outside the outer ring road precincts also face severe congestion. The East-West connectivity is weak in Bangalore as far as road network is concerned.
Important observations from the survey analyses are presented in the following section.
2 .6 .1 Traf f ic Characteristics
Peak Hour Traffic Volume at Screen line locations
The peak hour volume varies from 627 PCUs (798 vehicles) at Gunjur Road to 10699 PCUs (11989 vehicles) at Old Mysore Road.
Outer Cordon Road Side Interview Survey
(i) Of the surveyed outer cordon locations NH-7 (Hosur Road) has the highest number of vehicles at about 97339 PCUs (71374 vehicles) followed by NH-4(Old Madras Road) with 76626 PCUs (58611 vehicles).
(ii) The share of cars varies between 16% and 75% for the different locations and two wheelers vary from 8% to 59% . The percentage of trucks/ multi axle vehicles varies from 6% to 29% at various locations. Tumkur Road (NH4) has the highest percentage of goods vehicles at 29% .
(iii) The percentage share of Passenger and Goods traffic at the surveyed locations are 83 % and 17 % respectively
(iv) The inbound and outbound Goods Traffic volume at surveyed locations has been observed are 30,209 and 34,773 respectively
(v) The total goods movement observed from the outer cordon survey was 64981 out of which 44% is the inbound traffic (External to Internal movement) and 36% is out bound goods movement (Internal to External) and rest of 20% is the by passable traffic
(vi) It has been observed that maximum amount of Industrial Material carried by commercial vehicle from (OD 4) NH4 Tumkur Road followed by (OD7) Kanakpura

Comprehensive Mobility Plan for Bengaluru
Page 2-57
Road and (OD 9) Hosur Road. Perishable (Food Grains/ vegetables are carried by commercial vehicles from OD 13 Old Madras Road and OD 6 Mysore Road).
(vii) Analyses on purpose of journey revealed that majority of the trips are work related trips as. Most of work trips are originating from (OD 4) NH4 Tumkur Road, (OD 9) Hosur Road and (OD 11) Channasandara Road. Predominant business trip has been observed from (OD 12) Thanisandara Main Road, (OD 8) Bannerghatta Main Road and (OD 1) Bangalore Hyderabad Road.
2 .6 .2 Pu b l ic Tran sport Characteristics
Bus Passenger Surveys
The salient features of the surveys are given below.
(i) About 2.9 lakhs commuters use the inter or intra city bus terminals daily. Majestic bus terminal caters to the maximum number of passengers i.e. 70000 passengers.
(ii) It is observed that about 65% of passengers use buses for their work and business purpose and about 12% of passengers uses it for education purpose.
(iii) About 56% passengers are dispersing through buses. Share of passenger dispersal by walk and auto rickshaw is about 39% and 2% respectively
Rail Passenger Surveys
The salient findings of the surveys are discussed below.
(i) It is observed from the analysis of rail terminal survey that City Railway Station handles 1.05 Lakh numbers of passengers daily.
(ii) Out of 1.1 lakh trips of passengers, work & business purpose trips are about 25% followed by about 4% for education purpose.
(iii) About 65% passengers are dispersing through buses. Share of passenger dispersal by Auto is about 20% .
Air Passenger Surveys
The salient features of the surveys are given below.
(i) It is observed that Kempegowda Airport caters to about 90,000 passengers per day. (ii) About 72% passengers are dispersing through Car and Taxis/IPT. Share of passenger
dispersal by buses is about 28% .
2 .6 .3 H ou sehol d In terv iew Su rv ey
The entire study area has been divided into 215 internal and 10 external traffic zones. A total of 10167 households have been drawn from all the traffic zones by random sampling method.
Socio Econ om ic Characteristics
Various existing socio-economic characteristics viz. distribution of the households according to household size, household income, vehicle ownership, distribution of the individuals by their occupation, education and expenditure on transport etc. are derived from analysis of the household interview survey.
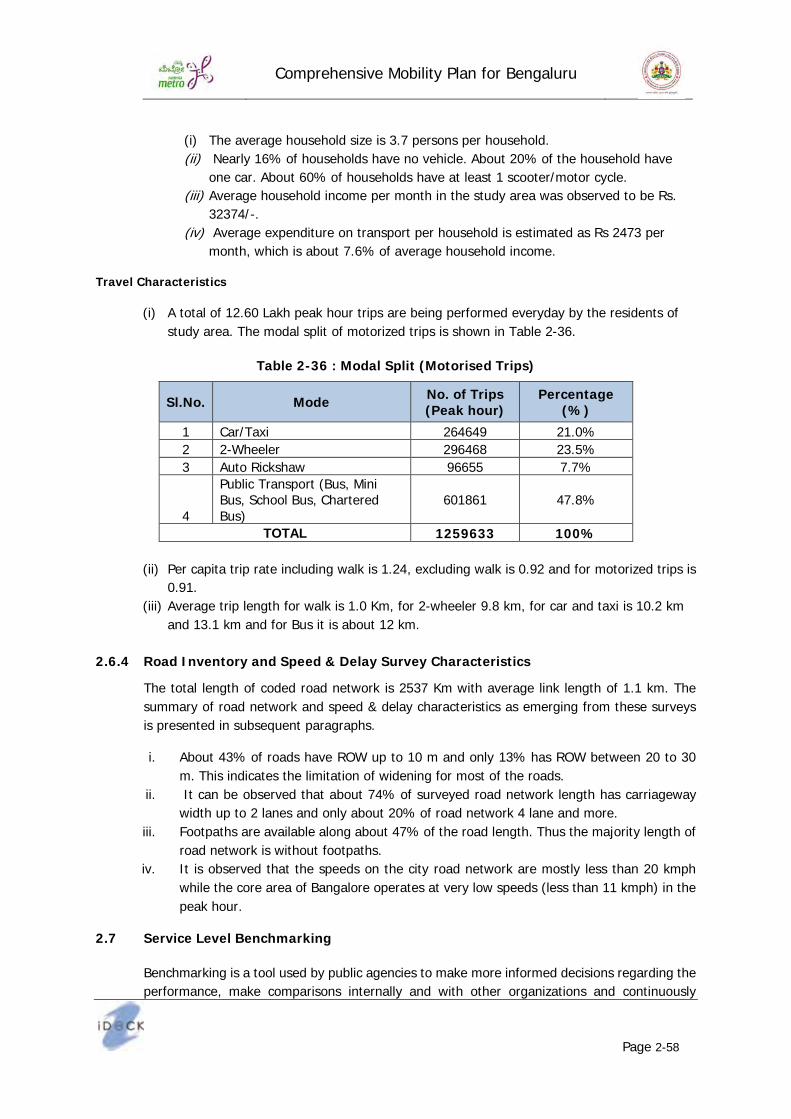
Comprehensive Mobility Plan for Bengaluru
Page 2-58
(i) The average household size is 3.7 persons per household. (ii) Nearly 16% of households have no vehicle. About 20% of the household have
one car. About 60% of households have at least 1 scooter/motor cycle. (iii) Average household income per month in the study area was observed to be Rs.
32374/-. (iv) Average expenditure on transport per household is estimated as Rs 2473 per
month, which is about 7.6% of average household income. Trav el Characteristics
(i) A total of 12.60 Lakh peak hour trips are being performed everyday by the residents of study area. The modal split of motorized trips is shown in Table 2-36.
Tab l e 2 - 3 6 : M od al Spl it ( M otorised Trips)
Sl .No. M od e No. of Trips ( Peak hou r)
Percen tage ( % )
1 Car/Taxi 264649 21.0% 2 2-Wheeler 296468 23.5% 3 Auto Rickshaw 96655 7.7%
4
Public Transport (Bus, Mini Bus, School Bus, Chartered Bus)
601861 47.8%
TOTAL 1 2 5 9 6 3 3 1 0 0 %
(ii) Per capita trip rate including walk is 1.24, excluding walk is 0.92 and for motorized trips is 0.91.
(iii) Average trip length for walk is 1.0 Km, for 2-wheeler 9.8 km, for car and taxi is 10.2 km and 13.1 km and for Bus it is about 12 km.
2 .6 .4 Road In v en tory an d Speed & Del ay Su rv ey Characteristics
The total length of coded road network is 2537 Km with average link length of 1.1 km. The summary of road network and speed & delay characteristics as emerging from these surveys is presented in subsequent paragraphs.
i. About 43% of roads have ROW up to 10 m and only 13% has ROW between 20 to 30 m. This indicates the limitation of widening for most of the roads.
ii. It can be observed that about 74% of surveyed road network length has carriageway width up to 2 lanes and only about 20% of road network 4 lane and more.
iii. Footpaths are available along about 47% of the road length. Thus the majority length of road network is without footpaths.
iv. It is observed that the speeds on the city road network are mostly less than 20 kmph while the core area of Bangalore operates at very low speeds (less than 11 kmph) in the peak hour.
2 .7 Serv ice Lev el Ben chm ark in g
Benchmarking is a tool used by public agencies to make more informed decisions regarding the performance, make comparisons internally and with other organizations and continuously

Comprehensive Mobility Plan for Bengaluru
Page 2-59
improve performance using the lessons learned through this comparison process. Benchmarking helps to establish baseline measures of performance, and helps monitor the agency’s individual performance over time, and also how it compares with the other organizations, and also improving performance by sharing of lessons learnt from different entities.
Need f or Ben chm ark in g
The National Urban Transport policy (NUTP) 2006 highlights the crucial link between transport demand and land use planning and the need to develop an integrated mobility plan for each city. Accordingly, each city should develop comprehensive mobility plan with focus on accessibility, mobility and traffic flow (in that order). Rather than the present approach of “ predict and provide” it has to be “ Planning for the desirables” . However, there need to be some yardstick to measure and compare the effectiveness of policies and urban projects across cities. Urban agencies in India currently do not have any system for measuring performance of urban transport activities, assessing impacts of projects and taking further action on them. Kochi is no exception to this. The service level benchmarks (SLB) issued by MoHUA specify parameters to measure the effectiveness of land use transport planning in Bangalore.
The SLBs describe the levels of transport performance like safety and access, pollution, accidents, congestion etc. in Bangalore currently. They indirectly reflect the state of governance in the city. Above all, these benchmark indicators allow stakeholders to quantify the past, present and changes in transport and its sustainability.
Perf orm an ce Ben chm ark s f or Urb an Tran sport
Service level benchmarks have been identified for the following parameters by the Ministry of Housing and Urban Affairs (MoHUA):
Pu b l ic tran sport f acil ities
Presence of organized public transport system in urban area (% ) Extent of supply availability of public transport Service coverage of public transport in the city Average waiting time for public transport users (mins) Level of comfort in public transport Percentage of fleet as per urban bus specification
Ped estrian in f rastru ctu re f acil ities
Signalized intersection delay (% ) Street Lighting (Lux) Percentage of city covered
Non - M otoriz ed Tran sport ( NM T) f acil ities
Percentage of network covered Encroachment on NMT roads by vehicle parking (% ) NMT parking facilities at interchanges (% )

Comprehensive Mobility Plan for Bengaluru
Page 2-60
Lev el of u sage of In tel l igen t Tran sport Sy stem ( ITS) f acil ities
Availability of traffic surveillance (% ) Passenger Information System (PIS) (% ) Global Positioning System (GPS)/ General Pocket Radio Service (GPRS) (% ) Signal Synchronization (% ) Integrated ticketing System (% )
Trav el speed ( M otoriz ed an d M ass Tran sit) al on g m aj or corrid ors
Average travel speed of personal vehicles (Kmph) Average travel speed of public transport (Kmph)
Av ail ab il ity of park in g spaces
Availability of on street paid public parking spaces (% ) Ratio of maximum and minimum parking fee in the city
Road Saf ety
Fatality rate per lakhs population Fatality rate for pedestrian and NMT (% )
Pol l u tion l ev el s
Sulpher di Oxide (So2) Oxides of Nitrogen Suspended Particulate Matter (SPM) Respirable Suspended Particulate Matter (RSPM) (Size less than 10 microns)
In tegrated l an d u se tran sport sy stem
Financial Population Density – Gross (Persons/Developed area in hectare) Mixed Land-use on Major Transit Corridors / Network (% area under nonresidential
use) Intensity of Development – City wide (FSI) Intensity of development along transit corridor (FSI transit corridor/FSI) Clear Pattern and Completeness of the network Percentage of area under Roads Percentage of network having exclusive ROW for Transit network
Fin an cial su stain ab il ity of pu b l ic tran sport
Extent of Non fare Revenue (% ) Staff /bus ratio Operating Ratio
The Detailed calculation is presented below.
Comprehensive Mobility Plan for Bengaluru
Page 2-61
PUBLIC TRANSPORT FACILITIES
( a) PRESENCE OF ORGANIZ ED PUBLIC TRANSPORT SY STEM IN URBAN AREA ( % ) Bangalore’s public transportation system is operated and maintained by Bangalore Metropolitan Transport Services (BMTC). At present, the city has 6634 buses operated on 2842 routes.
A = Total Number of Buses in the City operating – 6634 buses
B = Total Number of operating Buses under the ownership of STU/SPV - 6634 buses Presence of Organized Public Transport System in Urban Area (% ) = (B/A) * 100
= 100 % , therefore corresponds to LoS 1
( b ) EXTENT OF SUPPLY AVAILABILITY OF PUBLIC TRANSPORT ( AVAILABILITY OF PUBLIC TRANSPORT / 1 0 0 0 POPULATION) The Estimated Population of study area for the year 2016 is 110.52 lakhs A = Total Number of Buses in the City – 6161 buses B = Total Population of the Study area – 110.52. Availability of Public Transport / 1000 Population = A/ (B/1000) = 0.50, Therefore corresponds to LoS = 2
( c) AVERAGE W AITING TIM E FOR PUBLIC TRANSPORT USERS ( M INS) The average headway for each bus route is about 25.26 minutes. Therefore, the average waiting time is half the headway i.e. 12.63 minutes, therefore corresponds to LoS 4.
( d ) LEVEL OF COM FORT IN PUBLIC TRANSPORT ( FROM PREVIOUS CM P) Load factor was calculated for different routes (Peak and Off peak hours). From the calculated load factor distribution table was prepared. The average value obtained from the distribution is about 0.72. Therefore, corresponds to LoS 1.
( e) % OF FLEET AS PER URBAN BUS SPECIFICATION A = Total Number of Buses in the City operating – 6634 buses B = Total number of buses as per the Urban Bus specifications in the city operating – 6634 buses % of fleet = (B/A) * 100 = (6634/6634)* 100 = 100% , Therefore corresponds to LoS 1. The overall LoS of Public Transport Facilities is obtained by summing up the LoS of individual parameters, thus overall LoS corresponds to 2.
TRAVEL SPEED ( M OTORIZ ED AND M ASS TRANSIT) ALONG M AJ OR CORRIDORS

Comprehensive Mobility Plan for Bengaluru
Page 2-62
AVERAGE TRAVEL SPEED OF PERSONAL VEH ICLES ( K M PH )
From the speed and delay survey for private vehicles, the average journey speed for major corridors for the private vehicles = 11 Kmph. Therefore, corresponds to LoS 4.
AVERAGE TRAVEL SPEED OF PUBLIC TRANSPORT ( K M PH )
From the speed and delay survey for public transport, the average journey speed for major corridors for the public transport = 8 Kmph. Therefore, corresponds to LoS 4.
Overall Level of Service of Travel Speed facilities city wide = 3+ 3 = 6 (score) = LOS 3
The overall LOS= 4+ 4 = 8 (score) this corresponds to LoS 4
AVAILABILITY OF PARK ING SPACES
This indicator represents the availability of paid on-street parking spaces for all vehicles in the Bangalore. Paid on-street parking facility is not yet introduced in Bangalore city except in some off-street locations like Bus stands, railway stations and other commercial complexes. In some places like Malls parking is maintained by private people.
As the percentage is negligible it is considered as < 25 % . Therefore, LoS 1= 4.
The ratio of maximum and minimum parking fee is 1 for Bangalore city. Therefore, LoS 2 = 4.
Overall score: 4+ 4 = 8 this corresponds to LoS 4.
ROAD SAFETY
Fatality rate per lakh population
Fatality Rate per Lakh of Population (% )
Accident Data for the entire city was collected from Traffic police, Calculation was done only based on 2017 data and the corresponding year population.
A = Total number of fatalities recorded in road accidents within city limits in the given calendar year = 661 (in nos.)
B = Population of the Bangalore – 118 (Estimated) (in Lakhs)
Fatality rate per 100000 Population (ratio) = (A X 100000) / (B)
= 5.6
This corresponds to LOS 3.
POLLUTION LEVELS
The indicator indicates the level of air pollutants in the city i.e., average level of pollution in urban areas. The indicator to calculate the pollution level is Mean Concentration Range.

Comprehensive Mobility Plan for Bengaluru
Page 2-63
The pollution data that needs to be collected includes:
Sulphur Dioxide(SO2)
Oxides of Nitrogen
Suspended Particle matter (SPM)
RSPM (Size less than 10microns)
The level of service for the pollutants is divided into four categories i.e., low, moderate, high and critical. The level of service for each of the above parameters is determined using the table below as recommended by MoUD /MoHUA
For Bangalore city, the pollution levels data is available for the year 2018 and is as shown below Oxides of Sulphur: 4, this corresponds to LoS 1
Oxides of Nitrogen: 11, this corresponds to LoS 1
SPM: 170, this corresponds to LoS 1
RSPM (Size less than 10 microns): 90, This corresponds to LoS 3
Overall level of service of pollution city wide = LoS 1+ LoS 2+ LoS 3 + LoS 4 = 1+ 1+ 1+ 3= 6, this corresponds to LoS 2.
INTEGRATED LAND USE TRANSPORT SY STEM
POPULATION DENSITY – GROSS (PERSONS/DEVELOPED AREA IN HECTARE)
A = Area (in Hectare) of study area= 1,30,700 hectares
B = Population of the year (2016) for which data is available = 110.52 lakhs Population density (No.) = B/A
= 34,30,000 /1,55,000 = 84.56. Therefore, corresponds to LoS 4.
M IXED LAND- USE ON M AJ OR TRANSIT CORRIDORS / NETW ORK ( % AREA UNDER NON- RESIDENTIAL USE)
A= Mixed use Development along Transit corridors= 815 kms B= Total road length (Transit corridor) = 2537km
A/B* 100= (815/2537) * 100= 32% , Therefore corresponds to LoS 1.
INTENSITY OF DEVELOPM ENT – CITY W IDE ( FSI)
As per the Development Plan Floor Space Index (FSI) as applicable to the developed area lies in the range of 1.00 - 1.5. Normally, FSI varies due to plot size, ground coverage and road width.
Floor Space Index is between 1.0 to 1.5, Therefore corresponds to LoS 3.

Comprehensive Mobility Plan for Bengaluru
Page 2-64
The entire network in Bangalore city has a somewhat clear pattern but somewhat incomplete network as many the peripheral locations are not well connected.
Hence LoS 5 = 2.
INTENSITY OF DEVELOPM ENT ALONG TRANSIT CORRIDOR ( FSI TRANSIT CORRIDOR/ FSI)
A = Floor Space Index (Applicable to most part of the city as per master plan is 1.0 to 1.5. B = FSI for the proposed transit corridor is also 1.0 TO 1.5
Intensity of development along transit corridor = B/A= 1, Therefore corresponds to LoS 3.
% OF AREA UNDER ROADS ( % )
As per master plan, the average area under transport and communication for Bangalore City area is around 7.29% . Therefore, LoS = 4
% NETW ORK W ITH EXCLUSIVE ROW FOR TRANSIT ( FOR > 1 M ILLION AS PER 2 0 1 6 CENSUS)
A = total Length of roads= 14400 km
B = Total length of road having exclusive transit = 0 kms
% network with exclusive ROW for transit = B/A* 100 = 0, Therefore LoS = 4
Ov eral l Lev el of Serv ice of In tegrated Lan d u se sy stem = LoS 1 + LoS 2 + LoS 3 + LoS 4 + LoS 5 + LoS 6 + LoS 7 = 4 + 1 + 2 + 2 + 3 + 4 + 4 = 2 0 , this correspon d s to ov eral l LOS 3 .
SUSTAINABILITY OF PUBLIC TRANSPORT
EXTENT OF NON FARE REVENUE ( % )
Performance of Bangalore City Transport Services Limited had been collected as a secondary data collection.
A = Revenue collections per annum from non-fare related sources (i.e. excluding tariff box collections) - 462.29 crore
B = Total revenue per annum from all the sources i.e. majorly fare 100% Extent of non-fare revenue (% ) = 2227 crores
A/B* 100= 20% , Therefore LoS 2
STAFF / BUS RATIO
A = Total staff of bus operation and maintenance – > 34114
B = Total number of buses – 6677 (in Number)

Comprehensive Mobility Plan for Bengaluru
Page 2-65
Staff / Bus Ratio (ratio) = A/B = 5.1, Therefore LoS 1
OPERATING RATIO
A = Operating expenses/bus – Rs. 39.58 lakhs
B = Ticketing revenue/bus – Rs. 27.54 lakhs
Operating ratio = A/B = 1.44, Therefore LoS 3
Overall score: 2+ 1+ 3 = 6 this corresponds to overall LoS 2.
The summary of the LOS calculated for the study area is presented in Tab l e 2 - 3 7 .
Tab l e 2 - 3 7 : Su m m ary of Serv ice Lev el Ben ch M ark
Description Ex istin g
LOS Rem ark s
Pu b l ic Tran sport Facil ities 2
The city has Public Transport system which may need considerable improvements in terms of supply of buses/coaches and coverage as many parts of the city are not served by it. The frequency of the services may need improvements
Non M otorised Tran sport ( NM T) f acil ities
4 The city lacks adequate NMT facilities.
Trav el speed ( M otoriz ed an d M ass Tran sit) al on g m aj or corrid ors
4
Significant approach delays and average travel speed of 1/3 the free flow speed or lower. Such condition causing combination of one or more reasons such as high signal density, extensive queuing at critical intersection and appropriate signal timing.
Park in g spaces 4
The city authority need to initiate immediate actions with respect to providing paid parking spaces and demand management for parking.
Road Saf ety 3
Need considerable improvements in Road design and available road infrastructure, traffic management and in other such reasons which significantly contribute to road safety.
Pol l u tion l ev el s 2 Need some improvement in emission standards, checking pollution etc.
In tegrated l an d u se tran sport sy stem
3 Faint coherence between study area structure and public transport system.
Su stain ab il ity of Pu b l ic Tran sport
2 The Public transport is financially sustainable but needs some improvement.

Comprehensive Mobility Plan for Bengaluru
Page 3-1
3 TRANSPORT DEM AND ASSESSM ENT AND DEVELOPM ENT OF SUSTAINABLE URBAN TRANSPORT SCENARIOS
The main focus of the study is to develop a long-term transportation strategy for Bengaluru with the help of an urban transport planning model. Transport Demand Modelling has been carried out to replicate the Bengaluru “ real” transportation system and forecasting the state of the system for the targeted horizon year (2051) under various scenarios. This chapter discusses the development of alternative scenarios and their evaluation with outputs of travel demand modelling.
3 .1 BUSINESS AS USUAL ( BAU) SCENARIO
The CMP considers Business as Usual Scenario (BAU) for 2031 wherein the present base year trends are assumed to continue for the horizon years with minimum changes to occur in the future. This scenario assesses the transport system with base year trends and assumes no radical policy interventions for sustainable development and emission mitigations to identify the effects on travel infrastructure, mode share and PT systems in the city. However, it does incorporate infrastructure, Mass Transit System and land use according to the Revised Master Plan.
3 .1 .1 Accord in gl y , the BAU scen arios is ev al u ated u sin g Com m itted Proj ects al on e. Trav el Dem an d M od el Dev el opm en t
The Travel demand model developed for the preparation of Revised Master Plan 2031 has been adopted for this study. A brief description of the Transport Demand Model (as was carried out in the Master Plan Revision) is presented in An n ex u re 3 .1 .
3 .1 .2 Socio- Econ om ic Tran sition s
Bengaluru has a long history, but the recording of census of population in Bengaluru began from 1871. It is notable here that since the first census, Bengaluru has been the most populous city in the State of Karnataka. Bengaluru has retained its primacy in the state for more than a century now. RMP-2031, given the available census information, has extracted population data for the unified area (BMA) for the past four decades i.e. 1971 to 2011. Census information broadly coincides with the formation of BDA in 1976 and that the Jurisdiction of BMA has remained constant for all these years except for modifications due to administrative changes. However, the municipal boundaries/ urban agglomeration has changed every decade. In case of BBMP, present municipal boundaries have been used to arrive at historical data for BBMP.
As already presented in Section 1.4, the study area for CMP includes BMA and part of BIAAPA (Jala and Kasba Hoblis). BMA comprises area under BBMP and 251 villages around the BBMP. For the BIAAPA area, the authority has prepared master plan to guide the development in the area. The census data pertaining to the BMA (BBMP and Villages) and parts of BIAAPA has been used for extraction and analysis of population. For projections, relevant master plans and the population growth rates for further projections has been used.
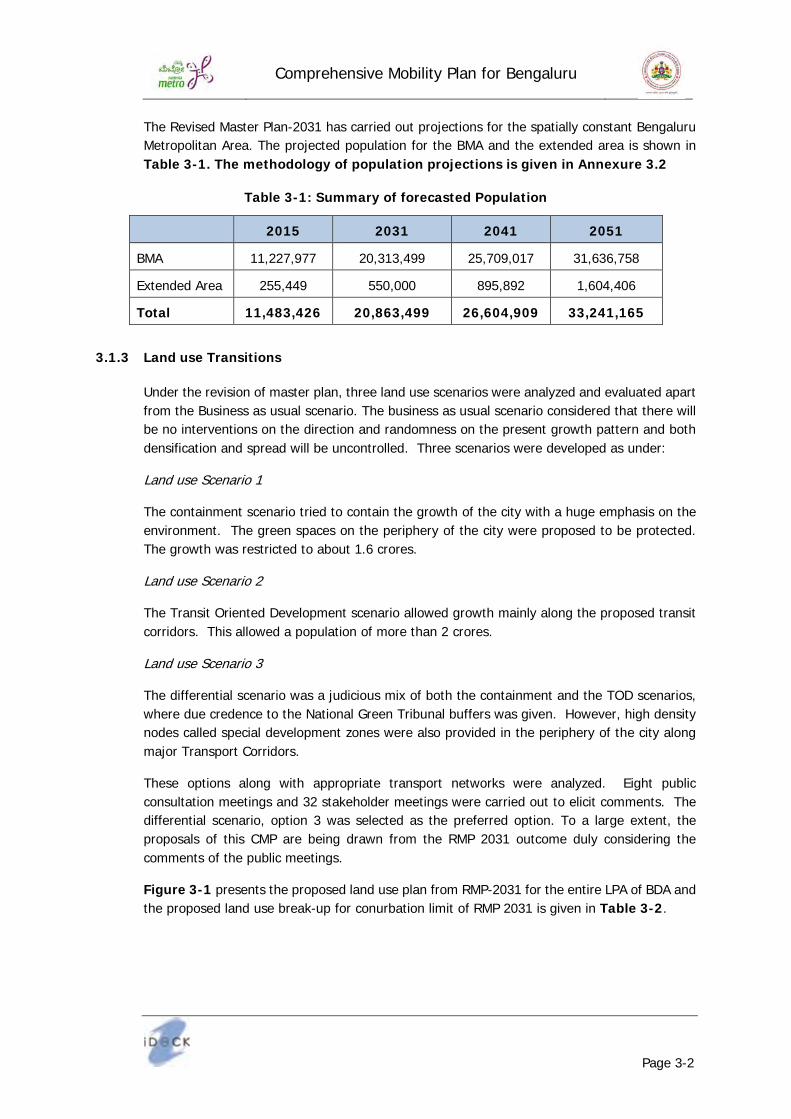
Comprehensive Mobility Plan for Bengaluru
Page 3-2
The Revised Master Plan-2031 has carried out projections for the spatially constant Bengaluru Metropolitan Area. The projected population for the BMA and the extended area is shown in Tab l e 3 - 1 . The m ethod ol ogy of popu l ation proj ection s is giv en in An n ex u re 3 .2
Tab l e 3 - 1 : Su m m ary of f orecasted Popu l ation
2 0 1 5 2 0 3 1 2 0 4 1 2 0 5 1
BMA 11,227,977 20,313,499 25,709,017 31,636,758
Extended Area 255,449 550,000 895,892 1,604,406
Total 1 1 , 4 8 3 , 4 2 6 2 0 , 8 6 3 , 4 9 9 2 6 , 6 0 4 , 9 0 9 3 3 , 2 4 1 , 1 6 5
3 .1 .3 Lan d u se Tran sition s
Under the revision of master plan, three land use scenarios were analyzed and evaluated apart from the Business as usual scenario. The business as usual scenario considered that there will be no interventions on the direction and randomness on the present growth pattern and both densification and spread will be uncontrolled. Three scenarios were developed as under:
Land use Scenario 1
The containment scenario tried to contain the growth of the city with a huge emphasis on the environment. The green spaces on the periphery of the city were proposed to be protected. The growth was restricted to about 1.6 crores.
Land use Scenario 2
The Transit Oriented Development scenario allowed growth mainly along the proposed transit corridors. This allowed a population of more than 2 crores.
Land use Scenario 3
The differential scenario was a judicious mix of both the containment and the TOD scenarios, where due credence to the National Green Tribunal buffers was given. However, high density nodes called special development zones were also provided in the periphery of the city along major Transport Corridors.
These options along with appropriate transport networks were analyzed. Eight public consultation meetings and 32 stakeholder meetings were carried out to elicit comments. The differential scenario, option 3 was selected as the preferred option. To a large extent, the proposals of this CMP are being drawn from the RMP 2031 outcome duly considering the comments of the public meetings.
Figu re 3 - 1 presents the proposed land use plan from RMP-2031 for the entire LPA of BDA and the proposed land use break-up for conurbation limit of RMP 2031 is given in Tab l e 3 - 2 .

Comprehensive Mobility Plan for Bengaluru
Page 3-3
Tab l e 3 - 2 : Proposed Lan d u se- 2 0 3 1
Lan d u se Category Area ( Sq .k m ) % To Total
Dev el opab l e Area
Residential 450.69 37.34
Commercial 27.88 2.31
Industrial 44.90 3.72
Public & Semi Public 58.66 4.86
Public & Semi Public - Defense 43.12 3.57
Public Utility 4.32 0.36
Parks / open spaces 29.71 2.46
Transport & Communication 120.77 10.01
Forest 4.71 0.39
Water Bodies and Streams 40.75 3.38
NGT Buffer 76.36 6.33
Total Developable Area 901.87 74.73
Agriculture Zone 305.05 25.27
Total 1 2 0 6 .9 2 1 0 0 .0 0
BMICAPA 79.14 -
Jala & Kasba Hobli 227.85 -
Total Con u rb ation Area 1 5 1 3 .9 1 -
Source: Revised Master Plan for Bengaluru - 2031 (Draft): Volume-3
The Conurbation extends mainly to Jala & Kasba Hobli. The rest of the land use is majorly Agriculture.
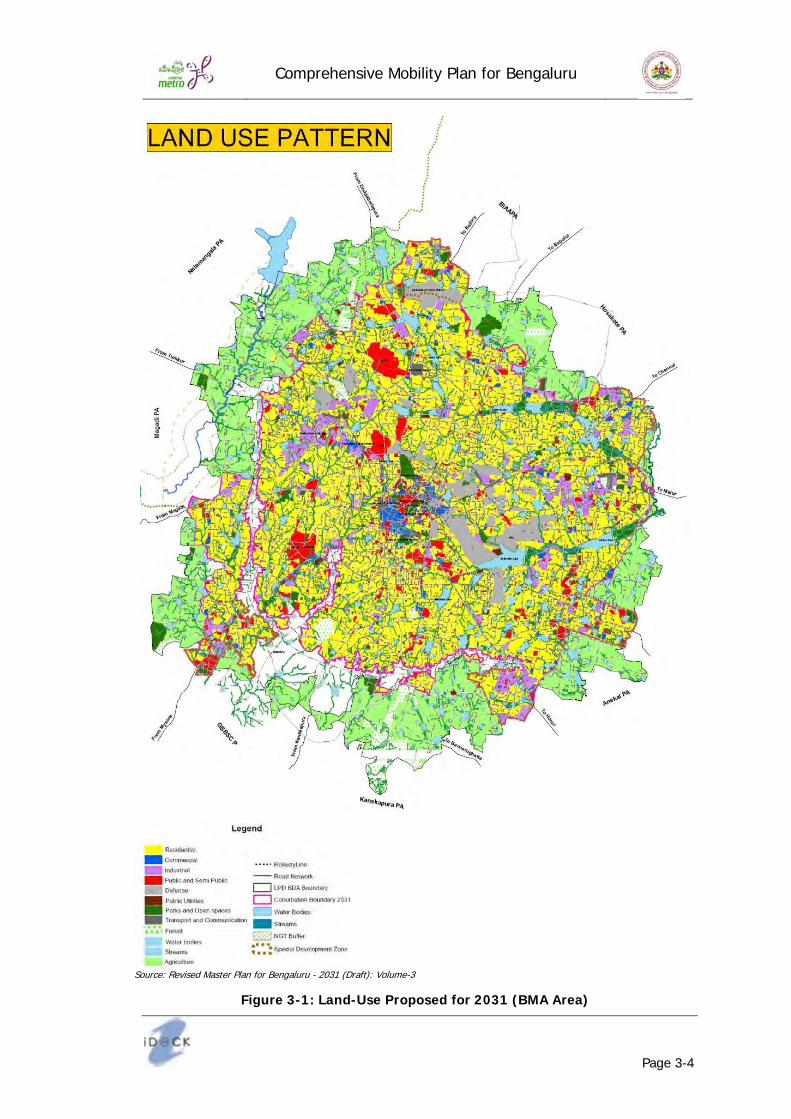
Comprehensive Mobility Plan for Bengaluru
Page 3-4
Source: Revised Master Plan for Bengaluru - 2031 (Draft): Volume-3
Figu re 3 - 1 : Lan d - Use Proposed f or 2 0 3 1 ( BM A Area)

Comprehensive Mobility Plan for Bengaluru
Page 3-5
3 .1 .4 Bu sin ess as Usu al Scen ario ( Do M in im u m )
In “ Do Minimum” Business as Usual (BAU-DM) scenario, the existing road network with committed development projects are considered. The list of committed projects proposed by various departments includes the following:
Figu re 3 - 2 : M etro Phase- 1 an d 2 Corrid ors
The major transport proposals committed include:

Comprehensive Mobility Plan for Bengaluru
Page 3-6
a) Metro Phase 2 - The phase 2 of Metro will see the network expand by a distance of 72.095 km. This stretch of the project will see the development of 61 metro stations. Out of these proposed 61 stations, 12 stations are to be built underground. The complete stretch of the 72.095 km long network will be divided into an underground stretch of 13.79 km, an elevated stretch of 57.825 km, and 0.48 km will be at grade.
b) Peripheral Ring Road: The BDA proposes that the peripheral ring road be built (78 kilometers) around Bengaluru. This stretch connects Tumkur Road (NH4) and Hosur Road (NH7) on the northern side acting complementary to existing Nice Road (which is on southern side of city).
c) Elevated Corridors: There is a need for augmenting the capacity of arterial roads in the CBD areas, as well as beyond the ORR. While at-grade augmentation is the default option and should be pursued for peripheral areas, limitations of land acquisition in the CBD require consideration of road capacity augmentation through elevated roads. Hence, the Government of Karnataka is planning on further augmentation of urban road capacity through elevated corridors, with particular attention to the equitable allocation of road space, by prioritizing movements of public transport vehicles, pedestrians and bicyclists.
d) Augmentation of BMTC buses to double the existing fleet: BMTC’s bus augmentation plan for the future years to meet the ever increasing demand.
3 .1 .5 Su m m ary of BAU Scen ario
The model output indicates that the road network in all major work zones in the city (Whitefield, Peenya and Electronics City), including the city Centre are highly congested and no further growth must be permitted in these areas and immediate efforts to improve the transport network to these areas are needed.
The volume to capacity ratios are seen to be above 1.0 on nearly all the links.
Figu re 3 - 3 : V/ C Ratio on al l the Lin k s ( BM A Area) – 2 0 3 1
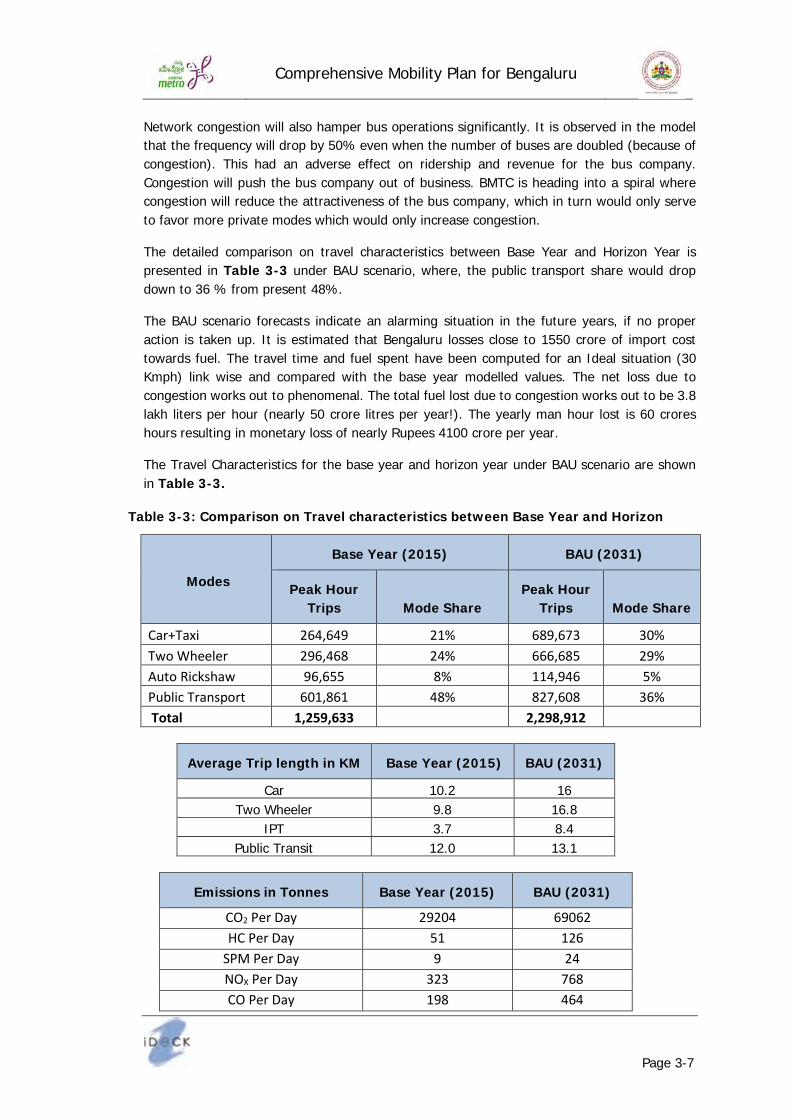
Comprehensive Mobility Plan for Bengaluru
Page 3-7
Network congestion will also hamper bus operations significantly. It is observed in the model that the frequency will drop by 50% even when the number of buses are doubled (because of congestion). This had an adverse effect on ridership and revenue for the bus company. Congestion will push the bus company out of business. BMTC is heading into a spiral where congestion will reduce the attractiveness of the bus company, which in turn would only serve to favor more private modes which would only increase congestion.
The detailed comparison on travel characteristics between Base Year and Horizon Year is presented in Tab l e 3 - 3 under BAU scenario, where, the public transport share would drop down to 36 % from present 48% .
The BAU scenario forecasts indicate an alarming situation in the future years, if no proper action is taken up. It is estimated that Bengaluru losses close to 1550 crore of import cost towards fuel. The travel time and fuel spent have been computed for an Ideal situation (30 Kmph) link wise and compared with the base year modelled values. The net loss due to congestion works out to phenomenal. The total fuel lost due to congestion works out to be 3.8 lakh liters per hour (nearly 50 crore litres per year! ). The yearly man hour lost is 60 crores hours resulting in monetary loss of nearly Rupees 4100 crore per year.
The Travel Characteristics for the base year and horizon year under BAU scenario are shown in Tab l e 3 - 3 .
Tab l e 3 - 3 : Com parison on Trav el characteristics b etw een Base Y ear an d H oriz on
M od es
Base Y ear ( 2 0 1 5 ) BAU ( 2 0 3 1 )
Peak H ou r Trips M od e Share
Peak H ou r Trips M od e Share
Car+ Tax i 26 4 , 6 4 9 21% 6 8 9, 6 7 3 30% Tw o W heeler 296 , 4 6 8 24 % 6 6 6 , 6 8 5 29% A u to Rick shaw 96 , 6 5 5 8 % 114 , 94 6 5 % Pu blic Transport 6 01, 8 6 1 4 8 % 8 27 , 6 08 36 % Total 1,259,633 2,298,912
Av erage Trip l en gth in K M Base Y ear ( 2 0 1 5 ) BAU ( 2 0 3 1 )
Car 10.2 16 Two Wheeler 9.8 16.8
IPT 3.7 8.4 Public Transit 12.0 13.1
Em ission s in Ton n es Base Y ear ( 2 0 1 5 ) BAU ( 2 0 3 1 )
CO2 Per Day 29204 6 906 2 H C Per Day 5 1 126
SPM Per Day 9 24 N OX Per Day 323 7 6 8 CO Per Day 198 4 6 4

Comprehensive Mobility Plan for Bengaluru
Page 3-8
Key observations from the BAU scenario are: • The Vehicular trips increase by more than 2.5 times • The bus frequency would reduce to less than half even with the doubling of fleet • Most links will be operating at V/C ratio greater than 1. The overall network speed (both
direction traffic and all regional roads included) drops down to 8kmph. In the peak direction this is less than 5 kmph - A clearly non- sustainable situation.
• The pollution levels from vehicular emission would increase nearly 3 times
3 .2 Dev el opm en t of Su stain ab l e Urb an Tran sport Scen ario
As shown in the earlier section, the BAU scenario results in increased private trips and decreased Public Transport trips. As per the Ministry of Housing and Urban Affairs guidelines, a sustainable scenario has to be considered to reduce congestion and pollution, while conserving resources like urban space and capital expenditure. Hence, a strategic framework has been developed for the CMP vision of “ efficient and sustainable transport for all” envisaged in Chapter 1.
3 .2 .1 Strategic Fram ew ork f or the Scen arios
Transitioning to pathways of efficient and sustainable urban transportation requires significant, coordinated, and multi-sectoral action. A holistic approach is needed to achieve efficient and sustainable mobility, with multi-sectoral measures that result in avoiding unnecessary motorized trips, shifting a significant proportion of trips to more sustainable modes of transport, and incentivising cleaner and more efficient vehicular technologies to minimize negative externalities while improving accessibility. This requires a wide range of actions at different levels of governance, from promoting more integrated land-use planning and transit-oriented development for reduced travel demand to incentivizing cleaner vehicular technologies through policy and regulation. Shifting travel demand to more sustainable modes also requires a range of push and pull mechanisms that incentivize public transportation and shared mobility, while dis-incentivizing personal transport.
With the rapid growth in urban transport demand in Bengaluru, there is an urgent need to enable environmentally sustainable and economically efficient transport systems that increase accessibility for all urban residents. The traditional approach to dealing with transport demand, with the provision of additional road space to improve vehicular mobility, is no longer sufficient to ensure ease of movement in a sustainable manner. The focus now must be on moving people rather than vehicles, with an integrated and seamless transport system providing modal choice and viable alternatives to personal vehicle use.
The way forward should be to transition away from the current laissez-faire system that subsidises low-occupancy, personal mobility at the cost of public transport efficiency and the quality of the urban environment. The objective is to move towards an efficient and sustainable system that meets mobility needs of all residents of Bengaluru in an equitable manner and complements the growth of the city as the economic engine for the State as well as the Country.
Multiple strategic interventions and specific sets of action are needed to move away from BAU scenario to the vision scenario of “ efficient and sustainable transport for all” . The strategic framework to achieve that vision has been formulated at macro level to allow flexibility in

Comprehensive Mobility Plan for Bengaluru
Page 3-9
delineation of specific action plans, their prioritization, sequencing and implementation in the dynamic urban environment.
Figu re: 3 - 4 : Strategic Fram ew ork f or Ef f icien t an d Su stain ab l e Tran sport
V ision• Ef f icient & Sustainab le Transport f or All
Mission
• Build a multi- modal transport system f or eq uitab le mob ility access and minimiz ed negative ex ternalities
G oals
• I ncrease mode share of pub lic transport in meeting transport demand
• Regain road inf rastructure as pub lic good • Reduce trnasport sector contrib ution to air polution and G HG
emissions
Strategies
• Strategy 1: Ex pand reach and augment capacity of pub lic transport systems
• Strategy 2: I mprove operational ef f iciency of pub lic transport systems
• Strategy 3: Promote multi- modal mob ility options• Strategy 4: Promote Transit Oriented Development• Strategy 5: I mprove ef f iciency of road inf rastructure • Strategy 6: Augment capacity of road inf rastructure• Strategy 7 : Make commuters b ear f ull cost of ex ternalities of
mob ility modes• Strategy 8: I nf luence mob ility choice through regulatory, f iscal
and pricing measures• Strategy 9: Promoting use of electric and cleaner f uel vehicles• Strategy 10: Estab lish mechanism f or planning, capacity
b uilding and accountab ility

Comprehensive Mobility Plan for Bengaluru
Page 3-10
3 .2 .1 .1 Strategy 1 : Ex pan d reach an d au gm en t capacity of pu b l ic tran sport sy stem s
As the city has expanded beyond walkable and cyclable limits, public transport is the most efficient and sustainable mode for supporting equitable urban mobility. While shares of public transport usage was high in Bengaluru, the share has experienced a decline in recent decades due to lowering of speed of busses in view of the congestion caused by private vehicles, and aging and overburdened fleet of busses.
The areas of operations of existing public transport systems, both road-based and rail-based, should be expanded throughout the city to provide convenient mobility options for commuters. At the same time, capacity of existing systems should also be expanded to provide frequent and reliable transit services for commuters during peak and off-peak hours.
3 .2 .1 .2 Strategy 2 : Im prov e operation al ef f icien cy of pu b l ic tran sport sy stem s
While the creation of infrastructure and capacity of public transport is critical, these systems also need to achieve operational efficiency to enhance commuter convenience and to optimize throughput- for instance, the Bengaluru Metro currently has a ridership of 9500 commuters per km per day, whereas it has a potential capacity that is two times this value. Similarly, the BMTC, which has a wide coverage of bus stops and bus routes across the city, can further optimise the frequency of services and on-time performance to provide more reliable services to commuters. Upgradation of the aging bus fleet and driver training for improved safety can further improve performance of the system. Use of the agency’s comprehensive ITS system for data-driven decision making and route rationalisation exercises on a periodic basis will ensure viability and operational efficiency.
There should be a continuing and incentive-based focus by transit agencies on improving operational performance, using technology, innovation and partnerships.
3 .2 .1 .3 Strategy 3 : Prom ote m u l ti- m od al m ob il ity option s
As urban mobility in the city has experienced a shift towards greater personal vehicle ownership and usage, it is necessary to arrest this trend and achieve more efficient, sustainable and equitable mobility by building a system that provides multiple options for quality transport. An effective multi-modal transport system that provides integrated, seamless and safe mobility has been found to reduce personal vehicle usage. This requires infrastructure investments that go beyond road networks for vehicles and include investments in public transport, NMT networks, and rail-based infrastructure. Integration between these different modes is essential to increase ease of access and movement, with multi-modal transit hubs and technology-based applications that provide integrated information and payment systems. By promoting urban transport policies centered around multi-modal mobility, it is possible to build mobility systems that are more diverse, equitable and resilient.
3 .2 .1 .4 Strategy 4 : Prom ote Tran sit Orien ted Dev el opm en t
A strategic goal of bringing at least 25% area of BMA under Transit-oriented development (TOD) is recommended. The TOD would bring together the closely-related urban planning and transport planning sectors, which are currently governed in silos, for facilitating development, including redevelopment of existing areas, through a mix of residential, commercial and recreational land-uses in dense and walkable layouts that are centered around high-quality

Comprehensive Mobility Plan for Bengaluru
Page 3-11
mass transit networks. TOD would promote the use of NMT and public transport trips, while at the same time augmenting ridership of mass transit systems and reducing trips made by private vehicles. Greater integration in the governance of urban planning and urban transport would be needed to promote transit-oriented development and redevelopment in the city.
Other land-use related policies such as mixed land use, job decentralization and urban compaction were analyzed for sustainable goals.
3 .2 .1 .5 Strategy 5 : Im prov e ef f icien cy of road in f rastru ctu re
A large part of the capacity of the road network in the city is blocked in unproductive and inefficient usage, due to improper planning as well as unregulated behaviours. Parking is a key culprit, taking up 25 to 50 per cent of urban road widths- lack of a comprehensive parking policy and insufficient investments in building public parking capacities have resulted in even the most overburdened roads being used for organised and unorganised parking. Lack of parking provision by commercial establishments and individual vehicle owners has led to unregulated residential and commercial parking taking place on roads not designed for the same.
Other factors impacting the throughput efficiency of urban roads include the design of cross roads and junctions. Cross roads at shorter distances and the signalisation of their junctions with arterial roads are contributing to reduced speeds- for example, Dr. B.R. Ambedkar Road and M.G. Road have 5 signals each over distances of 1.5 km and 2.1 km respectively. Poor junction design with inadequate distribution capacity further aggravates throughput inefficiencies. Yet more factors include the non-uniform capacity of roads, flyover ramps occupying normal traffic lanes, lack of bus bays and the location of bus stops close to road junctions, all of which create bottlenecks in traffic flow leading to congestion.
For efficient road networks that work at full capacity and improve the management of traffic flows, it is necessary to free up road space from unproductive uses and enhance throughput of the road infrastructure.
3 .2 .1 .6 Strategy 6 : Au gm en t capacity of road in f rastru ctu re
In addition to inefficient use of road infrastructure, the overall capacity of the road network is also a major constraint. Fast-growing parts of the city along the urban periphery contribute hugely to the population growth, but depend on inadequate and poorly-planned road networks that were not built for current transport demand levels. Urban growth beyond the Outer Ring Road, developed as a major arterial road with a 4 to 6 lane capacity to avoid traffic through the CBD, has resulted in large stretches of the ORR handling vehicle flows up to 2.5 times the road capacity during peak hours. Some of the busiest traffic junctions in the city are on ORR, namely, Hebbal, K.R.Puram and Central Silk Board junction with daily PCU counts of 3 lakh vehicles. This congestion, in turn, puts additional pressure on arterial roads in the CBD areas.
There is a need for augmenting the capacity of arterial roads in the CBD areas, as well as that of the ORR. Planned road infrastructure in the rapidly developing peripheral areas such as Whitefield are also necessary for more equitable road densities across the city. While at-grade augmentation is the default option and should be pursued for peripheral areas, limitations of land acquisition in the CBD require consideration of road capacity augmentation through elevated roads. While major arterial roads leading out of the city have had their capacities

Comprehensive Mobility Plan for Bengaluru
Page 3-12
augmented with the construction of elevated corridors in the past decade (Hosur Road, Bellary Road, Tumkur Road), there has not been much addition to road capacity within the CBD area. All further augmentation of urban road capacity, be it at-grade or along elevated corridors, should pay particular attention to the equitable allocation of road space, and should prioritise movements of public transport vehicles, pedestrians and bicyclists.
3 .2 .1 .7 Strategy 7 : M ak e com m u ters b ear f u l l cost of ex tern al ities of m ob il ity m od es
There are several negative externalities attributed to low-occupancy transport modes such as personal vehicles and certain IPT modes that contribute to increased vehicle kilometres travelled and fuel consumed, With the current laissez faire approach to regulating the usage of inefficient transport modes, the costs of the resulting negative externalities are not borne by the users themselves. Instead, the costs fall disproportionately on commuters that are dependent on walk-based and public transport modes with the encroachment of spaces meant for NMT by parked vehicles and the hampering of movement of public transport vehicles by excess traffic.
The current regulatory and fiscal regime do not account for the costs imposed by inefficient transport modes- for instance, taxi services under the guise of ‘ shared mobility’ enjoy taxes lower than those on public transport and personal vehicles. Based on the principles of fairness and polluter-pays, a new approach is needed which imposes the full costs of negative externalities of given modes on their users in a proportionate manner, to mitigate their impacts on the city and influence more efficient mode choices.
3 .2 .1 .8 Strategy 8 : In f l u en ce m ob il ity choice throu gh regu l atory , f iscal an d pricin g m easu res
Mobility is one of the core enablers of economic growth, and the fulfilment of the mobility needs of all urban residents in an efficient, sustainable and equitable manner is vital. Individuals choose to fulfil their mobility needs using a wide variety of transport modes ranging from single-occupancy personal vehicles to high-occupancy public transport services. These mode choices are often shaped by the regulatory and fiscal framework governing the urban transport system, which has traditionally favoured car-based personal transport. However, the goal of mobility systems should be the efficient movement of people and not that of vehicles, and the governance of the urban transport sector needs to evolve to reflect this objective. Regulatory, fiscal and pricing instruments should be designed to restructure the incentives and dis-incentives that influence commuter mode choices, with efficient and sustainable modes being favoured and prioritised over inefficient ones.
3 .2 .1 .9 Strategy 9 : Prom otin g u se of el ectric an d cl ean er f u el v ehicl es
In spite of favourable climatic conditions, air pollution caused by transport vehicles is becoming a major challenge as the incremental pollution load in Bengaluru is assessed to be the third-highest among all major cities in the country. While the case of e-vehicles, when charged by electricity generated from fossil fuel, in mitigating overall greenhouse gas emissions is debatable, those vehicles certainly can help in mitigating air pollution in a big manner in the city. The strategic intervention should be to set-up measures for increasing use of e-vehicles and CNG vehicles and appropriate electricity pricing for charging of e-vehicles at homes through smart meters.
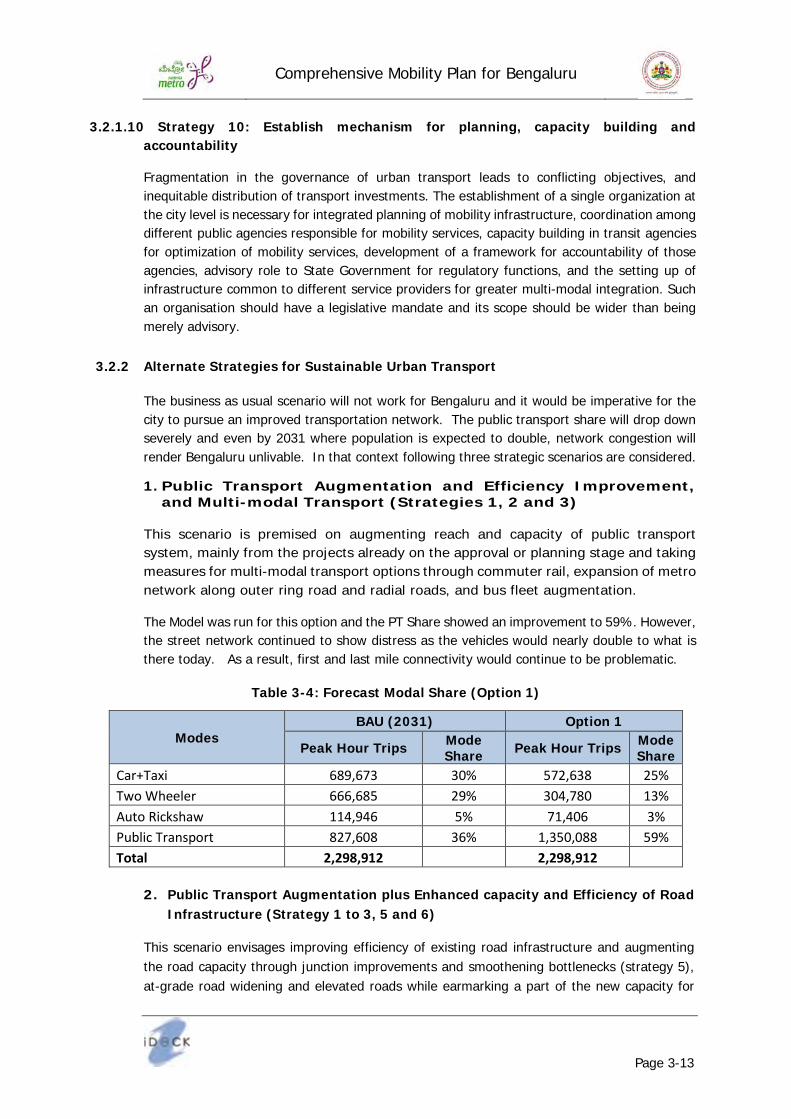
Comprehensive Mobility Plan for Bengaluru
Page 3-13
3 .2 .1 .1 0 Strategy 1 0 : Estab l ish m echan ism f or pl an n in g, capacity b u il d in g an d accou n tab il ity
Fragmentation in the governance of urban transport leads to conflicting objectives, and inequitable distribution of transport investments. The establishment of a single organization at the city level is necessary for integrated planning of mobility infrastructure, coordination among different public agencies responsible for mobility services, capacity building in transit agencies for optimization of mobility services, development of a framework for accountability of those agencies, advisory role to State Government for regulatory functions, and the setting up of infrastructure common to different service providers for greater multi-modal integration. Such an organisation should have a legislative mandate and its scope should be wider than being merely advisory.
3 .2 .2 Al tern ate Strategies f or Su stain ab l e Urb an Tran sport
The business as usual scenario will not work for Bengaluru and it would be imperative for the city to pursue an improved transportation network. The public transport share will drop down severely and even by 2031 where population is expected to double, network congestion will render Bengaluru unlivable. In that context following three strategic scenarios are considered.
1 . Pu b l ic Tran sport Au gm en tation an d Ef f icien cy Im prov em en t, an d M u l ti- m od al Tran sport ( Strategies 1 , 2 an d 3 )
This scenario is premised on augmenting reach and capacity of public transport system, mainly from the projects already on the approval or planning stage and taking measures for multi-modal transport options through commuter rail, expansion of metro network along outer ring road and radial roads, and bus fleet augmentation.
The Model was run for this option and the PT Share showed an improvement to 59% . However, the street network continued to show distress as the vehicles would nearly double to what is there today. As a result, first and last mile connectivity would continue to be problematic.
Tab l e 3 - 4 : Forecast M od al Share ( Option 1 )
M od es BAU ( 2 0 3 1 ) Option 1
Peak H ou r Trips M od e Share Peak H ou r Trips M od e
Share Car+ Tax i 6 8 9, 6 7 3 30% 5 7 2, 6 38 25 % Tw o W heeler 6 6 6 , 6 8 5 29% 304 , 7 8 0 13% A u to Rick shaw 114 , 94 6 5 % 7 1, 4 06 3% Pu blic Transport 8 27 , 6 08 36 % 1, 35 0, 08 8 5 9% Total 2,298,912 2,298,912
2 . Pu b l ic Tran sport Au gm en tation pl u s En han ced capacity an d Ef f icien cy of Road In f rastru ctu re ( Strategy 1 to 3 , 5 an d 6 )
This scenario envisages improving efficiency of existing road infrastructure and augmenting the road capacity through junction improvements and smoothening bottlenecks (strategy 5), at-grade road widening and elevated roads while earmarking a part of the new capacity for
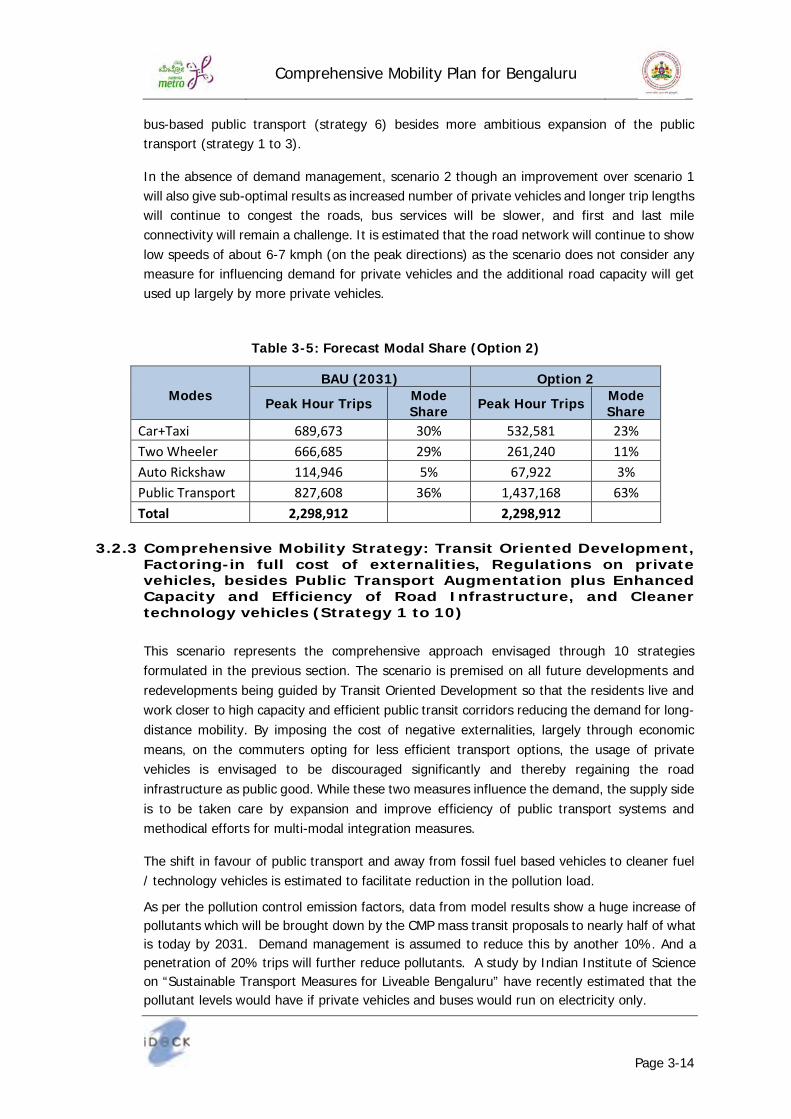
Comprehensive Mobility Plan for Bengaluru
Page 3-14
bus-based public transport (strategy 6) besides more ambitious expansion of the public transport (strategy 1 to 3).
In the absence of demand management, scenario 2 though an improvement over scenario 1 will also give sub-optimal results as increased number of private vehicles and longer trip lengths will continue to congest the roads, bus services will be slower, and first and last mile connectivity will remain a challenge. It is estimated that the road network will continue to show low speeds of about 6-7 kmph (on the peak directions) as the scenario does not consider any measure for influencing demand for private vehicles and the additional road capacity will get used up largely by more private vehicles.
Tab l e 3 - 5 : Forecast M od al Share ( Option 2 )
M od es
BAU ( 2 0 3 1 ) Option 2
Peak H ou r Trips M od e Share Peak H ou r Trips M od e
Share Car+ Tax i 6 8 9, 6 7 3 30% 5 32, 5 8 1 23% Tw o W heeler 6 6 6 , 6 8 5 29% 26 1, 24 0 11% A u to Rick shaw 114 , 94 6 5 % 6 7 , 922 3% Pu blic Transport 8 27 , 6 08 36 % 1, 4 37 , 16 8 6 3% Total 2,298,912 2,298,912
3 .2 .3 Com prehen siv e M ob il ity Strategy : Tran sit Orien ted Dev el opm en t, Factorin g- in f u l l cost of ex tern al ities, Regu l ation s on priv ate v ehicl es, b esid es Pu b l ic Tran sport Au gm en tation pl u s En han ced Capacity an d Ef f icien cy of Road In f rastru ctu re, an d Cl ean er techn ol ogy v ehicl es ( Strategy 1 to 1 0 )
This scenario represents the comprehensive approach envisaged through 10 strategies formulated in the previous section. The scenario is premised on all future developments and redevelopments being guided by Transit Oriented Development so that the residents live and work closer to high capacity and efficient public transit corridors reducing the demand for long-distance mobility. By imposing the cost of negative externalities, largely through economic means, on the commuters opting for less efficient transport options, the usage of private vehicles is envisaged to be discouraged significantly and thereby regaining the road infrastructure as public good. While these two measures influence the demand, the supply side is to be taken care by expansion and improve efficiency of public transport systems and methodical efforts for multi-modal integration measures.
The shift in favour of public transport and away from fossil fuel based vehicles to cleaner fuel / technology vehicles is estimated to facilitate reduction in the pollution load.
As per the pollution control emission factors, data from model results show a huge increase of pollutants which will be brought down by the CMP mass transit proposals to nearly half of what is today by 2031. Demand management is assumed to reduce this by another 10% . And a penetration of 20% trips will further reduce pollutants. A study by Indian Institute of Science on “ Sustainable Transport Measures for Liveable Bengaluru” have recently estimated that the pollutant levels would have if private vehicles and buses would run on electricity only.

Comprehensive Mobility Plan for Bengaluru
Page 3-15
Tab l e 3 - 6 : Forecast M od al Share ( Option 3 )
M od es BAU ( 2 0 3 1 ) Option 3
Peak H ou r Trips M od e Share Peak H ou r Trips M od e
Share Car+ Tax i 6 8 9, 6 7 3 30% 394 , 4 7 2 17 % Tw o W heeler 6 6 6 , 6 8 5 29% 18 1, 126 8 % A u to Rick shaw 114 , 94 6 5 % 4 2, 6 6 9 2% Pu blic Transport 8 27 , 6 08 36 % 1, 6 8 0, 6 4 4 7 3% Total 2,298,912 2,298,912
Tab l e 3 - 7 : Com parison of Em ission s ( in Ton n es)
Em ission s in Ton n es
Base Y ear ( 2 0 1 5 )
BAU ( 2 0 3 1 )
Option 3
Option 2 Dem an d
M an agem en t NM T Al l Bu ses an d Cars Ru n on El ectricity
CO2 Per Day 29204 6 906 2 17 8 8 0 16 092 128 7 4 6 4 37 H C Per Day 5 1 126 28 25 20 10 SPM Per Day 9 24 7 6 5 3 N OX Per Day 323 7 6 8 17 3 15 6 125 6 2 CO Per Day 198 4 6 4 120 108 8 6 4 3
3 .3 An al y sis an d In d icators
This section describes the computation process for the indicators. The specific parameter and the Level of Service has been discussed and presented in Chapter-4.
Summary table of LoS calculated for study area (Overall LoS) is presented in Tab l e 3 - 8

Comprehensive Mobility Plan for Bengaluru
Page 3-16
Tab l e 3 - 8 : Serv ice Lev el Ben chm ark in g Su m m ary
Ex istin g LoS
Option 3 LoS
Rem ark s
Pu b l ic Tran sport Facil ities
2 1 The city has Public Transport system which may need considerable improvements in terms of supply of buses/coaches and coverage as many parts of the city are not served by it. The frequency of the services may need improvements
Non M otorised Tran sport ( NM T) f acil ities
4 2 The city lacks adequate NMT facilities
Trav el speed ( M otoriz ed an d M ass Tran sit) al on g m aj or corrid ors
4 2 Significant approach delays and average travel speed of 1/3 the free flow speed or lower. Such conditions causing a combination of one or more reasons such as high signal density, extensive queuing at critical intersections and inappropriate signal timing..
Park in g spaces 4 3 Paid parking spaces provided in the city need to be improved upon and to cater to the demand some differential parking rates for the CBD have been adopted. The city authorities need to imitative considerable improvements measures.
Road Saf ety 3 1 Level of Fatality rate in a city is very low.
Pol l u tion l ev el s 2 1 Level of pollution in a city is very low.
Note: This is based only on procedure provided in Indices as per the guidelines.
3 .4 Con cl u sion s
The Comprehensive Scenario 3 comprising of 10 Strategic interventions is recommended for optimal, efficient and sustainable transport system for the city. The strategy for solving the complex and serious traffic issues of Bengaluru will be aimed at improving Public transport by the provision of Metros, BRTs (elevated if necessary), and Commuter lines.
Network augmentation will have to be also resorted to, to ensure that Bus Augmentation will have road space on which it has to run efficiently.

Comprehensive Mobility Plan for Bengaluru
Page 3-17
The analysis shows that if the CMP proposals are implemented, the road network would be able to operate at a level of service C and the environmental pollution would drop to half of what is it today.
Pursuing alternate technologies to ensure that harmful gases are further removed can reduce pollution levels to only 20% of what is today.
The implementation of these development strategies will result in improved mobility. The Mode Share predicted is a theoretical analysis of capacities and routes. This will be achieved only through demand management measures or making private mode use less attractive.
The pressure on the public transport network in the central area will experience heavy volumes of traffic in either direction in the peak hour. Spill over from this may badly clog the network. Capacity augmentation of the central links will have to be pursued to meet this huge demand.

Comprehensive Mobility Plan for Bengaluru
Page 4-1
4 Development of Comprehensive Mobility Plan The current mobility eco-system and its trends being unsustainable from economic as well as environmental perspectives, the strategies recommended in the previous chapter to address the root causes of the unsustainability will require a comprehensive set of actions taken in tandem in a time bound manner. This chapter delineates the necessary actions at the conceptual level which may be used to identify ground level improvement and capacity addition works and to formulate the regulatory, fiscal and economic interventions. Initial lists of candidate projects for each strategy have also been proposed.
The comprehensive mobility plan covering first nine strategies recommended as part of Scenario 3 in the previous chapter has been arranged in following twelve themes.
1. Integrated Land Use and Mobility Plan
2. Public Transport Improvement Plan
3. Road Network Development Plan
4. Non-Motorized Transport Plan
5. Multi-Modal Mobility Plan
6. Private Transport Management Plan
7. Freight Movement Plan
8. Technological Measures
9. Travel Demand Management Plan
10. Regulatory Measures
11. Governance Measures
12. Fiscal Measures
The tenth strategy of “establishing the mechanism for planning, capacity building and accountability” is covered in the next chapter in the section related to institutional framework.
4.1 Integrated Land use and Mobility Plan 4.1.1 Revised Master Plan 2031
The integration between the land use plan and the mobility plan is expected to be provided by the Transit Oriented Development (TOD) Policy. The Revised Master Plan 2031 (Draft) (herein after referred as RMP 2031) was formulated without the benefit of the Comprehensive Mobility Plan (CMP) and the TOD policy. The RMP 2031 envisages vision of “a liveable and well governed Bengaluru premised on efficient mobility and vibrant ecology”. The transport strategy of the RMP included pre-eminence of public transport and non-motorized transport with share of public transport being 50% in all trips and 70% in motorized trips, demand management, land-use and transport integration, 20-25% of planning area being under TOD, and interstate bus and rail hubs.

Comprehensive Mobility Plan for Bengaluru
Page 4-2
The RMP 2031 has categorized the BMA in three areas, namely, Planning Area A comprising of the innermost core area falling within Outer Ring Road (ORR), Planning Area B comprising of area between ORR and Conurbation limit of RMP-2015, and Planning Area C comprising of the outermost zone from conurbation limits till BMA boundary. Three growth scenarios were developed for the BMA, namely, Containment Strategy, Corridor Driven Growth Strategy which is TOD led development, Differential Strategy. Finally based on the evaluation, The RMP 2031 seeks to adopt Differential Strategy. The Confinement Strategy was not found suitable to accommodate the projected population. Between the two other strategies, the Differential Strategy has been preferred in the RMP 2031 over the TOD led Corridor Driven Growth Strategy. The Differential Strategy aims to minimise commercialisation in the Planning Area A (city core) and promote economic activities along the periphery of the BMA so that need to travel to core city can be avoided. In spite of the stated goal of promoting TOD, the RMP 2031 seeks to discard Corridor Driven Strategy on the ground of population density and traffic congestion in the Planning Area A being high and infrastructure being inadequate to support higher population density and more traffic.
In absence of the benefit of the TOD policy and the CMP, the land use strategy proposed in the RMP 2031 does not support the intent of TOD and instead seems to encourage urban sprawl without noticing that provision of infrastructure over larger areas at the city periphery away from the transit corridors is going to be more difficult and cost-ineffective.
4.1.2 Transit Oriented Development Policy 2019
Since the formulation of the RMP 2031, a draft TOD policy has been prepared and placed in the public domain for suggestions. That policy is being finalized on consideration of the suggestions received. There is a need to recalibrate the RMP 2031 in the light of the TOD policy and the CMP to ensure integration of the land use strategy and mobility strategy in a harmonious manner.
The policy envisages the vision of “Bengaluru becoming a public transport oriented city that is compact, people friendly, environment friendly and support economic growth while offering a good quality of life. The goals of the policy are aligned to that of the CMP with the major goals being achievement of 70% share of public transport in motorized trips and 60% of the city population living within intense TOD zone. The policy assesses that the goals may require about 600 km of mass transit corridors and development of adequate infrastructure so as to achieve the gross density ranging from 250 to 400 PPH (persons per hectare) along the mass transit corridors by 2031.The major components of TOD framework are density, diversity, design, destination accessibility, distance to transit and demand management. The Executive Summary of the TOD Policy 2019 (Draft) for the city is placed at Annexure 4.1. The proposed TOD led land use is depicted in the Figure 4-1.
The implementation of TOD would include development of capacity of cross road network, NMT, water supply, sewerage and electricity. The cost per km for implementation of TOD would be Rs. 100 Cr.

Comprehensive Mobility Plan for Bengaluru
Page 4-3
Figure 4-1: Transit Oriented Development
4.1.3 Recalibration of the RMP 2031
For facilitating optimum integration of land use and mobility strategies, a recalibration of the RMP 2031 is suggested on following counts.
4.1.3.1 Development Strategy
i. Adoption of Corridor Driven Growth Strategy” instead of “differential strategy”.
ii. Provision of specific incentivization measures for TOD zone of 2km wide corridor on either side of mass transit corridors.
iii. Adoption of TOD led redevelopment and urban renewal strategy for Planning Area A
iv. Facilitation for consolidation of plots in hassle-free manner.
v. Review of setback and height regulation norms.
4.1.3.2 Calibrated densification approach
i. Assessment of capacities of each planning district for densification or opening up for new development.
ii. Densification or new development only when the pre-requisites for infrastructure including mobility infrastructure are in place. Investment at Rs. 100 crores per km. of rail based public transport has been suggested in the action plan to augment the infrastructure for the TOD.

Comprehensive Mobility Plan for Bengaluru
Page 4-4
4.1.3.3 Mobility Infrastructure
i. Incorporation of specific strategy for augmenting road infrastructure and increasing efficiency of existing road infrastructure in core area and in areas which have seen the deficit with reference to RMP 2015.
ii. Demarcation of core road network and public utility network on land use plans and prohibition on any diversion of those earmarked lands.
iii. Earmarking of complementary grid road networks on the land use plans.
iv. Facilitation development of mobility infrastructure through use of town planning schemes.
4.1.3.4 Sustainability Regulations
i. Imposition of less onerous restrictions on infrastructure projects around/near water bodies.
ii. Revisiting concept of heritage building/zone and associated development regulations.
4.1.3.5 Equitable Development
i. Provision for EWS housing / plots as part of each new development instead of seeking 2.5% land to be surrendered to the Planning Authority.
4.2 Public Transport Improvement Plan For achieving the CMP goal of 70% of all motorized trips to be met by Public Transport, proper selection of the PT mode, planning, efficient utilization of the PT infrastructure, and inter-modal connectivity are essential. The rail based mass transit systems are more efficient modes of public transport, but have heavy dependency on other modes for first and last mile connectivity.
The CMP envisages 700 km of public transport network within BMA on dedicated rails, roads, road lanes, traction-guidance, i.e., metro, suburban rail, priority bus corridors, BRTS or Metrolite in addition to augmentation of public bus transport services.
As the public transport modes lead to monopoly situation locking up public infrastructure and investments, the selection of the appropriate mode should be guided by objective and robust assessment of the likely ridership. According to the “Reference Guide, Volume 2: Public Transport”, Ministry of Housing and Urban Affairs (MoHUA), following capacity ranges (expressed as ‘passengers per hour per direction’ – PPHPD) are for the selection of public transport modes:
Table 4-1: Mass Transit System Capacities
Transit Mode Capacity Range (PPHPD)
Bus Rapid Transit (BRT) 8,000 Metrolite 15000 Monorail 15,000 Metro 40,000 Heavy Metro 60,000

Comprehensive Mobility Plan for Bengaluru
Page 4-5
4.2.1 Rail-based Public Transport
The rail-based public transport system is the most efficient mode in terms of usage of road space and sustainable from environmental perspective, but requires high cost and is dependent on last mile connectivity by NMT or motorized transport.
4.2.1.1 Metro Rail Services
4.2.1.1.1 Planning and Implementation
The metro rail network is a mega-infrastructure project which has the potential to reshape the city and its mobility patterns, and to contribute to cleaner urban transport. The CMP envisages setting up 300 km metro network by 2031, as shown in Figure 4-2 and listed in Table 4-2.
Table 4-2: Metro Rail Projects 2031
Sl. No. Metro Corridor Length (km)
1. Phase 1 (Operational)
• EW Line 24 km • NS Line 18 km
42
2.
Phase 2 (Under construction) • EW Line Extensions 22 km • NS Line Extensions 10 km • Electronic City Line 19 km • IIMB Line 21 km
72
3. ORR-Airport Line 58 4. ORR West Line 30 5. Magadi Road (Metrolite - Elevated) 13
6. Whitefield – Domlur Line (Metrolite (Elevated) / MRT)
16
7. Katamanallur Gate – Sarjapura Road –Hebbal (Metrolite (Elevated) / MRT)
52
8. Inner Ring Metro (UG) 34 Total 317 km
Metrolite (Elevated) is suggested as the rail based public transport system for serial nos. 5, 6 and 7 in Table 4-2 above to have a cost effective mobility solution for the likely ridership. The inner ring metro (sl. No. 8) is suggested as the underground system as elevated system is not feasible due to smaller road width. However, this project is premised on Transit Oriented Development becoming the mainstay of urban planning and development in the city.

Comprehensive Mobility Plan for Bengaluru
Page 4-6
Figure 4-2: Metro Rail Network 2031
Planning for the metro rail network needs to consider the requirements of future growth, while its construction needs to be optimized for more efficient implementation. with following measures.
i. Plan new metro lines aligned with the master plan of the city and its areas of growth, keeping in mind the development of economic centres and residential layouts; focus must also be ensured on core areas, where construction may be difficult.
ii. Integrate planning for metro rail with existing transport networks, through physical integration of metro stations with adjacent railway stations and bus terminals.

Comprehensive Mobility Plan for Bengaluru
Page 4-7
iii. Support robust transit-oriented development (TOD) policy and value capture mechanisms for part-financing metro rail projects and lowering fiscal burden on the transit agency.
iv. Fast-track the completion of the Outer Ring Road (ORR) line and the metro lines along main arterial roads.
v. Explore the potential for metro cum road infrastructure, for more efficient and cost-effective infrastructure development.
vi. Enable improved coordination between government agencies to remove roadblocks in land acquisition and construction and to speed up the pace of metro rail implementation and expansion.
4.2.1.1.2 Measures for improving ridership
Metro operations should aim to minimize end-to-end trip times and maximise ridership, with improved connectivity to station catchment areas.
i. Improve operational and fare integration with public bus services for last mile connectivity and an end-to-end public transport network.
ii. Explore the introduction of monthly subscriptions, 10-ticket sets and other products for discounted fares for regular metro commuters.
iii. Improve access to metro stations through elevated walkways to key economic centers up to one kilometer away, nearby, facilitate the development of NMT infrastructure such as continuous pedestrian footpaths and bicycle lanes within a one-kilometer catchment zone.
iv. Create transit hubs at metro stations by physical integration of bus stops, IPT bays and bicycle parking, as well as the provision of electric charging infrastructure and parking for shared mobility services.
v. Minimize transfer times and improve throughput of station areas with real-time passenger information systems, crowd management mechanisms and easy access to last-mile modes, with a prioritization of sustainable modes- bus stops to be closer to station exits than access to parking, for example. Promote shared mobility services for offering additional improvements in connectivity to commuters, through service level agreements with operators.
4.2.1.2 Suburban Rail Services
Bengaluru currently has nominal suburban rail services, which can be augmented significantly by leveraging and supplementing the existing railway tracks by setting up new dedicated tracks within the city, either at grade or at elevation, and supplementing the capacity of existing railway tracks outside the city to suburban towns by automatic signaling and telecommunication, making it a cost-effective option for mass transit. The well-planned suburban rail network integrated with metro network and bus based public transport for multi-modal mobility has the potential to provide affordable and reliable mass transit services that greatly improve ease of connectivity within the city and from the suburban towns. Following specific measures are suggested to enhance ridership and effectiveness.

Comprehensive Mobility Plan for Bengaluru
Page 4-8
i. Fast-track works of enhancing network capacity along the suburban rail route and at stations with track doubling, electrification and automatic signaling works.
ii. Connect to nearby urban areas such as Bidadi, Ramanagar, Tumkur, Hosur, Bangarpet, Doddaballapur, Devanahalli, etc. for easing long-distance daily commutes.
iii. Improve access road connectivity to suburban rail stations, to ensure smooth traffic flows to and from the stations.
iv. Ensure integration with metro rail stations and inter-city rail lines and promote high-quality first and last-mile connectivity to suburban rail stations.
Following 4 corridors within the city on dedicated tracks and their extension to suburban areas through tracks shared with the railways are suggested as part of this CMP. Within the core part of rail network in the city having very high level of utilization of existing tracks for inter-city movement, dedicated sub urban rail tracks have been proposed. However, as the network extends outwards with low utilization of existing inter-city rail tracks, possibility of use of shared tracks by suburban rail and inter-city rail should be explored to optimize the cost.
Table 4-3: Suburban Rail Projects 2031
Sl. No. Suburban Corridor Length (km)
Proposed System
1 Heelalige – Yelahanka – Rajanukunte 46 Dedicated
Track
2 Chikka Banavara – Mattikere - Baiyyapanahalli 25 Dedicated
Track
3 KSR Bengaluru – Yelahanka – Devanahalli 42 Dedicated Track
4 Kengeri – KSR Bengaluru – Whitefield 36 Dedicated Track SHARED TRACK (WITHIN STUDY AREA)
5 Kengeri – Bidadi/ Ramanagar 9 Shared Track
6 Chikka Banavar – Nelamangala (Direction) 6 Shared Track 7 Chikka Banavar – Tumkur (Direction) 7 Shared Track 8 Whitefield – Malur / Kolar 4 Shared Track 9 Rajankunte – Doddaballpur 2 Shared Track SHARED TRACK (OUTSIDE STUDY AREA)
10 Kengeri – Bidadi/ Ramanagar 23 Shared Track
11 Chikka Banavar – Nelamangala 7 Shared Track
12 Chikka Banavar – Tumkur 45 Shared Track
13 Whitefield – Malur / Kolar 51 Shared Track
14 Rajankunte – Doddaballpur 11 Shared Track
Total 314
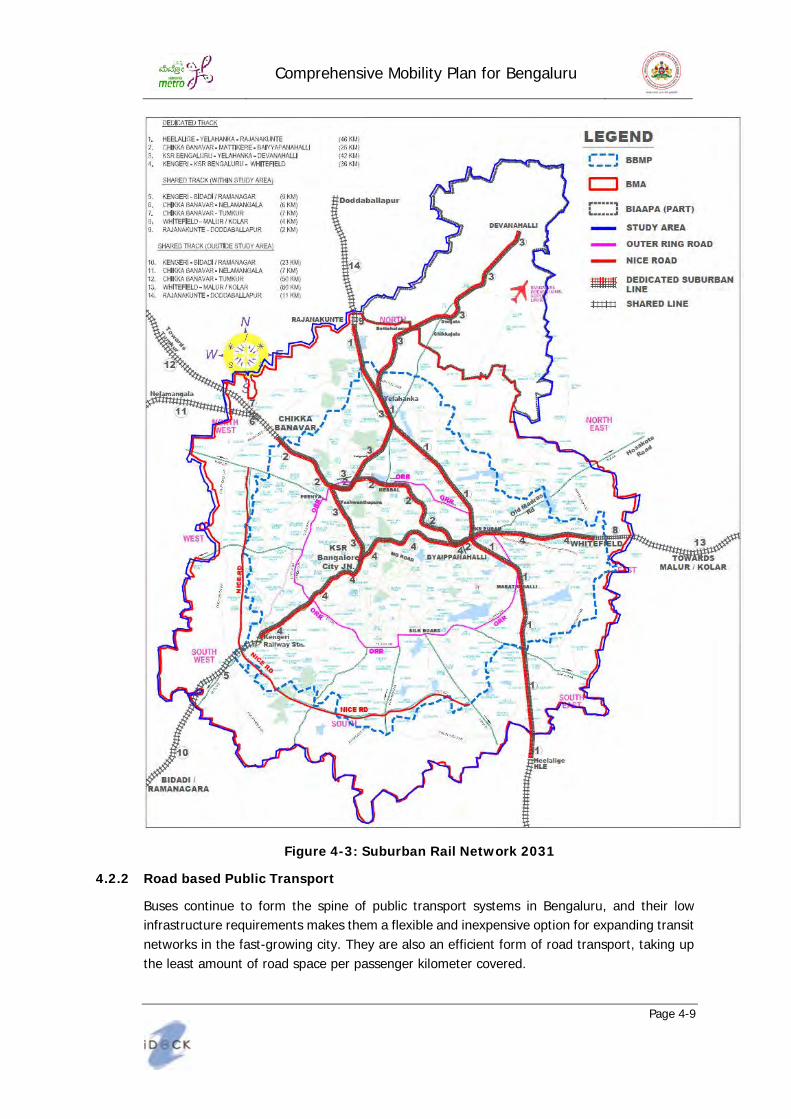
Comprehensive Mobility Plan for Bengaluru
Page 4-9
Figure 4-3: Suburban Rail Network 2031
4.2.2 Road based Public Transport
Buses continue to form the spine of public transport systems in Bengaluru, and their low infrastructure requirements makes them a flexible and inexpensive option for expanding transit networks in the fast-growing city. They are also an efficient form of road transport, taking up the least amount of road space per passenger kilometer covered.

Comprehensive Mobility Plan for Bengaluru
Page 4-10
However, reduced service quality and reliability of bus services due to road congestion leading to average speed less than 10 kmph during peak hours, limited fleet expansion and operational inefficiencies lead to shift away from public transport and contribute to greater traffic congestion.
Greater investments in the city bus network and improved operational efficiencies can incentivize higher mode shares of public transport and ease congestion. Measures are needed to ensure that the capacity and the reach of the operational fleet is adequate to meet the growing travel demand, and this may be done through fleet augmentation and network expansion.
i. Provide priority lanes for public transport busses.
ii. Provide fiscal support or gap funding to BMTC for fleet size augmentation that is commensurate to the growth in population.
iii. Promote zero emission clean-tech vehicular fleet for lower operational costs and social and environmental benefits, and explore cost-effective procurement methods such as leasing contracts and retrofit mechanisms.
iv. Expand bus services to all satellite bus stands for better rural-urban connectivity, and increase capacity of network along the peripheries of the BBMP area.
v. Improved operational efficiency of the public transport network may be achieved through a mix of data-driven and technological improvements to provide higher quality of services to commuters.
vi. Analyse O-D data, occupancy data and other data points provided by ITS infrastructure for periodic route rationalization of the bus network, to improve deployment of network capacity to match demand.
vii. Promote private sector contracting through competitive tendering on routes with heavy losses for lowering operational costs while continuing to provide services for all parts of the city.
viii. Introduce smaller-sized vehicles with capacity of 10 to 20 seats to provide feeder services in interior areas, to improve access to main bus routes and to metro rail services as well as to lower operational costs along low-demand routes.
ix. Support the phase-out of all BS-II and BS-III vehicles in the BMTC fleet, and subject all new fleet procurements to the highest vehicle emission standards. This may also include the adoption of cleaner fuel and electric fleet augmentation.
x. Introduce automated fare collection (AFC) mechanisms along feeder routes and loss-making routes to reduce leakage and to lower operating costs by not requiring the conductor for fare collection; actively supplement the introduction of AFC systems with retraining programs for conductors so that they may be absorbed in the transit agency for other operational requirements over the longer term.
xi. Enable operational integration of bus services with metro services, with bus stops at metro stations and feeder services routed to supplement the last-mile connectivity for the metro network.

Comprehensive Mobility Plan for Bengaluru
Page 4-11
xii. Promote expansion of chartered services whereby BMTC can provide dedicated transport services to IT companies, garment companies and other trip generation centers, thereby reducing dependence on private transport.
xiii. Operationalize the common mobility card for widespread adoption, for integration of fares across all public transit services.
xiv. Use ITS data to support an improved and integrated Commuter Information System which can be accessed at all bus stops, bus terminals and via mobile application, with information on routes, stops and schedules, and real-time updates on bus arrival times and service frequency.
xv. Provide access to operations data to become part of City Mobility Stack, which aims to integrate all mobility services into a seamless urban transport network.
xvi. Public Transport should be prioritized over private modes. Especially in areas such as Road infrastructure, parking, traffic flow directions, restriction of turning movements, etc.
xvii. Provision of smart bus shelters and bus bays are per the IRC 80: 1981 specifications designed based on the number of footfalls which are universally accessible at every 500-1000 m
xviii. Develop supporting access infrastructure facilities to ensure safe access to buses through provision of universally accessible walkways, scientifically designed bus terminals and bus shelters, etc.
4.2.2.1 Priority Corridors for public bus services
Adopting strategic measures such as dedicated bus lanes and bus priority corridors with exclusive lanes for public transport busses would improve the average bus speed from current 10 to 15 kmph to 20 to 25 kmph. In this regard, the following 11 corridors have been identified for the implementation and operations of Bus priority lanes.
Figure 4-4: Bus Priority Corridors

Comprehensive Mobility Plan for Bengaluru
Page 4-12
Exclusive lanes should be earmarked for public transport busses with physical separation based on the available right-of-way (RoW) of 24 meter (6 lanes) or more on these corridors. Strict enforcement measures (preferably by adopting cameras or other automated technology) against violation by private modes must be undertaken.
Table 4-4: Bus Priority Corridors
Sl. No. Corridor Name Length (Km) CATEGORY 1: Corridors with Existing ROW ≥24 meter
1 Outer Ring Road (Silk Board – Hebbal) 30 2 Outer Ring Road (Nayanda Halli - JD Marra) 11 3 Sarjapur Road (Iblur junction - Sarjapura) 19 4 Hennur Road (Cantonment Road - Hennur) 8 5 Hebbala Road (Majestic (KBS) - Hebbala 13
5A Jayamahal Road Cantonment Junction to Mekhri Circle
5
6 Inner Ring Road (SwamyVivekanada Metro Station to Central Silk Board)
10
7 Yeshwantpur-Electronic City via Kengeri (Along outer ring road, old outer ring road, 100 Ft road and NICE road)
53
Category 2: Corridors to be widened 8 Hosur Road (Majestic (KBS) to Central Silk Board) 12 9 Old Airport Road (Majestic (KBS) to Kadugodi) 27 10 Magadi Road (Majestic (KBS) to Gollarahatti) 14
Total 202
In medium term to long term, once metro is established on some of these corridors for example ORR (Sl. No. 1 and 2), Sarjapur Road (Sl. No. 3) etc., exclusive bus lanes on these roads will not be necessary. The focus on those corridors should be on establishing feeder bus services.
4.2.2.2 Bus Fleet Augmentation
As part of the public transport strategy, augmenting the existing city bus services should be considered. The BMTC, at present is operating 6634 buses on about 2500 routes with 10 TTMCs (Traffic and Transit Management Centers) and 45 depots. The bus fleet size should be expanded to 16582 by 2031. 40 new depots and TTMC/ Bus Terminals have been identified within the newly planned areas of BMA. Besides, BMTC should rationalize its routes from time to time in line with the progress in development of mass transit network (metro/sub-urban rail network) to reorient its services towards improving the overall public transport accessibility including first and last mile connectivity and more focus on areas unserved by rail based public transport, in the city. In order to compliment services of the mass transit system, BMTC would also operate smaller feeder services (10-20 seater capacity) which would be conductor free and operating a shorter trip length of 5-8 Km radius.

Comprehensive Mobility Plan for Bengaluru
Page 4-13
Table 4.5: Bus Fleet Requirement
Year Number of Buses (Augmentation + Replacement)
Total Fleet Strength Type of Buses
No. of Depot Requirement
for BMTC
2019 6634 • Standard Buses
- 12 m and 9 m buses - Electric / Diesel - Semi Low Floor / Low
Floor - AC / Non-AC
• Smaller Capacity Buses (10 to 20 seater buses) for first and last mile connectivity.
• Electric Trolly Bus
2021 4250 10609
2025 10600 13000 40
2031 16225 16582 30
4.2.2.3 Bus Rapid Transport System or Metrolite BRTS or Metrolite (traction guided at-grade public transport system) is suggested for Peripheral Ring Road (PRR) and NICE Road. The selection between BRTS or Metrolite will need to be done based on detailed ridership assessment and alternate analysis. The total length of BRTS / Metrolite on NICE road and proposed PRR is 107 km.

Comprehensive Mobility Plan for Bengaluru
Page 4-14
Figure 4-5: BRTS / Metrolite Network
4.2.3 Overall Public Transport Network 2031
The overall public transport network of 803 km length within BMA is envisaged to be established under different modes, as detailed in previous sections on dedicated rails, roads, road lanes, traction-guidance, ie, metro, suburban rail, priority bus corridors, BRTS or Metrolite in addition to augmentation of public bus transport services.
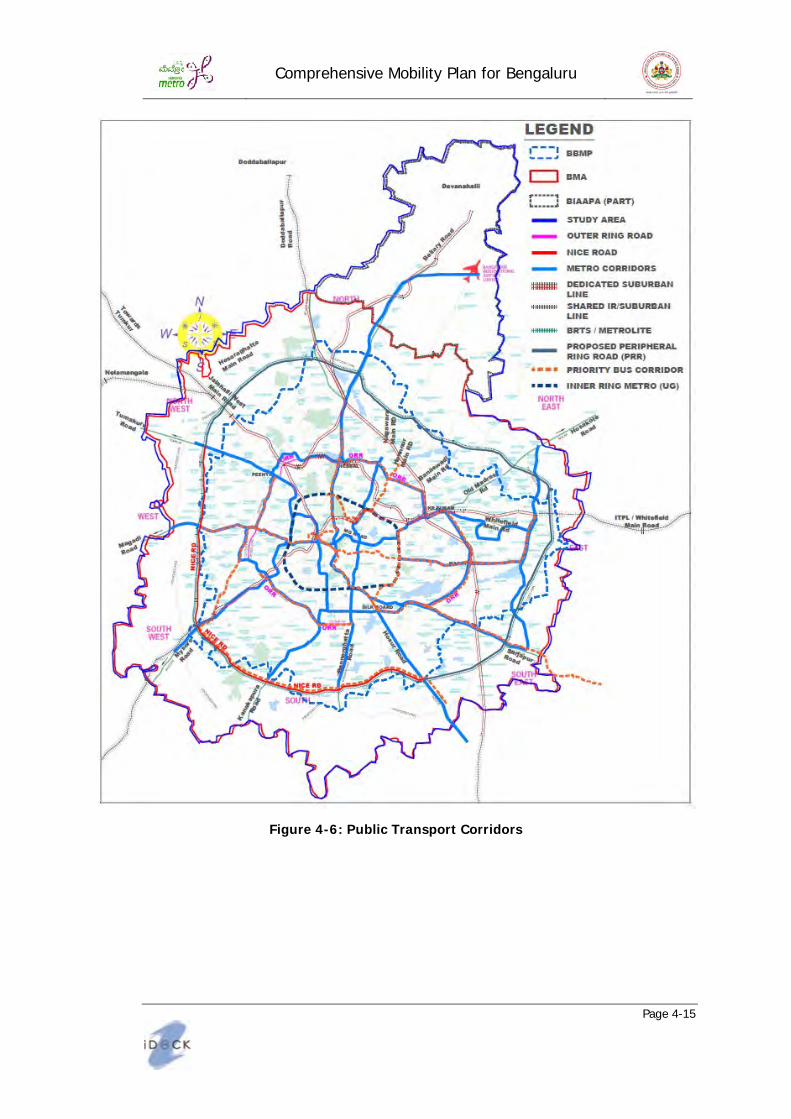
Comprehensive Mobility Plan for Bengaluru
Page 4-15
Figure 4-6: Public Transport Corridors
Comprehensive Mobility Plan for Bengaluru
Page 4-16
Table 4-6: Public Transport Network
Public Transport Mode Network Length (km) Details
Metro 317 Table 4-2
Suburban Rail 177 Table 4-3
Priority Bus Corridor 202 Table 4-4
BRTS / Metrolite 107 Figure 4-5
TOTAL 803
4.2.4 Intermediate Para-Transit and New Mobility
Intermediate paratransit (IPT) and new mobility services increase the supply of mobility in the city, but may also have negative externalities on congestion, air pollution and GHG emissions, depending on their numbers, average occupancy and the quality of vehicles. Regulation of these services should strive to maximize their contribution to mobility in the city while at the same time minimizing their negative externalities. The IPT infrastructure should be provided and integrated with the road network, PT station areas, FoBs and Walkways access points and at designated locations near major activity centers and residential areas.
4.2.4.1 Auto-Services The IPT sector in Bengaluru comprises of auto-rickshaws, which provide an alternative to
personal vehicles for door-to-door connectivity and act as last-mile feeders to and from transit stations. Street hailed and largely driven by individual operators, ease of access and efficiency of the auto-rickshaw mode can be improved by following technological interventions and regulations concerning their governance and usage.
i. Promote higher conversion rate to CNG engines for auto-rickshaws, and initiate engine reforms to address the higher emission of oxides of nitrogen by four-stroke engines.
ii. Introduce electric rickshaw.
iii. Consider vehicle design improvements to enhance road safety of auto-rickshaw occupants, specifically those involved in multi-vehicle collisions which have been found to result in greater injuries for auto-rickshaw passengers.
iv. Incentivize high-quality electric auto-rickshaws through special dispensation of permits, with focus on vehicular quality for eligibility.
v. Allow shared auto-rickshaw services to ply to and from mass transit stations, to reduce the vehicle kilometres travelled and pool trips moving in the same directions.
vi. Regulatory reforms to enable fleet-based operations for dispatch services and app-based services, for improved operational efficiencies through reduced dead kilometres travelled and better demand-supply matching.
vii. Enable location tracking and fleet operations of auto-rickshaws and taxis, enforce sharing of service availability and location data for commuters and parking regulation enforcement, and sharing of necessary operations data for planning authorities as part of the City Mobility Stack.

Comprehensive Mobility Plan for Bengaluru
Page 4-17
4.2.4.2 New mobility New mobility enterprises comprise the range of app-based services that commuters can
access using mobile phones. In Bengaluru, these primarily include on-demand taxi and auto-rickshaw services, short-term bike and car rentals, corporate employee transport services, trip planners and digital fare payment technologies. While a number of new mobility models are currently prohibited by law, including motorcycle taxis, carpooling services and on-demand bus services, it is suggested that regulation of new mobility needs should be more nuanced and progressive, primarily guided by their negative externalities and per-commuter usage of scare road resources. Following specific measures are suggested.
i. Adopt a data-driven and analytical approach to engaging with new mobility business models and regulating their operations.
ii. Promote shared mobility services that have the potential to shift people away from low-occupancy personal vehicles.
iii. Amend the On-Demand Transportation Technologies Aggregator (ODTTA) Rules to strengthen road and passenger safety requirements and include provisions of greater accessibility and service levels for commuters as well as data-sharing requirements with responsible city agencies for improved mobility planning and for inclusion in the City Mobility Stack.
iv. Conduct analysis to understand the necessity for limiting the number of auto and taxi permits in the city and to formulate objective benchmarks.
v. Urban parking policy may have provisions for reserved spaces for shared mobility services, to incentivise their use over that of personal vehicles.
vi. Enable greater public-private partnerships for transport between public transit agencies and the operators of new mobility services. In addition, services such as Heli-Taxi may also be explored.
vii. The tariff or users fees for these modes shall be rationalized with the public transport fares to ensure that they are priced in way that does not reduce public transport uses.
4.3 Road Network Development Plan The road infrastructure in Bengaluru needs quality improvement, design re-engineering and capacity addition in core as well as peripheral areas (areas outside ORR). Maintaining and upgrading the existing road infrastructure across the city to a uniform, consistent level of service is critical to ensuring the smooth flow of traffic and improving throughput of the road network.
4.3.1 Throughput and quality improvement measures:
Re-engineering and upgrading existing road infrastructure is essential to increasing the overall throughput across all parts of the city. To the extent possible, all roads must be redesigned as complete streets that provide adequate space for pedestrians, cyclists, public transport and motorists, with the prioritization of environmentally sustainable modes that minimize the negative externalities of the urban transport sector. A massive effort to redevelop the existing roads on “tender-sure” norms is already under implementation. Those efforts need to be complemented by following measures to improvement the throughput.

Comprehensive Mobility Plan for Bengaluru
Page 4-18
i. Resize the roads to maintain consistent carriageway widths and remove flow bottlenecks on arterial roads.
ii. Develop long distance signal-free corridors on arterial roads that do not have high levels of pedestrian movements, by channelizing traffic from cross roads and constructing underpasses / flyovers without reducing existing capacity due to ramps by acquiring lands as required through direct compensation or TDR measure.
iii. Re-engineer junction design and augment junction capacity, with responsive signal management and consideration of pedestrian flows.
iv. Relocate bus stations away from the junctions to reduce movement across the lanes.
v. All large economic centers and large residential complexes generating large number of commuters should be obligated in their building/ development plan approvals to establish bus and IPT bay within their land with NMT facilities for pedestrians.
vi. Construct bus Shelters, bus bays and IPT bays on all roads based on the catchment area as well as footfalls on the corridors. These infrastructures should be universally accessible as well as ensure safety to women.
vii. Construct long-distance elevated walkways from public transport stations to nearby economic centres.
viii. Provide and maintain road markings and signage consistently across the entire road network to enable safer and more efficient traffic flows by reducing haphazard traffic weaving.
ix. Develop framework for allocation of road infrastructure (sub-surface and above the ground both) for utilities, formulate standard operating procedure for laying and maintenance of utilities.
x. Improve road construction and maintenance practices by bundling longer duration maintenance responsibility.
4.3.1.1 Corridor Improvement Plan
Following corridors are proposed for improving the throughput capacity by adopting the above suggested measures with a view to facilitate a speed of 20-25 KMPH for public transport and convenience for NMT.
Table 4-7: Corridor Improvement Plan
Sl. No Corridor Name From To
Approx. Length (km)
1 Bellary road* Chalukya circle Hebbal Flyover 7
2 Old Madras road Trinity circle Medahalli junction 22
3 Old Airport Road Queens Road Junction
Whitefield 19
4 Tumakuru Road Sangolli Rayanna circle
NICE Road Junction
19
5 Sarjapura Road* Hosur road Carmelram Bridge 9

Comprehensive Mobility Plan for Bengaluru
Page 4-19
Sl. No Corridor Name From To
Approx. Length (km)
6 Hosur road Museum Road Junction
Begur Road Junction
9
7 Hosur Main road – Sarjapura road
Lalbagh Main gate (Lalbagh Police Station)
Agara Junction 9
8 Bannerughatta Road* Hosur road, Anepalya Junction
Kolifarm gate 13
9 Kanakapura Road K.R. Market NICE Road Junction
15
10 Mysore Road Hudson circle Jnanabharathi Junction
9
11 JC road / Lalbagh Main road (one way Loop)
LalBagh West Gate Hudson circle 6
12 Magadi Road* Old Binni Mill NICE road 12
13 West of chord Road* Soap Factory Mysore road 9
14 Outer Ring Road* Full Length 62
Total 220
* Corridors not shown in Figure 4-7
The plan may require selective acquisition of small areas of land for bus bays, junction improvements and removal of bottleneck, but does not entail full-length widening of the corridors. The corridors mentioned in Table 4-7 also includes 12 corridors identified as High Density Corridors (HDCs) in Bengaluru, which carry substantial volume of traffic. Hence, these corridors should be improved and well maintained round the clock to ensure seamless and safe movement of pedestrians, buses and personal vehicles.

Comprehensive Mobility Plan for Bengaluru
Page 4-20
Figure 4-7: Corridor Improvement Plan (Phase 1)
The vision for HDCs are as follows:
• The roads would be operated to ensure maximum throughput is achieved • The roads would provide safe opportunity for all road users to safely use the corridor,
including people of all abilities • The roads would aid in sustaining the environment (low carbon footprint) and economy
of the city
Further, the HDCs are recommended to be improved on the following broad guidelines: • Provide consistent number of lanes and carriageway width, rationalized by traffic
demand, for smooth flow of traffic • Ensure road surface is free of potholes and undulations that could slow traffic • Space out junctions not be less than 500m and where possible avoid providing right
turns at junctions to achieve higher throughput along the corridors. Where right-turning movements are restricted U-turns may be provided downstream appropriately
• Provide rumble strips upstream of a midblock or an un-signalized junction pedestrian crossings to ensure safety of pedestrians
• Provide footpaths with at least 1.8m clear walking space, without any obstructions. More clear walking space may be provided at locations where high pedestrian volumes are anticipated. Ensure footpaths are continuous and have even walking surface
• Provide railings on footpath or median or both as required to ensure pedestrians are protected vehicular movement.
Comprehensive Mobility Plan for Bengaluru
Page 4-21
• Provide FoB’s or subways to facilitate midblock pedestrian crossing, especially on roads with more than 4 lane bi-direction traffic exists
• Provide channelizing islands for streamlining movement of vehicles and for adequate pedestrian refuge
• Place all road signs and markings in a manner that it effectively conveys the message to motorists and ensure that signage does not obstruct pedestrian movement.
• Prohibit on-street parking on the high density corridors. Also prohibit on-street parking and on-street vending 50 m on all major cross streets from the point where they intersect HDCs
• Provide adequate shelters and waiting space at all bus stops, without obstructing pedestrians on footpath
• Establish service level agreement for maintenance of the HDC roads to ensure there is a quick turnover of maintenance works. Entrust maintenance of HDCs to professional agencies
4.3.1.2 Junction Improvements
50 junctions in the study area are critical as the traffic volumes at these junctions have already exceeded capacity during peak hours. Those junctions are proposed for improvements through combination of closure of medians at certain intersections, prohibition of free right turns, provision of adequate sight distance, adequate corner radii, sufficient turning radii, channelizers/division islands, flaring approaches towards intersections, pedestrian and cyclist crossing facilities and signs/lane-markings/lighting, and relocating bus stops away from the junctions. Signal priority for movement of public buses should be desgined and enforced at all major intersections.
Table 4-8: List of Junction Improvements
Sl. No. List of Junctions Sl. No. List of Junctions
1. Vellara Junction 2. Bannerghatta Road – Tilak Nagar Road
3. Football stadium Junction 4. Bannerghatta Road – 39th Main Road
5. Hosmat Hospital Junction 6. Bannerghatta Road-Outer Ring Road
7. Trinity Church Junction 8. Bannerghatta Road-Bilekahalli Road
9. Old Airport Commando Hospital Junction 10.
Bannerghatta Road-BDA 80 Feet Road
11. Ulsoor Road Junction-CMH Hospital Road
12. South End Circle
13. Bhaskaran Road-Old Madras Road 14. RV Road-Inner Ring Road

Comprehensive Mobility Plan for Bengaluru
Page 4-22
Sl. No.
List of Junctions Sl. No. List of Junctions
15. Surunjan Das Old Airport 16. Banashankari Bus Stop Junction
17. 80 Feet Old Madras Road 18. Kanakapura Road-Yediyur Road
19. 100 Feet Old Madras Road 20. 27th Cross – Kanakapura Road
21. Garuda Mall Junction Road 22. Kanakapura Road-Commissioner Office Road
23. Langford Road via Hosur Road 24. National College Junction
25. Bannerghatta Road - Hosur Road 26. K.R. Road – Rathnavillas Road
27. Mysore Road-Bapujinagar Road
28. K.R. Road – Commissioner Office Road
29. Vani Vilas Road - Bull Temple Road 30. K.R. Road-14th Cross
31. Lalbagh West Gate 32. K.R. Road -23rd Cross
33. Ramakrishna Ashram 34. Vatal Nagaraj Road – Rajajinagar Road
35. Lalbagh Road-Hosur Road 36. Chowdaiah Road – 2nd Main
37. Madiwala Police Station 38. Bellary Road – Chowdaiah Road
39. Bommanahalli Road-Hosur Road 40. Queens Circle
41. Lalbagh Road-Wilson Garden 10th Cross
42. Siddapura Road - Lalbagh Road
43. Sarjapur Inner Ring Road 44. K.G. Circle
45. Sarjapur Road- Madiwala Road 46. Bannerghatta Road-Arekere Road
47. Sarjapur Road -Jakasandra Cross Road 48. Inner Ring Road-Arbindo Marg
49. Mysore Road - West of Corridor Road 50.
Webbs Petro Pump Junction-MG Road
51. Gorgunatepalya
4.3.1.3 Foot over Bridges/Walkways
FOBs are proposed at 154 locations to facilitate safe and efficient movement of pedestrians.

Comprehensive Mobility Plan for Bengaluru
Page 4-23
Table 4-9: List of Foot Over-Bridges
Sl. No. List of Junctions Sl. No. List of Junctions
OLD AIRPORT ROAD 1 Old Airport Road Near Marathhalli,
Akash Vihar.
2 Old Airport Road From Magnum Hospital to Konenaagrahara bus stop
3 On Varthur Road near admin gate of HAL, LCA Tejas Division
4 Old Airport Road (HAL post office) – from Post office to HAL.
5 Near Manipal Hospital ,on old air port road
6 HAL Old air port road near Kundalahalli junction.
7 Near ASC Centre and Records, Old Airport Road
8 Varthur main road near Thubarahalli junction.
RACE COURSE ROAD
9
Near Basaveshwara Circle near Race Course Road from Govt RC College compound side to Bharatiya Vidya Bhavan compound side
10 At Race course Road
QUEENS ROAD
11
Near Balekundri Circle (Indian Express on Queen road from Queens road to Park temple from Shivajinagar to Indian Express and to Air Chaina Cunignham Road.
12 Queens Road near Congress Party Office- from Star chamber to Congress committee.
MG ROAD
13 M.G Road, Connect to Boulevard, Rangoli Metro Art Centre 14 Residency road near Bishop Cotton
Girls School.
15
Queens road from Cubbon park corner to KSCA Stadium gate and M.G.Road from Mahatma Gandhi park to Bible Society Compund on M.G. Road.
16 M.G Road Near Trinity junction.
17 Residency road near Ritz Carlton 18 Kensington road infront of M.G.Mall.
19 Brigade Road Junction Moto Royal Arcade
OUTER RING ROAD
20 Outer Ring road HBR layout, 4th and 5th block - BESCOM near Ambedkar ground.
21 Outer Ring road near Sumanahalli.
22 Kamakya theater, Kattariguppe, outer ring road 23 Near Dr. Rajkumar Memorial, ORR
24 Outer Ring road Marathahalli near Kala Mandira. 25 Outer Ring Road near Laggere
Bridge.
26 Bellanduru Central Mall, ORR, Ward no 150 27 Outer Ring road at Forest Office
near Bheema Jewellers.
28 Outer Ring road near Ibaluru junction 29 Outer Ring road near Navajeevan Hospital.
30 Outer Ring road in front of Lumbini Garden. 31 Near croma Showroom.
32 Outer Ring Road near Vijayabank colony. 33 Outer ring road near
B.Narayanapura.

Comprehensive Mobility Plan for Bengaluru
Page 4-24
Sl. No. List of Junctions Sl. No. List of Junctions
34 Kadrenahalli Cross ORR - On ORR - From College to Banashankari. 35 Outer ring road near EMC square.
36 Outer Ring road near Silk board bus stop. 37 Outer ring road near Rambo
hospital.
38 Yogeshnagar Outer ring road intersection, Hebbala 39 Outer Ring road - White Field road
near Phenix Mall.
40 Outer Ring road near ITI Colony Nagarabavi 1st block. 41 Outer ring road Manthri sarovara
apartment.
42 Outer ring road, Near G.B.J. Quarters at Doddanekkundi ward no : 85 (Mahadevpura)
43 Suvarna Badavane juncion.
44 Outer ring road, Karthik Nagara at Doddanekkundi ward no : 85 (Mahadevpura)
45 Kamkshipalya near Chowdeshwari bus stand.
46 Outer Ring Road near BEL underpass. 47 Outer ring road - Kempegowda Arch junction.
48 Outer Ring road near Bannaswadi underpass. 49 Outer ring road K.S Layout
junction. 50 Near Mariyappanapalya junction 51 Near PES College.
52 Little Flower Public School Hosakerehalli ORR - On ORR - From Little Flower Public School to Post office.
53 FTI Road near Modern bread factory.
54 Proposed Skywalk in Outer Ring Road near G R Kalyana Manta Badrappa layout
HENNUR MAIN ROAD
55 Amruth Theatre, Lingrajpuram – from Music world to Arch. 56 Near St. Charles High School, St.
Thomas Town, Bangalore. BELLARY ROAD
57
Ramana Maharshi Meditation Center on Bellary road from Sadasivanagar side to palace Ground Compund side (near Mekhri Circle)
58 B.B Road near MVIT Cross (NH-7).
59 Palace Gutthalli Bus Stop, near Cauveri Theatre (Bellary Road) – from Palace ground to Guttalli Bus stop.
60 B.B Road near Kadiganahalli gate (NH-7).
61 Bengaluru Ballery road near Palanahalli gate. 62 B.B Road near (NH-7) Meenakunte
Hosur Cross.
63 B.B Road near Bharathinagara Cross (NH-7). 64 Hebbala road Bhadrappa layout
Up-ramp. OLD MADRAS ROAD
65 At Old Madras Road, from Benniganahalli to Nagavarapalya 66 New Light junction near K.R.Puram
Railway station.
67 Ramamurthy Nagar, Near Church Bus stop – from Vinayaka Medicals to Jayashree Enterprises.
68 Old Madras road near K.R.Puram R.T.O Office.
69 KR Puram PU College Near National Highway bus stand
HOSUR MAIN ROAD

Comprehensive Mobility Plan for Bengaluru
Page 4-25
Sl. No. List of Junctions Sl. No. List of Junctions
70 Hosur Main Road, Wilson Garden, 10th Cross Junction. 71 Silk board to Hosur road
72 Teachers Colony, Silk board to Agara link road, near JSS college, HSR layout. 73 Near Madivala Police station
junction.
74 In front of Kendriya Vidyalaya School (MEG and Centre) St.John road. 75 Naganathapura junction -
Electronic city.
76 Hosur main road, 7th Cross, near bus stop. 77 Electronic city Phase-2 junction
(Konappana Agrahara).
78
Hosur Main Road near Madivala Shopping Complex – from Total Mall to Police station side and from Total Mall to Hosur road.
MYSORE ROAD
79 Satellite Bus Stand, Mysore Road - Satellite Bus Stand to Ramani Timber Mark.
80 Near Pantherpalya bus stand
81 Mysore road satellite bus stop near Gali Anjanaeya temple. 82 kengeri Bus Stop – from Bus stop
to Kengeri new Bus stop.
83 Mysore Road Near Deepanjalinagar Junction.
MAGADI ROAD
84
Construction of Skywalk with lift near ETA mall and Banana market at tank bund road in ward no 138- Chalavadhi palya J.J.R.Nagar.
85 At Magadi Road from city Railway Metro station to Leprocy Hospital in WNo.120 Cottonpet.
KANAKAPURA ROAD
86 Banashankari bus stand 87 Yediyur Lake, Kanakapura Road in Ward No 167
88 Kadirenahalli Cross, ISRO Layout, Banashankari 2nd stage, Near Dayanand Sagar Institute.
89 Kathriguppe main road near Ganesh Temple.
DODDABALLAPURA ROAD
90 Near NES Junction on Yelahanka - Doddaballapura Road From Auto Stand to Bus Stop
91 Yelahanka Main road - Dodda ballapura main road Puttenahalli .
92 At kempegowda circle. In chowdeshwari ward no: 02 Yelahanka. 93 Anathapura gate - Dodda ballapura
main road TUMKUR ROAD
94 TVS circle- studio road, Near Jalahalli Cross – from Millipore to Indosol Pvt. Ltd.
95
Jalahalli Cross, Tumkur Road (Integrated Skywalk) - From Petrol pump to Bus Stop (On Ring road) and From Bus stop to Bus Stop (On Subrato Mukharji Road).
96 Tumkur road CMTI junction. SARJAPURA ROAD
97 Sarjapura road near Kudremukha Iron Ore company ltd. 98 Haraluru junction -Sarjapura road.
RANDOM LOCATIONS
99 CMR Road and Kammanahalli Road juction 100 Near G.R. Kalyana Mantapa at
Bhadrappa Layout.

Comprehensive Mobility Plan for Bengaluru
Page 4-26
Sl. No. List of Junctions Sl. No. List of Junctions
101 Near Indiranagar 100 ft road and CMH Junction (metro station) from KFC to CMH park & to Metro side
102 MKS Layout, Double Road, near Doddakallsandra Village.
103 Rajaram Mohan Roy Road – from Cubbon park side to Lalbagh side. 104
St. German School to Park and From Yoga Meditation Classes to School.
105 Bhaghavan Mahaveer Hospital, Miller's Road from Pai Vihar to Vasanthnagara and from Playground to TV Tower.
106 Training Battalion-III to Training Battlion - I, MEG & Centre Bangalore.
107 Doopanahalli near 100 feet road. 108 Near Devaiah park junction
109 Near Jayanagar 4th Block (Cool Joint Junction) Integrated Skywalk from College to Shop and to Reliance
110 Near Harichandra Ghat circle
111 Near Patalamma Road in South end circle - On Patalamma Road- From Petrol Bunk to Park.
112
N. R. Colony, Near Colony Bus Stop - On Subramanya Shetty Road -Govt. Hospital to Montessori School.
113 Gandhi bazaar main road from Ganjam to Ladies wear. 114 Indira Nagar Sony Signal Junction
115 Bhethani High school, Koramangala 6th Block, Opp. Koramangala Police Station.
116 Garuda Mall to Home stop in Bangalore city
117 Graphite India Signal to Ginger Hotel 118 Kasturba Road COT Junction.
119 Jayanagar, 9th block near central mall and Big bazaar. 120 Infront of Matri Mall.
121 Near Kathriguppe Arch (near Big Bazar) – from Arch to Shop. 122 Richmond road near Boldwin Girls
School.
123
Construction of Sky Walk with Lift at the site of Grade Separator along Chord Road and 10th Cross Junction, Rajajinagara 1st Block, Ward No 67
124 Nandhi Durga Road near Pottery Circle.
125 Lakshmana puri to Mejestic near Kaveri Hotel Ghadhinagara. 126 Kadugodi - Hosakote main road
near A-1 Fresh Mall, Seegehalli.
127 Chennasandra Circle, Ward No 83-Kadugodi. 128 Sindhi Colony near Thomas Bakery
wheelers Road. 129 Aasyee road near Naidu road. 130 Near Hains junction.
131 Near KC general hospital, Malleshwaram from KC General Hospital to Vidyaranyapura side.
132 Kote cross.
133 New Horizon College of Engineering Kadubisanahalli 134 K.G Road Sagar junction near
Pothis Mall.
135 Mission Road near Flyover - From Photo Shop to Lal Bagh Side. 136 Vatal Nagaraj road near RRR
junction.
137
In front of Sanjay Gandhi hospital in Jayanagar IV Block - from On 32nd Cross Road - From Hospital Gate to Bus Stop.
138 Lalbagh west gate circle Basavanagudi.
139 Near Housing Board Bus stand Kaveri pura ward no: 103. 140 HMT Main Road near Mahalasa
hotel.

Comprehensive Mobility Plan for Bengaluru
Page 4-27
Sl. No. List of Junctions Sl. No. List of Junctions
141 Ist Main road Basaveshwara nagar from Dr|| B.R. Ambedkar Stadium to Judicial layout.
142 ASC Center at junction of Lower Agaram Road and Victoria Road - From ASC to Police chowk
143 In front of St. Theressa school, Sulthan road. 144 Construction of skywalk at HQ, K &
K sub area. cubbon road
145 HMT Main Road, Mathikere – From Nethaji Medical store to Karnataka Bag shop.
146 ITC Factory to Banasawadi Near Sagar hotel, Sarvagna nagar.

Comprehensive Mobility Plan for Bengaluru
Page 4-28
Figure 4-8: Foot Over Bridges

Comprehensive Mobility Plan for Bengaluru
Page 4-29
4.3.2 Capacity addition
Road infrastructure should be judiciously expanded to meet rapidly growing transport demand, while at the same time earmarking a part of the additional capacity for public transport, dis-incentivizing usage by private transport modes. The focus should be on equitable allocation of additional road infrastructure, to ensure that all residents and parts of the city have adequate access to road infrastructure that is well-connected, and to ensure that all modes of motorized and non-motorized transport are accounted for in the design and planning of roads.
The road capacity augmentation should happen hand in hand with management of demand for private modes of transport through appropriate parking policy and charges, congestion fee, etc.
i. Augment road capacity with at-grade widening, wherever feasible, with prioritization of road space allocation for pedestrian movement and public transport for more complete streets. The new areas planned should have wider Right of Way (RoW) than the current practice to meet the future requirement.
ii. Construct elevated roads on east-west, north-south and central ring corridors with adequate capacity, with no section having capacity less than aggregate capacity of sections contributing traffic to that section, and properly designed ramps at regular intervals to enhance connectivity and allow smooth traffic weaving.
iii. Earmark a significant part of the new road capacity, ranging from one-third to one-half, on elevated corridors, PRR, and other new road construction, for public transport exclusively with necessary components such as accessible bus stops, turn-outs for buses at stops, and separated bus lanes.
iv. Impose congestion or user fee on all private vehicles using elevated corridors at any time of the day with telemetry or camera based detection and automatic fee collection system, while encouraging public transport through free entry and subsidizing bus fare to commuters travelling through PT.
v. Prioritize construction of Peripheral Ring Road (PRR) to facilitate future planned growth of the city. Further earmark another Ring Road at least 4-5 kms away from the planned PRR to accommodate future growth of the city.
vi. Develop grid roads, at every 1 km by 1 km, in areas being opened up for fresh development, including those abutting the PRR, through town planning schemes.
vii. Take-up rail cum road infrastructure on arterial and ring roads to reduce adverse impact of exclusive earmarking of road space for rail-based public transport.
viii. Develop alternative route to provide access to the Kempegowda International Airport (KIA).

Comprehensive Mobility Plan for Bengaluru
Page 4-30
4.3.2.1 Capacity augmentation of major junctions and sections
Hebbal junction, Central Silk Board junction and common section of the Outer Ring Road and Old Madras Road between K. R. Puram railway station and Tin factory have traffic volume of more than 3.5 lakhs PCUs per day. The capacity of these junctions is much lower leading to average traffic speed of less than 10 kms per hour during peak hours.
i. Hebbal Junction:
It is proposed to provide additional 3 lane flyovers in either direction from city to airport and from airport to city in addition to the existing flyovers. Additionally, an underpass is proposed to be provided for the traffic from Tumkur to KR Puram.
To provide a dedicated access from the proposed elevated road corridor to the airport flyover through the existing flyovers will be explored.
ii. Central Silk Board Junction:
With setting up of 2 metro stations at this junction, the volume of first and last mile commute from this junction will see a manifold increase besides the existing level of congestion. The already planned elevated flyover on east west access alone will not be able to ease the congestion. Sub-ways to connect north and east axes and augmentation of junction capacity by constructing service roads on existing storm water drains without disturbing the water flow are proposed.
iii. K.R.Puram – Tin Factory – Benniganahally section of ORR & OMR:
This section is likely to see very large increase in first and last mile commute with construction of 2 Metro lines and 2 metro stations. At-grade widening of the road on southern side to be six lanes and northern side to be 5 lanes is proposed. In addition, augmentation of Benniganahalli flyover over the railway tracks by constructing additional 2-lane loop from east to north in Phase-1 of the CMP is proposed. The additional 2-lane loop from north to east may be taken up during phase-2. In view of the proposed suburban rail and additional railway tracks of the new railway line crossing the ORR north of the flyover at a distance of 100 – 150 meters, widening of that section of the ORR is also proposed. The layout design of the K.R.Puram – Tin Factory – Benniganahalli – Kasturinagar section should be done together considering all major projects coming up in the section and the needs of the multi-model integration.
4.3.2.2 Widening of roads
Following major roads are proposed for capacity augmentation by at-grade widening to uniform 6 lanes through Transferrable Development Rights (TDR) and TOD incentives.

Comprehensive Mobility Plan for Bengaluru
Page 4-31
Figure 4-9: Road Widening Plan

Comprehensive Mobility Plan for Bengaluru
Page 4-32
Table 4-10: Road Widening Plan
Sl. No Corridor Name From To Approx. Length (km)
1 Outer Ring Road (signal free and with service lanes throughout)
58
2 Hosur Road Madiwala Police Station
Lalbagh Main Gate
6
3 Kanakapura Road MNK Park NICE Corridor 12
4 Magadi Road Tavarakere MariappanaP
alya 20
5 Doddaballapur Road Yelahanka Rajanukunte 13
6 Hosakote Road Baiappanahalli Hoskote 11
7 SarjapurRoad Agara Lake Sarjapur 15
8 Thanisandra Road Cantonment
Railway Station BagalurMain
Road 18
9 Hennur – BagalurMain Road Frazer Town Bagalur Main Road
18
10 Hosur Road / Bannerghatta Road Richmond Road NICE Road 14
11 Palace Road – Bellary Road Sankey Road Hebbal Flyover 7
Total 192
4.3.2.3 Elevated Road Corridors
There is a need for augmenting the capacity of arterial roads in the CBD areas, as well as beyond the ORR. While at-grade augmentation should be the default option and pursued for peripheral areas, limitations of land acquisition in the core area, i.e., Planning Area A, may require consideration of road capacity augmentation through elevated roads. The elevated corridors should be designed with particular attention to the preferential allocation of road space for public transport vehicles, regulation on private vehicles, and facilitation of inter-modal mobility as brought out in section 4.3.2. The length of proposed elevated corridors is 88 km. Some of the elevated corridors such as North South Corridor (NS), Central Ring Corridor (CC) and 2nd East West Corridor (EW 02) should be reviewed as there is a conflict with the metro corridors. The most cost effective system from perspective of efficient and sustainable mobility solution should be chosen.

Comprehensive Mobility Plan for Bengaluru
Page 4-33
Figure 4-10: Elevated Road Corridors

Comprehensive Mobility Plan for Bengaluru
Page 4-34
4.3.2.4 Peripheral Ring Road
Peripheral Ring Road of 66 km length and 100-meter width is proposed on the north-west periphery of the city with complementary connectivity to NICE Road on the south-east periphery and provision in the middle for BRTS or traction guided at-grade Metrolite. The entire road should be access-controlled, signal free, elevated U & right turns. In addition, the area of 2 km width on either side should be developed following TOD norms.
Figure 4-11: Peripheral Ring Road

Comprehensive Mobility Plan for Bengaluru
Page 4-35
4.3.2.5 Development of Missing Links
Due to unplanned development in the city periphery, the continuity of roads for circulation is hampered to missing links. Such missing links on important roads needs to be identified and developed to improve vehicular and pedestrian circulation in those areas.
4.3.3 Parking Infrastructure
With up to 25 per cent of road width of several roads taken up by parked vehicles, there is a need for comprehensive parking policy and management to improve the efficiency of road usage for traffic flow. Where rules and parking fees exist, they are often limited to certain locations, nominally priced and weakly enforced. This not only contributes to the inefficiencies of urban transport systems but also exacerbates social inequality of road space allocation with the prioritized use of public roads for parking personal vehicles at the expense of free vehicular movement and pedestrian rights-of-way. Provision of parking infrastructure and parking management must consider on-street and off-street parking, and the use of parking policy to dis-incentivize excess use of private vehicles, especially along transit corridors.
On-street parking should get the lowest priority for road space usage, while higher priorities are assigned to NMT infrastructure including footpath, cycle track, cycle stations, bus and IPT bays. The management of on-street parking is an important part of improving the efficiency of road infrastructure use. The rules for on-street parking should be guided by the following considerations:
i. On-street parking to be prohibited entirely on high-density roads that are operating at full capacity or at V/C ratios of 1 and higher, and within 100 metres of all junctions of such roads.
ii. On-street parking on roads with V/C ratio less than 1 should be considered only after ensuring the provision of NMT infrastructure such as pedestrian footpaths and bicycle lanes, transit infrastructure such as bus stops and other curb-side requirements such as emergency vehicle and delivery vehicle zones and designated paratransit zones.
iii. Only short-term parking should be permitted in on-street parking spaces.
iv. Parking spaces on tender-sure roads should be used for bus and IPT bays or at the most for short-term parking with high fee instead of the current practice of long-duration parking.
v. Private vehicle parking: For non-transport vehicles, proof of parking space allocated for new vehicle to be pre-requisite for registration of new vehicles, either in their own residence or at a parking facility. If parking space is being leased at an external facility, details of lease of at least one-year time to be furnished and subsequently updated annually. High penalties to be imposed for non-provision of parking space in violation of building byelaws.
vi. Transport vehicle parking: Transport vehicle owners, be they transport aggregators, private fleet operators, IPT operators or individuals, should be required to show proof of parking prior to registration.
vii. Trip generating economic centres: Large economic centres such as wedding halls, restaurants, movie theatres, shopping centres, etc. that have widely varying traffic

Comprehensive Mobility Plan for Bengaluru
Page 4-36
flows should be obligated to have arrangements for peak load parking, and permits for these land-uses should be contingent on the proof of peak load parking spaces, which may be shared between different trip generators.
viii. Time window of 2 years should be provided for existing vehicle owners to organize and submit proof of parking space availability, failing which penal fee should be charged for on-street parking in residential areas with the proceeds to be used for building pooled parking infrastructure in those areas.
ix. The required changes are to be made in the motor vehicle regulations and municipal corporation byelaws, supplemented by near-real time linking of motor vehicle registration system and building plan approval system to enforce the parking regulations.
Removing most of the on-street parking stock and reallocating road space to more productive uses should go hand-in-hand with the creation of off-street parking, which should provide the greater supply of parking in the city and be guided by the following considerations:
i. Parking supply to be restricted along transit corridors to discourage personal vehicles and incentivise transit use, and rental of parking spaces to be separate from rental of housing or commercial units.
ii. Parking fee to be the principal instrument to discourage use of private vehicles by fixing the fee as close to the economic cost of the parking infrastructure as is practical and enforcing the parking regulations.
iii. Parking fees for off-street parking to be lower than that of on-street parking (where on-street parking is allowed), to ensure that off-street parking is the preferred option for commuters.
iv. Extensive park and ride facilities to be limited to terminal transit hubs, with access to stations in the city centre to be encouraged through walking and feeder services.
v. Mechanical parking and multi-level parking facilities should be considered at main economic centres in view of limited land availability and high cost of land.
Effective enforcement mechanisms are necessary to uphold any regulatory framework for parking. Enforcement officers may be designated to monitor violations in parking and no-parking areas. Technologies such as handheld devices, video analytics and centralised enforcement databases can support more effective enforcement while mobile applications make it easier for vehicle users to reserve and pay for parking.
Currently some public off-street parking exists at locations mentioned below within the core area of Bengaluru. However, these off-street facilities need to be refurbished to ensure that these facilities are well utilized. In, addition to these BMTC has established 10 Transit & Traffic Management Centers (TTMC) across the city and these TTMCs also accommodate some amount of public parking to facilitate park and ride.

Comprehensive Mobility Plan for Bengaluru
Page 4-37
Table 4-11: Existing Off-Street Parking in Core Area to be Refurbished
Sl. No. Location Approximate Capacity (in PCE) 1. Public Utility Building 150 2. Police Grounds (BRV Grounds) 200 3. Garuda Mall 250 4. Basava Bhavan 25 5. JC Road 300 6. SKR Market 120 7. Kalasipalyam 325 8. Chota Maidan 100 9. Mayo Hall 100
Total 1570
Apart from refurbishing the existing off-street parking lots, development of new parking lots within the study area are proposed at the following locations.
Figure 4-12: Proposed off street parking in core areas to be developed

Comprehensive Mobility Plan for Bengaluru
Page 4-38
Table 4-12: Proposed off-street parking in core area to be developed
SI. No. Potential Off street Parking Locations Area Type Approx. Capacity in PCE
1 Krishnarajendra Market Market 300 2 Chickpet Market 250 3 KR Puram Vegetable Market Market 250 4 Sarakki Market Market 250 5 Shivaji Nagar Market 300 6 Yashwanthpur Market Market 300 7 Halasuru Market 250 8 Madiwala Market 250 9 MG Road Commercial 500
10 Commercial Street and surroundings Commercial 300 11 Racecourse Road and Surroundings Commercial 300 12 Gandhi bazaar Commercial 300 13 Jayanagar 4th Block Commercial 500 14 Indiranagar Commercial 500 15 Koramanagala Commercial 500 16 Kammanahalli Commercial 300
17 Outer Ring Road – HSR layout, Mahadevpura, Bellandur Commercial 500
18 Whitefield (ITPL and Surroundings) Commercial 500 19 Malleshwaram Commercial 300 20 Bommasandra Commercial 300 21 Jayadeva Commercial 300 22 Chinnaswamy Stadium Recreation 500 23 Cubbon Park Recreation 250 24 Lalbagh Recreation 250 25 Ulsoor Lake Recreation 250 26 Banashankari Transit hubs 250 27 Nagasandra Transit hubs 300 28 Jalahalli Transit hubs 150 29 Byappanahalli Transit hubs 350 30 KR Puram Railway Station Transit hubs 250 31 Yelechenehalli Transit hubs 300 32 JP Nagar Transit hubs 150 33 Yashwanthpur Railway Station Transit hubs 350 34 Silk board Transit hubs 350 35 Shanthinagar Transit hubs 350 36 Peenya Transit hubs 150 37 Sandal Soap Factory Transit hubs 150 38 Mysore Road Bus Stand Transit hubs 250 39 Kengeri Transit hubs 150

Comprehensive Mobility Plan for Bengaluru
Page 4-39
SI. No. Potential Off street Parking Locations Area Type Approx. Capacity in PCE
40 Surya City Bus depot 250 41 Deepanjalinagara Bus depot 250 42 Subhashnagara Bus depot 250 43 HSR Layout Bus depot 250 44 Gunjuru Bus depot 250 45 Kodathi Bus depot 250 46 Sadarmangala Bus depot 250 47 Koramangala Bus depot 250 48 Jayanagara Bus depot 250 49 Kacharakanahallli Bus depot 250 50 Peenya 2nd Stage Bus depot 250 51 Hebbala Bus depot 250 52 K.R.Puram Bus depot 250 53 Freedom Park 700 54 Jasma Bhavan 150 55 Kumara Krupa Park 450 56 SJP Park 100 57 Football Stadium 150 58 Sukh Sagar 200
TOTAL 17,000
4.3.4 Road Safety
While improving road infrastructure and augmenting capacity of roads, it is imperative to ensure road safety and take measures to minimize crashes. It is proposed that the following strategies and interventions are adopted and implemented scientifically at the city level.
• Adoption of the safe system approach: The safe system approach includes a road transport system that is designed to accommodate human error and protect people from death and serious injury. The cornerstones of this approach are safer roads, safer speeds, safer vehicles and safer road users, all of which must be addressed in order to eliminate fatal crashes and reduce serious injuries.
• Creating a safer system for all: Transport Systems with extensive mass transport, good conditions for walking and cycling and fewer cars on the road driving short distances at safer speeds tend to be safe.
• Speed management: Lower vehicle speeds lessen the risk of fatalities. • Enforcement of safety laws: Road Safety laws have been enacted by the Central
Government. It is proposed to institute appropriate measures to strengthen and improve the quality of enforcement of these laws with support from the city Traffic Police.
• Education and training of road users: It is important to prioritize road safety education, awareness and training for all categories of road users.

Comprehensive Mobility Plan for Bengaluru
Page 4-40
• Campaigns for awareness generation: Regular awareness generation campaigns on the importance of following traffic rules and to propagate good road safety practices among the community are proposed to be conducted at regular time intervals.
• Set output targets for road safety: Establishing specific targets for road safety initiatives at the beginning of the projects will help facilitate evaluation of the interventions and follow-ups.
• Data based approach to road safety: It is proposed that a data-based approach is adopted to improve road safety. Therefore, data collection on road crashes is to be properly coded, entered in a system, processed, analyzed, disseminated and used. Data should form the backbone of the proactive and reactive interventions towards improving safety on roads.
• Road Safety Action Plans: It is proposed that for high risk zones road safety action plans are developed and implemented.
• Post-Crash response: The post-crash response should aim to minimize the long-term consequences of road traffic injury through prompt retrieval and timely and effective treatment and rehabilitation.
• Road Safety Fund that is accrued from cess on MV tax and violation fines in Bengaluru should also be considered to fund relevant CMP projects.
4.4 Non-Motorized Transport Plan A part of all existing road networks should be earmarked and improved for non-motorized transport comprising of walking and bicycling, which are the lowest-impact transport modes with no negative externalities. Encouraging more NMT trips will primarily require the provision of adequate road infrastructure to enable ease of walking and bicycling and ensuring the safety of pedestrians and bicyclists.
i. Invest in the expansion of pedestrian infrastructure such as that mandated by the tender-sure road design, which ensures universally accessible footpaths, minimum footpath widths, and elements of pedestrian safety such as bollards.
ii. Ensure the presence of continuous and well-maintained footpaths and elevated walkways, and curb footpath encroachments across the entire road network with a focus on high-density areas.
iii. Design road networks to provide safe crossings at regular intervals, preferably at-grade and alternately, via elevated walkways.
iv. Prioritize walking and bicycling infrastructure in the catchment areas of transit stations, to promote NMT as the default mode for first and last mile connectivity.
v. As much as possible, provide exclusive bicycle lanes in existing roads and include bicycle lanes in the design and construction of new roads.
vi. Provision bicycle docking and parking infrastructure at regular intervals and integrate docking/ parking infrastructure at transit stations and bus stops.
vii. Ensure seamless and integrated NMT access for all public transport facilities with special care towards women safety.
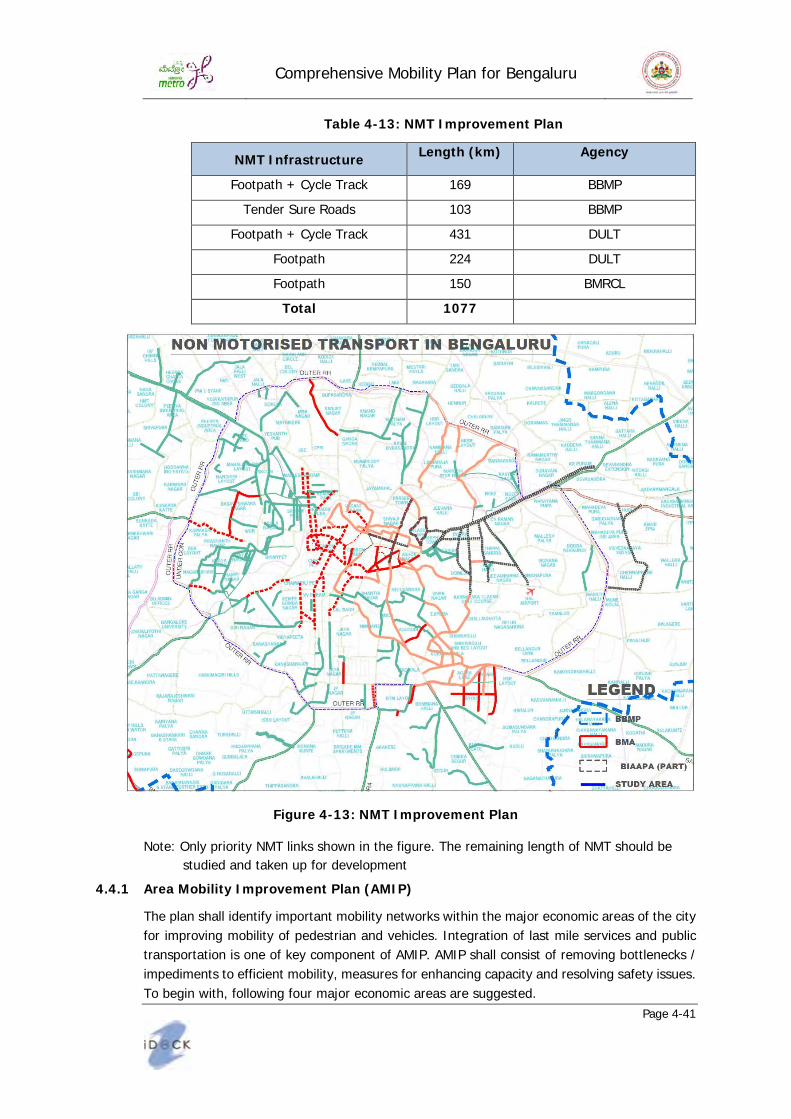
Comprehensive Mobility Plan for Bengaluru
Page 4-41
Table 4-13: NMT Improvement Plan
NMT Infrastructure Length (km) Agency
Footpath + Cycle Track 169 BBMP
Tender Sure Roads 103 BBMP
Footpath + Cycle Track 431 DULT
Footpath 224 DULT
Footpath 150 BMRCL
Total 1077
Figure 4-13: NMT Improvement Plan
Note: Only priority NMT links shown in the figure. The remaining length of NMT should be studied and taken up for development 4.4.1 Area Mobility Improvement Plan (AMIP)
The plan shall identify important mobility networks within the major economic areas of the city for improving mobility of pedestrian and vehicles. Integration of last mile services and public transportation is one of key component of AMIP. AMIP shall consist of removing bottlenecks / impediments to efficient mobility, measures for enhancing capacity and resolving safety issues. To begin with, following four major economic areas are suggested.
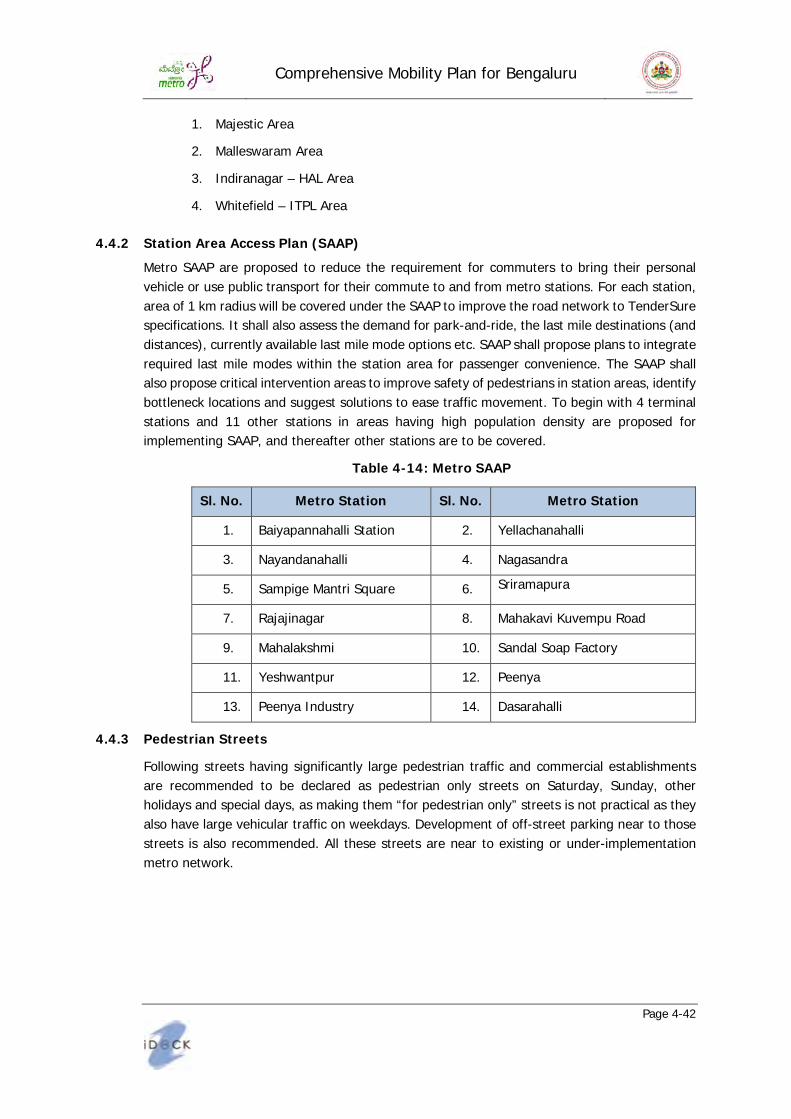
Comprehensive Mobility Plan for Bengaluru
Page 4-42
1. Majestic Area
2. Malleswaram Area
3. Indiranagar – HAL Area
4. Whitefield – ITPL Area
4.4.2 Station Area Access Plan (SAAP)
Metro SAAP are proposed to reduce the requirement for commuters to bring their personal vehicle or use public transport for their commute to and from metro stations. For each station, area of 1 km radius will be covered under the SAAP to improve the road network to TenderSure specifications. It shall also assess the demand for park-and-ride, the last mile destinations (and distances), currently available last mile mode options etc. SAAP shall propose plans to integrate required last mile modes within the station area for passenger convenience. The SAAP shall also propose critical intervention areas to improve safety of pedestrians in station areas, identify bottleneck locations and suggest solutions to ease traffic movement. To begin with 4 terminal stations and 11 other stations in areas having high population density are proposed for implementing SAAP, and thereafter other stations are to be covered.
Table 4-14: Metro SAAP
Sl. No. Metro Station Sl. No. Metro Station
1. Baiyapannahalli Station 2. Yellachanahalli
3. Nayandanahalli 4. Nagasandra
5. Sampige Mantri Square 6. Sriramapura
7. Rajajinagar 8. Mahakavi Kuvempu Road
9. Mahalakshmi 10. Sandal Soap Factory
11. Yeshwantpur 12. Peenya
13. Peenya Industry 14. Dasarahalli
4.4.3 Pedestrian Streets
Following streets having significantly large pedestrian traffic and commercial establishments are recommended to be declared as pedestrian only streets on Saturday, Sunday, other holidays and special days, as making them “for pedestrian only” streets is not practical as they also have large vehicular traffic on weekdays. Development of off-street parking near to those streets is also recommended. All these streets are near to existing or under-implementation metro network.
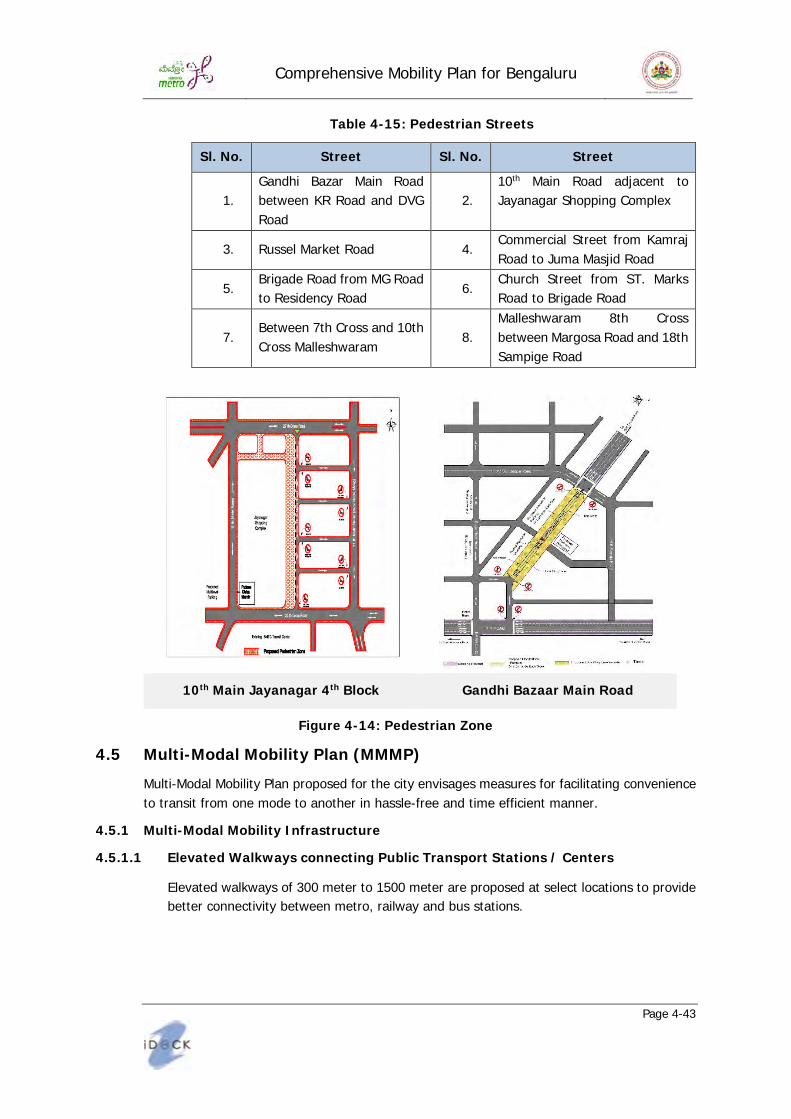
Comprehensive Mobility Plan for Bengaluru
Page 4-43
Table 4-15: Pedestrian Streets
Sl. No. Street Sl. No. Street
1. Gandhi Bazar Main Road between KR Road and DVG Road
2. 10th Main Road adjacent to Jayanagar Shopping Complex
3. Russel Market Road 4. Commercial Street from Kamraj Road to Juma Masjid Road
5. Brigade Road from MG Road to Residency Road 6. Church Street from ST. Marks
Road to Brigade Road
7. Between 7th Cross and 10th Cross Malleshwaram 8.
Malleshwaram 8th Cross between Margosa Road and 18th Sampige Road
10th Main Jayanagar 4th Block Gandhi Bazaar Main Road
Figure 4-14: Pedestrian Zone
4.5 Multi-Modal Mobility Plan (MMMP) Multi-Modal Mobility Plan proposed for the city envisages measures for facilitating convenience to transit from one mode to another in hassle-free and time efficient manner.
4.5.1 Multi-Modal Mobility Infrastructure
4.5.1.1 Elevated Walkways connecting Public Transport Stations / Centers
Elevated walkways of 300 meter to 1500 meter are proposed at select locations to provide better connectivity between metro, railway and bus stations.
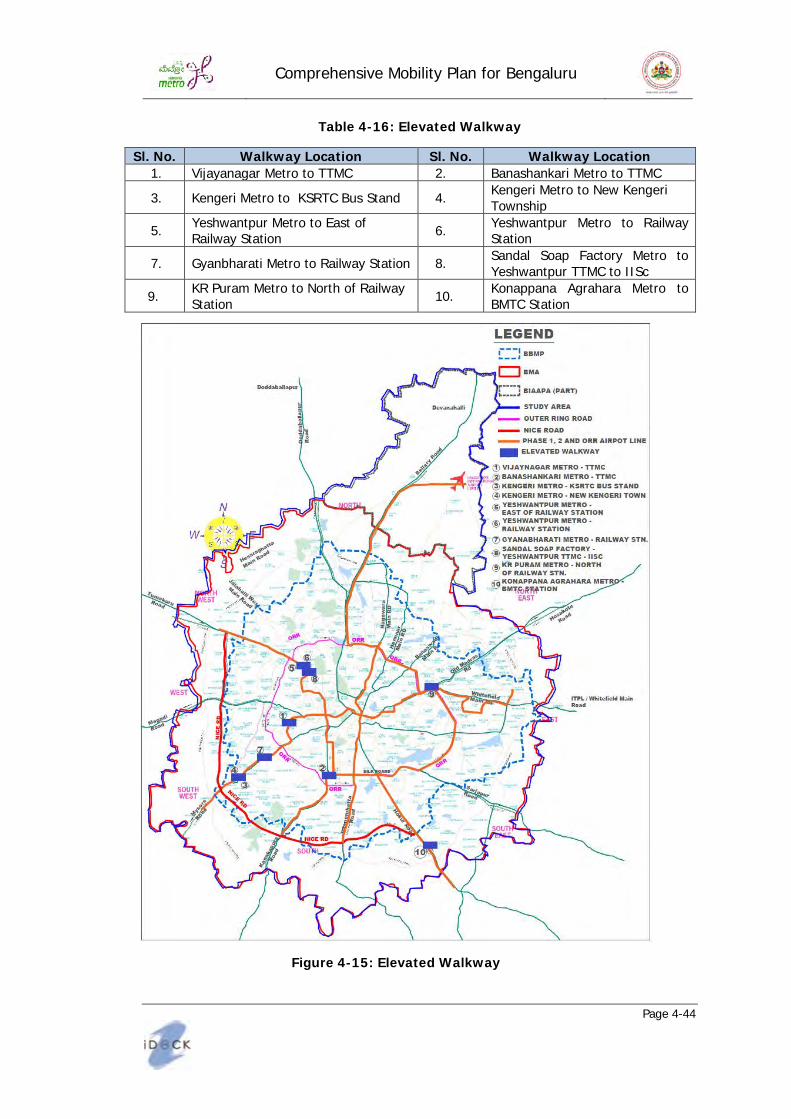
Comprehensive Mobility Plan for Bengaluru
Page 4-44
Table 4-16: Elevated Walkway
Sl. No. Walkway Location Sl. No. Walkway Location 1. Vijayanagar Metro to TTMC 2. Banashankari Metro to TTMC
3. Kengeri Metro to KSRTC Bus Stand 4. Kengeri Metro to New Kengeri Township
5. Yeshwantpur Metro to East of Railway Station 6. Yeshwantpur Metro to Railway
Station
7. Gyanbharati Metro to Railway Station 8. Sandal Soap Factory Metro to Yeshwantpur TTMC to IISc
9. KR Puram Metro to North of Railway Station 10. Konappana Agrahara Metro to
BMTC Station
Figure 4-15: Elevated Walkway
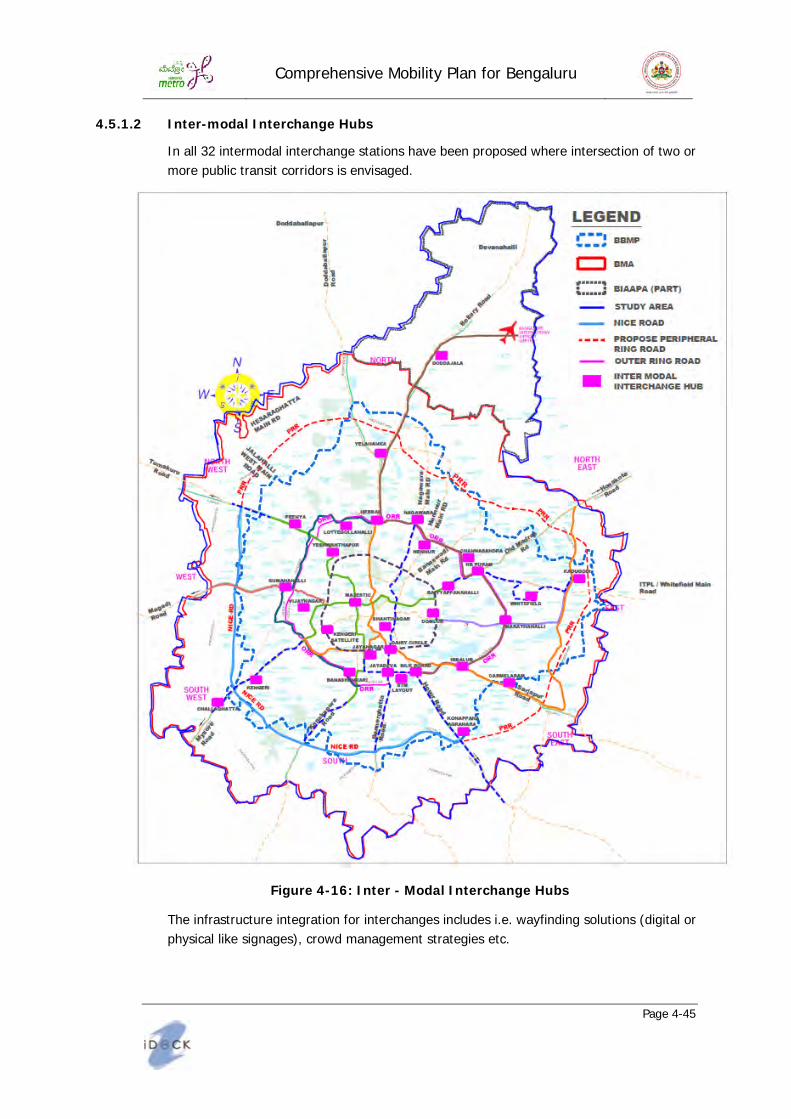
Comprehensive Mobility Plan for Bengaluru
Page 4-45
4.5.1.2 Inter-modal Interchange Hubs
In all 32 intermodal interchange stations have been proposed where intersection of two or more public transit corridors is envisaged.
Figure 4-16: Inter - Modal Interchange Hubs
The infrastructure integration for interchanges includes i.e. wayfinding solutions (digital or physical like signages), crowd management strategies etc.
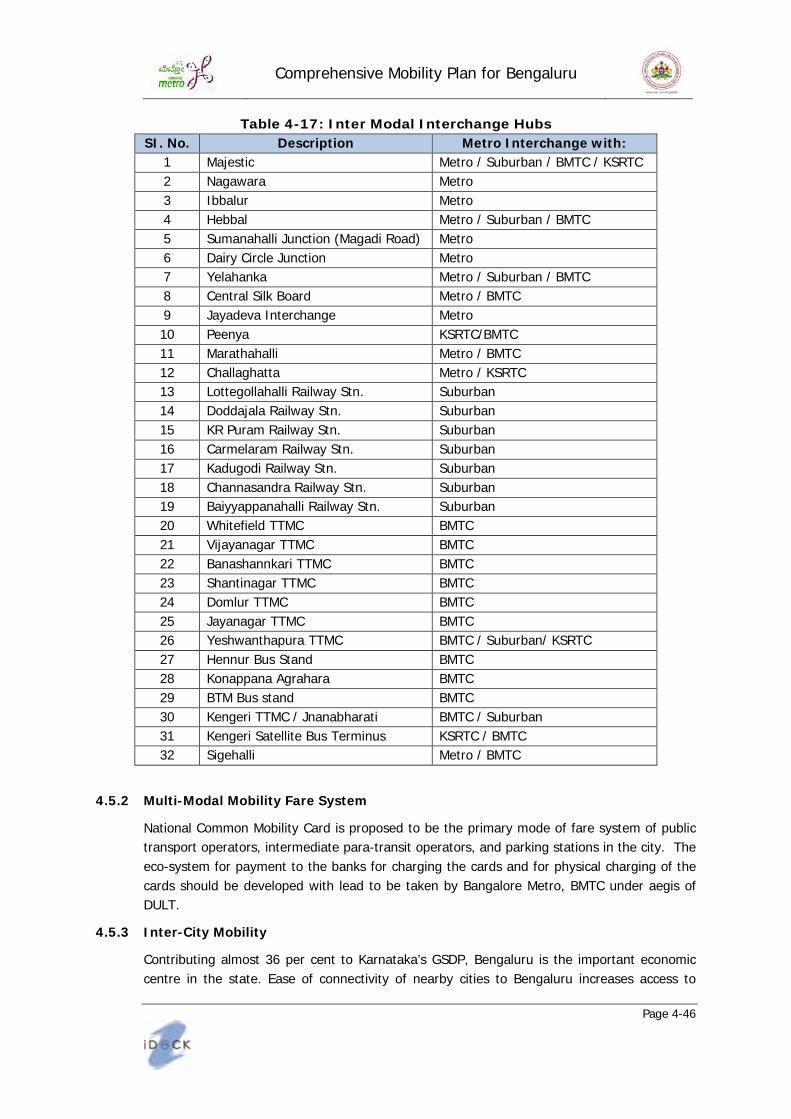
Comprehensive Mobility Plan for Bengaluru
Page 4-46
Table 4-17: Inter Modal Interchange Hubs SI. No. Description Metro Interchange with:
1 Majestic Metro / Suburban / BMTC / KSRTC 2 Nagawara Metro 3 Ibbalur Metro 4 Hebbal Metro / Suburban / BMTC 5 Sumanahalli Junction (Magadi Road) Metro 6 Dairy Circle Junction Metro 7 Yelahanka Metro / Suburban / BMTC 8 Central Silk Board Metro / BMTC 9 Jayadeva Interchange Metro 10 Peenya KSRTC/BMTC 11 Marathahalli Metro / BMTC 12 Challaghatta Metro / KSRTC 13 Lottegollahalli Railway Stn. Suburban 14 Doddajala Railway Stn. Suburban 15 KR Puram Railway Stn. Suburban 16 Carmelaram Railway Stn. Suburban 17 Kadugodi Railway Stn. Suburban 18 Channasandra Railway Stn. Suburban 19 Baiyyappanahalli Railway Stn. Suburban 20 Whitefield TTMC BMTC 21 Vijayanagar TTMC BMTC 22 Banashannkari TTMC BMTC 23 Shantinagar TTMC BMTC 24 Domlur TTMC BMTC 25 Jayanagar TTMC BMTC 26 Yeshwanthapura TTMC BMTC / Suburban/ KSRTC 27 Hennur Bus Stand BMTC 28 Konappana Agrahara BMTC 29 BTM Bus stand BMTC 30 Kengeri TTMC / Jnanabharati BMTC / Suburban 31 Kengeri Satellite Bus Terminus KSRTC / BMTC 32 Sigehalli Metro / BMTC
4.5.2 Multi-Modal Mobility Fare System
National Common Mobility Card is proposed to be the primary mode of fare system of public transport operators, intermediate para-transit operators, and parking stations in the city. The eco-system for payment to the banks for charging the cards and for physical charging of the cards should be developed with lead to be taken by Bangalore Metro, BMTC under aegis of DULT.
4.5.3 Inter-City Mobility
Contributing almost 36 per cent to Karnataka’s GSDP, Bengaluru is the important economic centre in the state. Ease of connectivity of nearby cities to Bengaluru increases access to

Comprehensive Mobility Plan for Bengaluru
Page 4-47
livelihood opportunities for residents of nearby cities and enhances the potential for spreading economic growth. Ease of transportation of passengers and freight are key objectives for inter-city connectivity, which can be achieved by a mix of road and rail-based networks.
i. Provide transit hubs towards the urban peripheries, to enable transfers from personal vehicles and inter-urban bus and train services to local transit services.
ii. Deploy public-private partnerships for the development of quality highway infrastructure linking nearby cities to Bengaluru.
iii. Improve rail linkages and schedules to nearby cities for daily commuting.
Figure 4-17: Inter-City Mobility Hubs

Comprehensive Mobility Plan for Bengaluru
Page 4-48
KSRTC provides the regional/ interstate connectivity from Bengaluru to other parts of the cities and vice versa, while BMTC provides intra-city services.
a) A total of six intra and inter-state bus terminals are proposed on Tumkur Road, Mysore Road, Old Madras Road, Hosur Road, Bellary Road and Magadi Road so that intercity traffic will not get mixed with the city traffic. These terminals will cater to KSRTC as well as private busses plying from neighboring states.
b) A total of 85 Depots/terminals are proposed for extended BMTC bus operations and 4 existing terminals are proposed for redevelopment.
4.6 Private Transport Management Plan The explosive growth in registration of personal vehicles and the corresponding growth in the number of trips fulfilled using personal two-wheelers and cars, has led to negative consequences for congestion and environmental stress. Growing ownership rates of two-wheelers and cars is an indicator of the mode shift to personal transportation, as vehicle ownership is a highly significant factor that impacts mode choice. The imperative for more sustainable and efficient transport is to reduce the number of trips made by personal vehicles by shifting trips to public transport, shared mobility and NMT.
i. Make reserved parking a pre-requisite for new vehicle registrations across the state to raise the bar for ownership and to ensure that vehicles do not take up on-street parking space at residential areas.
ii. Apply parking requirements for existing vehicles, allowing owners two years’ time to find reserved parking spaces for their vehicles, street parking regulations and charge for high demand zones.
iii. Strengthen PUC checks and penalties for polluting vehicles and those emitting smoke; improve enforcement by installation of remote sensor-based PUC system.
iv. Introduce reforms for medium term renewal of personal vehicle registrations, and link documentary requirements such as current address proof, vehicle insurance, PUC and vehicle fitness certificates, to the vehicle registration renewal.
v. For safer driving behaviours and greater traffic discipline, enforce stricter norms for driving license achievement with more rigorous testing, and link traffic violations to drivers’ licenses with appropriate penalties.
vi. Promote regulatory, fiscal and pricing measures to influence usage of vehicles- these could include fuel surcharges, congestion fees, low emission zone fee, renewal fees, insurance premiums based on usage, etc.
vii. Enable the availability of quality public transport services and NMT infrastructure, to provide credible alternatives to personal vehicle usage.
viii. Promote greater integration of urban planning and transport planning, with preference for mixed-use land use planning and more walkable urban design.
4.7 Freight Movement Plan Freight in urban areas today can be classified into two types- large-scale inter-city freight movements with linkages in the city and the growing number of intra-urban logistics and home

Comprehensive Mobility Plan for Bengaluru
Page 4-49
deliveries using commercial vans and two-wheelers, which contribute to traffic congestion and have higher negative impacts on pollution and emissions than private vehicles.
i. Create a decentralized network and hierarchy of logistics and freight transit hubs, not only at the urban peripheries but also in core city areas.
ii. High-volume freight deliveries and truck movements to market areas to be restricted to night-time or off-peak hours.
iii. Impose tax on e-commerce delivery trips to mitigate the negative externalities caused by movements of delivery vans and two-wheelers, with higher taxes on same-day deliveries and other premium delivery methods that may lead to increased vehicle kilometers travelled.
iv. Freight movements not meant for the city to be routed via the PRR or other bypass road networks to prevent entry of high-capacity vehicles into the city.
Freight logistic centers are proposed at locations close to intersections of PRR and NICE road with arterial roads of the city, namely, Bellary Road, Doddaballapur Road, Tumkur Road, Magadi Road, Mysore Road, Kanakapura Road, Hosur Road and Old Madras Road. Subsequently, if need arises, additional freight hub may be considered in BIAAPA limits.

Comprehensive Mobility Plan for Bengaluru
Page 4-50
Figure 4-18: Freight Logistic Centres
4.8 Technological Measures Technological measures encompassing changes in vehicle design, fuel use, energy use, are proposed for better traffic management and reduction in CO2 emissions. Various actions framed for the same are:
a) Smart signalling at intersections
b) Real time information systems for Public Transport

Comprehensive Mobility Plan for Bengaluru
Page 4-51
c) Introduce integrated ticketing system
d) Use of smart parking technologies
e) Creation of infrastructure for transport data management
Technological improvements include advanced applications which, without embodying intelligence as such, aim to provide innovative services relating to different modes of transport and traffic management and enable various users to be better informed and make safer, more coordinated, and 'smarter' use of transport networks.
4.8.1 Intelligent Transport Systems
ITS encompasses all modes of transportation- air, sea, road and rail and intersects various components of each mode- vehicles, infrastructure, communication and operational systems.
Figure 4-19: Schematic Representation of ITS
(Reference: Centre of Excellence in Urban Transport, IIT-M, Intelligent Transport Systems)
Intelligent Transport Systems will include:
a) Advanced Traffic Management Systems (ATMS) integrates various sub-systems (such as CCTV, vehicle detection, communications, variable message signs etc.) into a coherent single interface that provides real information on traffic status.

Comprehensive Mobility Plan for Bengaluru
Page 4-52
b) Advanced Traveller Information Systems (ATIS) provides users of transportation systems both public and private mode users travel related information regarding routes, estimated travel times etc.
c) Commercial Vehicle Operations for constant monitoring of heavy vehicles. It can be in the form of smart cards, weigh bridges etc.
d) Advanced Public Transportation Systems to enhance efficiency of public transit systems through information systems, signal priorities, GPRS etc
4.8.2 Traffic Management Centre
The existing Traffic Control Center on Infantry Road should be integrated with the Integrated Command Control Centre (ICCC) being established under the Smart City Program to facilitate real-time traffic monitoring, dynamic message sign monitoring and control, incident monitoring, traffic camera monitoring and control, active traffic management (ATM), arterial management, traffic signal monitoring and control, automated warning systems, road weather information system (RWIS) monitoring, public transport information and real time route information.
Figure 4-20: Schematic Representation of TMC
4.8.3 Smart Signalization
Smart signalization at all major junctions in the city with conversion of all existing signals into smart signals with adaptive traffic signal controls should be taken up to reduce delay and queuing, efficient movement of pedestrians and cyclists, maximizing vehicle movement, reduce severity of crashes, and improve accessibility to pedestrians and side street traffic.

Comprehensive Mobility Plan for Bengaluru
Page 4-53
4.8.4 Vehicle Technology
As a green initiative to move towards sustainable urban transport, technological transformation for public transport and IPT vehicles is suggested by gradually phasing out diesel vehicles to CNG or electric vehicles. In this initiative, BMTC would convert all its premium (A/C) bus services to electric and subsequently covert the non-A/C buses to electric in a phased manner. The State Government shall support the public transport operators to convert the bus depots to meet requirements of electric buses. The State Government shall also strive to create infrastructure for charging of electric vehicles at vantage points like parking lots, existing fuel stations to facilitate faster adoption of electric fleet among IPT operators.
4.9 Travel Demand Management Plan Travel demand management measures are proposed (excluding provision of major infrastructure) to modify travel decisions so that more desirable transport, social, economic and environmental objectives can be achieved, and the negative externalities can be minimized. The combination of TDM strategies and policies are expected to help in reducing travel demand or redistributing this demand in space or in time. The proposed TDM strategies are road space reallocation aiming to re-balance provision between private cars and other sustainable modes, road space rationing by restricting travel at certain times and places, car parking controls and pricing, parking strategies, flexi-time work schedules with employers to reduce congestion at peak times, workplace travel plans, introducing active trip reduction programs, and public education and awareness programs.
4.10 Regulatory Measures Regulations for urban transport need to be aligned with one another and designed to achieve system objectives of greater efficiency and sustainability. The regulatory framework must include the right mix of incentives and dis-incentives to influence commuter behaviour and the operations of public and private mobility providers. Permit specifications and number of permits for different mobility services, fare regulations, vehicle specifications for fuel consumption and emission levels, vehicle testing and maintenance standards, speed and other safety regulations, data sharing standards and integrated planning requirements- all comprise different tools available to the state regulator for providing access to safe and sustainable mobility for the maximum number of people.
i. Parking rules and regulations set up entry barriers for vehicle ownership and usage, which in turn can support more sustainable mode choices provided that credible alternatives exist.
ii. Regulatory reform is needed around personal vehicle registration, renewal, inspection and maintenance to ensure that emitting vehicles are removed from the roads, road safety is improved, and the costs of vehicle use are proportionately levied on owners.
iii. Regulatory reform for public transport should focus on permitting public-private partnerships and contracting of private bus services for capacity augmentation.
iv. Explore the potential for fare regulations to promote integrated fares between public transport services and enable payment integration across all mobility services using the common mobility card.

Comprehensive Mobility Plan for Bengaluru
Page 4-54
v. Mandate data integration of operations of different mobility services through a City Mobility Stack, which helps commuters by providing integrated information on service availability and options and helps service providers and planning agencies to use data analytics for operational decision making.
vi. Necessitate integrated planning for infrastructure projects, between different transport networks as well as inter-sectoral integration between urban and transport planning.
vii. Mandate the inclusion of pedestrian footpaths, bicycle lanes and bus lanes in all new road construction.
viii. Augment strength and deployment of traffic police personnel as necessary, for traffic management and enforcement of rules and regulations.
ix. Promote the greater use of technology for regulatory enforcement, using integrated databases for tracking and linking violations with driving licenses, and data capture tools such as video analytics, sensors and other solutions for automated enforcement.
x. Regulate standards for road design, construction and maintenance.
xi. Take up town planning schemes for orderly development of green-field and brown-field areas.
4.10.1 Levy on usage of road resource
Even as the road network is improved and expanded, the costs of road usage should be applied to users, to ensure efficient usage and to dis-incentivize any travel demand induced due to the availability of good mobility networks. At the same time, strict enforcement of traffic rules is necessary for safer roads for all users.
i. Regulatory and pricing measures such as dynamic congestion fees and parking fees to be applied in areas experiencing high traffic congestion and peak volumes.
ii. Robust traffic management to be instituted and penalties levied, to encourage adherence to traffic rules and lane discipline; violations to be linked with driving license and vehicle registration, with suspension of license of repeat offenders.
4.10.2 Fare regulations for urban transport
Fare-setting for public transport systems and the application of fare structures for IPT and other shared mobility services are sensitive and complex tasks. Fares must strike a balance between commuters’ interests of affordability and service quality, the financial viability of public transport operators, the inclusion of costs of negative externalities to be borne by users of different transport services, and ensuring adequate market competitiveness for mobility companies. Currently, there is no integrated mechanism for a scientific and independent process, though fare regulations exist for public transport, IPT and transport aggregators in the state. It is hence suggested that an independent authority, potentially under the aegis of the BMLTA, may be constituted to determine and regulate fares of transport services in the city.
4.10.3 Data-sharing standards for urban transport
Urban transport systems are seeing a profusion of data being generated that could significantly improve evidence-based urban and transport planning, and enable unobtrusive enforcement of regulations. Data sets include trip data of modern transport aggregator services and public

Comprehensive Mobility Plan for Bengaluru
Page 4-55
transport services held with the respective companies or transit agencies; license, vehicle registration and permits data held with the Transport Department; road network, parking, land-use and plot level data held with the BBMP and BDA; traffic violations and accidents data with the BTP. Bringing together these data sets currently held in silos by various public and private agencies, as well as opening up anonymized transport data to the public, can promote integrated mobility planning as well as innovation for the development of better commuter services.
The following principles may guide the data-sharing framework:
i. All public transport vehicles and rail-sets, IPT vehicles and four-wheel private vehicles should be obligated to telemetry-based tracking as they use the public road space.
ii. The locational and occupancy data about public transport and IPT vehicles should be placed in the public domain on an open platform for use by different transport agencies and IT-based transport support service companies.
iii. The data of the commuters must be non-personal and anonymized to protect all individuals.
iv. The data regarding drivers of vehicles on the roads should be available to regulatory agencies.
It is recommended that BMLTA may be strengthened with statutory powers and exclusively entrusted to oversee the set-up of the City Mobility Stack, and to establish a trusted legal and governance framework for data collection, sharing, and use of mobility data, which protects the interests of residents, commuters and transport operators. This framework should lay down and enable enforcement of standards for collection and sharing of necessary data generated by IPT and public transport services, be it for use by specific planning authorities or for sharing as ‘open data’. The framework should also oversee the usage of the data for efficient and integrated mobility planning. Owing to concerns of privacy and data protection and security, the data collected should be protected by a robust privacy framework which would ensure that the collected data is anonymized and safely stored to prevent any misuse.
4.11 Governance Measures Fragmented governance of urban transport sector has led to inequities of investment and competing interests- for example, the provision of metro services, suburban rail services and public bus services should be complementary to one another and collaborative rather than competing, which may not be the case if they are governed by wholly independent agencies. Moreover, transport demand is generated by the locations of homes and jobs in the urban planning of the city, whereas transport supply is provided through transport planning- it is essential to integrate urban and transport planning to better regulate the growth of transport demand and design more pedestrian friendly and transit-oriented cities.
i. Strengthen existing BMLTA committee as an authority with representation from all transit agencies, urban planning bodies and empower the authority with adequate fiscal and regulatory power to achieve objectives of integrated urban transport planning and development.

Comprehensive Mobility Plan for Bengaluru
Page 4-56
ii. Enable the integration of the city bus services with the rail-based metro and suburban train networks, for seamless transit connectivity.
iii. Build capacity for data-driven decision making and integrated planning among transit agencies and the BMLTA
iv. Mechanism for effective enforcement of building bye-laws with public crowd sourcing of monitoring and prohibitively high penalties should be put-in place to create the demand for TDR and premium FAR.
4.12 Fiscal Measures Fiscal policies work in complement with regulations and standards to minimize the negative externalities of transportation. Equally important, they generate revenues for investment in transportation. The objective of fiscal measures and user fees should be to incentivize sustainable choices and align user costs to reflect the costs of their mode choice. In Bengaluru, where the mode share of public transit is eroding and the shift to personal vehicles accelerating, a comprehensive policy of fiscal and pricing measures can serve to incentivize investment in cleaner vehicles, penalize emitters and polluters, induce more sustainable mode choices for more numbers of trips, and reduce the number of vehicle kilometres driven. As such, comprehensive fiscal reform combined with a diverse, multi-modal transport system can balance individual commuter well-being with that of the city.
i. Explicitly link motor vehicle tax for new vehicle purchases to fuel efficiency and emissions standards, with additional fees for bigger cars and SUVs and exemptions for cleaner energy vehicles including hybrids and EVs.
ii. Introduce dynamic pricing instruments to capture and charge vehicle usage-
a. Fuel taxes for each litre of fuel consumed
b. Insurance premiums based on vehicle usage with higher premiums for higher usage
c. Congestion fees and road pricing for each instance of road usage
d. Parking fees that are time-based and demand-based
iii. Institute annual renewal fees for vehicle registration and link them with the pollution emission and fuel efficiency of the vehicle, and ensure that strict action is taken against polluting vehicles.
iv. Institute friendlier tax environment on inputs for public transport operators and determine the fare from twin perspectives of affordability for commuters and financial sustainability for the operators.
v. Provide support for capacity augmentation.
vi. Reform the taxation of motor vehicles to become a function of road usage efficiency; public transport vehicles to have the lowest tax rate, and IPT to be taxed at higher rates based on the vehicle capacity and road usage efficiency and duration. Explore possibility of lower taxation for vehicles registered for use on weekends only.

Comprehensive Mobility Plan for Bengaluru
Page 4-57
vii. Deploy transit-oriented development along all mass transit corridors to generate revenues for funding infrastructure growth.
Revenues generated from fiscal policies and pricing instruments should be used for investment in cleaner and more efficient transportation systems. In Bengaluru, investments can be made in upgrading and expanding public transport systems and constructing continuous and accessible NMT infrastructure.
4.13 Action Plan and Budget Plan
The mapping of the strategic framework to the Action Plan has been detailed in the matrix below.

Comprehensive Mobility Plan for Bengaluru
Page 4-58
Table 4-18: Strategy-Action Plan Matrix
Action Plan
Strategy 1
Strategy 2
Strategy 3
Strategy 4
Strategy 5
Strategy 6
Strategy 7
Strategy 8
Strategy 9
Strategy 10
Expand reach and augment capacity of public transport systems
Improve operational efficiency of public transport systems
Promote multi-modal mobility options
Promote Transit Oriented Development
Improve efficiency of road infrastructure
Augment capacity of road infrastructure
Make commuters bear full cost of externalities of mobility modes
Influence mobility choice through regulator, fiscal and pricing measures
Promoting use of electric and cleaner fuel vehicles
Establish mechanism for planning, capacity building and accountability
Integrated Land Use and Mobility Plan
Public Transport Improvement Plan
Road Network Development Plan
Non-Motorized Transport Plan
Multi-Modal Mobility Plan
Private Transport Management

Comprehensive Mobility Plan for Bengaluru
Page 4-59
Action Plan
Strategy 1
Strategy 2
Strategy 3
Strategy 4
Strategy 5
Strategy 6
Strategy 7
Strategy 8
Strategy 9
Strategy 10
Expand reach and augment capacity of public transport systems
Improve operational efficiency of public transport systems
Promote multi-modal mobility options
Promote Transit Oriented Development
Improve efficiency of road infrastructure
Augment capacity of road infrastructure
Make commuters bear full cost of externalities of mobility modes
Influence mobility choice through regulator, fiscal and pricing measures
Promoting use of electric and cleaner fuel vehicles
Establish mechanism for planning, capacity building and accountability
Plan Freight Movement Plan
Technological Measures
Travel Demand Management Plan
Regulatory Measures
Governance Measures
Fiscal Measures

Comprehensive Mobility Plan for Bengaluru
Page 4-60
Each agency will be required to delineate its action plan, prioritize the projects with multi-year phasing, prepare cost estimates, identify funding sources including its own budget and supplementary funding from Bengaluru Urban Transport Fund (BUTF), decided mode of implementation including public-private partnerships, and bring its rolling three-year plans before BMLTA for appraisal and appropriate recommendations to the competent authority for approval.
4.14 Monitoring and Evaluation Plan For each project brought before BMLTA by the concerned agency as part of its multi-year rolling plan, the agency may be asked to prepare a design and monitoring framework (DMF). The format and the guidance note for the DMF are placed as Annexure 4.2. For continuing access to supplementary funding from the BUTF, submission of the project specific DMF at the time of seeking appraisal and thereafter submission of the evaluation of the implemented projects with reference to the DMF while seeking approval for the successive rolling plan may be made mandatory.
4.15 Engagement of Stakeholders including Citizens
In preparation of the CMP, the stakeholders within the government fold were consulted extensively. The feedback received from the external stakeholders including citizens on the draft TOD Policy has guided preparation of the CMP. Further, the interactions held with external stakeholders specially IPT operators and aggregators and research institutes in preparation of the report on “efficient and sustainable transport for Bengaluru city” provided important inputs for formulation of the CMP.
The draft CMP was hosted on DULT and BMRCL Website from 06.12.2019 to 20.01.2020 for public comments and suggestions. Almost 3500 comments / suggestions were received. Focus group meetings were also held with citizen and expert groups. All relevant comments / suggestions have been incorporated in final CMP appropriately, and the final CMP will be submitted to BMLTA and Government for approval.
4.16 Mobility Improvement Measures and NUTP Objectives The table below summarizes the proposals of CMP with reference to the NUTP objectives.
Table 4-19: NUTP Objectives and CMP Proposals
NUTP Objectives CMP Proposals
Encourage integrated land use and transport planning to minimize travel distance and improve access to livelihoods, education, and other social needs.
The Transit Oriented Development (ToD) has been proposed, which envisages Bengaluru becoming a public transport oriented city that is compact, people friendly, environment friendly and support economic growth while offering a good quality of life
Bring about equitable allocation of road space with people, rather than vehicles, as its main focus
The CMP, proposes the corridor improvement plan and junction improvements with specific focus on improving facilities for bus services and pedestrians.
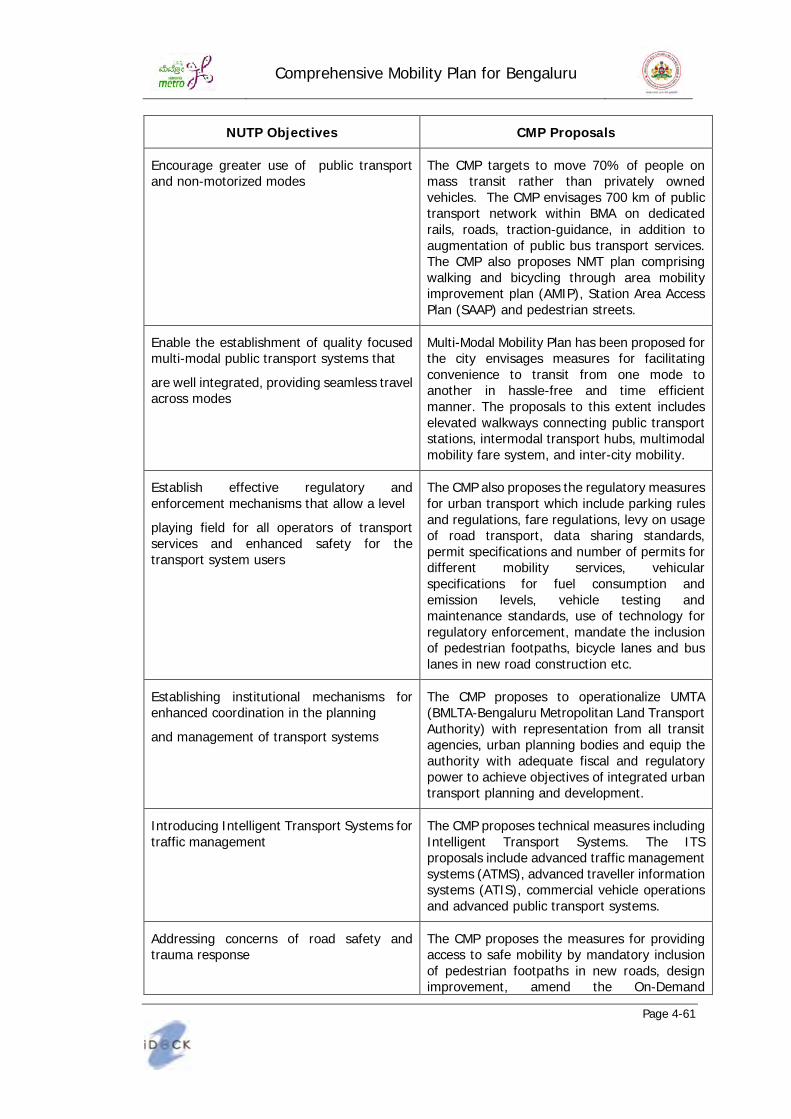
Comprehensive Mobility Plan for Bengaluru
Page 4-61
NUTP Objectives CMP Proposals
Encourage greater use of public transport and non-motorized modes
The CMP targets to move 70% of people on mass transit rather than privately owned vehicles. The CMP envisages 700 km of public transport network within BMA on dedicated rails, roads, traction-guidance, in addition to augmentation of public bus transport services. The CMP also proposes NMT plan comprising walking and bicycling through area mobility improvement plan (AMIP), Station Area Access Plan (SAAP) and pedestrian streets.
Enable the establishment of quality focused multi-modal public transport systems that
are well integrated, providing seamless travel across modes
Multi-Modal Mobility Plan has been proposed for the city envisages measures for facilitating convenience to transit from one mode to another in hassle-free and time efficient manner. The proposals to this extent includes elevated walkways connecting public transport stations, intermodal transport hubs, multimodal mobility fare system, and inter-city mobility.
Establish effective regulatory and enforcement mechanisms that allow a level
playing field for all operators of transport services and enhanced safety for the transport system users
The CMP also proposes the regulatory measures for urban transport which include parking rules and regulations, fare regulations, levy on usage of road transport, data sharing standards, permit specifications and number of permits for different mobility services, vehicular specifications for fuel consumption and emission levels, vehicle testing and maintenance standards, use of technology for regulatory enforcement, mandate the inclusion of pedestrian footpaths, bicycle lanes and bus lanes in new road construction etc.
Establishing institutional mechanisms for enhanced coordination in the planning
and management of transport systems
The CMP proposes to operationalize UMTA (BMLTA-Bengaluru Metropolitan Land Transport Authority) with representation from all transit agencies, urban planning bodies and equip the authority with adequate fiscal and regulatory power to achieve objectives of integrated urban transport planning and development.
Introducing Intelligent Transport Systems for traffic management
The CMP proposes technical measures including Intelligent Transport Systems. The ITS proposals include advanced traffic management systems (ATMS), advanced traveller information systems (ATIS), commercial vehicle operations and advanced public transport systems.
Addressing concerns of road safety and trauma response
The CMP proposes the measures for providing access to safe mobility by mandatory inclusion of pedestrian footpaths in new roads, design improvement, amend the On-Demand

Comprehensive Mobility Plan for Bengaluru
Page 4-62
NUTP Objectives CMP Proposals
Transportation Technologies Aggregator (ODTTA) Rules to strengthen road and passenger safety requirements, encourage safer driving behavior, etc.
Reducing pollution levels through changes in traveling practices, better enforcement, stricter norms, technological improvements, etc.
To reduce the pollution levels, CMP proposes the promotion of zero emission clean-tech vehicular fleet, institute annual renewal fees for vehicle registration and link them with the pollution emission, phasing out diesel vehicles to CNG or electric vehicles etc.
Building capacity (institutional and manpower) to plan for sustainable urban transport and establishing knowledge management system that would service the needs of all urban transport professionals, such as planners, researchers, teachers, students, etc
The CMP also proposes to establish mechanism for planning, capacity building and accountability through regulatory measures.
Promoting the use of cleaner technologies One of strategies of the CMP is to promote use of electric and cleaner fuel vehicles. CMP proposed adoption of electric fleet for all public city bus services and electric/CNG fleet for auto rickshaw.
Raising finances, through innovative mechanisms that tap land as a resource, for investments in urban transport infrastructure
The CMP proposes innovative financing mechanism as one of options for investment in proposed projects.
Associating the private sector in activities where their strengths can be beneficially tapped
The CMP proposes the private sector participation to carry out specific projects.
4.17 Impact of Proposed Measures on Service Level Benchmark 4.17.1 Public Transport Facilities
• PRESENCE OF ORGANIZED PUBLIC TRANSPORT SYSTEM IN URBAN AREA (%)
Bengaluru’s public transportation system is operated and maintained by Bengaluru Metropolitan Transport Services (BMTC). In future, the city will have 14650 buses.
A = Total Number of Buses in the City operating – 15134 buses
B = Total Number of operating Buses under the ownership of STU/SPV – 15134 buses Presence of Organized Public Transport System in Urban Area (%) = (B/A)*100
= 100 %, therefore corresponds to LoS 1
• EXTENT OF SUPPLY AVAILABILITY OF PUBLIC TRANSPORT (AVAILABILITY OF PUBLIC TRANSPORT / 1000 POPULATION)

Comprehensive Mobility Plan for Bengaluru
Page 4-63
The Estimated Population of study area for the year 2031 will be 216.13 lakhs
A = Total Number of Buses in the City will be – 15134 buses
B = Total Population of the Study area – 216.13 lakhs.
Availability of Public Transport / 1000 Population = A/ (B/1000)= 0.7, Therefore corresponds to LoS = 1
• AVERAGE WAITING TIME FOR PUBLIC TRANSPORT USERS (MINS)
The average headway for each bus route will be about 20 minutes.
Therefore, the average waiting time will be half the headway i.e. 10 minutes, therefore corresponds to LoS 3.
The overall LoS of Public Transport Facilities is obtained by summing up the LoS of individual parameters, Overall Level of Service of Public Transport facilities in Bengaluru. Thus overall LoS corresponds to ‘1’.
4.17.2 Travel Speed (Motorized and Mass Transit) along Major Corridors
• AVERAGE TRAVEL SPEED OF PERSONAL VEHICLES (KMPH)
The average journey speed for major corridors for the private vehicles likely to increase to = 27 Kmph. Therefore, corresponds to LoS 2.
• AVERAGE TRAVEL SPEED OF PUBLIC TRANSPORT (KMPH)
The average journey speed for major corridors for the public transport likely to increase =25 Kmph. Therefore, corresponds to LoS 1.
Overall Level of Service of Travel Speed facilities city wide =2+1= 3(score) = LOS 2
The overall LOS= 2+1=3(score) this corresponds to LoS 2
4.17.3 Availability of Parking Spaces
This indicator represents the availability of paid on-street parking spaces for all vehicles in the Bengaluru. Paid on-street parking facility is not yet introduced in Bengaluru city except in some off-street locations like Bus stands, railway stations and other commercial complexes. In some places like Malls parking is maintained by private people.
As the percentage is negligible it is considered as <25 %. Therefore LoS 4.
The ratio of maximum and minimum parking fee is >4 for Bengaluru city. Therefore, LoS 1.
Overall score: 4+1 = 5 This corresponds to LoS 3.
4.17.4 Road Safety
Fatality rate per lakh population
Fatality Rate per Lakh of Population (%)
A = Total number of likely fatalities within city limits will be = 350 (in nos.)
B = Population of the LPA in 2031 year will be 216.13 (Estimated) (in Lakhs) Fatality rate per 100000 Population (ratio)

Comprehensive Mobility Plan for Bengaluru
Page 4-64
= (A)/( B/100000)
= 1.67 This corresponds to LOS 1.
4.17.5 Pollution Levels
The indicator indicates the level of air pollutants in the city i.e., average level of pollution in urban areas. The indicator to calculate the pollution level is Mean Concentration Range.
The pollution data that needs to be collected includes:
Sulphur Dioxide (SO2)
Oxides of Nitrogen
Suspended Particle matter (SPM)
RSPM (Size less than 10 microns)
The level of service for the pollutants is divided into four categories i.e., low, moderate, high and critical. The level of service for each of the above parameters is determined using the table below as recommended by MoUD /MoHUA
For Bengaluru city, the pollution levels will get reduced in future as most of the buses and private vehicles will be either electrified and CNG, the pollution level will be as shown below
Oxides of Sulphur: 1, this corresponds to LoS 1
Oxides of Nitrogen: 3, this corresponds to LoS 1
SPM: 85, this corresponds to LoS 1
RSPM (Size less than 10 microns): 35, This corresponds to LoS 1
Overall level of service of pollution city wide = LoS 1+ LoS 2+ LoS 3 + LoS 4 = 1+1+1+1= 4, this corresponds to LoS 1.
4.17.6 Integrated Land Use Transport System
• POPULATION DENSITY – GROSS (PERSONS/DEVELOPED AREA IN HECTARE)
A = Area (in Hectare) of study area= 1521.85 hectares
B = Population of the year (2031) will be = 216.13 lakhs Population density (No.) = B/A
= 2,16,13,499 /1521.85 = 142.02.
Therefore, corresponds to LoS 3.
4.17.7 Sustainability of Public Transport
• EXTENT OF NON FARE REVENUE (%)
A = Revenue collections per annum from non-fare related sources will be (i.e. excluding tariff box collections) - 550 crore
B = Total revenue per annum from all the sources i.e. majorly fare 100% Extent of non-fare revenue (%) = 7210 crores
A/B*100= 7.5 %, Therefore LoS 4

Comprehensive Mobility Plan for Bengaluru
Page 4-65
STAFF /BUS RATIO
A = Total staff of bus operation and maintenance – > 65000
B = Total number of buses – 15134 (in Number)
Staff / Bus Ratio (ratio) = A/B = 4.3, Therefore LoS 1
Overall score: 4+1 = 5 this corresponds to overall LoS 2.
The summary of the LOS Calculated for the study area is presented in Table below
Table 4-20: Summary of Service Level Bench Mark
Description LoS Remarks
Public Transport Facilities 1**
The City has a good public transport system which is wide spread and easily available to the citizens. The system provided is comfortable.
Non Motorised Transport (NMT) facilities
2 The city has NMT facilities which may need some improvements in terms of encroachments, parking facilities at interchanges etc as some parts of the city are not served buy it. The system provided is comfortable and sustainable.
Travel speed (Motorized and Mass Transit) along major corridors
2 Small increase in flow may cause substantial increases in approach delay and hence, decrease in arterial speed.
Parking spaces 3 Paid parking spaces provided in the city need to be improved upon
and to cater to the demand some differential parking rates for the CBD have been adopted. The city authorities need to imitative considerable improvements measures.
Road Safety 1 Level of Fatality rate in a city is very low. Pollution levels 1 Level of pollution in a city is very low. Sustainability of Public Transport 2 The public transport of a city is financially sustainable but needs
some improvements
NOTE**- This is based only on Indices provided by the guidelines restricting itself to buses against population with no other parameter considered, such as road infrastructure, operating speeds of buses, availability of space for bus stops, buses that are non-operational on the day, route rationalization, etc.

Comprehensive Mobility Plan for Bengaluru
Page 5-1
5 IM PLEM ENTATION PLAN
In Chapter 4, twelve theme plans were described to achieve the desired mobility scenario in the planning area. In this Chapter, the plans are phased across time horizon for the purpose of implementation of these plans based on the needs of the city and considering constraints in availability of resources for implementation of CMP. The projects are also categorized as short, medium and long term on the basis of the time taken from initiation to commissioning of these projects. Indicative cost for implementation of the CMP in a phased manner is also presented in this Chapter. Finally, the Chapter identifies potential funding sources and mode of implementation (EPC or PPP), monitoring mechanisms for successful implementation of programs and institutional framework for required for implementation of CMP. The implementation of the Plan should be on best effort basis, subject to limitations of the limited fiscal resources to be complemented by internal and extra-budgetary resources of relevant municipal and planning body (BBMP, BDA) and parastatal bodies (BWSSB, BESCOM, BMRCL, BMTC) and through appropriate public-private partnership and innovative measures of new levies aimed at value capture finances as well as mitigating demand for private source revenues.
5 .1 Phasin g of Im pl em en tation Pl an
The range of projects under the twelve theme plans can take different duration for implementing the projects, and hence time taken to realize the benefits of implementing them. In this context, the projects have been classified into short term, medium term and long term based on the following definition.
o Short term projects: projects that take 0-2 years for commissioning o Medium term projects: projects that take 3-5 years for commissioning o Long term projects: projects that take more than 5 years for commissioning
Tab l e 5 - 1 : Cl assif ication of Short- term , M ed iu m - term & Lon g- term proj ects
CM P Pl an s List of Proj ects
Short- term Proj ects
M ed iu m - term proj ects
Lon g- term proj ects
Integrated Land Use and Mobility P lan
Transit Oriented Development
Public Transport Improvement P lan
Bus fleet augmentation
Suburban Rail on existing tracks
Metro Rail

Comprehensive Mobility Plan for Bengaluru
Page 5-2
CM P Pl an s List of Proj ects
Short- term Proj ects
M ed iu m - term proj ects
Lon g- term proj ects
Bus priority corridors
BRTS/Metrolite Bus depots/terminals
Dedicated Suburban Rail
Road Netw ork Development P lan
Junction improvements
Foot over bridges/ walkways
Capacity augmentation of major junctions
Corridor improvements
Parking infrastructure
Peripheral ring road
Road widening Elevated
corridors Development
of missing links
Non-Motorized Transport P lan
Public bicycle sharing
Footpath (re) development
Cycle track development
Pedestrian only streets
Multi-Modal Mobility P lan
Elevated walkways connecting public transport stations
Intermodal transit hubs
Multi-modal mobility fare system
Private Transport Management P lan
Insurance premium based on usage
Proof of parking for vehicle ownership
Congestion fees
Freight Movement P lan
High-volume freight deliveries & truck movement to be restricted to night-time or off-peak hours
Freight logistics centers
TechnologicalMeasures
Smart signalization
Integrated Command Control Centre
Adoption of CNG and electric for IPT vehicles and public transport buses respectively
Travel Demand Management P lan
Public education and awareness
Priced parking management
Regulatory Measures
Robust traffic management and enforcement measures
Fare regulations
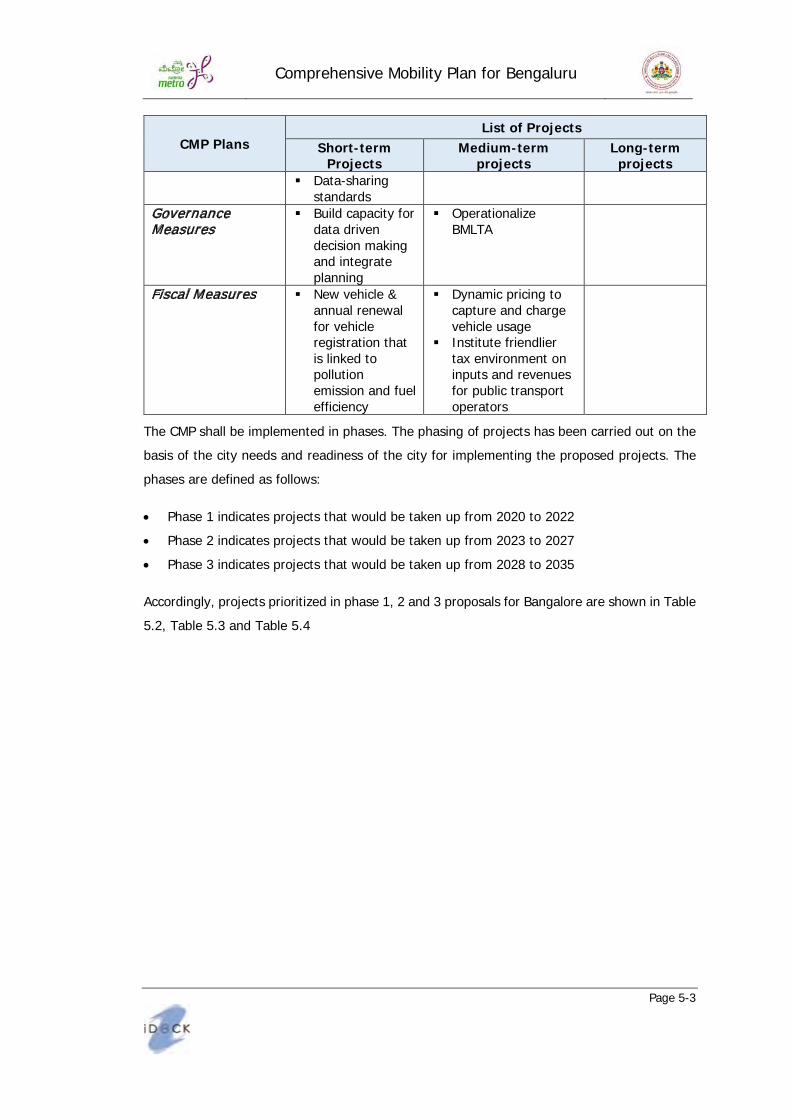
Comprehensive Mobility Plan for Bengaluru
Page 5-3
CM P Pl an s List of Proj ects
Short- term Proj ects
M ed iu m - term proj ects
Lon g- term proj ects
Data-sharing standards
Governance Measures
Build capacity for data driven decision making and integrate planning
Operationalize BMLTA
Fiscal Measures
New vehicle & annual renewal for vehicle registration that is linked to pollution emission and fuel efficiency
Dynamic pricing to capture and charge vehicle usage
Institute friendlier tax environment on inputs and revenues for public transport operators
The CMP shall be implemented in phases. The phasing of projects has been carried out on the basis of the city needs and readiness of the city for implementing the proposed projects. The phases are defined as follows:
• Phase 1 indicates projects that would be taken up from 2020 to 2022 • Phase 2 indicates projects that would be taken up from 2023 to 2027 • Phase 3 indicates projects that would be taken up from 2028 to 2035
Accordingly, projects prioritized in phase 1, 2 and 3 proposals for Bangalore are shown in Table 5.2, Table 5.3 and Table 5.4

Comprehensive Mobility Plan for Bengaluru
Page 5-4
Tab l e 5 - 2 : Phase 1 Proj ects an d Cost
SN Proj ects Un it Q u an tity Rates ( Rs in crores)
Total Cost ( Rs in crores)
1 Metro Rail Km 58 275 15,950
2 Sub-urban Rail - Shared Track Km 28 10 280
3 Sub-urban Rail - Dedicated Track Km 46 126 5,781
4 Bus priority corridors Km 54 5 270
5 Bus fleet (augmentation/replacement) Nos 4,250 0.7 3,000
6 Corridor improvements Km 50 30 1,500
7 Junction improvements Nos 51 10 510
8 Construction of FoBs Nos 50 2 100
9 Major Junction Capacity Augmentation Nos 3 600 1,800
10 Widening of Roads Km 50 100 5,000
11 Peripheral ring road (PRR) Km 20 154 3,080
12 Multimodal mobility fare system 25 25
13 Parking Refurbishment Nos 10 20 200
14 Parking infrastructure Nos 10 50 500
15 Construction of footpaths Km 200 2 400
16 Cycle track Km 50 1.5 75
17 Public bicycle sharing - hubs Nos 250 0.5 125
18 Elevated walkways Nos 5 10 50
19 Redevelopment of terminals Nos 2 35 70
20 Smart signalization Nos 29 5 145
21 Public education and awareness 5 5
22 Priced parking management Sq. Km 20 4 80
Total Phase 1 Proj ect Cost 3 8 , 9 4 6

Comprehensive Mobility Plan for Bengaluru
Page 5-5
Tab l e 5 - 3 : Phase 2 Proj ects an d Cost
S.No. Proj ects Un it Q u an tity Rates ( Rs in crores)
Total Cost ( Rs in
crores) 1 Transit Oriented Development Km 160 100 16,000 2 Metro Rail Km 30 275 8,250 3 Metrolite Elevated Km 13 180 2,340 4 Sub-urban Rail - Dedicated Track Km 67 126 8,420 5 Bus priority corridors Km 95 5 475 6 Bus fleet (augmentation/replacement) Nos 6,350 0.83 5,250
7 Bus depots/terminals/charging infrastructure Nos 40 40 1,600
8 Corridor improvements Km 100 30 3,000 9 Construction of FoBs Nos 104 2 208 10 Widening of Roads Km 70 100 7,000 11 Elevated Corridor (EW-01) Km 25.00 210 5,250 12 Peripheral ring road (PRR) Km 25.00 154 3,850 13 Parking infrastructure Nos 30 50 1,500 14 Construction of footpaths Km 348 2 696 15 Tender Sure Roads Km 50 7 350 16 Cycle track Km 250 1.5 375 17 Pedestrian streets Nos 10 8 80 18 Public bicycle sharing - hubs Nos 300 0.5 150 19 Elevated walkways Nos 5 10 50 20 Intermodal transit hubs Nos 15 75 1,125 21 Intra and interstate bus terminus Nos 3 150 450 22 Redevelopment of terminals Nos 2 50 100
23
High-volume freight deliveries & truck movement to be restricted to night-time or off-peak hours --- 5 5
24 Freight logistics centers Nos 4 100 400 25 Smart signalization Nos 150 5 750 26 Integrated Command Control Centre Nos 1 350 350
27 Priced parking management Sq. Km 80 4 320
28 Robust traffic management and enforcement measures --- 250 250
29 Data-sharing standards --- 50 50 30 Fare regulations --- 50 50
31 Build capacity for data driven decision making and integrate planning --- 10 10
32 Operationalize BMLTA Nos 100 100
33 Dynamic pricing to capture and charge vehicle usage --- 150 150
Total Phase 2 Project Cost 68,954

Comprehensive Mobility Plan for Bengaluru
Page 5-6
Tab l e 5 - 4 : Phase 3 Proj ects an d Cost
S.No Proj ects Un it Q u an tity Rates ( Rs in crores)
Total Cost ( Rs in crores)
1 Transit Oriented Development Km 320 100 32,000
2 Metro (underground) Km 34 600 20,400 3 Metrolite(Elevated)/MRT Km 68 180 12,240
4 Sub-urban Rail - Dedicated Track Km 36 126 4,524
4 Corridor Improvements Km 80 30 2,400 5 Bus priority corridors Km 53 5 265
6 Bus fleet (augmentation/replacement) Nos 5,625 0.8 4,500
7 BRTS Km 107 50 5,350 8 Widening of Roads Km 72 100 7,200 9 Elevated Corridor Km 63 210 13,230 10 Peripheral ring road (PRR) Km 33 154 5,082 11 Parking infrastructure Nos 18 50 900 12 Tender Sure Roads Km 53 7 371 13 Cycle track Km 300 1.5 450 14 Intermodal transit hubs Nos 15 75 1,125
15 Intra and inter state bus terminus Nos 3 150 450
16 Depots/terminals Nos 30 40 1,200
17 Insurance premium based on usage --- 5 5
18 Proof of parking for vehicle ownership --- 2 2
19 Congestion fees infrastructure --- 100 100
20 Freight logistics centers Nos 4 80 320 21 ITS - demand management Nos 1 350 350
22 Adoption of CNG and electric for IPT vehicles and public transport buses respectively
Nos 6,500 1.5 9,750
23 Priced parking management Sq. Km 60 4 240
24
New vehicle & annual renewal for vehicle registration that is linked to pollution emission and fuel efficiency
--- 10 10
25
Institute friendlier tax environment on inputs and revenues for public transport operators
--- 2 2
Total Phase 3 Proj ect Cost 1 , 2 2 , 4 6 6
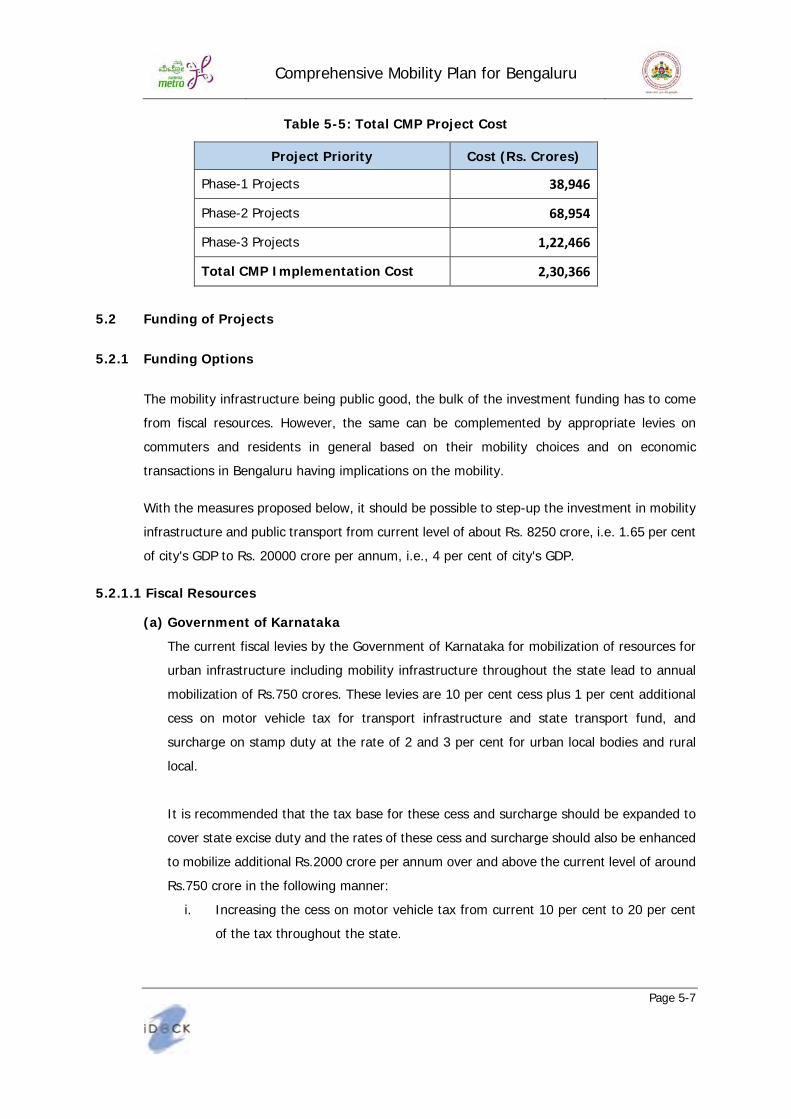
Comprehensive Mobility Plan for Bengaluru
Page 5-7
Tab l e 5 - 5 : Total CM P Proj ect Cost
Proj ect Priority Cost ( Rs. Crores)
Phase-1 Projects 38,946
Phase-2 Projects 68,954
Phase-3 Projects 1,22,466
Total CM P Im pl em en tation Cost 2,30,366
5 .2 Fu n d in g of Proj ects
5 .2 .1 Fu n d in g Option s
The mobility infrastructure being public good, the bulk of the investment funding has to come from fiscal resources. However, the same can be complemented by appropriate levies on commuters and residents in general based on their mobility choices and on economic transactions in Bengaluru having implications on the mobility.
With the measures proposed below, it should be possible to step-up the investment in mobility infrastructure and public transport from current level of about Rs. 8250 crore, i.e. 1.65 per cent of city's GDP to Rs. 20000 crore per annum, i.e., 4 per cent of city's GDP.
5 .2 .1 .1 Fiscal Resou rces
( a) Gov ern m en t of K arn atak a The current fiscal levies by the Government of Karnataka for mobilization of resources for urban infrastructure including mobility infrastructure throughout the state lead to annual mobilization of Rs.750 crores. These levies are 10 per cent cess plus 1 per cent additional cess on motor vehicle tax for transport infrastructure and state transport fund, and surcharge on stamp duty at the rate of 2 and 3 per cent for urban local bodies and rural local. It is recommended that the tax base for these cess and surcharge should be expanded to cover state excise duty and the rates of these cess and surcharge should also be enhanced to mobilize additional Rs.2000 crore per annum over and above the current level of around Rs.750 crore in the following manner:
i. Increasing the cess on motor vehicle tax from current 10 per cent to 20 per cent of the tax throughout the state.

Comprehensive Mobility Plan for Bengaluru
Page 5-8
ii. Increasing surcharge on stamp duty and registration fee on land transactions in Bengaluru from current 2 per cent to 10per cent of the stamp duty and registration fee.
iii. Levy of cess on sale of fuel for motor vehicles in Bengaluru City. The levy of the above proposed cess should be should be decided from the perspective of overall fiscal policy of the government and likely impact of the cess on the economic activities.
( b ) Gov ern m en t of In d ia
The current level of fiscal support from GoI for mobility infrastructure in Bengaluru by way of interest free funds and sovereign loans at concessional terms from multilateral and bilateral development agencies is of order of Rs.2000 crore per annum. It is recommended that the infrastructure agencies should step-up their planning and project management capacities so as to be able to seek and utilize at least double the current level of fiscal support from GoI. Bengaluru is one of the cities selected under smart city mission by Government of India. Components such as Tender Sure Roads, Integrated Command Control Center, Smart Bus Shelters and promoting NMT are being planned. It is recommended that the total support for mobility infrastructure and public transport systems from fiscal resources of GOI and GoK should be enhanced from current level of Rs.8250 crore per annum, subject to fiscal capacity.
5 .2 .1 .2 Ad d ition al Resou rce M ob il iz ation ( ARM )
( a) Lan d Val u e Captu re: The Transit Oriented Development (TOD) can contribute to sustainable mobility systems and can also be source of funding the required investment by way of Land Value Capture, i.e., collecting a part of the land value appreciation due to TOD led densification and increase in Floor Area Ratio (FAR) whenever there is a land transaction or development in the TOD impact zone. In addition, an appropriate infrastructure cess on approvals for newer layouts and building plans in the city in general is recommended as another means of land value capture. However, the rate of this cess should be much lower than the rate of cess or premium fee in the TOD impact zone as the land owners outside the impact zone will have indirect gains from the mobility infrastructure and public transport systems.
( b ) Park in g Fee: High and graded parking fee, based on the location, reflecting the economic cost of parking infrastructure is recommended to fund the infrastructure as well as to fund infrastructure development for alternate and sustainable modes like pedestrian/cycling infrastructure,
Comprehensive Mobility Plan for Bengaluru
Page 5-9
public transport, and also to implement other travel demand management measures that could help reduce reliance on private vehicle usage.
( c) Con gestion Fee Congestion fees on the use of private vehicles and IPT during specified peak hours on specified arterial and major roads with vehicle to capacity ratio of more than one is suggested as a means of financing the mobility infrastructure by capturing the cost of negative externality from such modes. The collection of the congestion fee should be entirely unobtrusive by using appropriate telemetry and camera-based detection technology (such as automatic number plate recognition technology) and prior mandate-based automatic collection from bank accounts linked to the vehicle registration. BBMP should be responsible for levying the congestion fee, as it has the primary mandate of maintaining urban roads. Enforcement however, must be given to the Transport Department, as it has the database of registered vehicles and it is the government interface for vehicle owners for all matters vehicle- related. Amendments would need to be made to the Karnataka Municipal Corporation Act, 1976 and the Karnataka Motor Vehicle Taxation Act, 1957 to enable the levy and collection of congestion fees. The collected amount should come to the proposed Bangalore Infrastructure Fund and then allocated for improving road infrastructure. To enable effective collection of congestion fees, a governing mechanism must be developed to ensure coordination between the BBMP and the Transport Department. The proposed Bengaluru Metropolitan Land Transport Authority may facilitate the coordination between BBMP and Transport Department and establish the required IT system.
( d ) Rev en u es f rom ad v ertisem en t on pu b l ic tran sport in f rastru ctu re The draft regulations by BBMP, namely Outdoor Signage and Public Messaging Byelaws 2018 for banning advertising at public places, should be reviewed as advertising provides a good revenue source and should be encouraged judiciously. Such advertising in eco-friendly manner without hampering the traffic safety is taken-up in all major cities and highways, and there does not appear any cogent reason to take a contrarian view for Bengaluru city. The revenues from such advertisements can be a significant source of funds for operations and maintenance of public transport.
( e) Pu b l ic- Priv ate Partn ership w ith Corporate f or m etro station n am in g rights an d d irect access:

Comprehensive Mobility Plan for Bengaluru
Page 5-10
The financing of public transport by private companies under PPP mode is found to be largely impractical due to allocation of risks related to traffic volume and fare determination. However, limited scope PPP for long- term naming rights for metro or other public transport stations and direct elevated access from corporates premises is recommended as a means for mobilizing resources.
( f ) TOD at m etro station s an d d epots Full utilization of permissible FAR at metro stations and depots or assignment" of unutilized FAR as Transferrable Development Rights (TDR) are recommended to leverage the TOD potential for financing the PT infrastructure.
( g) Roof - top sol ar pow er pl an ts at m etro station s an d d epots Such solar power plants are recommended for economizing the operating cost of metro.
5 .2 .1 .3 Lev y of cess an d su rcharge u n d er Section 1 8 A of K arn atak a Tow n an d Cou n try Pl an n in g ( K TCP) Act, 1 9 6 1
As per KTCP Act, the Planning Authority may while granting permission for development of land or building levy and collect from the owner of such land or building: - (i) a cess for the purpose of carrying out any water supply scheme; (ii) a surcharge for the purpose of construction of PRR and widening of arterial roads; (iii) a cess for the purpose of improving slums; and (iv) a surcharge for the purpose of establishing Mass Rapid Transport System. At such rates but all the above levies together not exceeding one-tenth of the market value of the land or building as may be prescribed.
5 .2 .1 .4 Ben gal u ru In f rastru ctu re Fu n d :
It is recommended that a separate Bengaluru Infrastructure Fund (BIF) should be created in the public account of the state government. The fiscal resources mobilized by way of cess and select ARM’s after collection in the consolidated fund should get transferred to the BIF through appropriation from the budget. The surcharge under section 18A of KTCP Act and other mobility related non-fiscal levies by local and planning bodies should be deposited in the BIF directly. The funds from the BIF should be distributed to the concerned mobility infrastructure and public transport agencies (BBMP, BDA, BMTC, BMRCL, B-RIDE) and other city infrastructure agencies (BWSSB and BESCOM) in the prescribed proportions for utilizing for projects approved by BMLTA in accordance with the city's Comprehensive Mobility Plan.

Comprehensive Mobility Plan for Bengaluru
Page 5-11
The extra budgetary resources, except proceeds from advertising, PPP, TOD at stations and roof-top solar plants which are specific to an agency, should also come to the common pool in the BIF and then distributed for the approved projects in the agreed proportions.
5 .2 .1 .5 Pu b l ic Priv ate Partn ership ( PPP)
The Comprehensive Mobility Plan has projected huge investments which cannot alone come from the budgetary sources. There is need for fast tracking and investments in infrastructure. PPP is recognized as one of the possible options. There are different PPP modes ranging between low and high levels of participation and their involvement, can be utilized based on the suitability of project’s needs. Infrastructure Development Department (IDD) is the nodal agency for identifying, developing and processing PPP projects. It will assist the agencies in development and funding and approval of components of Comprehensive Mobility Plan by the State Level Single Window Agency for Public Clearance Committee under the Chairmanship of Chief Minister. Furthermore, it has empaneled transaction advisors, who can assist the agencies in selection of PPP partners.
The four major “ families” of PPP modes are:
M an agem en t con tracts
This involves contracting to the private sector most or all of the operations and maintenance of a public facility or service. Although the ultimate obligation of service provision remains with the public authority, the day-to-day management control is vested with the private sector. Usually the private sector is not required to make capital investments. Maintenance of roads can be done under this model.
Tab l e 5 .6 : Characteristics of M an agem en t Con tracts
M od es Asset ow n ership Du ration
Capital in v estm en t
f ocu s & respon sib il ity
Priv ate partn er
rol es Poten tial Sectors
Management Contract
Public Short – medium (e.g. 3-5yrs)
Not the focus Public
Management of all aspects of operation and maintenance.
Maintenance of roads
Bus Terminals
Management Contract
Public Medium – long
Limited Focus Brownfield (Rehabilitation / expansion) Private
Minimum Capex, Management, Maintenance

Comprehensive Mobility Plan for Bengaluru
Page 5-12
( a) Lease con tracts Under this model, asset is leased, either by the public entity to the private partner or vice-versa.
Tab l e 5 .7 : Characteristics of Lease Con tracts
M od es Asset ow n ership Du ration
Capital in v estm en t
f ocu s & respon sib il ity
Priv ate partn er
rol es
Poten tial Sectors
Lease Contracts
Public Medium (e.g., 10-15yrs)
Not the focusPublic
Management and maintenance
Leasing of retail outlets at metro rail stations
Build Lease Transfer (BLT) or Build-Own-Lease-Transfer (BOLT)
Private (Leased to the government)
Medium (e.g. 10-15yrs)
Greenfield Private
Capex Development of bus terminal
Build-Transfer-Lease (BTL)
Public Medium (e.g., 10-15yrs)
Greenfield Private
Capex and Operations
( b ) Con cession s This model involves the responsibility for construction (typically brownfield / expansions) and operations with the private partner while ownership is retained by the public sector.
Tab l e 5 .8 : Characteristics of Con cession s
M od es Asset ow n ership Du ration
Capital in v estm en t f ocu s & respon sib il ity
Priv ate partn er rol es
Poten tial Sectors
Area Concessions
Public Long (e.g. 20-30 yrs)
Brownfield/ Expansions Private
Design, finance, construct, manage, maintain
Ring roads
( c) Bu il d - operate- tran sf er ( BOT) an d its v arian ts

Comprehensive Mobility Plan for Bengaluru
Page 5-13
Under Build-Operate-Transfer ( BOT) Contracts, the responsibility for construction (typically Greenfield) and operations with the private partner while ownership is retained by the public sector.
Tab l e 5 .9 : Characteristics of BOT Con tracts
M od es Asset ow n ership Du ration
Capital in v estm en t
f ocu s & respon sib il ity
Priv ate partn er rol es Poten tial Sectors
Design-build-operate (DBO)
Public Short-medium (e.g. 3-5 yrs)
Greenfield Public
Design, construct, manage, maintain
Elevated corridors, monorail, etc.
Build-operate-transfer (BOT)/ Design-Build-Finance-Operate-Transfer (DBFOT)
Public Long (e.g. 20-30 yrs)
Greenfield Private
Design, finance, construct, manage, maintain
ISBT Metro Parking
infrastructure Bus terminal Bus station, Truckterminals, Bus queue
shelters (BQS)
Build-operate-transfer (BOT) Annuity
Public Long (e.g. 20-30 yrs)
Greenfield Private
Design, finance, construct, manage, maintain
Bus terminal
Under Bu il d - ow n - operate Tran sf er ( BOOT) Con tracts, private partner has the responsibility for construction and operations. Ownership is with the private partner for the duration of the concession.
Tab l e 5 .1 0 : Characteristics of BOOT Con tracts
M od es Asset ow n ership Du ration
Capital in v estm en t
f ocu s & respon sib il ity
Priv ate partn er rol es
Poten tial Sectors
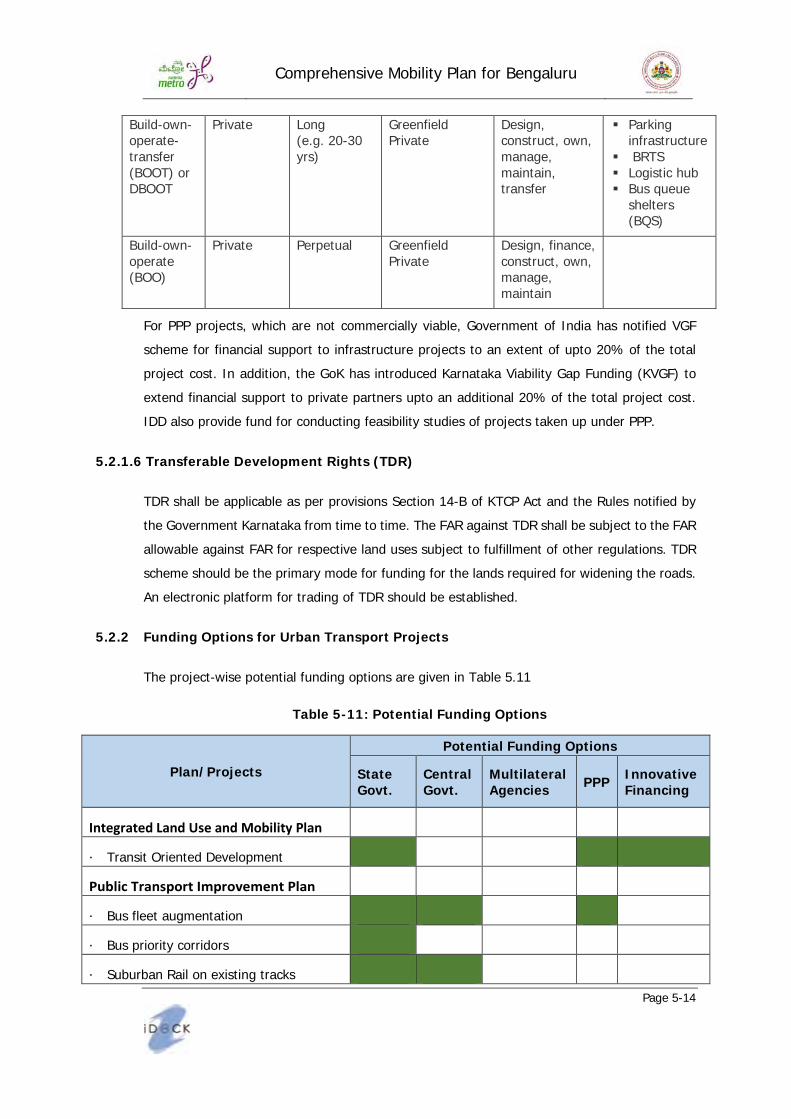
Comprehensive Mobility Plan for Bengaluru
Page 5-14
Build-own-operate-transfer (BOOT) or DBOOT
Private Long (e.g. 20-30 yrs)
Greenfield Private
Design, construct, own, manage, maintain, transfer
Parking infrastructure
BRTS Logistic hub Bus queue
shelters (BQS)
Build-own-operate (BOO)
Private Perpetual Greenfield Private
Design, finance, construct, own, manage, maintain
For PPP projects, which are not commercially viable, Government of India has notified VGF scheme for financial support to infrastructure projects to an extent of upto 20% of the total project cost. In addition, the GoK has introduced Karnataka Viability Gap Funding (KVGF) to extend financial support to private partners upto an additional 20% of the total project cost. IDD also provide fund for conducting feasibility studies of projects taken up under PPP.
5 .2 .1 .6 Tran sf erab l e Dev el opm en t Rights ( TDR)
TDR shall be applicable as per provisions Section 14-B of KTCP Act and the Rules notified by the Government Karnataka from time to time. The FAR against TDR shall be subject to the FAR allowable against FAR for respective land uses subject to fulfillment of other regulations. TDR scheme should be the primary mode for funding for the lands required for widening the roads. An electronic platform for trading of TDR should be established.
5 .2 .2 Fu n d in g Option s f or Urb an Tran sport Proj ects
The project-wise potential funding options are given in Table 5.11
Tab l e 5 - 1 1 : Poten tial Fu n d in g Option s
Pl an / Proj ects
Poten tial Fu n d in g Option s
State Gov t.
Cen tral Gov t.
M u l til ateral Agen cies PPP In n ov ativ e
Fin an cin g
I ntegrated L and Use and Mob ility Plan
· Transit Oriented Development
Pub lic Transport I mprovement Plan
· Bus fleet augmentation
· Bus priority corridors
· Suburban Rail on existing tracks

Comprehensive Mobility Plan for Bengaluru
Page 5-15
Pl an / Proj ects
Poten tial Fu n d in g Option s
State Gov t.
Cen tral Gov t.
M u l til ateral Agen cies PPP In n ov ativ e
Fin an cin g
· BRTS/Metrolite
· Bus depots/terminals
· Metro Rail
· Dedicated Suburban Rail
Road Netw ork Development Plan
· Junction improvements
· Foot over bridges/ walkways · Capacity Augmentation of Major Junctions
· Corridor improvements
· Parking infrastructure
· Peripheral ring road
· Road widening
· Elevated corridors
Non- Motoriz ed Transport Plan
· Public bicycle sharing
· Footpath development
· Cycle track development
· Pedestrian only streets
Multi- Modal Mob ility Plan· Elevated walkways connecting public transport stations
· Intermodal transit hubs
· Multi-modal mobility fare system
Private Transport Management Plan
· Insurance premium based on usage
· Proof of parking for vehicle ownership
· Congestion fees

Comprehensive Mobility Plan for Bengaluru
Page 5-16
Pl an / Proj ects
Poten tial Fu n d in g Option s
State Gov t.
Cen tral Gov t.
M u l til ateral Agen cies PPP In n ov ativ e
Fin an cin g
F reight Movement Plan · High-volume freight deliveries & truck movement to be restricted to night-time or off-peak hours
· Freight logistics centers
Technological Measures
· Smart signalization
· Integrated Command Control Centre · Adoption of CNG and electric for IPT vehicles and public transport buses respectively
Travel Demand Management Plan
· Public education and awareness
· Priced parking management
Regulatory Measures · Robust traffic management and enforcement measures
· Data-sharing standards
· Fare regulations
G overnance Measures · Build capacity for data driven decision making and integrate planning
· Operationalize BMLTA
F iscal Measures · New vehicle & annual renewal for vehicle registration that is linked to pollution emission and fuel efficiency · Dynamic pricing to capture and charge vehicle usage · Institute friendlier tax environment on inputs and revenues for public transport operators

Comprehensive Mobility Plan for Bengaluru
Page 5-17
5 .3 M on itorin g of CM P
CMP should be the basis for approving projects, plans and various regulatory measures within the city related to transport to ensure that the development is integrated and supplement each other to achieve the desired outcomes.It is therefore important to monitor and measure the impact of interventions taken as an outcome of CMP. There will be two levels of monitoring:
The first level of monitoring can be with regard to the status of implementation of the Comprehensive Mobility Plan in terms of time frames proposed and achieved. This is helpful to understand the pace of CMP implementation.
The second level of monitoring can be to understand the impact of CMP implementation. The indicators created as a part of CMP can form the basis of this monitoring which can be done on a biannual basis.
An efficient monitoring system for the implementation of development in an integrated manner would be required for the success of the any implementation plan. It is therefore important to have one unified authority, which can stitch all the various agencies involved in the development of city, and ensure the overall objectives and development goals are met.
At present, following is the list of departments and organizations involved in urban affairs and urban transport in Bangalore.
Urban Development Department (UDD), Government of Karnataka Transport Department, Government of Karnataka Directorate of Urban Land Transport (DULT) Bangalore Development Authority (BDA) Bruhat Bengaluru MahanagaraPalike (BBMP) Bangalore Metro Rail Corporation Ltd. (BMRCL) Rail Infrastructure Development Company (Karnataka) Limited (K-RIDE) Bangalore Metropolitan Transport Corporation (BMTC) Karnataka State Road Transport Corporation (KSRTC) Traffic Police, Bangalore Karnataka Road Development Corporation (KRDCL) Public Works Department, Government of Karnataka National Highway Authority of India (NHAI) State Pollution Control Board, Bangalore
The Agencies responsible for the implementation of Plans / projects have been detailed in the matrices below.

Comprehensive Mobility Plan for Bengaluru
Page 5-18
Tab l e 5 - 1 2 : Action Pl an – Lead Agen cy
Action Pl an UDD Tran sport
Departm e
n t
DULT / BM LTA
BDA BBM P BM RCL K - RIDE, Rail w ay
BM TC K SRTC Traf f ic Pol ice
K RDCL
In tegrated Lan d Use an d M ob il ity Pl an
Pu b l ic Tran sport Im prov em en t Pl an
Road Netw ork Dev el opm en t Pl an
Non - M otoriz ed Tran sport Pl an
M u l ti- M od al M ob il ity Pl an
Priv ate Tran sport M an agem en t Pl an
Freight M ov em en t Pl an
Techn ol ogical M easu res

Comprehensive Mobility Plan for Bengaluru
Page 5-19
Action Pl an UDD Tran sport
Departm e
n t
DULT / BM LTA
BDA BBM P BM RCL K - RIDE, Rail w ay
BM TC K SRTC Traf f ic Pol ice
K RDCL
Trav el Dem an d M an agem en t Pl an
Regu l atory M easu res
Gov ern an ce M easu res
Fiscal M easu res

Comprehensive Mobility Plan for Bengaluru
Page 5-20
In stitu tion al Fram ew ork
With a view to coordinate all urban transport activities in the city, it is recommended that the existing Bengaluru Metropolitan Land Transport Authority (BMLTA), set up in 2007 through an executive order, should be given the legislative anchoring for its effective functioning as the planning, coordination and decision making body for all matters related to urban transport in the city. The authority should be the Unified Metropolitan Transport Authority (UMTA) for regulation of the development, operations, maintenance, monitoring, supervision and provision of urban transport within Bengaluru mobility area.
BMLTA should have the following overall responsibilities:
1. Regulatory / Policy • Setting norms/ Standards / Guidelines / Policies • Transport Service levels • TSM Guidelines
2. Planning
• Land use – transport integration • Comprehensive Mobility Plans Preparation / Upgradation and Implementation • Procurement / Contracting • Inter-modal coordination
3. Funding
• Project approval through TIP (Transport Investment Plan) • State/Central fund sanctioning and channeling
4. Co-Ordination • Co-Ordination with other Urban Infrastructure departments
5. Management
• Direct development and management of high density mobility corridors and other projects, as may be assigned by the government.
A draft bill for constituting the UMTA for Bengaluru i.e. BMLTA has been prepared and is being finalised to provide statutory status to BMLTA. The authority should be constituted under the Chairmanship of Chief Minister and heads of the departmental stakeholders, subject experts and representatives from civil society should be members. To discharge the technical and administrative functions of the authority, an Executive Committee should be constituted comprising of the following members:
(i) Additional Chief Secretary to Government, Urban Development Department - Executive President
(ii) Principal Secretary, Transport Department - Member

Comprehensive Mobility Plan for Bengaluru
Page 5-21
(iii) ACS/Principal Secretary to Government, Finance Department - Member
(iv) Commissioner, Bruhat Bangalore Mahanagara Palike (BBMP) - Member
(v) Commissioner, Bangalore Development Authority (BDA) - Member
(vi) Commissioner, Bangalore Metropolitan Region Development Authority - Member
(vii) Managing Director, Bangalore Metro Rail Corporation Limited - Member
(viii) Managing Director, Bangalore Metropolitan Transport Corporation – Member
(ix) Managing Director, Rail Infrastructure Development Company (Karnataka) Limited – Member
(ix) Director of Town and Country Planning - Member
(x) Additional Commissioner of Police (Traffic) - Member
(xi) CEO of the Authority - Member Secretary
The Commissioner of Directorate of Urban Land Transport, Government of Karnataka should be the Chief Executive Officer of the Authority and Directorate of Urban Land Transport (DULT) should act as the secretariat for the Authority.
5 .4 Stak ehol d er’ s Con su l tation
The draft CMP was hosted on DULT and BMRCL Website from 06.12.2019 to 20.01.2020 for public comments and suggestions. Almost 3500 comments / suggestions were received. Focus group meetings were also held with citizen and expert groups. All relevant comments / suggestions have been considered and incorporated in final CMP appropriately.
The CMP provides a good road map to plan and implement various projects and activities for improving share of public transport, regulating demand for private transport, and providing efficient and sustainable mobility options for the commuters.

Comprehensive Mobility Plan for Bengaluru
Page A 3.1 -1
ANNEXURE 3 .1 Tran sport Dem an d M od el
3 .1 . Dev el opm en t of Tran sport M od el
An urban transport model to replicate the “ Bangalore Metro Politian Area” transportation system (roads, Congestion delays, transit system, etc.) has been developed with a state-of-the-art software
and modeling technology. This
model can be used for forecasting,
using altered model inputs to
reflect future year conditions. By
simulating roadway conditions and
travel demand on those
roadways, deficiencies in the
system can be assessed. Potential major future network
enhancements such as introduction
of an MRTS or land use
modifications can be analyzed by
this too land its efficacy can be established at a planning level.
Several software programs are available for developing travel demand models. The Bangalore
transport model has been developed using CUBE (a state-of-the-art Travel Demand Modeling
software).
M od el Stru ctu re
The model is based on a conventional 4-stagetransportmodel approach. It includes:
Trip Gen eration — calculating the number of origins and destinations for each zone.
Trip Distrib u tion — attaching the origins and
destinations for complete trips
M od e Choice— determining the mode for each trip,
car, Intermediate Public Transport (IPS, Public transport).
Assign m en t — assigning passengers to their respective highway and transit networks.
Model Input
• Road network inventory
• Public Transportation Details
• Planning variables by zones
• Trip End Information
Comprehensive Mobility Plan for Bengaluru
Page A 3.1 -2
Netw ork Dev el opm en t
Transport network developed for the model comprises of two components,
• Highway Network for vehicles
• Transit Network for public transport system i.e. Buses and any new public transportation system.
Each of the networks is described in detail below
H ighw ay Netw ork
The coded highway network for the study area represents the nodes (intersections) and links between
them. Connectivity between the network and zones is provided through centroid connectors. Each link
has been assigned attributes such as: number of lanes; divided or undivided carriageway;
encroachments; availability of footpaths etc. The highway network and zoning are shown in Fig 1 and
Fig 2 respectively.
Tran sit Netw ork
The transit network represents the connectivity, headways, speeds and accessibility of transit services.
In Bangalore, local buses, auto rickshaws and taxies ply on the main corridors. So, City bus transport
system, Bangalore Phase- I Metro Corridors, auto rickshaws and intercity bus routes are included in
the model’s transit network. The transit routes are specified as those using the transport links and
having stops/stations at determined locations. The access to the stops/stations from zone centroids
and other nodes is provided either by existing highway links or by defining exclusive walk links. The
distance between the bus stop/stations is assumed between 500m to 1000m in the public transport
assignment. Figure presents the transit network for the study area.
Currently, about 2500 city bus routes are operated in the Bangalore urban area. Information on the
• M od es: The modes that are modeled under the study includes Two wheeler, Private
Cars, Intermediate Public Transport, Public Transport i,e. Bus. The non- motorized transport and commercial were considered as a preload
• Z on in g: 519 zones within BMRDA Region, and 15 external zones
• Netw ork : The highway (road) network considered all the Key arterials, sub arterials and collectors. The transit system considered with the existing public transport
system in all its forms, i.e. bus with their routes, frequency, fare structure etc.
• Pl an n in g Period : Year 2016 is considered as the base year and 2031 has been set as the horizon year for the planning of the long term strategy
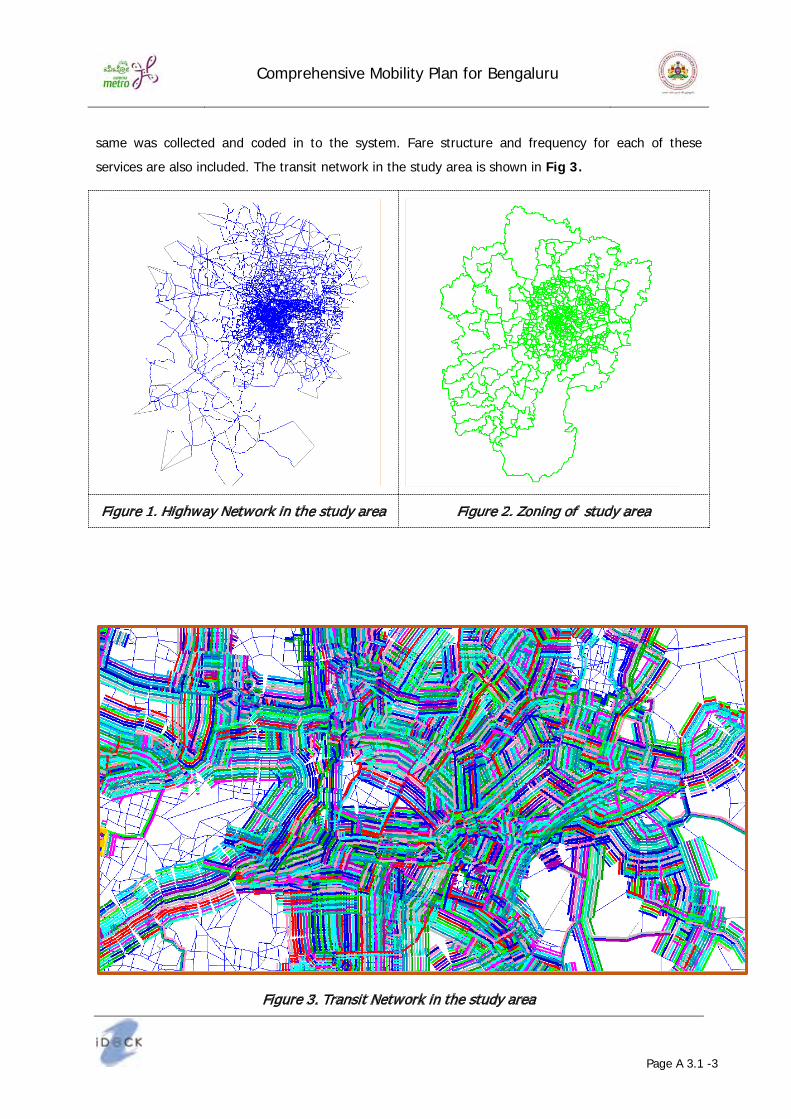
Comprehensive Mobility Plan for Bengaluru
Page A 3.1 -3
same was collected and coded in to the system. Fare structure and frequency for each of these
services are also included. The transit network in the study area is shown in Fig 3 .
Figure 1. Highway Network in the study area Figure 2. Zoning of study area
Figure 3. Transit Network in the study area

Comprehensive Mobility Plan for Bengaluru
Page A 3.1 -4
Dev el opm en t of M atrices
Bangalore CTTS-2008 parameters and Population and Employment data of base year 2015 were used to
develop the synthesized matrices. Observed mode wise trip matrices were developed based on synthesized matrices and roadside passenger interview data. External trips for the car, two wheelers, IPT, public
transport and commercial vehicles were constructed based on the O- D survey conducted at the outer
cordon. Tab l e 1 presents the observed mode wise trips.
The mode wise matrices were developed for morning peak hour. From the primary surveys it has been
observed that the morning peak is during 09:00 AM to 10:00 AM. So the model was built for this duration.
Stages of Transport Model Building as shown below in Fig 4 , Fig 5 , an d Fig 6 .
Figure 4. Stage 1
Figure 5. Stage 2

Comprehensive Mobility Plan for Bengaluru
Page A 3.1 -5
Figure 6.Stage 3
Table 1. Observed mode w ise Trips (Peak Hour)
Sl . No M od e In tern al trips Ex tern al trips Total Trips Percen tage
1 Car Passengers 2,46,607 5,657 2,52,263 21%
2 Two-wheeler Passengers 2,89,290 3,798 2,93,088 24%
3 IPT Passengers 74,713 551 75,264 6%
4 Public Transit Passengers 5,71,271 6,810 5,78,080 48%
Total 1 1 , 8 1 , 8 8 1 1 6 , 8 1 6 1 1 , 9 8 , 6 9 5 1 0 0 %
H ighw ay Assign m en t
A user equilibrium multi model Assignment procedure based on generalized cost was used for loading
matrices in PCU Values.
Tran sit Assign m en t
The public transport assignment process is a multi-path assignment which enumerates and evaluate the
“ reasonable” or “ attractive” multiple discrete routes between zones, considering number of transfers and vehicle in cost, boarding and transfer penalties and fares etc.
Val id ation
The observed highway and public transport matrices were assigned on the network and the assigned
traffic volume screen lines and at cordons. The model is validated across cordons and screen lines
within a confidence range of + /-15% . Validation results are given in Tab l e 2 , 3 an d 4 .
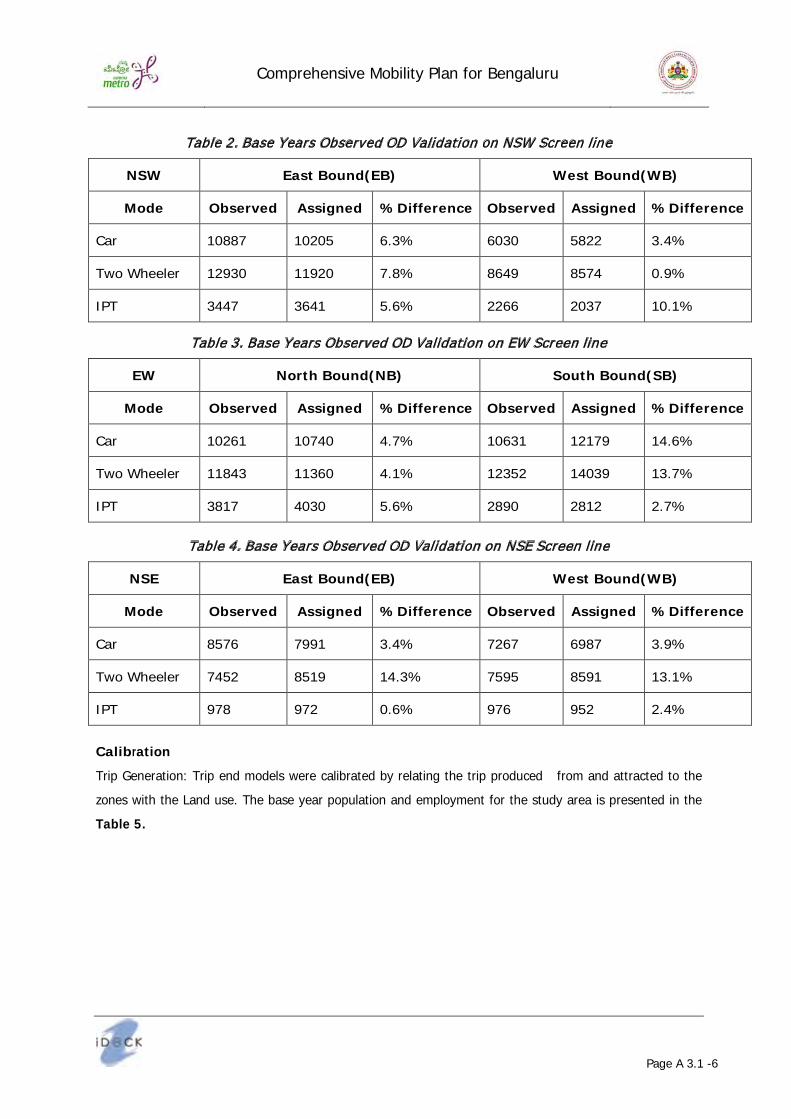
Comprehensive Mobility Plan for Bengaluru
Page A 3.1 -6
Table 2. Base Years Observed OD Validation on NSW Screen line
NSW East Bou n d ( EB) W est Bou n d ( W B)
M od e Ob serv ed Assign ed % Dif f eren ce Ob serv ed Assign ed % Dif f eren ce
Car 10887 10205 6.3% 6030 5822 3.4%
Two Wheeler 12930 11920 7.8% 8649 8574 0.9%
IPT 3447 3641 5.6% 2266 2037 10.1%
Table 3. Base Years Observed OD Validation on EW Screen line
EW North Bou n d ( NB) Sou th Bou n d ( SB)
M od e Ob serv ed Assign ed % Dif f eren ce Ob serv ed Assign ed % Dif f eren ce
Car 10261 10740 4.7% 10631 12179 14.6%
Two Wheeler 11843 11360 4.1% 12352 14039 13.7%
IPT 3817 4030 5.6% 2890 2812 2.7%
Table 4. Base Years Observed OD Validation on NSE Screen l ine
NSE East Bou n d ( EB) W est Bou n d ( W B)
M od e Ob serv ed Assign ed % Dif f eren ce Ob serv ed Assign ed % Dif f eren ce
Car 8576 7991 3.4% 7267 6987 3.9%
Two Wheeler 7452 8519 14.3% 7595 8591 13.1%
IPT 978 972 0.6% 976 952 2.4%
Cal ib ration
Trip Generation: Trip end models were calibrated by relating the trip produced from and attracted to the
zones with the Land use. The base year population and employment for the study area is presented in the
Tab l e 5 .

Comprehensive Mobility Plan for Bengaluru
Page A 3.1 -7
Table 5. Base Years Population and Employment
Su b Area Popu l ation Em pl oy m en t
BBM P 10,211,863 4,864,447
BM A 821,570 632,404
BM R 2,808,875 1,481,874
TOTAL 13,842,307 6,978,725
The calibrated trip end models for peak hour are presented in Tab l e 6 below for Bangalore.
Table 6. Generation and Attraction Model
Su b Area GENERATION M ODEL ATTRACTION M ODEL
BBM P 0.0977 * Population + 1587.6 0.166* Employment+ 2368.2
BM A 0.089 * Population + 0.34 0.1364* Employment+ 33.12
BM R 0.0189 * Population + 4.34 0.0331* Employment+ 56.541
Com b in ed M od e choice cu m Distrib u tion M od el
The trip distribution and model split phase carried out jointly using a combined mode choice cum doubly constrained gravity model of the form:
Tijm= riGiSjAjFijm
Where T= number of inter zonal trips by mode m
G= Total generation trip ends by zone
A= Total attraction trip ends by zone
i= Generation Zone
j= Attraction Zone
r,s = Balancing factors (constants)
Fij= deterrence function for mode m
Fij= Km eβijm Cαijm
Where K= Constant Factor
C= Generalized Cost
β= Calibration Constant -Exponential function

Comprehensive Mobility Plan for Bengaluru
Page A 3.1 -8
α= Calibration Constant- Power function
Double Constraints are imposed by ensuring that
∑ 𝑇𝑇𝑇𝑇𝑇𝑇 = 𝐺𝐺𝑇𝑇𝑗𝑗𝑗𝑗 And ∑ 𝑇𝑇𝑇𝑇𝑇𝑇 = 𝐴𝐴𝑇𝑇𝑖𝑖𝑗𝑗
The Calibrated parameters are given in Tab l e 7 .
Table 7. Deterrence Functions
M od e K
Car 0.45 -0.04 0.012
Tw o- W heel er 0.1 0.42 0.03
IPT 0.5 -0.29 0.01
Pu b l ic Tran sport 4 -0.24 0.031
The form of the model is such that exponential (α= O) or power (β = O) functions may be used for the
deterrence function. The inclusion of both α and β represents a gamma function, sometimes called a Tanner
function

Comprehensive Mobility Plan for Bengaluru
Page A 3.2 -1
ANNEXURE 3 .2 Popu l ation Proj ection s
Popu l ation Proj ection s1
RMP-2031 has carried out projections for the spatially constant Bengaluru Metropolitan Area based on the
past trends by deploying different statistical models and component method. The models and method
included are:
1. Linear Model (this assumes that Population would increase steadily in a linear pattern); Quadratic
Model and Cubic Models (this assumes that population would experience fluctuations in growth pattern)
2. Logistic Model (this assumes that population would reach saturation at some point in the future).
3. Ration Method (this assumes that population would increase steadily in relation to Karnataka
Urban Population)
4. Component Method (using birth and death rate and migration)
Population projections for BMA based on different methods (Statistical and Demographic) ranges from 11.8
million to 24.7 million for 2031. Table 6-7 clearly shows that Linear Method and Component (demographic)
method are predicting two extreme ends of the projections. Linear method has projected the lowest
population for 2031. However, these estimates are likely to attain by the year 2017 in reality. Hence, these estimates can’t be considered. The component method has projected population for higher end, which is
almost 2.5 times the 2011 population for BMA. Hence, considering this population may be inappropriate.
T a b l e 6 - 7 : O b s e r v e d & P r o j e c t e d P o p u l a t i o n R a n g e f o r B M A : 1 9 7 1 - 2 0 3 1 ( i n ‘ 0 0 0 0 0 )
Y ear Ob serv ed Popu l ation
Proj ected Popu l ation
Lin ear Q u ad ratic Cu b ic Logistic Com pon en t Ratio
M ethod 1971 20.12 16.06 21.22 20.06 21.24 NA NA1981 32.58 33.08 30.5 32.83 30.6 NA NA1991 45.3 50.09 44.93 44.93 44.09 NA NA2001 61.9 67.11 64.53 62.2 63.51 NA NA2011 90.45 84.13 89.29 90.45 91.49 98 90.45 2016 92.64 103.6 110.52 109.81 116.26 108.2 2021 101.15 119.21 135.51 131.8 149.14 129.44 2026 109.65 136.1 166.17 158.19 192.2 157.93 2031 118.16 154.29 203.21 189.87 247.38 192.68
R- sq u are2 0 .9 6 4 3 6 0 .9 9 5 4 0 .9 9 9 9 1 0 .9 9 3 7 6 NA NA
1 L ike any oth er forecasts, population forecasts h ave th eir limitations. Master Plan h as attempted to proj ect th e population for th e B MA by as scientific an approach as possible with available data. Predicting th e future course of h uman fertility, mortality and migration is an educated guess at best, especially wh en th ese are bound to be deeply influenced by advancements in medicine, food production and availability, climatic variability, socio- cultural setting, political and economic conditions and a h ost of oth er factors. Th erefore, caution must be ex ercised wh ile making or using population proj ections. Th e main limitation of th is population proj ection ex ercise is th at th e proj ections h ave been made on th e basis of a

Comprehensive Mobility Plan for Bengaluru
Page A 3.2 -2
limited five decades of data considering th e unavailability of earlier C ensus records due to ch ange in j urisdiction. A noth er limitation is limited data availability for age, sex , mortality & birth and in- migration at planning area level, wh ich is essential input to th e demograph ic meth od of population proj ection. 2 R- sq uared = Ex plained variation / Total variation; R- sq uared is always between 0 and 1 . a) 0 indicates th at th e model ex plains none of th e variability of th e response data around its mean and b) 1 indicates th at th e model ex plains all th e variability of th e response data around its mean. In general, th e h igh er th e Rsq uared, th e better th e model fits your data. H owever, th ere are important conditions for th is guideline th at I’ ll talk about both in th is post and my nex t post.
Population projections by three methods, namely Logistics, Ratio and Cubic method are in the range of 19-
20 million. The projection by logistic model (19 million) is ideal considering the fact that the population
cannot grow forever due to its natural carrying capacity limit and instead population growth will taper off and reach saturation. However, while planning for metropolitan region it would be appropriate to plan for
higher range to account for sudden growth in the population – which cannot be predicted. Also, that the R-
square among the statics method is close to accuracy for cubic method.
The Population Projection methodology and results were shared with Department of Economics and
Statistics, GoK and Institute for Social and Economic Change for independent review and confirmation. Both
have confirmed that the BMA population could be in the range of 19 to 20 million by 2031. Hence it is
appropriate to consider projections by Cubic method at 20.3 million for BMA by 2031.

C o m p r e h e n s i v e M o b i l i t y P l a n f o r B e n g a l u r u
P a g e A 4 . 1 - 1
ANNEXURE 4 .1Draf t Ben gal u ru Tran sit Orien ted Dev el opm en t ( TOD) Pol icy , J an u ary , 2 0 1 9
1 In trod u ction
1.1 Bengaluru is the capital of Karnataka state and fifth largest city in India in terms of population. The
city is the foremost IT hub of the country and has a GDP1 of $ 110 billion which is 4th largest after
Mumbai, Delhi and Kolkata. The Bengaluru Metropolitan Region (BMR)2 is spread over an area about
1294 sq.km houses 9.1 million people as per 2011 census and is expected to double and reach about
20.3 million by 2031. Bruhat Bengaluru Mahanagara Palike (BBMP) which is the core of Metropolitan area houses 8.4 million people over an area of 712.54 sq.km. The population density of BMR and
BBMP is 70 pph and 118 pph respectively which can be considered as medium density and lower
than the URDPFI guidelines for Megacities.
1.2 Due to inadequate public transport (current share is about 48% ), private vehicles have been growing
exponentially. The city has second highest number of registered vehicles in India i.e. 75.06 lakh after
New Delhi. Rapid growth of private vehicles coupled with inadequate road network has resulted in
lower travel speeds, longer commuting time, traffic congestion, road fatalities, vehicular pollution
which in turn led to economic costs and had an adverse impact on the quality of life. In order to
address the above issues, transit oriented development (TOD) is the way forward. In this direction, Government of Karnataka has ambitious plans of expanding Metro and suburban rail services in the
city with huge investments. TOD will help mass transit to achieve its full potential and aid in
sustainable mobility.
1.3 It has been observed that there are anomalies in the approach of revised Master Plan -2031 which
advocates TOD but fails to propose the landuse strategies. Bengaluru city needs to align its landuse
and transport policies as per National Urban Transport Policy (2014), National TOD Policy (2017),
Metro Policy (2017) and guide the developments along the mass transit corridors to achieve the
sustainable mobility. Thus, TOD Policy will serve as guiding document to all agencies who are involved in planning and implementation of urban/transport projects.
2 TOD Z on es
2.1 Transit Oriented Development (TOD) is defined as the development of concentrated nodes of
moderate-to-high mixed landuse density within 5 to 10 minutes of walking distance from mass transit
1 B u siness W orld, J u ne, 2017 2 A rea u nder B DA for w hich Revised Master Plan- 2031 ( draft) has been prepared.

C o m p r e h e n s i v e M o b i l i t y P l a n f o r B e n g a l u r u
P a g e A 4 . 1 - 2
stations which are well integrated with pedestrian, bicycle, feeder and transit networks. Broadly,
TOD zone can be divided into three sub-zones for the purpose of application of TOD norms where transit stations are located are about on kilometre interval.
a. Intense TOD Zone (500 m on either side of the transit corridor)
b. Standard TOD Zone (500 m to 1000 m on either side of the transit corridor)
c. Transition TOD Zone (1000 m to 2000 m on either side of the transit corridor)
2.1.1 However, for Commuter Rail where the interstation distance varies from 1.5 km to 3 km, Intense
and Standard TOD zone shall be 500 m and 1000 m radius from the Rail Stations.
3 Scope an d Appl icab il ity
3.1 The policy is applicable for all the Local bodies, Departments, Agencies, Authorities, Parastatals and
Companies that play a role in the planning, funding, implementation, management and monitoring of urban transport and landuse operating in Bengaluru Metropolitan Region (BMR).
4 Vision
4.1 Bengaluru will be a public transport oriented city that is compact, people friendly, environment
friendly and support economic growth while offering a good quality of life.
5 Goal s
5.1 The major goals of TOD policy include achievement of 70% share of public transport in motorised
trips and 60% of the city population living within intense TOD zone. This may require about 600 km3
of mass transit corridors4. Adequate infrastructure shall be developed so as to achieve the gross
density ranging from 250 to 400 pph5 along the mass transit corridors by 2031.
6 Com pon en ts of TOD an d Pol icy Gu id el in es f or TOD
6.1 The major components of TOD framework (also known as 6Ds) are density, diversity, design,
destination accessibility, distance to transit and demand management.
3 I t is based benchmark of 0. 03 k m Mass transit per 1000 popu lation. 4 Metro Rail/ Commu ter Rail/ B RTS designed for a minimu m Peak H ou r Peak Direction Traffic ( PH PDT) of 10, 000 or more is considered as Mass Transit 5 pph- persons per hectare
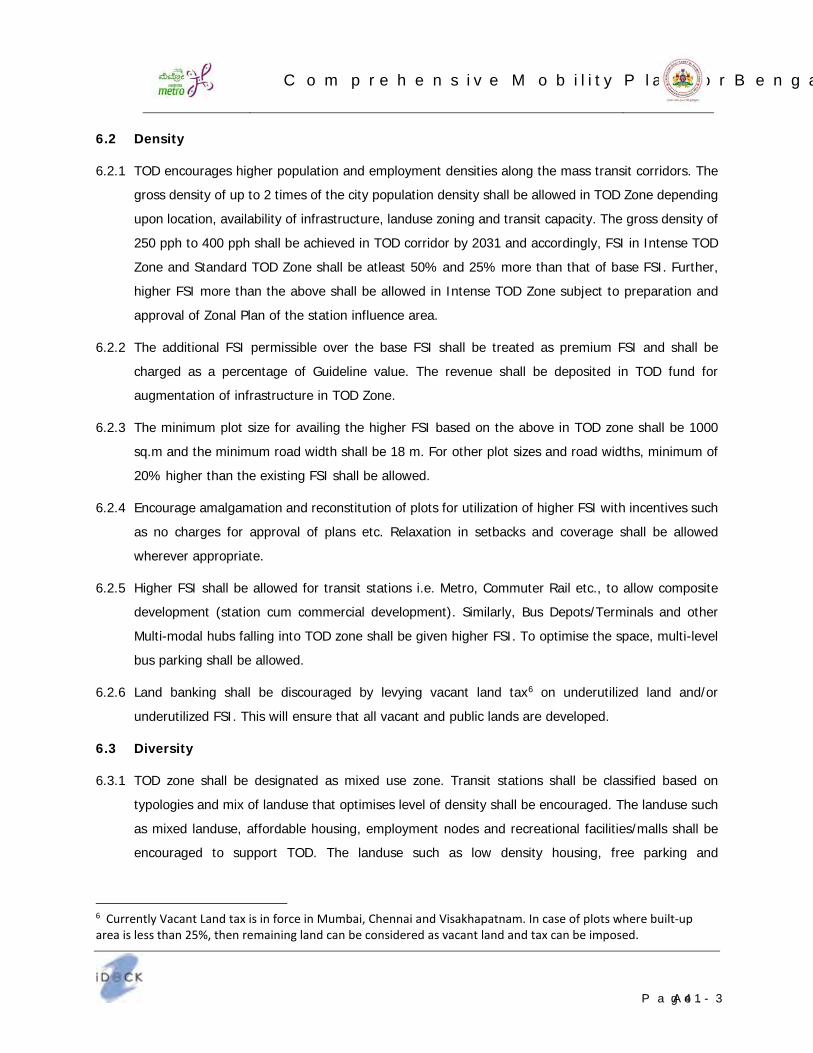
C o m p r e h e n s i v e M o b i l i t y P l a n f o r B e n g a l u r u
P a g e A 4 . 1 - 3
6 .2 Den sity
6.2.1 TOD encourages higher population and employment densities along the mass transit corridors. The gross density of up to 2 times of the city population density shall be allowed in TOD Zone depending
upon location, availability of infrastructure, landuse zoning and transit capacity. The gross density of
250 pph to 400 pph shall be achieved in TOD corridor by 2031 and accordingly, FSI in Intense TOD
Zone and Standard TOD Zone shall be atleast 50% and 25% more than that of base FSI. Further,
higher FSI more than the above shall be allowed in Intense TOD Zone subject to preparation and
approval of Zonal Plan of the station influence area.
6.2.2 The additional FSI permissible over the base FSI shall be treated as premium FSI and shall be
charged as a percentage of Guideline value. The revenue shall be deposited in TOD fund for augmentation of infrastructure in TOD Zone.
6.2.3 The minimum plot size for availing the higher FSI based on the above in TOD zone shall be 1000
sq.m and the minimum road width shall be 18 m. For other plot sizes and road widths, minimum of
20% higher than the existing FSI shall be allowed.
6.2.4 Encourage amalgamation and reconstitution of plots for utilization of higher FSI with incentives such
as no charges for approval of plans etc. Relaxation in setbacks and coverage shall be allowed
wherever appropriate.
6.2.5 Higher FSI shall be allowed for transit stations i.e. Metro, Commuter Rail etc., to allow composite development (station cum commercial development). Similarly, Bus Depots/Terminals and other
Multi-modal hubs falling into TOD zone shall be given higher FSI. To optimise the space, multi-level
bus parking shall be allowed.
6.2.6 Land banking shall be discouraged by levying vacant land tax6 on underutilized land and/or
underutilized FSI. This will ensure that all vacant and public lands are developed.
6 .3 Div ersity
6.3.1 TOD zone shall be designated as mixed use zone. Transit stations shall be classified based on
typologies and mix of landuse that optimises level of density shall be encouraged. The landuse such
as mixed landuse, affordable housing, employment nodes and recreational facilities/malls shall be encouraged to support TOD. The landuse such as low density housing, free parking and
6 Cu rrently V acant L and tax is in force in Mu mbai, Chennai and V isak hapatnam. I n case of plots w here bu ilt- u p area is less than 25 % , then remaining land can be considered as vacant land and tax can be imposed.
C o m p r e h e n s i v e M o b i l i t y P l a n f o r B e n g a l u r u
P a g e A 4 . 1 - 4
surface/multi-level parking, petrol pumps/CNG stations, automobile garages, warehouses and
cremation grounds that does not support TOD shall be discouraged.
6.3.2 The policies encouraging redevelopment shall be incorporated through development control
regulations. Separate Redevelopment Cell shall be established within BBMP/BDA to focus on
redevelopment projects. Land pooling shall be adopted for redevelopment /revitalisation of inner
city.
6.3.3 Mixed landuse integrated development shall be promoted for large parcels of land (with combination
of housing for various income strata, commercial development, road and other infrastructure). In
such developments, minimum 30% shall be allocated for residential, 20% for commercial, public &
semi-public use and remaining 50% as per existing zoning. The minimum plot size shall be 5000 sq.m and minimum road width shall be 18 m. An additional 25% FSI over and above permissible FSI
in Intense and standard TOD zone shall be allowed. Charges for premium FSI shall be exempted for
affordable housing projects. No charges for amalgamation of plots should be levied.
6.3.4 The mixed use development has to mandatorily incorporate affordable housing and open
spaces/circulation areas. In order to promote affordable housing, out of the 30% of residential use,
a minimum of 20% of the built up area shall be utilized for EWS (30-40 sqm) and LIG (40-60 sqm)
housing. Further, if according to the Zonal Development Plan, the land-use to be developed is
residential, out of the 50% of the remaining built up area, a minimum of 30% shall be reserved for EWS and LIG housing. Existing slums in TOD zones shall be upgraded or encouraged for in-situ
rehabilitation. As an incentive for slum redevelopment, a TDR of 30 sqm per slum household shall
be provided. Rental housing and offices, hostels shall be encouraged along the TOD zones.
6.3.5 Open spaces7 is critical to offset the impact of dense mixed use developments and improve
environment and quality of life. Regulations may be framed to mandate the developer to allocate
10% of the land abutting the road for development of parks which are accessible to general public
for the plot sizes more than 2500 sq.m8.
6 .4 Design
6.4.1 Good built environment will encourage walking and cycling and promote the use of public transport. As per NMSH9 parameters, streets shall be planned.
7 Park s, play grou nds, areas u nder landscaping and avenu e tree plantations 8 Chennai DCRs has su ch provisions. I t is k now n as Open Space Reserve ( OSR) land. 9 Parameters for the N ational Mission on Su stainable H abitant ( N MSH ) - Report of the Su b- Committee on U rban Transport

C o m p r e h e n s i v e M o b i l i t y P l a n f o r B e n g a l u r u
P a g e A 4 . 1 - 5
6.4.2 Green buildings shall be encouraged by incentives such as additional FSI of 10% , reduced processing
fee and priority clearance from development authorities.
6.4.3 Proven and innovative sustainable building, energy, water, landscape and waste management
practices shall be implemented.
6.4.4 Bangalore Metropolitan Land Transport Authority (BMLTA), shall prepare and adopt street design
guidelines and policy for pedestrians, NMT and parking to cater to the local context and ensure
uniform implementation. This will help ready reference for various agencies involved planning, design
and construction of various infrastructure elements within the city.
6 .5 Destin ation Accessib il ity
6.5.1 In order to improve the destination accessibility, roads along the mass transit corridors and other public transport corridors shall have minimum ROW of 30 m and 25 m respectively. At least one road
on each side of the station which acts as feeder road shall have a minimum ROW of 15m.
6.5.2 High frequency feeder services in terms of regular buses, mini buses, mini vans shall be provided by
transit agencies depending upon the commuter demand.
6.5.3 Park and Ride facilities shall be developed within station area for all the transit stations. Larger park
and ride facilities shall be developed at terminal stations as well as stations at outskirts where
availability of land is not a major constraint. Concessional parking rates for bicycle parking shall be
adopted to promote the use of bicycles as an access mode to transit. Integrated network of Public Bike Sharing Scheme (PBS) shall be implemented.
6 .6 Distan ce to Tran sit
6.6.1 Direct walking paths to be provided to transit stations without any detour e.g. walking paths through
parks, exclusive skywalks from major trip generators such as malls.
6 .7 Dem an d M an agem en t
6.7.1 Demand management includes parking management, congestion pricing, hawker management, flexi
office timings, shift-wise schools and measures to encourage work at home to reduce the travel.
6.7.2 There is a need to increase the supply of paid off-street parking facilities at strategic locations to
contain the tendency of on-street parking. Shared parking shall be developed at depots, terminals and multi-modal hubs etc. Registration of new cars shall be allowed subject to proof of having the
parking facility at residence or shared parking facility of the community. In TOD zone parking of 1.33

C o m p r e h e n s i v e M o b i l i t y P l a n f o r B e n g a l u r u
P a g e A 4 . 1 - 6
ECS10 per 100 Sqm. of development shall only be permitted. Shared and unbundled parking should
be encouraged.
6.7.3 Regulation of hawkers is important to reduce the encroachments which obstruct the free flow of
pedestrian and vehicular traffic through demarcation of hawker zones into red zone where hawkers
are not permitted at all times, amber zone where hawkers are permitted during certain period of
time and green zone where hawkers are permitted all the time. The civic body can issue to the
licences with small fees to regulate the number of hawkers.
6 .8 Au gm en tation of In f rastru ctu re
6.8.1 Adequate provision of infrastructure is pre-requisite for transit oriented development. BMLTA in
association with ULBs and other infrastructure agencies shall prepare a comprehensive plan integrating all the utilities, physical infrastructure and essential facilities such as roads, sewers,
drainage, electric lines, green spaces, police post, fire post, electric sub-stations etc.
7 In stitu tion al Fram ew ork
7.1 TOD is a complex urban development project involving multiple agencies and who carryout functions
such as policy making, financing, development and management of various infrastructure facilities.
The major agencies such as BDA, BBMP, BMTC, BMRCL, BWSSB, BESCOM, Traffic Police and RTO
shall be involved in TOD project. In addition to above, PWD, NHAI and BIAL may also be required in
some cases.
7.2 BMLTA was created in 2007 through GO, has limited powers to facilitate co-ordination, planning and implementation of urban transport programs and could not play the role of UMTA as envisaged.
Therefore, BMLTA needs to be revived with adequate powers, funding and technical and managerial
staff to discharge the functions of UMTA.
7.3 BMLTA shall review the funding of TOD projects and take steps for mobilization of funds and
encouraging Public Private Participation (PPP) projects. It shall laydown principles of sharing the
revenue collected from various sources and ensure that revenue is actually disbursed to all the
agencies involved in TOD.
7.4 There is a need for capacity building in all the organizations in the area of urban planning, transport planning, economics, financing and PPP, real estate etc., to handle TOD projects. Financing, PPP and
10 E CS ( E q u ivalent Car Space) of Car, 2- W heeler, Cycle, B u s and Commercial vehicle is 1. 0, 0. 25, 0. 1, 3. 5 and 3. 5 respectively.

C o m p r e h e n s i v e M o b i l i t y P l a n f o r B e n g a l u r u
P a g e A 4 . 1 - 7
real estate market dynamics are critical for success of TOD projects and therefore BMLTA shall build
capacity in these areas.
8 Fin an cin g of TOD Proj ects
8.1 The various sources for land value capture include charges for premium FSI, Development charges,
one time betterment levy, transfer of development right (TDR), Cess on stamp duty and registration
charges etc., Other potential sources of revenue include enhanced property taxes in TOD influence
zone, Vacant land tax to discourage land banking etc., The revenue sources available for transit
companies include property development, lease from commercial space, advertisement, station
branding, multipurpose smart cards for ticketing etc.
8.2 Air rights of transit station areas are not utilized much in India over the Metro stations. This need to
be explored though various funding and development models with private sector.
8.3 Transit companies can also raise capital by floating tax free Bonds and loans from multi-lateral
agencies like World Bank, ADB, JICA and EIB etc., Separate TOD fund shall be created for
infrastructure up-gradation/maintenance, enhancement of viability of transit systems etc. in TOD
Zone.
9 Im pl em en tation Strategy
9.1 BMLTA shall undertake planning, design, funding and oversee implementation of TOD projects.
Actual implementation shall be carried out by respective infrastructure agencies such as BBMP,
BMRCL, BMTC, BWSSB etc.
9.2 TOD Policies shall be incorporated in the Master Plan. Development Control regulations which are part of Master Plan shall be revised in line with philosophy of TOD. A separate chapter shall be
incorporated on TOD in Master Plan describing overall objective, demarcation of TOD zones, Landuse
and Transport strategy, provisions and incentives for promotion of TOD.
9.3 GIS mapping of developments shall be utilized to identify the violations of building regulations. This
will bring in transparency and make available of rich source of useful information for monitoring real
estate trends, forecast of revenue from value capture methods and helps in planning future
strategies. Steep penalty shall be imposed for violations. In case where building violations have
severe negative impact on the surroundings, buildings shall be demolished. Adequate staff shall be deployed for monitoring the building violations.

C o m p r e h e n s i v e M o b i l i t y P l a n f o r B e n g a l u r u
P a g e A 4 . 1 - 8
9.4 Funding is critical for implementation of TOD project. The broad resource plan shall be prepared
clearly identifying various sources of revenues, rules for sharing of costs, benefits and risks among the stakeholders. This will ensure long term commitment of public agencies and private sector for
implementation of TOD projects.
1 0 Com m u n ication an d ou treach
10.1 Communication and outreach programmes shall be primarily be carried by BMLTA in addition to local
bodies and infrastructure agencies. Implementation of TOD projects can only be successful if the
concepts of TOD and benefits are communicated to broader audience i.e. various stakeholders
involved in landuse and transport planning, private developers and general public through
workshops, consultations and market outreach programs through print, electronic and social media.
10.2 Atleast 0.5% of the annual budget of TOD shall be earmarked for communication and outreach programs.

Comprehensive Mobility Plan for B engalu ru
Page A 4 . 2 - 1
ANNEX URE 4. 2
P e r f o r m a n c e T a r g e t s / I n d i c a t o r s D a t a S o u r c e / R e p o r t i n g M e c h a n i s m
M i l e s t o n e
D e s i g n a n d M o n i t o r i n g F r a m e w o r k
D e s i g n S u m m a r y
O u t c o m e :
A s s u m p t i o n s , R i s k s , a n d C o n s t r a i n t s
I n n o v a t i v e f e a t u r e , i f a n y , i n d e s i g n o r i m p l e m e n t a t i o n m o d a l i t y :
O u t p u t s
I n p u t s
A c t i v i t yA c t i v i t i e s w i t h M i l e s t o n e s

Comprehensive Mobility Plan for B engalu ru
Page A 4 . 2 - 2

Comprehensive Mobility Plan for B engalu ru
Page A 4 . 2 - 3

Comprehensive Mobility Plan for B engalu ru
Page A 4 . 2 - 4


