Arnold Schwarzenegger Governor Linda S. Adams Secretary for Environmental Protection California Regional Water Quality Control Board Central Valley Region Katherine Hart, Chair 11020 Sun Center Drive #200, Rancho Cordova, California 95670-6114 Phone (916) 464-3291 • FAX (916) 464-4645 http://www.waterboards.ca.gov/centralvalley California Environmental Protection Agency Recycled Paper FINAL REPORT Field Analysis of Ammonia 20 May 2010 Introduction/Background Rudy Schnagl and Leticia Valadez met to discuss the evaluation of analytical techniques proposed in the upcoming WDR for the dairy industry (2006-2007). Rudy Schnagl and Leticia Valadez meet with Cooperative Extension Specialist, Marsha Cambell Mathews to evaluate sampling challenges as well as the “Quick Test Method” she had developed and was in the process of validating at the ANR Analytical Lab, UCDavis. When evaluated and irrespective of the analytical equipment used, the published analytical techniques and Marsha Cambell Mathews “Quick Test” method provide accurate results with one downfall in that they all generate hazardous waste which would need special management. During the same time period, Terry Bechtel presented challenges faced in the field during discharge investigations, and the ability of dairy operators to comply with portions of the monitoring requirements of the existing milk cow diary general order. Leticia Valadez proposed the use of a non destructive measurement process utilizing test strips, a temperature compensating electrical conductivity/pH meter for measurements used to calculate total and unionized ammonia. Terry Bechtel and Leticia Valadez collected field samples to validate the use of the test strips for investigative screening and as a potential compliance method for ammonia field testing requirements specified in the WDR for dairies. Project Objectives Validate tool used to aid field staff during sampling events when responding to and investigating agricultural discharges. Develop procedure for measuring ammonia/nitrate/nitrite to satisfy required field testing requirements stated in the WDR. Provide a quick field test to alert the dairy operator to a potential problem, correct it, and prevent pollution rather than monitor it after it has occurred. Available Technology Researched Published Methods EPA Methods AOAC Methods Standard Methods 21 st Edition Methods Unpublished Methods Marsha Cambell Mathews: “Quick Test” Confined aquatic methods
Transcript
Arnold
Schwarzenegger Governor
Linda S. Adams Secretary for
Environmental Protection
California Regional Water Quality Control Board Central Valley Region
Katherine Hart, Chair
11020 Sun Center Drive #200, Rancho Cordova, California 95670-6114 Phone (916) 464-3291 • FAX (916) 464-4645
http://www.waterboards.ca.gov/centralvalley
California Environmental Protection Agency
Recycled Paper
FINAL REPORT
Field Analysis of Ammonia
20 May 2010
Introduction/Background Rudy Schnagl and Leticia Valadez met to discuss the evaluation of analytical techniques proposed in the upcoming WDR for the dairy industry (2006-2007). Rudy Schnagl and Leticia Valadez meet with Cooperative Extension Specialist, Marsha Cambell Mathews to evaluate sampling challenges as well as the “Quick Test Method” she had developed and was in the process of validating at the ANR Analytical Lab, UCDavis. When evaluated and irrespective of the analytical equipment used, the published analytical techniques and Marsha Cambell Mathews “Quick Test” method provide accurate results with one downfall in that they all generate hazardous waste which would need special management. During the same time period, Terry Bechtel presented challenges faced in the field during discharge investigations, and the ability of dairy operators to comply with portions of the monitoring requirements of the existing milk cow diary general order. Leticia Valadez proposed the use of a non destructive measurement process utilizing test strips, a temperature compensating electrical conductivity/pH meter for measurements used to calculate total and unionized ammonia. Terry Bechtel and Leticia Valadez collected field samples to validate the use of the test strips for investigative screening and as a potential compliance method for ammonia field testing requirements specified in the WDR for dairies.
Project Objectives Validate tool used to aid field staff during sampling events when responding to and investigating agricultural discharges. Develop procedure for measuring ammonia/nitrate/nitrite to satisfy required field testing requirements stated in the WDR. Provide a quick field test to alert the dairy operator to a potential problem, correct it, and prevent pollution rather than monitor it after it has occurred.
Available Technology Researched Published Methods EPA Methods AOAC Methods Standard Methods 21st Edition Methods
Final Report 20 May 2010 Field Analysis of Ammonia
2
Timeline: 2007 – 2008
Validation Studies Test strip analysis performed on Dairy samples when out in the field; comparison of data between test strips and data results from laboratory analysis.
Deliverable The result of this project produces a standard operating procedure for semi-quantitative testing total ammonia and unionized ammonia as field measurements.
Stakeholders/Public Outreach Central Valley Regional Board Staff Department of Fish and Game Dairy Industry Terry Bechtel and Leticia Valadez attended the Western Dairy Trade show; Orland, CA to present the use of the test strips…industry professionals welcomed their use. Dairymen inquired on where to purchase the strips and displayed interest in future public outreach on the measurement techniques. Terry Bechtel demonstrated and trained Department of Fish and Game wardens in using the test strips during investigations of discharges. These test strips are now an official part of the field test kit for CVRWQCB Dairy Unit.
Cost: The cost of each test strip is approximately: $1.00
Results
Pros: 1. Standard Operating Procedure developed for ammonia analysis. 2. Cost is $1 per sample using test strip versus $110/sample by Fish and Game
laboratory analysis 3. Field measurement data indicates if there is a problematic situation immediately
upon testing which allows for quick assessment of potential problems…results in a “pollution prevention” tool.
4. Allows for compliance with the following regulations:
Final Report 20 May 2010 Field Analysis of Ammonia
3
Monitoring and Reporting Program No. R5-2007-0035 Waste Discharge Requirements General Order for Existing Milk Cow Dairies
Table 3. DISCHARGE MONITIORING
Unauthorized Discharges (Including Off-Property Discharges) of Manure or Process Wastewater from the Production Area or Land Application Area Daily during each discharge to surface water: For surface water upstream6 and downstream7 of the discharge: Field measurements for electrical conductivity, dissolved oxygen, temperature, and pH. Laboratory analyses for nitrate-nitrogen, total ammonia-nitrogen, unionized ammonia-nitrogen, total Kjeldahl nitrogen, total phosphorus, potassium, total dissolved solids, BODs, total suspended solids, and total and fecal coliform.
Storm Water Discharges to Surface Water from the Production Area Daily during each discharge to surface water: Record date, time, approximate volume, duration, location, source, and ultimate destination of the discharge. For (1) the discharge and surface water (2) upstream and (3) downstream of the discharge: Field measurements of electrical conductivity, temperature, pH, total ammonia-nitrogen, and unionized ammonia-nitrogen. Laboratory analyses for nitrate-nitrogen, turbidity, total phosphorus, and total and fecal coliform.
Storm Water Discharges to Surface Water from Each Land Application Area8 First storm event of the wet season9 and during the peak storm season (typically February)10 each year from one third of the land application areas11 with the land application areas sampled rotated each year12: Record date, time, approximate volume, duration, location, and ultimate destination of the discharge. Field measurements of the discharge for electrical conductivity, temperature, pH, total ammonia-nitrogen, and unionized ammonia-nitrogen. Laboratory analyses of the discharge for nitrate-nitrogen, phosphorus, turbidity, and total and fecal coliform.
6Upstream samples shall be taken just far enough upstream so as not to be influenced by the
Final Report 20 May 2010 Field Analysis of Ammonia
4
discharge. 7Downstream samples shall be taken just far enough downstream where the discharge is blended with the receiving water but not influenced by dilution flows or other discharges. 8 Sample locations must be chosen such that the samples are representative of the quality and quantity of storm water discharged. 9 This samples shall be taken from the first storm event of the season that produces significant storm water discharge such as would occur during continuous storm water runoff for a minimum of one hour, or intermittent storm water runoff for a minimum of three hours in a 12-hour period. 10 This sample shall be taken during a storm event that produces significant storm water discharge and that is preceded by at least three days of dry weather. The sample shall be taken during the first hour of the discharge. 11 One land application area shall be sampled for Dischargers that have four to six land application areas, etc. 12 The Discharger may propose in the annual storm water report to reduce the constituents and/or sampling frequency of storm water discharges to surface water from any land application area based on the previous year’s data (see Storm Water Reporting below). 13 Tailwater samples shall be collected at the point of discharge to surface water.
Cons: 1. Method requires GLP for field measurements of Temperature and pH. Dilutions of
concentrated waste waters add additional steps to the field analysis. 2. Data generated is not as analytically accurate as laboratory analysis and is best
used for screening and applied as a semi-quantitative analysis; although, the results do alert if a problem exits in the field and enables the operator to identify a problem, correct it, and prevent pollution.
Future This technique could be expanded as a measurement tool in other program units or agencies. Additional studies to promote expansion of the use of the test strips as a tool. Acknowledgements I would like to thank Terry Bechtel, Charlene Herbst, and Rudy Schnagl for all of their time and effort put into this project. I really appreciate Terry Bechtel’s effort in putting together the charts to facilitate interpretation of the results generated through use of this method by field staff and dairy operators. If anyone has any questions regarding this project, please contact: Leticia E. Valadez CVRWQCB Staff Chemist/QA Officer [email protected] 916-464-4634 Attachments:
1. Standard Operating Procedure 2. Ammonia Test Strip Evaluation Tests
Field Analysis of Ammonia 20 May 2010 – Attachment 1 Standard Operating Procedure
1
FINAL REPORT
Field Analysis of Ammonia 20 May 2010
Attachment 1
Standard Operating Procedure
Total Ammonia Nitrogen test using a dip strip
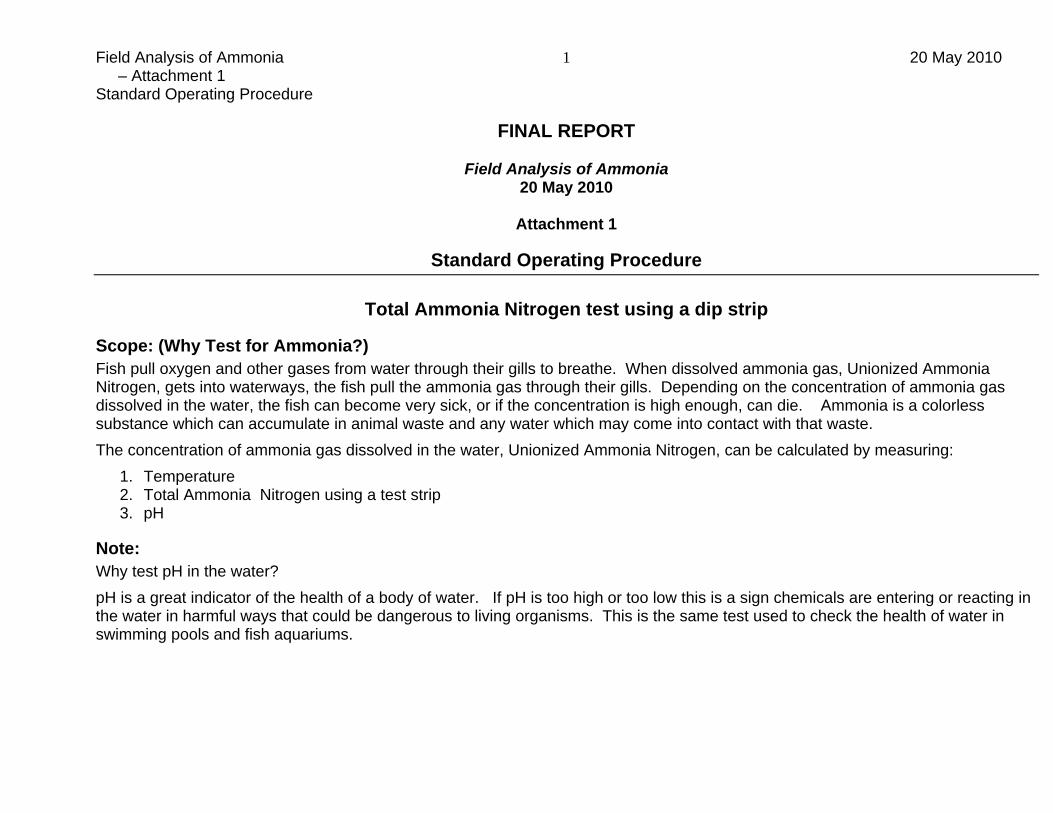
Scope: (Why Test for Ammonia?) Fish pull oxygen and other gases from water through their gills to breathe. When dissolved ammonia gas, Unionized Ammonia Nitrogen, gets into waterways, the fish pull the ammonia gas through their gills. Depending on the concentration of ammonia gas dissolved in the water, the fish can become very sick, or if the concentration is high enough, can die. Ammonia is a colorless substance which can accumulate in animal waste and any water which may come into contact with that waste. The concentration of ammonia gas dissolved in the water, Unionized Ammonia Nitrogen, can be calculated by measuring:
1. Temperature 2. Total Ammonia Nitrogen using a test strip 3. pH
Note: Why test pH in the water? pH is a great indicator of the health of a body of water. If pH is too high or too low this is a sign chemicals are entering or reacting in the water in harmful ways that could be dangerous to living organisms. This is the same test used to check the health of water in swimming pools and fish aquariums.
Field Analysis of Ammonia 20 May 2010 – Attachment 1 Standard Operating Procedure
2
A test for the measurement of “Total Ammonia Nitrogen” with calculation of “Unionized Ammonia Nitrogen” by use of a Test Kit Strip will provide information regarding the amount of waste that may be discharged to a water body, forming the fish toxic to “Unionized Ammonia Nitrogen”.
Materials Needed: 1. Total Ammonia Nitrogen measuring kit 2. Sample containers 3. Deionized water 4. Temperature measuring device 5. pH measuring device 6. Buffers appropriate for measuring pH 7. Graduated cylinder when making dilutions 8. Record book and pen for noting sample data 9. Calculator
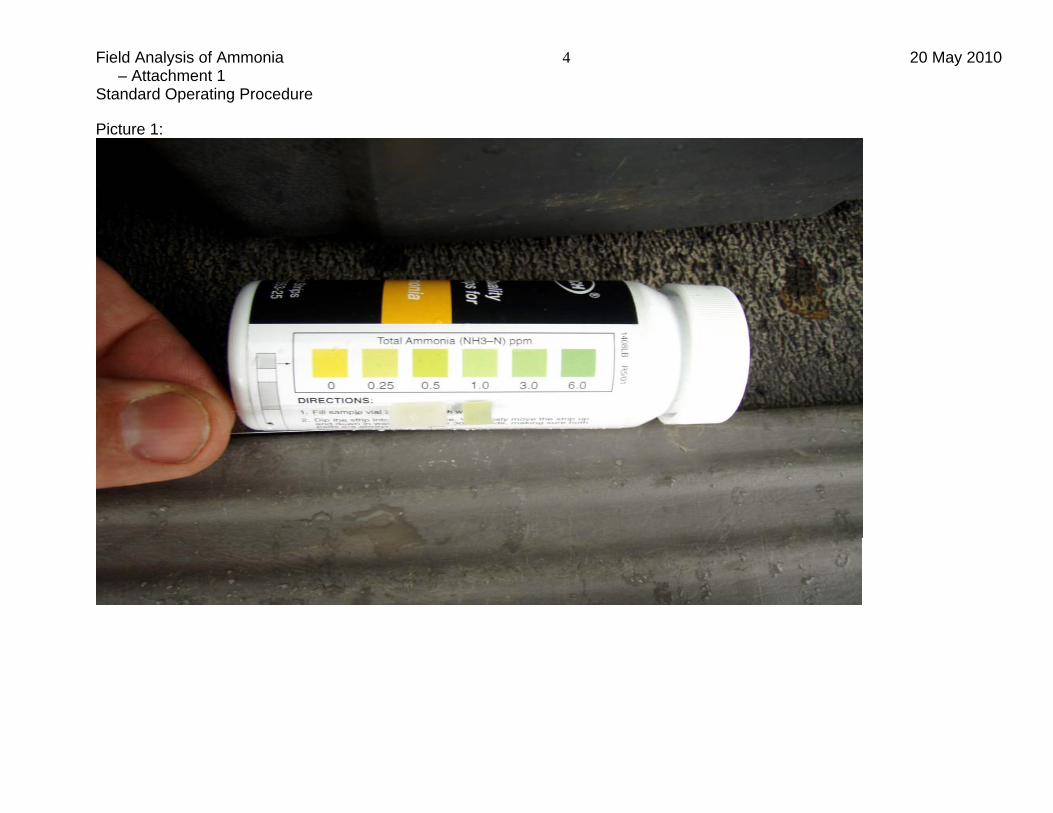
Follow the directions of the particular brand of test strips purchased. The general procedure is as follows (independent of brand). See picture 1
1. Pour sample into test tube container. 2. Dip the measurement strip into the sample for the suggested time, (5-30 seconds). The time the strip will be in the samples
varies by brand of test kits. 3. Remove the test strip from the sample and wait the suggested time before comparing the test strip color to the color scale on
the package container. 4. Note the amount 5. Measure the temperature of the sample 6. Measure the pH of the sample 7. Use the provided chart to calculate the Unionized Ammonia (UIA) based on the recorded pH and temperature
Note: If the Total Ammonia Nitrogen (TAN) sample concentration is greater than the highest concentration on the test strip scale, you need to dilute your sample and retest for TAN; you do NOT need to retest the pH and the temperature of the diluted sample.
Field Analysis of Ammonia 20 May 2010 – Attachment 1 Standard Operating Procedure
3
To dilute a sample: 1. Add sample aliquot to measure 5 mls on the sample test tube. 2. Add Deionized water to the 10 ml mark, cap, and mix well. Follow the directions used to measure TAN. This is a two times
dilution factor. 3. Use this new diluted TAN value, and the multiplication factor of 2 to put into your calculation for Un-ionized Ammonia (UIA).
Note: A 10 times dilution would be 1 ml of sample with water added to the 10 ml mark…mix well after diluting
Calculation Example Step 1: Measure TAN using test strip: measured 1.0 mg/l Step 2: Measure sample temperature: measured 75° (24°C) Step 3: Measured pH is 8.0. Step 4: The multiplication factor from the Table 1 is 0.0502 mg/l (this is where the pH in left hand column intersects the temperature listed across the top of the table). Step 5: Total AN x factor from Table 1 = UIA mg/l
For this example, UIA = 1.0 x 0.0502 mg/l =0.0502 mg/l Once you have made all of your measurements, you can use the color coded charts to interpret your results. Note: If this TAN measurement would have been for sample diluted by two, then: UIA = 1.0 *0.0502mg/l * 2 = 0.1004 mg/l Note: TAN: Total Ammonia Nitrogen UIA: Unionized Ammonia
Field Analysis of Ammonia 20 May 2010 – Attachment 1 Standard Operating Procedure
4
Picture 1:
Field Analysis of Ammonia 20 May 2010 – Attachment 1 Standard Operating Procedure
5
Calculation Aids: Excel spreadsheet with formulas (EPA recommended calculation):
pH T in
degree C
NH3 as N
(mg/L) NH3 mg/L pKa
% NH3 in aqueous ammonia solutions for 0-30
C and pH 6-10 Un-ionized NH3 mg/L
7.4 18 43 52 9.4649 0.0085 0.45
Formulas NH3 mg/L = NH3 as N mg/L / 0.822 pKa = (0.09018 + 2729.92) / (Temp. in degree C + 273.2) % NH3 (aq) = 1/ ((10^(pKa-pH) + 1) Percent ammonia calculation for solutions from 0-30 C and pH 6-10. Unionized Ammonia = NH3 mg/L X % NH3 (aq)
Emmerson, K. et. al.. 1975. Aqueous Ammonia Equilibrium Calculation: Effect of pH and Temperature.
Journal of the Fisheries Research Board of Canada., Vol.32(12):2379-2383.
Field Analysis of Ammonia 20 May 2010 – Attachment 1 Standard Operating Procedure
6
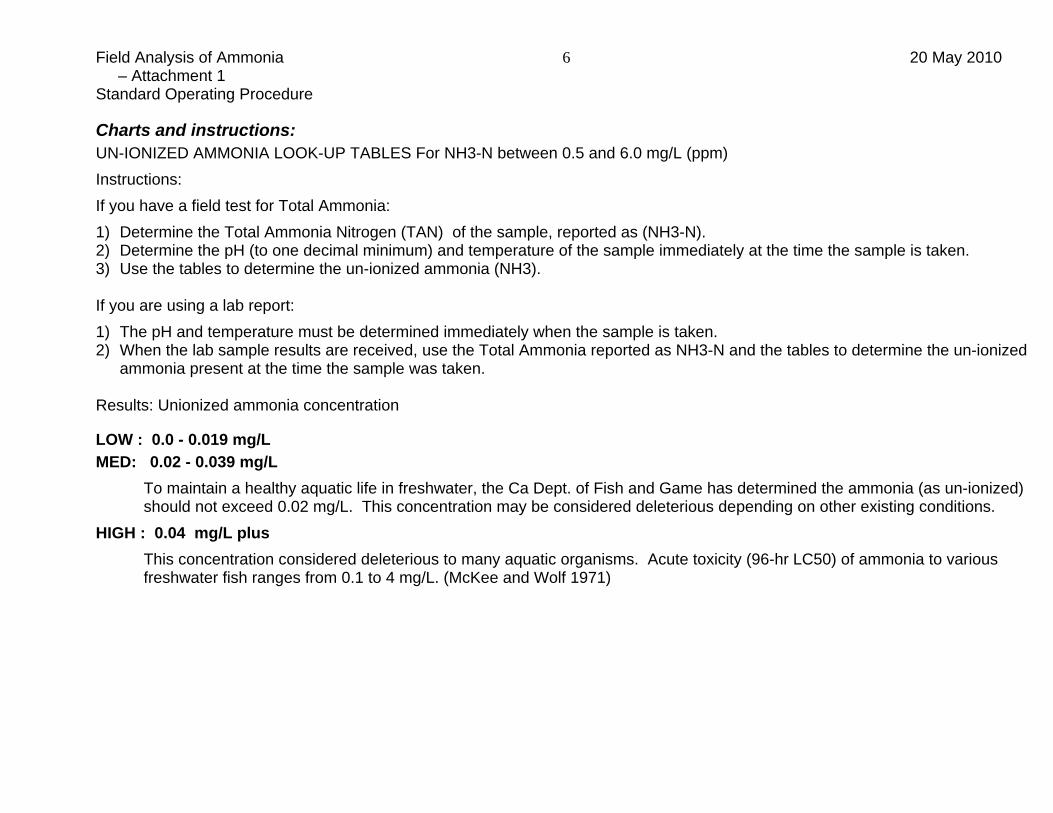
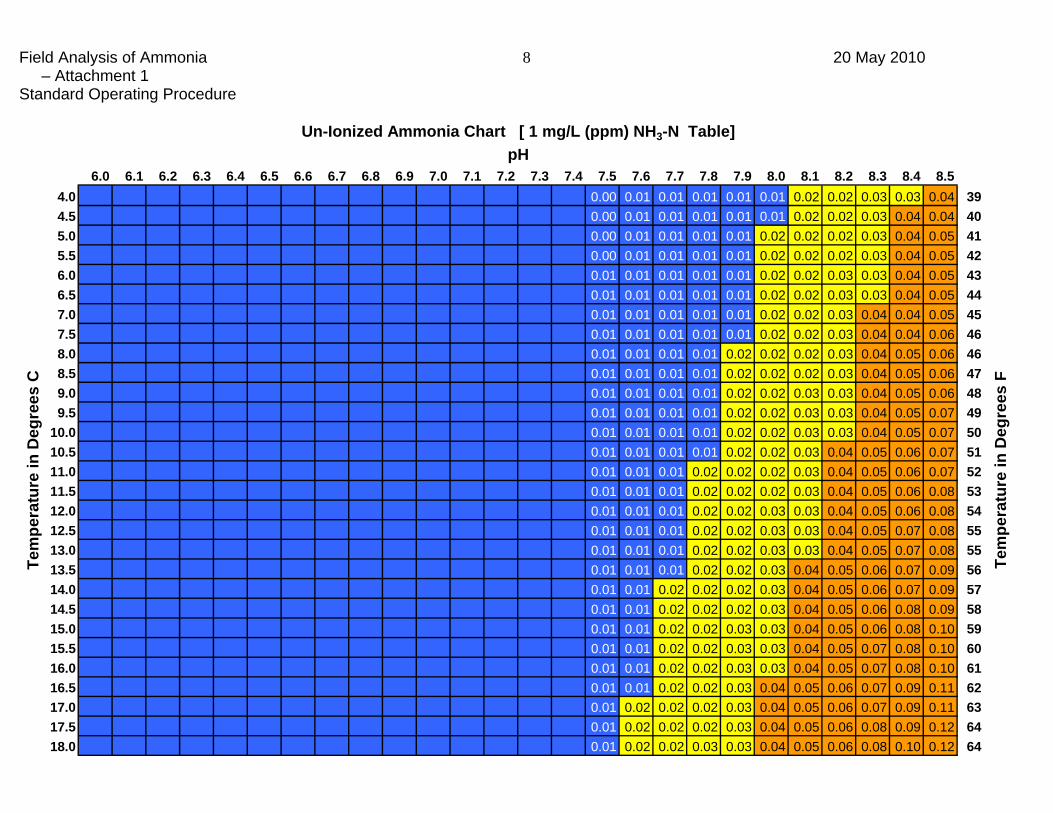
Charts and instructions: UN-IONIZED AMMONIA LOOK-UP TABLES For NH3-N between 0.5 and 6.0 mg/L (ppm) Instructions: If you have a field test for Total Ammonia: 1) Determine the Total Ammonia Nitrogen (TAN) of the sample, reported as (NH3-N). 2) Determine the pH (to one decimal minimum) and temperature of the sample immediately at the time the sample is taken. 3) Use the tables to determine the un-ionized ammonia (NH3). If you are using a lab report: 1) The pH and temperature must be determined immediately when the sample is taken. 2) When the lab sample results are received, use the Total Ammonia reported as NH3-N and the tables to determine the un-ionized
ammonia present at the time the sample was taken. Results: Unionized ammonia concentration
LOW : 0.0 - 0.019 mg/L MED: 0.02 - 0.039 mg/L
To maintain a healthy aquatic life in freshwater, the Ca Dept. of Fish and Game has determined the ammonia (as un-ionized) should not exceed 0.02 mg/L. This concentration may be considered deleterious depending on other existing conditions.
HIGH : 0.04 mg/L plus This concentration considered deleterious to many aquatic organisms. Acute toxicity (96-hr LC50) of ammonia to various freshwater fish ranges from 0.1 to 4 mg/L. (McKee and Wolf 1971)
Field Analysis of Ammonia 20 May 2010 – Attachment 1 Standard Operating Procedure
Field Analysis of Ammonia 20 May 2010 – Attachment 1 Standard Operating Procedure
12
Note - These tables are intended for field management purposes. They are to be used as a tool to help evaluate the nature of field and facility runoff and prevent off-property discharges of deleterious levels of ammonia. They can also be used for general facility and waste management practices. Due to the dynamic nature of discharge events, these tables are not to be used for enforcement purposes. References - Emmerson, K. et. al.. 1975. Aqueous Ammonia Equilibrium Calculation: Effect of pH and Temperature. Journal of the Fisheries Research Board of Canada., Vol.32(12):2379-2383.
Field Analysis of Ammonia 20 May 2010 – Attachment 1 Standard Operating Procedure
13
Conversion factor chart based on temperature and pH
Field Analysis of Ammonia 20 May 2010 – Attachment 1 Standard Operating Procedure
14
How to Use the Chart - Following the directions of your ammonia test method, determine the Total Ammonia Nitrogen (NH3-N, mg/L) of the sample. Determine the pH and the temperature of the sample at the time the sample was obtained. With the chart above, follow the pH row and temperature column to find the conversion factor. Multiply the conversion factor from the chart times the Total Ammonia Nitrogen (NH3-N) of the sample to get the Un-ionized Ammonia (NH3) of the sample*. If the pH or temperature fall between the ones listed on the chart, estimate the conversion factor in the chart. Results - To maintain a healthy aquatic life in freshwater, the California Department of Fish and Game has determined that ammonia levels (measured as NH3) should not exceed 0.02 mg/L undissociated ammonia.** Level that exceed 0.02mg/L unionized (undissociated) ammonia, as determined using the chart above, may be subject to enforcement. Example - pH = 7.6, Temp = 57oF, Total Ammonia = 6 mg/L, the conversion factor would be 0.001. Total Ammonia of 6 mg/L X 0.001 = 0.06 mg/L un-ionized Amm. If the temperature was 55F (about half way between 53.6 and 57.2 on the table), estimate a conversion of about 0.0093 (about half way between 0.0086 and 0.0100).
* Emmerson, K. et. al.. 1975. Aqueous Ammonia Equilibrium Calculation: Effect of pH and Temperature. Journal of the Fisheries Research Board of Canada., Vol.32(12):2379-2383.
** California Department of Fish and GameBiological Significance - referenece McKee J.E. and H.W. Wolf, 1971. Water Quality Criteria Publication 3-A, California State Water Resources Control Board
Field Analysis of Ammonia 20 May 2010 - Attachment 2
Ammonia Test Strip Evaluation Tests
1
FINAL REPORT
Field Analysis of Ammonia 20 May 2010
Attachment 2
AMMONIA TEST STRIP EVALUATION TESTS
Evaluation of Ammonia Test Strips Using Standard Solution 30 Nov 2009 Using a laboratory standard solution of 10mg/L NH3-N, six dilutions were made and one non-diluted 10 mg/L standard (Hach Nitrogen, Ammonia Standard Solution 10 mg/L as NH3-N, Lot A7022, Exp. Jan-12). The dilutions are noted above. The test strips used were the Hach AquaCheck Water Quality Test Strips for Ammonia. The test strips were measured using the directions on the bottle. Parts per million (ppm) for Total Ammonia (NH3-N) ppm were read using the color chart on the bottle. All solutions and test were conducted at laboratory room temperature. Test of Strips Using the Standard (10mg/L NH3-N) ID ppm
of mix Description Test Strip
ppm Comments
1 1 ppm 9 ml water + 1 ml standard 1.0 2 2 ppm 8 ml water + 2 ml standard 2.0 3 3 ppm 7 ml water + 3 ml standard 3.0 4 4 ppm 6 ml water + 4 ml standard 3.0 - 6.0 5 5 ppm 5 ml water + 5 ml standard 3.0 - 6.0 Color appeared closer to 6 than 3,
but still within the two colors 6 6 ppm 4 ml water + 6 ml standard 6.0 7 10 ppm 0 ml water + 10 ml standard >6.0 Blue on strip
Field Analysis of Ammonia 20 May 2010 - Attachment 2
Ammonia Test Strip Evaluation Tests
2
Evaluation of Ammonia Test Strips – Old vs New (Using Lagoon Water) A test was conducted to evaluate variation between old test strips (greater than 1 1/2 years old) and recently purchased test strips. Using the standard solution, three dilutions were made. Each dilution was tested with an older test strip and a newer test strip. It is also important to note that the test strip storage guidelines must be followed since moisture within the storage container can result in low ammonia values. The results are listed in the table below: Dilution Old Test Strip
ppm NH3-N New Test Strip ppm NH3-N
0.1 ml lagoon water/100ml D.I Water 0.25 0.5 0.2 ml lagoon water/100ml D.I Water 0.5 2.0 0.4 ml lagoon water/100ml D.I Water 1.0 2.0 – 3.0 Evaluation of Ammonia Test Strips Using Lagoon Water 01 Dec 2009 The same procedure was used to check for total ammonia using dairy wastewater as was used to check the standard solution. All vials were rinsed with de-ionized water and then triple rinsed with the wastewater between each sample. Only the new test strips were used. Lagoon Water Test Strip ID Description Test
* Off chart due to temperature range ** Based on Test Strip data using Emmerson, K. et. al.. 1975. Aqueous Ammonia Equilibrium Calculation: Effect of pH and Temperature. Calculated Un-ionized Ammonia – When the test strip data was a range, the results were adjusted for the purposes of a calculation value (ie. in Sample 2 the range of 3-6 ppm was adjusted to 4.0 for the purpose of the calculation). The values used are shown in the table below: ID pH Temp T. Amm Un-Ionized
CONCLUSION The test strips appear to provide a semi-quantitative determination of the total ammonia. They work well as a management practice when assessing water at the level of:
- Zero to low levels (0-2 ppm), no anticipated problem - Moderate (3-5 ppm), some ammonia. Check system and evaluate. - Potential problem (6->6 ppm), likely discharge at deleterious levels.
Staff has been using this method for a number of years as supplemental information to determine if a property discharge may be deleterious and warrants laboratory sampling and further discharge inspection.
Field Analysis of Ammonia 20 May 2010 - Attachment 2
Ammonia Test Strip Evaluation Tests
4
The test strips provide a quick field level evaluation in real time. If used just before water leaves the property, the test provides a method to detect and prevent a deleterious discharge. Also provides the grower with a tool to evaluate their facility system for ammonia management levels. With the margin of error in evaluating the exact color match to parts per million multiplied by the volumes applied, the test is not accurate enough to be used for nutrient management. The test strip method provides an in-field test for total ammonia as required by the General Order, but should not be used as the primary method for regulatory enforcement. Unionized ammonia can be calculated using the total ammonia number, field sample temperature and pH values.