Mitigation of Trans-Boundary Air Pollution from Coal-Fired Power Plants in Northeast Asia Financed by Asian Development Bank Project Number: TA6371-REG Final Report Prepared for Asian Development Bank and NEASPEC By HJI Group Corp. In association with Beijing Lucency Enviro-Tech Co. Ltd. May 2012
Transcript
Mitigation of Trans-Boundary Air Pollution from
Coal-Fired Power Plants in Northeast Asia
Financed by Asian Development Bank Project Number: TA6371-REG
Final Report
Prepared for
Asian Development Bank
and
NEASPEC
By
HJI Group Corp.
In association with
Beijing Lucency Enviro-Tech Co. Ltd.
May 2012
Mitigation of Trans-Boundary Air Pollution from Coal-Fired Power Plants in Northeast Asia (TA No. 6371-REG) Final Report
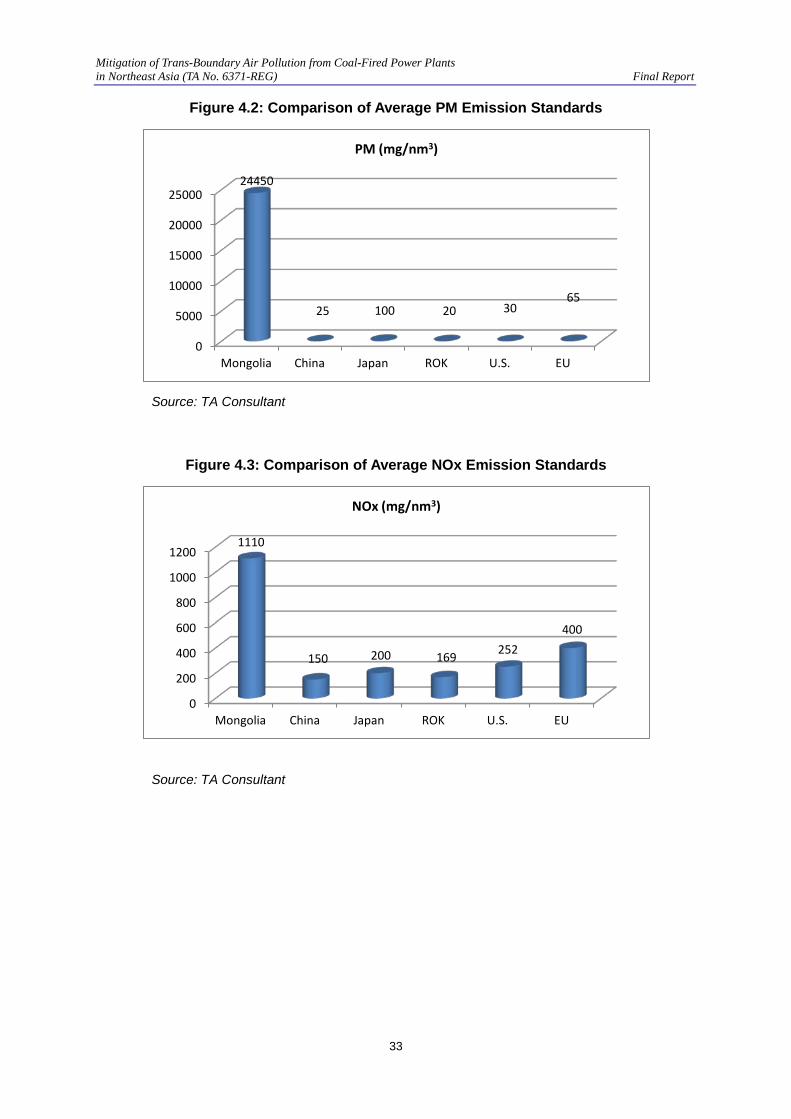
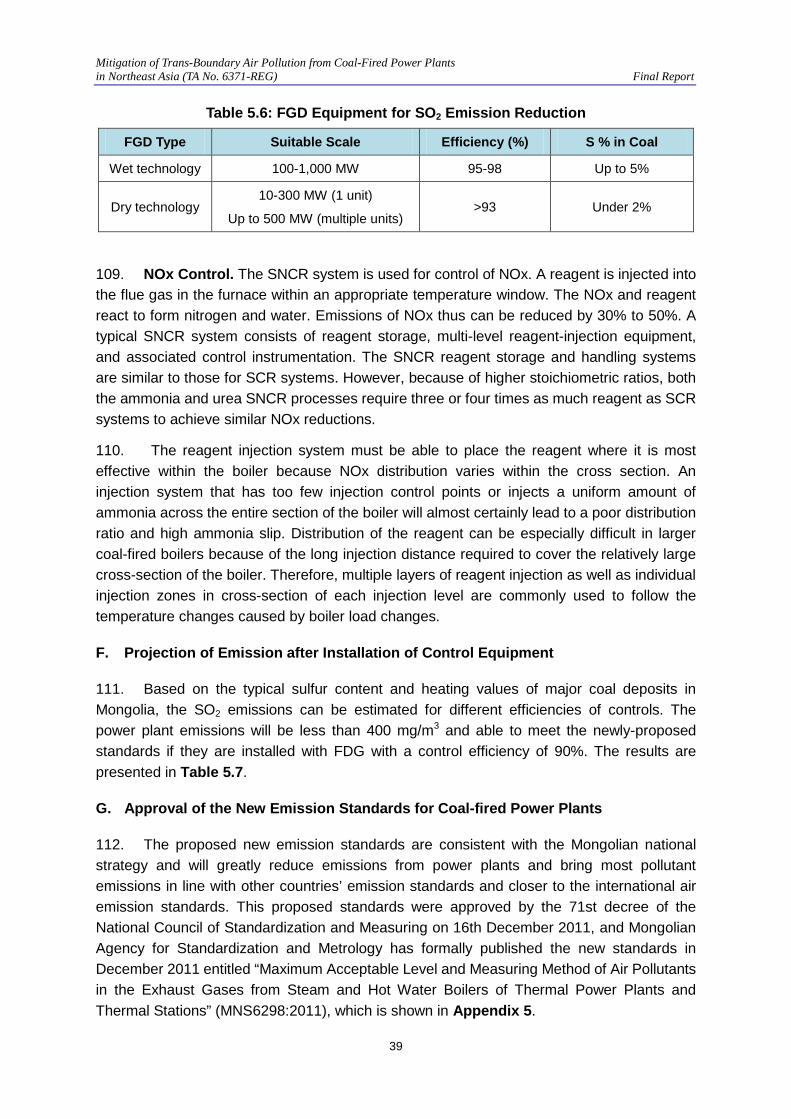
i
ABBREVIATIONS
ADB – Asian Development Bank CAA – Clean Air Act CCS – carbon capture and storage CCTP – climate change technology program CDM – clean development mechanism CEC – China Electricity Council CFB – circulating fluidized bed CFBC – circulating fluidized bed combustion CHP – combined heat and power CO – carbon monoxide CO2 – carbon dioxide CPP – Changshu Power Plant DOE – Department of Energy (U.S.) EIA – environmental impact assessment ESCO – energy service company ESP – electrostatic precipitator EU – European Union FF – fabric filter FGD – flue gas desulphurization FYP – Five-Year Plan GDP – gross domestic product GGH – gas-to-gas heater GHG – greenhouse gas HOB – heat only boiler HES – heat exchange station IGCC – integrated gasification combined cycle LHV – lower heating value LLB – Lurgi Lentjes Bischoff MHI – Mitsubishi Heavy Industries MMRE – Ministry of Mineral Resources and Energy MNET – Ministry of Nature, Environment and Tourism NEASPEC – North-East Asian Subregional Programme for Environmental
Cooperation NEDO – New Energy Industry Techchology Development Organization NOx – nitrogen oxides NSPS – New Source Performance Standards O&M – operations and maintenance PM – particulate matters PRC – People’s Republic of China PV – photovoltaic ROK – Republic of Korea
Mitigation of Trans-Boundary Air Pollution from Coal-Fired Power Plants in Northeast Asia (TA No. 6371-REG) Final Report
ii
SC – supercritical SCE – standard coal equivalent SCR – selective catalytic reduction SNCR – selective non-catalytic reduction SO2 – sulfur dioxides SO3 – sulfur trioxide SOx – sulfur oxides SWW – sea-water washing TA – technical assistance tce – tons of standard coal equivalent1 UB – Ulaanbaatar UK – United Kingdom U.S. – United States USC – ultra-supercritical USEPA – U.S. Environmental Protection Agency WHO – World Health Organization
CURRENCY EQUIVALENTS
(As of 1 May 2012)
Currency Unit – Togrog (MNT) 1.00 MNT = $ 0.00077 $1.00 = 1,300 MNT Currency Unit – Chinese Yuan (CNY) CNY1.00 = $0.158 $1.00 = 6.31 CNY
WEIGHTS AND MEASURES
GW (giga watt) – 1,000,000,000 watts kW (kilowatt) – 1,000 watts kWh (kilowatt-hour) – 1,000 watts-hour MW (megawatt) – 1,000,000 watts W (watt) – unit of active power Cal (Calorie) – unit of energy Gcal (giga calorie) – 1,000,000,000 calorie ton – metric ton
NOTE
In this report, “$” refers to U.S. dollar, and yuan or CNY refers to Chinese yuan.
1 Coal with a heating value of 7,000 kCal/kg is referred to as standard coal.
Mitigation of Trans-Boundary Air Pollution from Coal-Fired Power Plants in Northeast Asia (TA No. 6371-REG) Final Report
iii
CONTENTS
MAP
EXECUTIVE SUMMARY 1 A. Introduction 1 B. Power Plants in Northeast Asia 1 C. Emission Standards for Coal-fired Power Plant 2 D. Proposed Emission Standards for Mongolian Power Plants 3 E. Mitigation Plans and Co-Benefits Approach 4 F. Assessment of FGD Technologies and Demonstration Project 8 G. Demonstration Projects 9 H. Conclusions 10
I. INTRODUCTION 12
II. COAL-FIRED POWER GENERATION TECHNOLOGY 14 A. Summary of Coal-Fired Power Generation Technology 14 B. Energy Efficiency Performance Indicator of Power Plants 15 C. Coal-Fired Power Technology Status and Trends in the PRC 17
III. POWER PLANTS IN NORTHEAST ASIA 19 A. Power Plants in Mongolia 19 B. Power Plants in the PRC 20
IV. EMISSION STANDARDS IN SOME SELECTED COUNTRIES 24 A. Emission Standards for Power Plants in Mongolia 24 B. Emission Standards for Power Plants in the PRC 25 C. Emission Standards for Power Plants in Japan 26 D. Emission Standards for Power Plants in the ROK 27 E. Emission Standards for Power Plants in the United States 28 F. Emission Standards for Power Plants in the EU 29 G. Characteristics of Various Emission Standards 30 H. Comparison of Emission Standards of Various Countries 31
V. PROPOSED EMISSION STANDARDS FOR MONGOLIAN POWER PLANTS 34 A. Scope of New Mongolia Emission Standard 34 B. Structure of New Emission Standards 35 C. Proposed New Standards for Mongolia Power Plants 36 D. Rationale of the Proposed New Standards 37 E. Targets are Achievable 38 F. Projection of Emission after Installation of Control Equipment 39 G. Approval of the New Emission Standards for Coal-fired Power Plants 39
VI. MITIGATION PLANS AND CO-BENEFITS APPROACH 41 A. Mitigation Plan for SO2 and CO2 in the PRC 41 B. Mitigation Plan for SO2 and CO2 in Mongolia 48
VII. FGD ASSESSMENT AND DEMONSTRATION PROJECT 58 A. Assessment of the FGD Technology at Changshu Power Plant 58
Mitigation of Trans-Boundary Air Pollution from Coal-Fired Power Plants in Northeast Asia (TA No. 6371-REG) Final Report
iv
B. Demonstration Projects 61
VIII. Capacity Building and Knowledge Transfer 64 A. Technical Workshops 64 B. Final Workshop in Mongolia 65 C. Final Workshop in Korea 66
IX. CONCLUSIONS AND RECOMMENDATIONS 67
APPENDIX 1: INTERNATIONAL COAL-FIRED POWER INDUSTRY STATUS AND TRENDS 68
APPENDIX 2: COAL-FIRED POWER PLANTS ANALYSIS IN MONGOLIA 72
APPENDIX 3: SUMMARY OF SO2 EMISSION STANDARDS FOR COAL-FIRED POWER PLANTS 78
APPENDIX 4: ASSESSMENT OF FGD TECHNOLOGIES 86
APPENDIX 5: NEWLY APPROVED EMISSION STANDARD IN MONGOLIA 101
APPENDIX 6: NATIONAL STRATEGIC PLAN FOR CO2 REDUCTION IN MONGOLIA 110
APPENDIX 7: SUMMARY OF EXISTING NATIONAL POLICIES AND PLANS RELATED TO SO2 AND CO2 FOR MONGOLIA 129
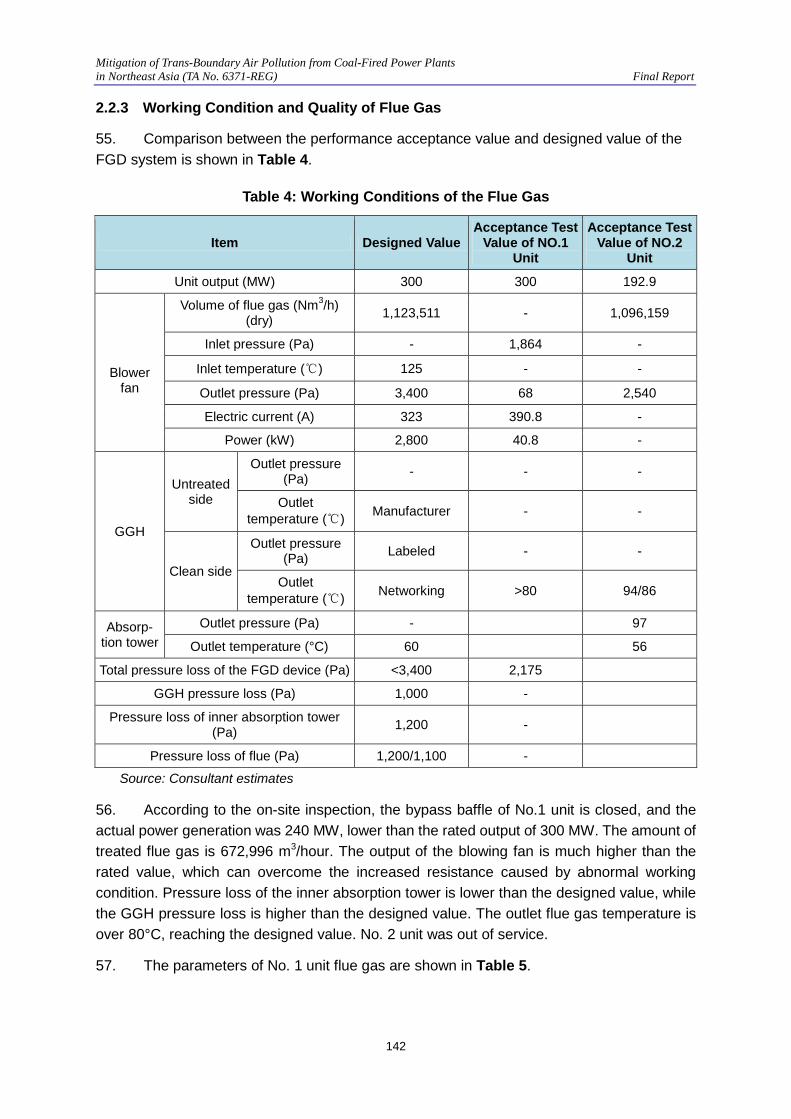
APPENDIX 8: ASSESSMENT OF THE FGD TECHNOLOGY AT CHANGSHU POWER PLANT 135
APPENDIX 9: DEMONSTRATION PROJECTS 163
Mitigation of Trans-Boundary Air Pollution from Coal-Fired Power Plants in Northeast Asia (TA No. 6371-REG) Final Report
v
Mitigation of Trans-Boundary Air Pollution from Coal-Fired Power Plants in Northeast Asia (TA No. 6371-REG) Final Report
1
EXECUTIVE SUMMARY
A. Introduction
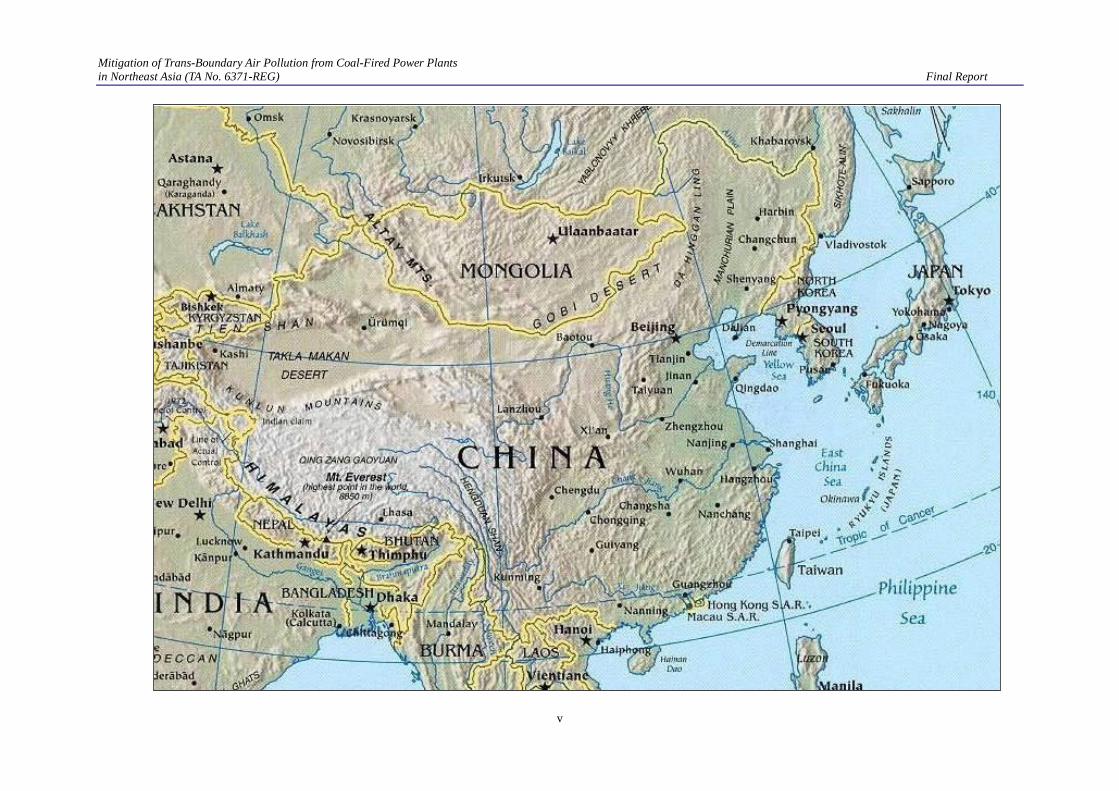
1. Trans-boundary air pollution in Northeast Asia has long been recognized as a serious issue. Actions are urgently needed to deal with acid rain-related environmental impacts and the pollution that impacts other countries in the Northeast Asia sub-region under certain climate conditions. Coal-fired power plants are a major pollutant source of trans-boundary air pollution in Northeast Asia. All countries in the sub-region have coal-fired power plants that produce electric power and generate trans-boundary air pollutants.
2. The People’s Republic of China (the PRC or China) consumes the most energy in the sub-region and has the biggest power generation capacity of coal-fired power plants. Much effort has been taken to control pollutant emissions from these power plants in recent years. The PRC has successfully listed energy/carbon intensity as one of the pollution control targets of the National Eleventh Five-Year Plan (FYP) from 2006 to 2010 and invested heavily in sulfur dioxide (SO2) emission controls. The total cost for rehabilitating SO2 control equipment in the power sector reached CNY43.8 billion during the five years. The SO2 emissions from electric power generation was reduced from 13.5 million ton in 2005 to 9.26 million ton in 2010 (31.4% decrease). In addition, in 2010 the Government of PRC has committed to further reduce carbon intensity by 40-45% by 2020. This will play a highly important role in mitigating trans-boundary air pollution and emission of greenhouse gases (GHGs).
3. Coal-fired power plants in Mongolia are an important pollutant source of local air pollution as well as trans-boundary air pollution due to the absence of necessary desulphurization devices and other adequate emission control measures. Coal-fired power plants and heat-only boilers (HOBs) will contribute more to local and trans-boundary air pollution if strict pollution control measures are not taken. Proper and practical national emission standards are urgently needed, and attention must be paid to Mongolia’s heat and electricity supply systems, which are in poor conditions and have high energy losses. The co-benefits approach in Mongolia will be very valuable for both mitigating air pollution and GHGs and improving the living quality of local people by increasing energy production and utility efficiency and improving management capacity.
4. This study is sponsored by the Asian Development Bank (ADB) and North-East Asian Subregional Programme for Environmental Cooperation (NEASPEC) under ADB’s technical assistance (TA) project number TA 6371-REG.
B. Power Plants in Northeast Asia
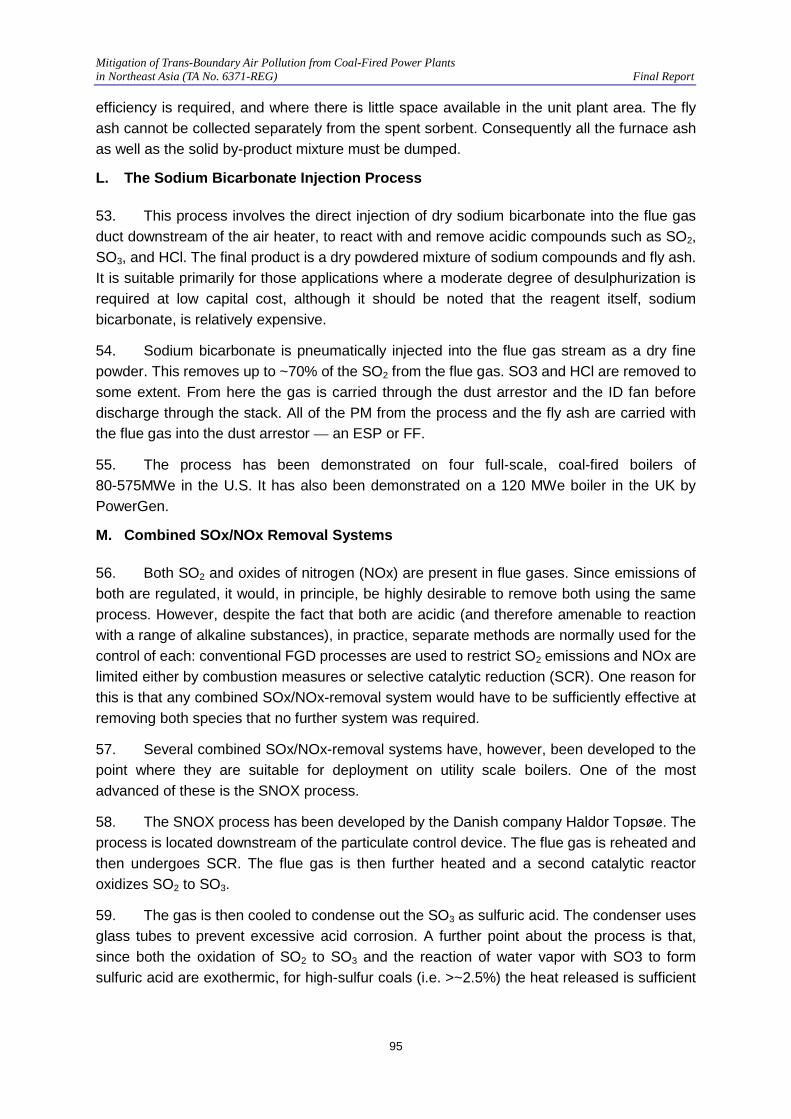
5. Coal-fired power plants provide the majority of power generation for Mongolia. There are seven major coal-fired power plants in Mongolia with a total available capacity of 616 MW and most of them are combined heat and power (CHP) plants. However, due to aging and lack of proper maintenance of the equipment, the thermal efficiencies of these plants are
Mitigation of Trans-Boundary Air Pollution from Coal-Fired Power Plants in Northeast Asia (TA No. 6371-REG) Final Report
2
typically less than 40% and even less than 30% for some plants which are low for CHP facilities.
6. The Government of Mongolia has proposed construction of a new and efficient CHP plant with 820 MW of power generation capacity and 1,280 MW of heat generation capacity to meet the increasing electricity and heat demands in Ulaanbaatar (UB), the capital city of Mongolia. Thus, there is an obvious large potential to increase energy efficiency and reduce air pollutants emissions by replacing inefficient power plants with new efficient ones and rehabilitating existing power plants.
7. The PRC, with the most energy consumption in the world, has the biggest power generation capacity of coal-fired power plants. The total power generation capacity reached 962 GW in 2010, while coal-fired power plants account for approximately 67.6% (650 GW) of the total power generation capacity. The SO2 emission from coal-fired power plants has 42.4% share in total SO2 emission in the PRC in 2010.
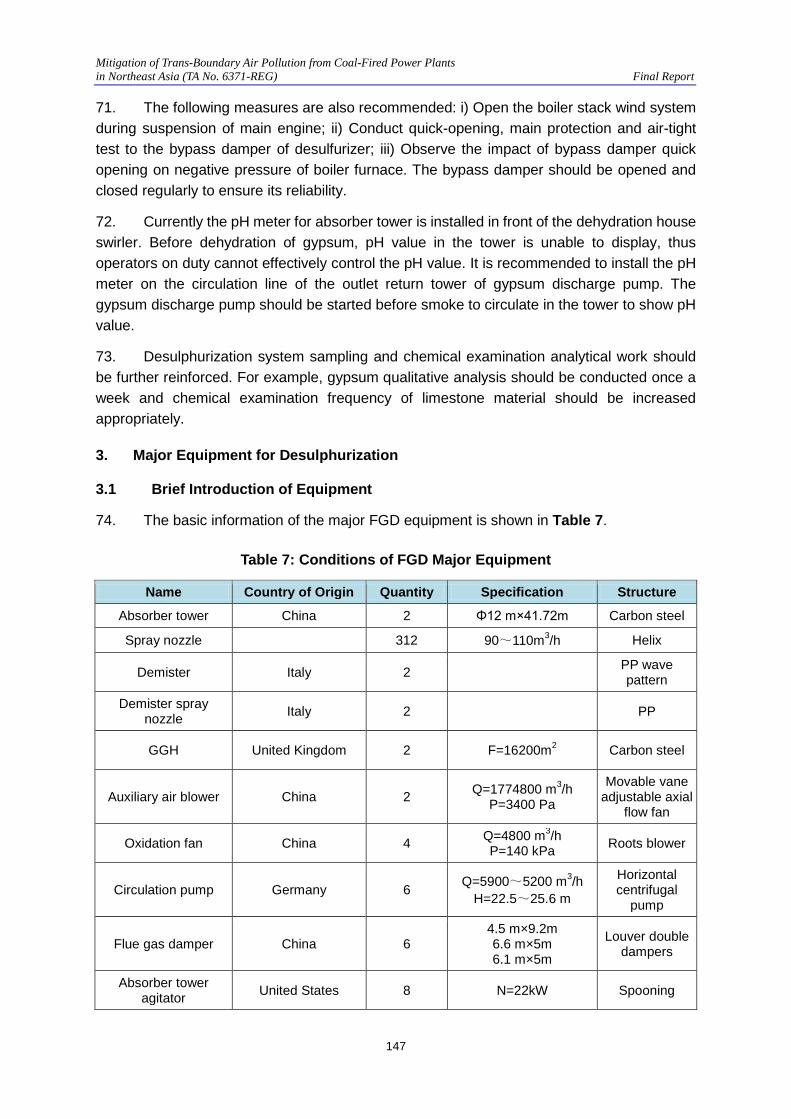
8. It is estimated that coal-fired power generation will continue to increase due to economic development in the PRC. However, renewable energy share is also increasing rapidly. For example, the installed wind power capacity has achieved double-digit growth in four consecutive years, and China has become the world's fastest growing country in the wind power development field. As the coal-fired power generation developed over the past decade, the technologies of power generation and emissions control have also greatly improved. With these developments, energy efficiency and emission reduction have become the important performance indicators and targets for coal-fired power plants.
9. The technical conditions, pollutant emissions, potential of improving energy efficiency and reducing emissions, development trends, and current and future energy efficiency and emission reduction policies associated with coal-fired power plants have been studied and summarized in this report.
C. Emission Standards for Coal-fired Power Plant
10. One of the tasks under the technical assistance is to propose air emission standards for coal-fired power plants in Mongolia. Many countries’ emission standards for coal-fired power plants have been reviewed during the development of the new emission standards for power plants in Mongolia. Current emission standards of some selected countries, including Mongolia, PRC, the Republic of Korea (ROK), Japan, the United States (U.S.), and the United Kingdom (UK), were considered. The proposed standards for Mongolia power plants were adopted by the regulatory authority and new standards for coal-fired power plants have become effective in December 2011.
1. Mongolian Emission Standards
11. The emission standards for coal-fired boilers, including steam boiler for power plants in Mongolia, were established in 2008. The emission standards are complex and cannot be well justified. In addition, the standards are not stringent at all compared to international best practices.
Mitigation of Trans-Boundary Air Pollution from Coal-Fired Power Plants in Northeast Asia (TA No. 6371-REG) Final Report
3
2. Chinese Emission Standards
12. In China, the rapid growth of coal-fired power plants has resulted in increased air pollution. In 1979, the first Chinese environmental protection law was promulgated. Since then, air pollutants emission standards for coal-fired power plants have been updated several times, gradually becoming more stringent.
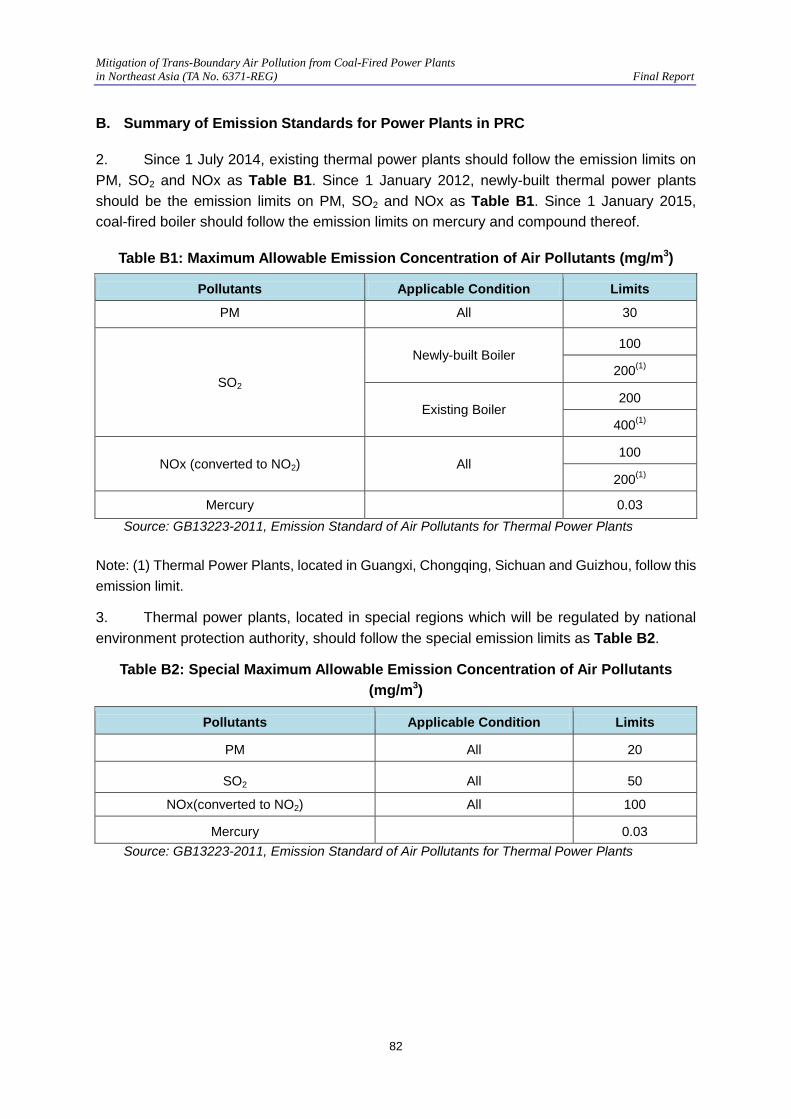
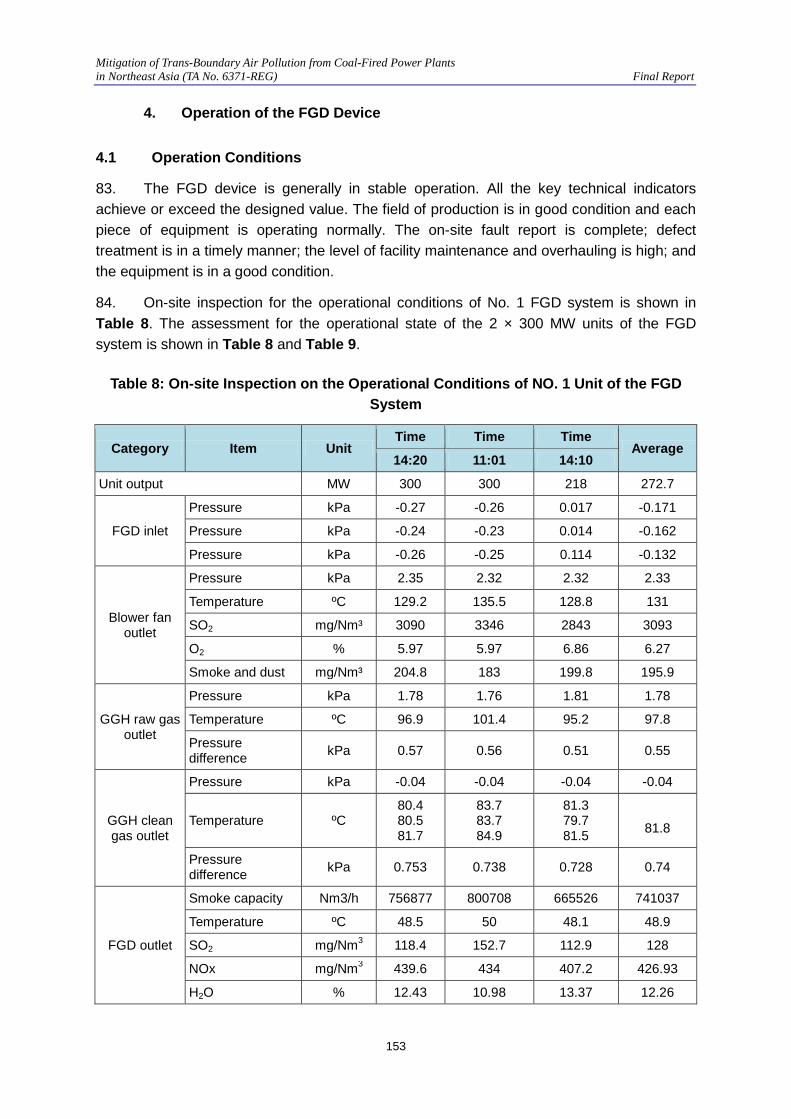
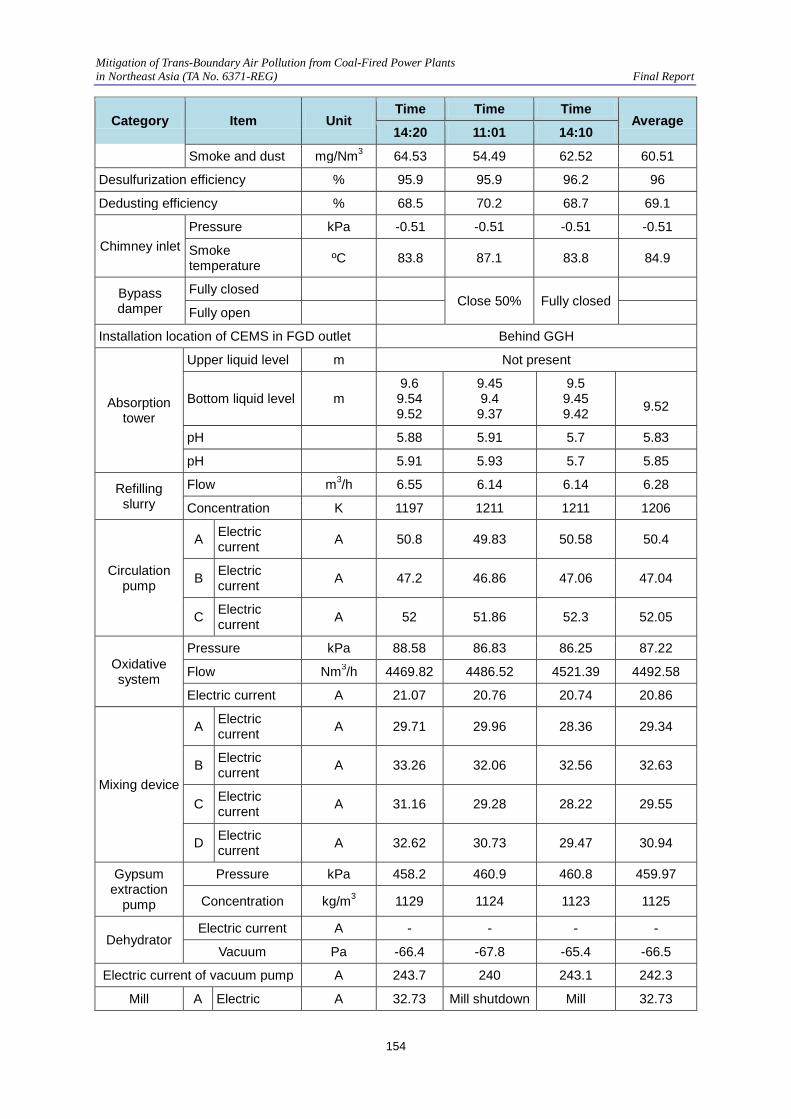
13. China’s current emission standards have gradually caught up with those of the developed countries in Northeast Asia and other places in the world. China has developed its air pollution standard mechanism, acquired from developed countries, considering issues such as policy, social and economic conditions, control technology availability, and financial affordability.
14. The current emission standards for power plants have been revised and the new standards became effective in January 2012. The SO2 emission limit from current 400 mg/m3 to 100 mg/m3 under the new standards for new plants. All coal-fired power plants must install flue gas desulphurization (FGD) to meet the new SO2 emission limits. With the emphasis on environmental protection and technological development, the Chinese air emission standards is becoming more stringent than ever before.
3. Emission Standards of Other Countries
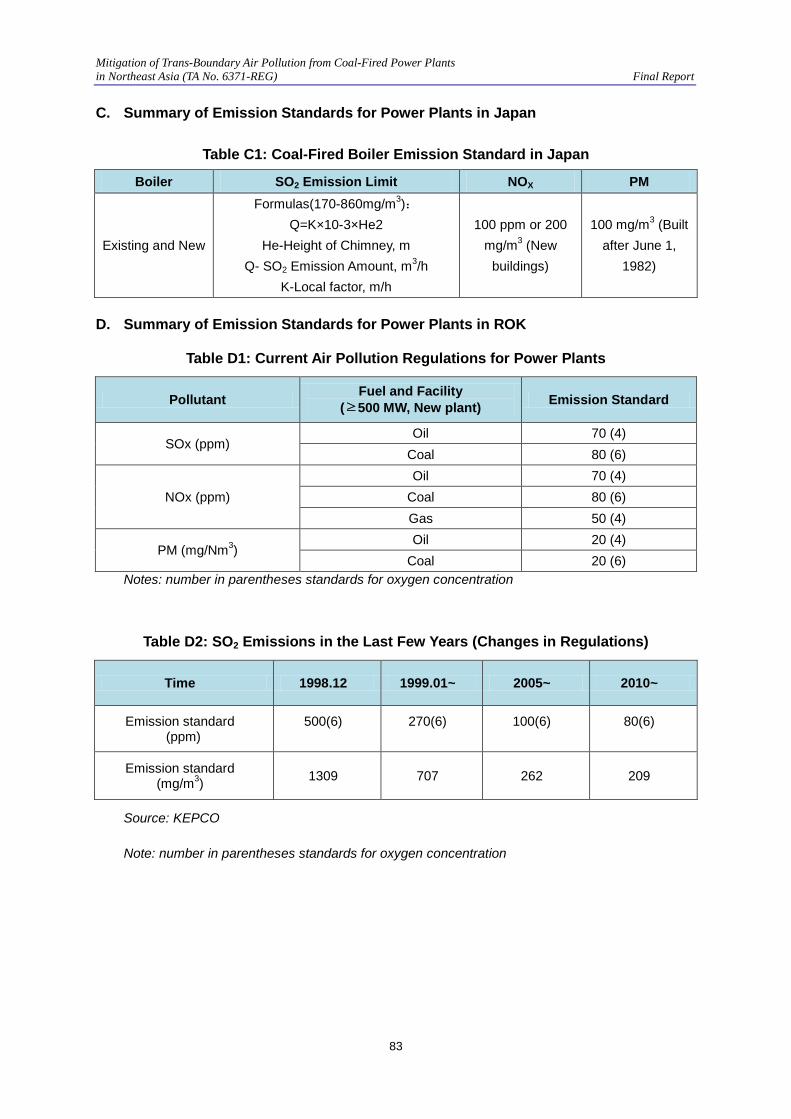
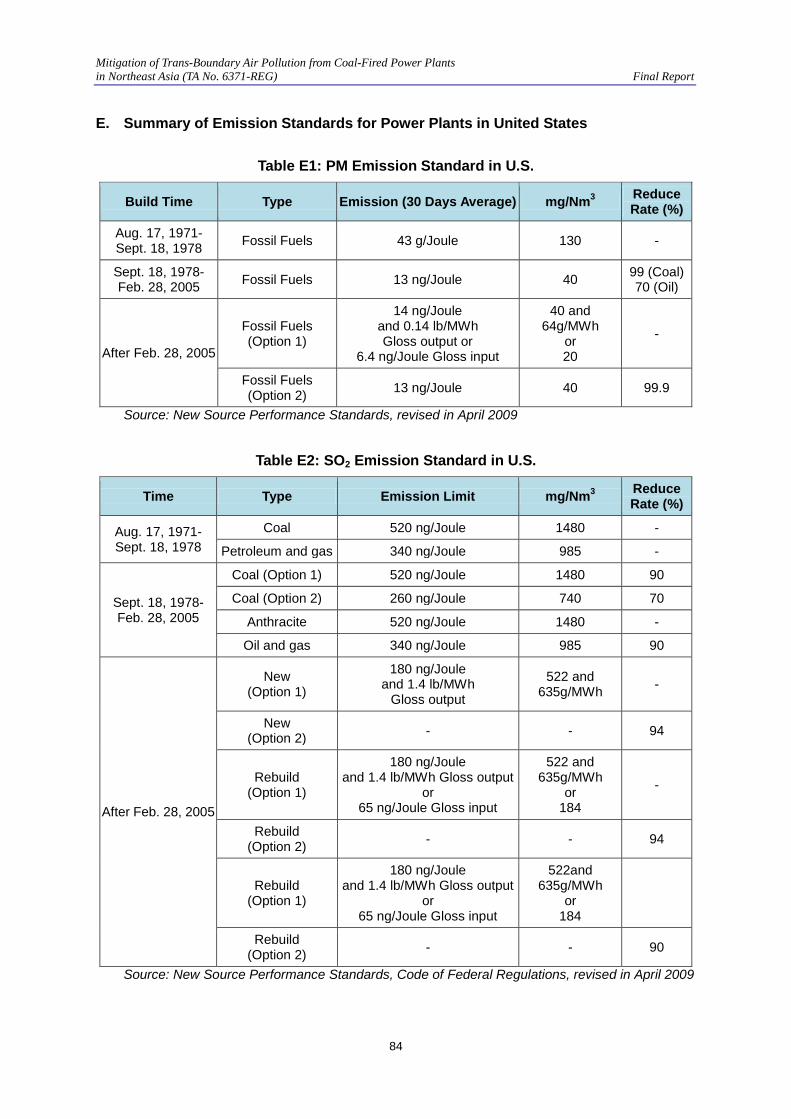
15. Some countries, such as the U.S., have a very complicated schedule for emissions standardswhile others like the ROK take a simpler approach. A comparison of current emission limitations from various developed countries shows that Japan has the lowest SO2 emission limit at 170 mg/m3, while Mongolia has the highest SO2 emission limit at over 1,200 mg/m3 before the new standards were adopted in December 2011 However, the U.S. has taken the case-specific approach of setting emission limits for each proposed new power plant using the best available control technology, and the actual SO2 emission limits are much lower than the standard of 184 mg/m3. Similarly SO2 emissions from power plants in Japan are also much lower than the standard of 170 mg/m3.
16. For particulate matter (PM) emission standards, the ROK has the lowest emission limits among the five countries studied. The U.S. also has very stringent PM standards. The Japanese PM standard was established a long time ago and have not been revised in recent years. Most power plant emissions in Japan are far below the limit of 100 mg/m3. Again, Mongolia has the highest emission limits for PM. For NOx emission standards, Mongolia also had the highest limits at 715-1,100 mg/m3 before the new standards were adopted.
D. Proposed Emission Standards for Mongolian Power Plants
17. Through review, comparison, and analysis of current Mongolian emission standards for coal-fired power plants and emission standards of other developing countries (China) and developed countries (U.S., UK, Japan, and the ROK) on the experience and lessons learned from others, and Mongolia’s current status regarding availability of coal, financial, environmental, and technology resources, as well as people’s understanding and
Mitigation of Trans-Boundary Air Pollution from Coal-Fired Power Plants in Northeast Asia (TA No. 6371-REG) Final Report
4
acceptability, the following new air emission standards for Mongolia’s coal-fired power plants are proposed:
Proposed PM and SO2 Emission Standards for Newly-Built Power Plants Region SO2 (mg/m3) PM (mg/m3)
Area I (urban areas where population density equals or is greater than 10 person per square kilometer, or the population is 1,000 or less)
400 50
Area II (remote areas that have a population density less than 10 people per square kilometer) 600 200
Proposed NOX Emission Standards for Newly-Built Power Plants
Volatile Content in Coal NOx (mg/m3)
Vdaf < 10% 1,100
10%≤ Vdaf ≤20% 650
Vdaf > 20% 450
18. The proposed new emission standards are consistent with the Mongolian National Strategy and will greatly reduce emissions from power plants and bring most noticed pollutant emissions in line with other countries’ emission standards and closer to international air emission standards. The new standards were approved by the National Council of Standardization and Measuring of Mongolia on 16th December 2011 and Mongolian Agency for Standardization and Metrology has formally published the new standards in December 2011.
E. Mitigation Plans and Co-Benefits Approach
19. Many countries have developed and implemented mitigation plans and taken effective measures to reduce the pollutant emissions as well as improve energy efficiency in coal-fired power plants.
1. Mitigation Plans of the PRC
20. Emission Targets for Eleventh FYP Achieved. The average coal consumption for per kWh power generation in China has been reduced from 370 gram/kWh (g/kWh) in 2005 to 333 g/kWh in 2010, and electric power SO2 emissions were reduced from 13.5 million ton in 2005 to 9.26 million ton in 2010.
21. Decommission Small Thermal Power Plants. The PRC has adopted a series of incentives, including energy-efficiency funding and financial incentives, and has actively pursued industrial restructuring, technological upgrading, improved demand-side management, and decommission of inefficient facilities. More importantly, beginning in early 2007, the Government of the PRC adopted unprecedented actions to phase out inefficient power generating units, and set a target to phase out 50 GW of power generation capacity in small coal-fired power plants before 2010. By the end of 2010, the total capacity of decommissioned plants reached 77 GW, or 54% over the target. This has resulted in
Mitigation of Trans-Boundary Air Pollution from Coal-Fired Power Plants in Northeast Asia (TA No. 6371-REG) Final Report
5
significant reduction in coal consumption and GHGs and SO2 emissions, as well as a significant improvement in energy efficiency.
22. During the Twelfth FYP (2011-2015), the electric power industry will strictly follow national energy policies, shut down more small thermal power units with high energy-consumption, further strengthen the operation management, and optimize control of thermal power units. Integrated gasification combined cycle is an important foundation for realizing near-zero emissions of pollutants and CO2 during the coal-fired power generation process.
23. Ambitious Energy Efficiency and Emission Reduction Targets. In November 2009, the PRC announced it would reduce the carbon intensity by 40%-45% in 2020 from the 2005 level by i) developing renewable energy; ii) promoting nuclear power plants; iii) increasing the proportion of non-fossil fuel in the primary energy to 15% by 2020; and iv) expanding 40 million ha of forest coverage and 1.3 billion m3 of forest growing volume by 2020. New energy efficiency improvement and emission reduction targets have been included in the Twelfth FYP. According to the Twelfth FYP development program for electric power industry, all coal-fired power plants must install FGD to meet the new SO2 emission limits. It is estimated that approximately CNY65 billion will be invested to comply with the SO2 standards. Annual SO2 emission in the power sector will be decreased from 9.26 million tons in 2010 to 8 million tons in 2015 (13% decrease).
24. The average coal consumption for thermal power plants will be down to 325 g/kWh by 2015 from 333 g/kWh in 2010 (declining by 8 g/kWh). This efficiency improvement will save 35.23 million tons of standard coal, reduce approximately 9.5 million tons of CO2 emissions, and reduce about 0.6 million tons of SO2 emission.
25. Environmental Policies on the Power Sector. The Environmental Protection Ministry and other ministries of the PRC issued the Guiding Opinions on Promoting the Work of Joint Prevention and Control of Atmospheric Pollution and Improving Regional Air Quality in May 2010. The document required that emissions from coal-fired power plants should be strictly controlled, the construction of coal-fired projects should be stringently limited in the important regions, and the total quantity control of regional coal consumption should be enforced. In addition, it proposed construction of low sulfur and low ash coal blending projects, and raised the proportion of coal washing and process. Enterprises not equipped with desulphurization facilities in the focus areas are prohibited to directly use the coal containing more than 0.5% of sulfur. The zones where combustion of high-polluting fuel is prohibited must be stringently monitored and managed, and the scope of prohibited zone will be gradually expanded to limit inefficient and polluted combustion of coal.
26. Set New Target on Non-fossil Fuel. China has taken significant efforts in improving the mix of primary energy supply, and actively promoted non-fossil fuel share. In 2009, the Energy Bureau of the National Development and Reform Commission announced the new target of the share of non-fossil fuel in the total primary energy at 15% by 2020. Hydro-energy will play a vital role in reducing GHGs and other pollutants emissions. Energy-efficient power generating units with a high capacity represented by 600-1,000 MW supercritical (SC) power generation units will be the main focus for development and installation in future.
Mitigation of Trans-Boundary Air Pollution from Coal-Fired Power Plants in Northeast Asia (TA No. 6371-REG) Final Report
6
27. Promote CHP Technology. The potential for use of CHP as a measure to save energy has been widely accepted. CHP offers improved environmental quality, reduced energy consumption, and improved grid reliability. Many countries have issued special incentive policies to promote the use of high-efficiency CHPs due to the potential benefits, including saving primary energy and reducing emissions, particularly GHGs. In addition, efficient use of energy by CHP can also contribute positively to the security of energy supply. Therefore, China actively takes measures to ensure that the potential is better exploited within the framework of its domestic energy market. With strengthened environmental protection, many small-sized, inefficient, and polluted heating boilers used in provinces in northern China will be decommissioned. Meanwhile, CHP is encouraged to be the major heat source for spacing heating.
28. Mitigate GHG Emissions. The National Mid- and Long-term Scientific and Technological Development Plan (2006-2020) listed carbon capture and storage (CCS) technology as a cutting-edge technology for mitigating GHG emissions. In order to realize efficient, clean, and near-zero emissions of carbon dioxide, fossil energy development and utilization technology has been incorporated into the key research areas for advanced energy technologies. In addition, the China National Climate Change Program has identified China's specific objectives, basic principles, key areas of polices and measures against climate change, and included developing CCS as an important area to reduce GHG emissions.
2. Mitigation Plans of Mongolia
29. The primary mitigation potential for Mongolia is to more efficiently use the existing traditional energy sources such as coal. Coal is the most important primary energy source because Mongolia has large coal reserves, lacks natural gas and insufficient oil reserves. There is a huge potential to reduce the GHG emissions in the way of improving efficient use of solid fuels in coal-fired power plants or HOBs, and wiser consumption of electricity by end users. The findings and recommendations of this TA are summarized below.
30. Passing the Energy Conservation Law. Passing the energy conservation laws and implementing energy efficiency measures are actions now on the agenda of the Ministry of Mineral Resources and Energy (MMRE). The Government of Mongolia developed a draft energy conservation law in 2011 under the assistance of ADB.
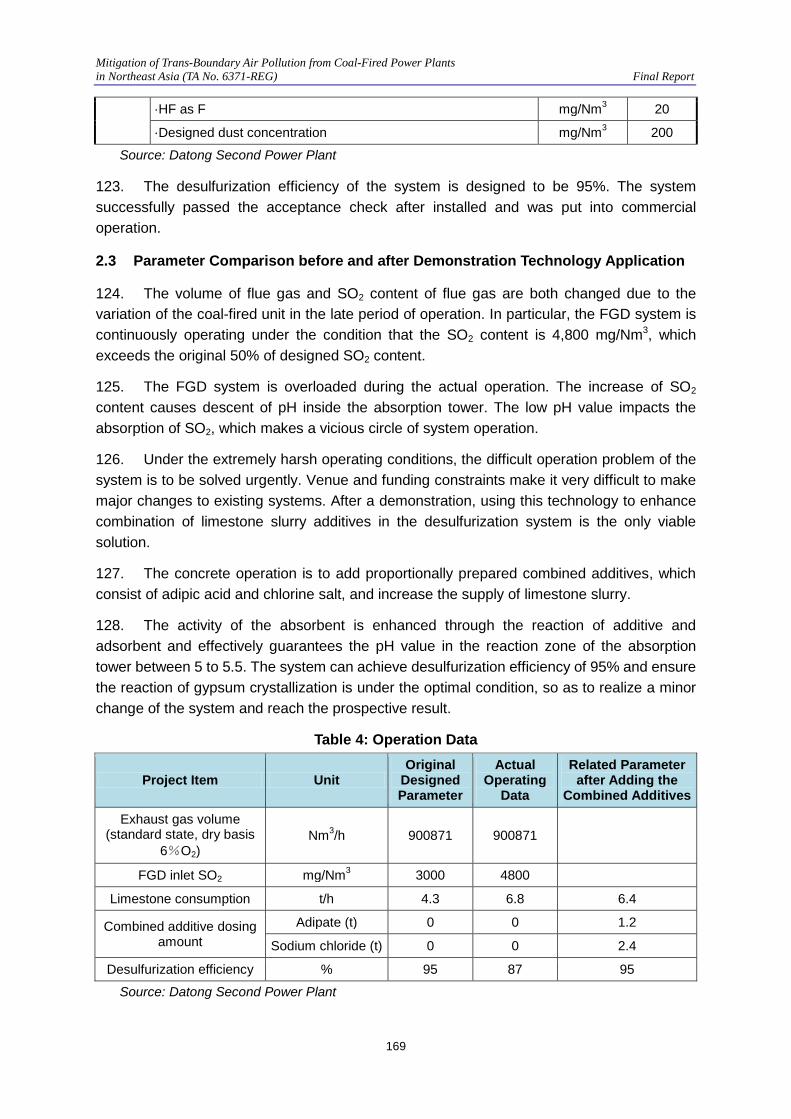
31. Establish Institutional Framework and Structure. Publishing the energy conservation law is the first step to improve energy efficiency and implement energy efficiency measures. There is still no agency in the country formally mandated to develop and implement the national and energy efficiency policies and programs for key sectors. It is very important to institutionalize the energy efficiency and emission reduction policies. It is important to clearly coordinate the ministries and responsible organizations to formulate the GHG mitigation policies and implement the GHG mitigation projects.
32. Enforce New Air Emission Standards for Power Plants. New air emission standards for coal-fired power plants have been adopted based on the recommendations of this TA. Relevant government agencies should prepare and implement plans to enforce the new standards to ensure compliance.
Mitigation of Trans-Boundary Air Pollution from Coal-Fired Power Plants in Northeast Asia (TA No. 6371-REG) Final Report
7
33. Enhance Environmental Permitting System. Emission limitations and pollution control requirements can be specified in the permit for each major stationary source. The permit should also specify emission monitoring and reporting requirements. Governmental agencies should inspect these facilities to make sure emission standards and permit conditions are complied with. Enforcement actions should be enhanced.
34. Strengthen Environmental Compliance. It is not enough to just pass environmental laws, regulations, and emission standards. What is more important is to make a real progress on compliance with these requirements. Coal-fired power plants should be required to install continuous emission monitoring system to monitor main pollutants on a real-time basis. Inspection and enforcement must be enhanced.
35. Develop an Energy Efficiency and Conservation Action Plan. An action plan to improve energy efficiency and develop an energy conservation law is being drafted. Such action plan can help guide and encourage development and implementation of energy efficiency policies by: i) placing energy conservation and efficiency policies within a broader policy context; ii) assigning responsibilities for implementation, monitoring, and evaluation; iii) prioritizing resource allocation across the energy efficiency portfolio; and iv) capturing synergies between policies and avoiding duplication. The action plan aims at achieving increases in energy efficiency and reductions in energy intensity by 2020.
36. Financial support. Incentive programs should be established to promote energy efficiency. These incentive programs could include subsidies for research and development of new technologies; cost-recovery energy pricing and tariff;2 custom subsidies, tax credits and low interest loans for energy efficiency improvement products and projects; high taxes for using inefficient technologies; energy conservation funds; and private investment involvement in energy efficiency projects.
37. Prioritize Funding. The implementation of mitigation measures will require significant investments. Since Mongolia is constrained by many economic development issues, it is essential that funds be more clearly prioritized at the national planning level for improving the environment protection, and those resources allocated according to economic and technical criteria.
38. Replace Old Power Plants. Coal-fired CHP plants are by far the most significant sources of GHGs and SO2 emissions in Mongolia, so replacing old power plants is a good first step. Building new CHP plants to replace old and inefficient CHP plants is a very important strategic action for Mongolia’s energy security and its environmental protection. The Government of Mongolia is proposing to construct CHP Plant #5 (CHP5) to replace the existing CHP2 and CHP3 plants. The proposed capacity of CHP5 is 820 MW for power generation and 1,101 Gcal/hr (1,280 MW thermal equvalent) for heat generation to meet the forecasted demands in 2020. CHP5 will have an overall thermal efficiency of close to 69%, which contrasts with 40%, 38.6%, and 21% in the current CHP4, CHP3, and CHP2 facilities, respectively.
2 Currently energy tariffs are not structured to fully recover cost. All main electricity and heat producers are losing money every year.
Mitigation of Trans-Boundary Air Pollution from Coal-Fired Power Plants in Northeast Asia (TA No. 6371-REG) Final Report
8
39. Upgrade UB District Heating System. The UB district heating network is very complex and inefficient, due to aging networks and rapid expansion of the branch heating networks in recent years to meet the heating and hot water needs from new development areas in UB. Losses in the heat distribution systems are high, and measures such as minimizing leakage, replacing valves, and reducing radiation losses, are urgently required. The district heating system should be optimized in conjunction with the construction of the CHP5 plant in UB.
40. Increase Utilization of Renewable Energy Resources. Mongolia has a significant amount of renewable energy resources, including solar, wind, and hydropower resources. Currently, however, the development and utilization of renewable resources are rather limited. The renewable power generation only accounts for 0.5% of Mongolia’s total power generation. Renewable energy development has been included in the Government Action Program as an important way to provide electricity in remote areas and for nomadic families.
41. Encourage Energy Efficiency Improvement Projects. It is estimated that the CHP plants in Mongolia consume approximately 16% of the total electricity generated by these CHP plants, while the international best practices standard is about 10%. This 6% difference is very significant and more effort should be directed to make equipment in the plants more efficient or shutdown old inefficient units.
42. Reduce Energy Intensity in Key Sectors. The Mongolian economy is among the most energy-intensive, which means it is also very carbon-intensive. Industry is one of the largest consumers of electricity in Mongolia. There is a huge potential for this sector to reduce carbon intensity through modernizing energy-intensive processes and implementing energy efficiency improvement projects. Power generation and heating, construction, and transportation sectors are the largest contributors to the Mongolia’s energy consumption, and therefore its GHG emissions. Therefore, the efforts must be of significant priority and placed on energy efficiency improvement in these sectors in Mongolia.
43. Contract Energy Management and Energy Service Companies (ESCOs). The concept of ESCO service should be promoted to implement energy efficiency projects. The development of energy conservation service, design evaluation, and inspection and auditing activities on energy efficiency and energy conservation should be encouraged.
44. Public education. Public education and close cooperation and communication of suppliers with users are critical elements in the implementation of the GHG and SO2 mitigation measures in the residential and commercial building sector.
F. Assessment of FGD Technologies and Demonstration Project
45. The limestone gypsum wet scrubbing process is the state-of-the-art FGD technologies for SO2 emission control, in which flue gas is treated with limestone slurry in order to efficiently remove SO2 and neutralize it. The final product is calcium sulphate dihydrate (gypsum). This is the most common FGD process now installed worldwide, and has evolved over almost 30 years. Its efficiency of desulphurization can reach over 90%.
Mitigation of Trans-Boundary Air Pollution from Coal-Fired Power Plants in Northeast Asia (TA No. 6371-REG) Final Report
9
46. Under this TA, the FGD performance assessment at a pilot power plant, Changshu Power Plant, was performed from the technical, equipment, operation and adjustability aspects. The assessment findings are summarized as follows:
The desulfurization efficiency and SO2 emissions of the FGD devices of the CPP meet the requirements for environment impact assessment approval and of the relevant emission standard.
The FGD process design is reasonable, the system configuration is complete, and equipment selection complies with the requirement of the design specifications.
Comprehensive utilization of all desulphurization gypsum is achieved, which makes the technology selected not only comply with the national principles but also be suitable for the actual situation of the power plant.
The annual availability of the FGD device is over 95%, indicating that the operation of the FGD system is stable and reliable. The design is flexible and adapted to the variation of sulfur content in coal for the time being.
Since the FGD device was put into operation, major equipment is in a stable and normal operation. The FGD device is seldom out of operation due to equipment failure.
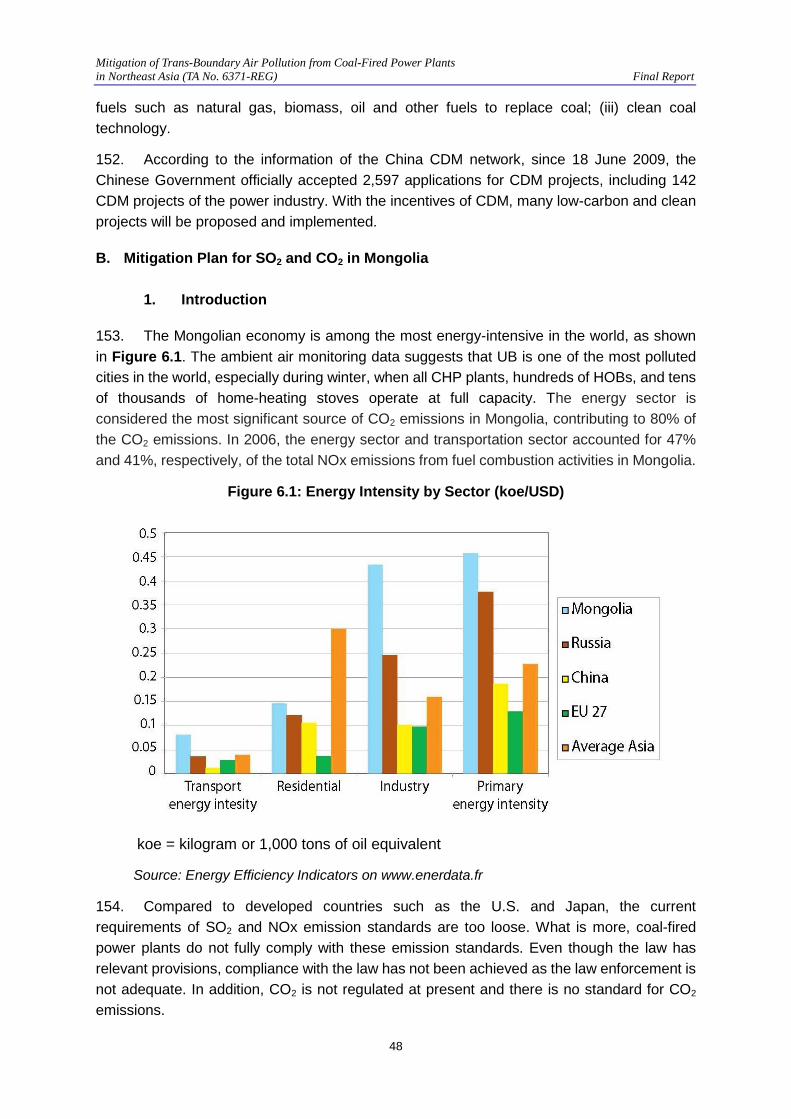
It is recommended to identify the adaptability and limitation of each piece of equipment of the FGD device against the variation of the sulfur content of coal. Effective measures should be taken when necessary so as to ensure or improve the safe operation of the FGD device. It is suggested to actively optimize the operation of FGD device and conduct economic analysis to enhance the operational economy.
G. Demonstration Projects
47. Two demonstration projects have been implemented under the TA: i) evaluation of the method of complex additive to enhance activity of limestone slurry in the limestone gypsum wet scrubbing process of FGD, and ii) new method of measuring pH value of solution in the absorbing tower of the limestone gypsum wet scrubbing process of the FGD. These are two of the most important methods to improve the desulphurization efficiency and reduce operation costs of the FGD systems. The demonstration projects will help reduce SO2 emissions, and replication and transfer of technology will be encouraged through training and information dissemination.
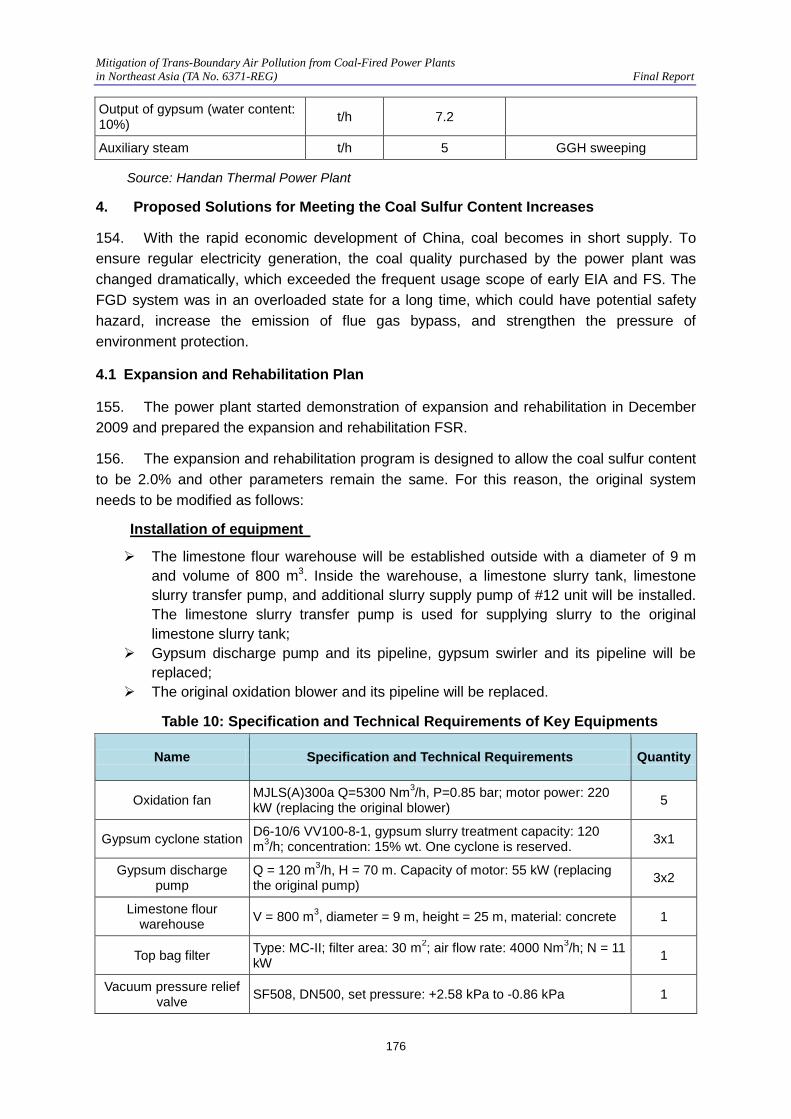
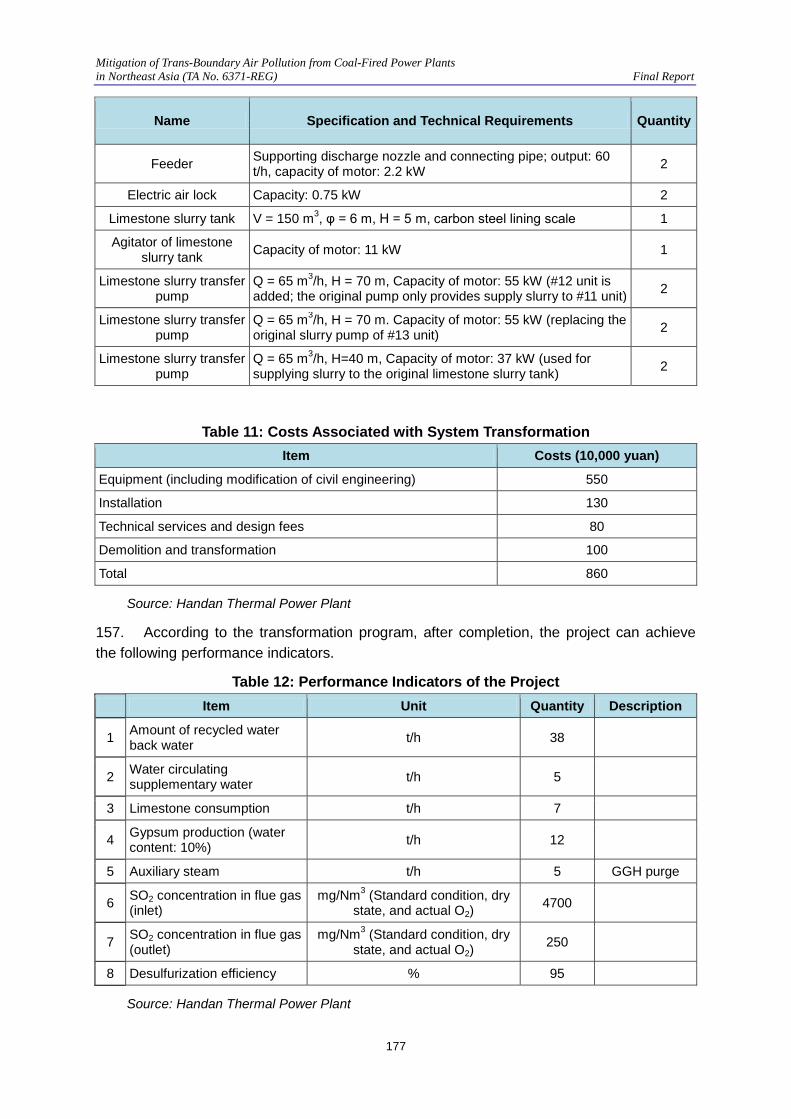
48. In the limestone gypsum wet scrubbing process, additives used for enhancing mass transfer and activity of limestone slurry can improve desulphurization efficiency, prevent scaling, increase operation reliability of the FGD system, and decrease operation costs to some extent. The method of enhancing activity of limestone slurry under the demonstration project is to optimize the mixture and ratios of complex additive comprising of adipic acid and chloride into limestone slurry. During the limestone gypsum wet scrubbing process, with the additives added into the absorbent, the limestone slurry reacts with gas under more favorable conditions, catalyze the reaction, and increase reaction by more than 50%. This method
Mitigation of Trans-Boundary Air Pollution from Coal-Fired Power Plants in Northeast Asia (TA No. 6371-REG) Final Report
10
increases desulphurization efficiency and reduces consumption of limestone and operation costs, and it also makes system operations more flexible.
49. The method for measuring pH value of solution in the absorbing tower of the limestone gypsum wet scrubbing process is essential for reliable, stable, and accurate automatic control system of the FGD process. Currently, pH value of the slurry is measured by pH sensor installed in the slurry pipe connecting absorbing tower of FGD or circulating pool on condition that gypsum slurry is circulated by a slurry pump. Due to existence of lots of gypsum crystals in slurry pipe and slurry pool, pH sensor is exposed to wearing and polluting of the gypsum crystals, and the accuracy of pH sensorare affected. In order to address this issue and enhance the reliability of pH sensor, more than one sensor and transformer can be installed, which increases capital cost and make system configuration more complicated.
50. In order to ensure accurate measurement of pH value of the slurry, many methods and sampling means have been developed and used in some FDG systems. The demonstration project was intended to introduce and demonstrate a new and reliable method and sampling means for measuring pH value of solution in the absorbing tower of the limestone gypsum wet scrubbing process. In this method and sampling approach, one upper sampling port at the top of the absorbing tower and one lower sampling port sampling port at the bottom of the absorbing tower were designed. These two ports are connected to each other by a connecting pipe, in which natural circulation of slurry will occur. Compared to the existing measurement methods, this method does not need motor-driven pump to drive slurry circulation, and thus saves electricity. In addition, the pH sensor is located at the upper part of the pipe, which protects sensor from wearing by gypsum crystals. It provides more accurate measurement of pH value.
H. Conclusions
51. Both China and Mongolia have made significant efforts in applying co-benefit approach to improve energy intensity and reduce SO2 and GHG emissions from their coal-fired power plants. China has reached an overall energy intensity reduction of 20% from 2005 to 2010 and has also set a new target of 40-45% energy intensity reduction by 2020 from the 2005 level.
52. China has set ambitious targets to reduce SO2 emission during the Twelfth FYP period (2010-2015). New standards will lower SO2 emission limit from current 400 mg/m3 to 100 mg/m3 for new plants. All coal-fired power plants must install FGD to meet the new SO2 emission limits. It is estimated that approximately CNY65 billion will be invested to comply with the SO2 standards. Annual SO2 emission in the power sector will be decreased from 9.26 million tons in 2010 to 8 million tons in 2015 (13% decrease).
53. The average coal consumption per unit electricity produced from thermal power plants in China will be reduced by 2.4% by 2015. This efficiency improvement will save 35.23 million tons of standard coal and reduce approximately 9.5 million tons of CO2 emissions and 0.6 million tons of SO2 emission.
Mitigation of Trans-Boundary Air Pollution from Coal-Fired Power Plants in Northeast Asia (TA No. 6371-REG) Final Report
11
54. Over 90% of the electricity in Mongolia is generated by coal-fired power plants, which are inefficient due to old age and lack of adequate maintenance. The Government of Mongolia is proposing to build a state-of-the-art CHP plant in UB. Once this new plant is operational, air pollutants emissions including SO2 will be significantly lower than those of existing CHP plants.
55. The new emission standards for coal-fired power plants in Mongolia were adopted in December 2011 based on the recommendations of this report. The Government of Mongolia drafted a new energy conservation law in 2011. In the meantime, an energy efficiency and conservation action plan is being prepared. Once implemented, the energy consumption per unit gross domestic product is expected to be much lower than the current level.
56. New air emission standards were proposed under this TA for Mongolia’s coal-fired power plants. They were formally adopted and published in December 2011 entitled “Maximum Acceptable Level and Measuring Method of Air Pollutants in the Exhaust Gases from Steam and Hot Water Boilers of Thermal Power Plants and Thermal Stations” (MNS6298:2011).
Mitigation of Trans-Boundary Air Pollution from Coal-Fired Power Plants in Northeast Asia (TA No. 6371-REG) Final Report
12
I. INTRODUCTION
1. The trans-boundary air pollution in Northeast Asia has been recognized as an important issue by the related governments and agencies in Northeast Asian countries. More attention has been paid to this issue in recent years, especially to acid rain related environmental impacts. It has been found that coal-fired power plants are the major pollutant sources of trans-boundary air pollution in many parts of the world including Northeast Asian countries. All countries in the Northeast Asia sub-region, including Japan, the Republic of Korea (ROK), the People’s Republic of China (PRC) and Mongolia, have coal-fired power plants that provide electric power. Pollution from one country in the sub-region could impact the other countries under certain climate conditions.
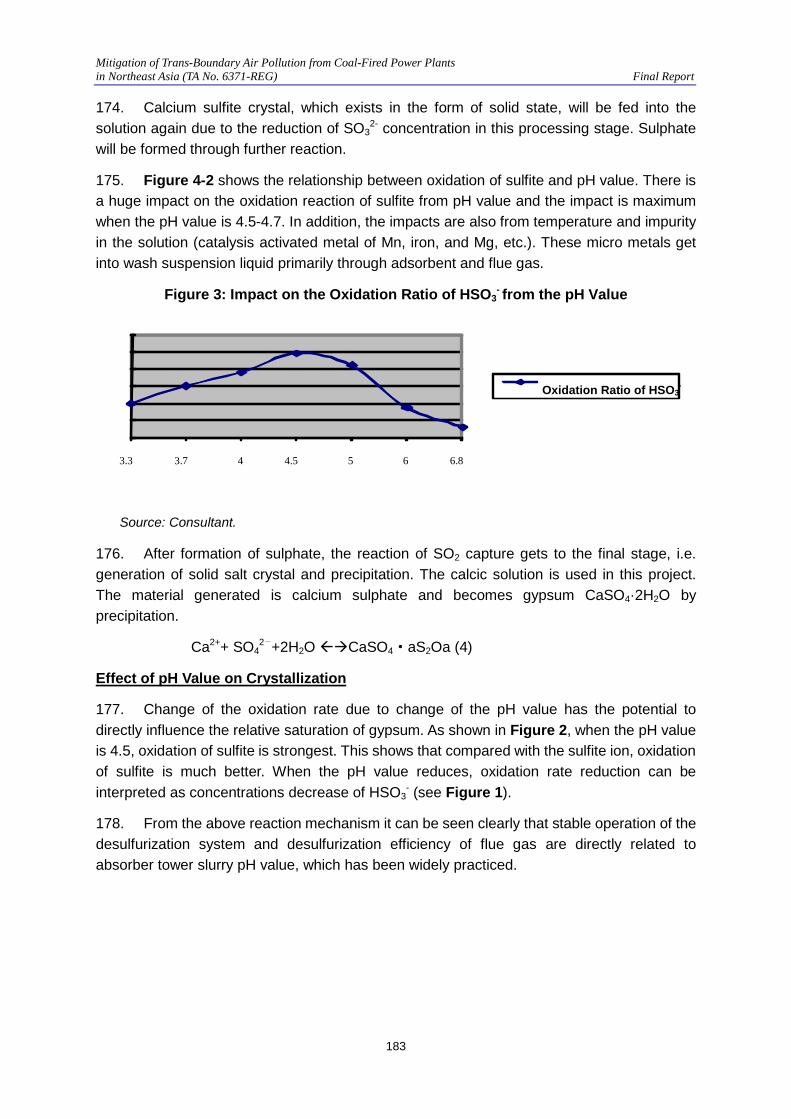
2. The PRC, with the most energy consumption in Asia, has the biggest power generation capacity of coal-fired power plants. The total power generation capacity reached 962 GW in 2010, while the capacity of coal-fired power plants (650 GW) account for approximately 67.6% of the total. The sulfur dioxide (SO2) emission from coal-fired power plants has 42.4% share in total SO2 emission in the PRC in 2010. Due to the robust increase of electric power demand resulting from the rapid economic development in the PRC, it is expected that the power generation capacity installed in the PRC will continue to increase at the rate of 50 GW per year in the next 10 years to meet the growing demand, and that coal-fired power plants will still have about 70% share of the total power generation capacity in 2020.
3. The PRC realized that further measures must be taken to mitigate air pollution and reduce pollutant emissions and greenhouse gases (GHGs) in order to keep sustainable development. Much effort has been taken to control pollutant emissions in the PRC in recent years. For example, it is estimated that approximately 74% of coal-fired power plants have been equipped with desulphurization devices. The PRC has successfully listed energy/carbon intensity as one of the pollution control targets for the National Eleventh Five-year Plan (FYP) (2006-2010), in which energy and carbon intensity will be reduced by 20% and SO2 emissions reduced by 10%. The PRC will play a highly important role in mitigating trans-boundary air pollution and GHGs in Northeast Asia.
4. Coal-fired power plants in Mongolia are an important pollutant source to local air and trans-boundary air due to the absence of necessary desulphurization devices and other adequate emission control measures. The total installed power generation capacity in Mongolia is 913 MW but the available capacity is only 667 MW or 73%.3 The electricity generation from coal-fired power plants in 2009 represents 94.5% of the total generation.4 It is planned that at least 500 MW of electricity capacity will be needed in the next 10 years, and an additional 1,100 MW of heat demand needs to be met in the next 10 years through a combination of: (i) installation of combined heat and power (CHP) plants, (ii) introduction of energy efficiency investments, and (iii) installation of heat only boilers (HOBs). Coal-fired power plants and HOBs will contribute more to local and trans-boundary air pollution if strict 3 T. Enkhbaivan (2010), Current Situation, Problematic Issues and Further Implementation Objectives of Energy Sector. 4 Energy Statistics 2009, Energy Regulatory Authority, Ulaanbaatar, Mongolia, 2010.
Mitigation of Trans-Boundary Air Pollution from Coal-Fired Power Plants in Northeast Asia (TA No. 6371-REG) Final Report
13
pollution control measures are not taken. Emission standards for coal-fired power plants have been developed and issued in Mongolia. However, compared with developed countries such as Japan, the current requirements on SO2 and NOx emission standards of Mongolia are very weak.
5. It is urgent to develop proper and practical national emission standards for Mongolia to mitigate air pollution from coal-fired power plants. More importantly, Mongolia’s heat and electricity supply systems are in poor condition and with high losses. The state-owned and controlled management models of the electricity and heat systems with lower efficiencies result in higher operation costs and a higher burden on government and users. The application of co-benefits approach in Mongolia will be very valuable for both mitigating air pollution and GHGs, and improving the living quality of local people through increasing the energy utility efficiency and improving management capacity. Based on work experience in Ulaanbaatar (UB) which is the biggest city in Mongolia, we assume that UB will be a good demonstration project city to deal with pollutant emissions from the power plants in the city.
6. The power generation capacities in the ROK and Japan are less than that of the PRC. The share of coal-fired power generation in their total power generation capacity is less than 30%. In Japan, desulphurization devices and low nitrogen oxide (NOx) burners or other NOx control technologies have been used in most of the coal-fired power plants. The proven technologies for air pollutant emission control in Japan may be a valuable reference and example for other countries in Northeast Asia. The Government of the ROK is actively taking measures to control SO2 emissions.
Mitigation of Trans-Boundary Air Pollution from Coal-Fired Power Plants in Northeast Asia (TA No. 6371-REG) Final Report
14
II. COAL-FIRED POWER GENERATION TECHNOLOGY
A. Summary of Coal-Fired Power Generation Technology
7. Coal is the major power source in the world. For example, about half of electricity in the United States (U.S.) is generated by coal-fired power plants; China, India, Germany, Poland, South Africa and Australia have abundant coal reserves, where coal-fired power generation has a share of more than half of total electricity production. Especially in China, the proportion of coal-fired power generation reaches 74.5% in the national power generation.
8. Currently, the international coal-fired power generation technologies are developed toward clean coal power generation, which improves the energy efficiency and reduces emissions. The promising clean coal power generation technologies include supercritical (SC) and ultra-supercritical (USC), circulating fluidized bed combustion (CFBC), integrated gasification combined cycle (IGCC), pressurized CFBC combined cycle, etc. The current status and development trends of the coal-fired power industry are summarized in Appendix 1.
1. The United States
9. In 1984, the first set of IGCC industrial test equipment was put into operation in the Cool Water Power Plant in the U.S., with 100 MW of power generation capacity. The power plant demonstrated the feasibility of IGCC power generation technology, and it was known as “the world's cleanest coal-fired power station.” The U.S. firstly proposed a national clean coal program in 1986, with a total investment of more than $6 billion, and it has made significant progress. In addition, four IGCC projects have been proposed under the Climate Change Technology Program (CCTP) directed by the U.S. Department of Energy (DOE). Two of the four IGCC projects have been put into operation. The third IGCC power plant funded by the Clean Coal Project of the U.S. DOE is expected to be put into commercial operation in 2010.
10. The U.S. was the first country to develop and use USC thermal power units in the world. It began the research and development of SC power generation technology in the early 1950s, and the quantity of SC units used in the U.S. ranks the second in the world, with nine sets of the world's largest SC units, each with a capacity of 1,300 MW. Currently, the U.S. is continuing the study on new materials for USC boilers working at a 760°C condition to develop higher temperature and pressure power generation units.
2. Japan
11. Japan established a Clean Coal Technology Center in the New Energy Industry Technology Development Organization (NEDO) in 1993, and formulated the “Sunshine Plan.” Japan's clean coal technology development is divided into two areas in terms of technical route map. One is to increase thermal efficiency and reduce emissions through technologies such as fluidized bed combustion, IGCC power generation and coal gasification fuel cell combined circle power generation technology. The other is to conduct purification before and
Mitigation of Trans-Boundary Air Pollution from Coal-Fired Power Plants in Northeast Asia (TA No. 6371-REG) Final Report
15
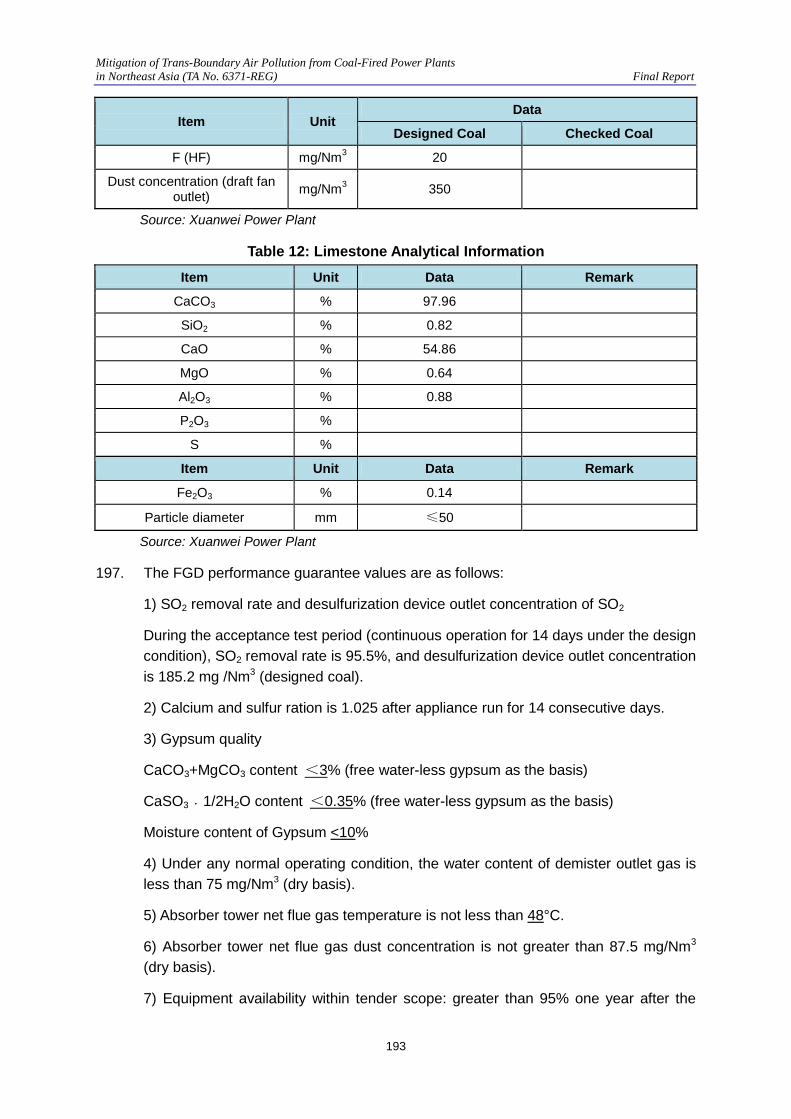
after coal combustion, including fuel pretreatment, combustion process and combustion flue gas desulphurization (FGD) and DeNOx, and effective utilization of coal.
12. Japan began to develop SC pressure units from the mid 1960s, which have developed rapidly. Currently, more than 60 SC thermal power units are working in the country. Japan has also successfully developed USC units, and its first USC power generation unit with 700 MW of capacity was put into operation in June 1989.
13. The NEDO proposed the IGCC power generation development program. Nine power companies led by Tokyo Electric Power Company, a power developing company, and the Central Research Institute, and altogether eleven legal entities were funded by the Japan Government to develop IGCC technology.
3. European Union
14. The main objective of European Union (EU) clean coal technology development is to reduce a variety of pollutants from coal burning, including carbon dioxide (CO2) and other GHGs, make coal-fired electricity generation cleaner, and reduce coal consumption by increasing efficiency. Currently, a priority is given to the reduction of pollution emissions and improvement of energy conversion and utilization efficiency. It is expected that, by 2020, the EU coal-fired power generation efficiency will be higher than 50%. The EU is focusing on researching and developing IGCC technology, coal and biomass, and industrial, urban or agricultural waste co-gasification (or burning); solid fuel gasification fuel cell combined cycle; and CFBC technology, and etc.
15. Two IGCC demonstration projects have been implemented in the EU and 60 USC units were used. Of special note, in 1998 and in 2001, Denmark put into operation two 400 MW USC units with a thermal efficiency of about 47%, which in turn makes them thermal power units with the highest thermal efficiency reported to date.
B. Energy Efficiency Performance Indicator of Power Plants
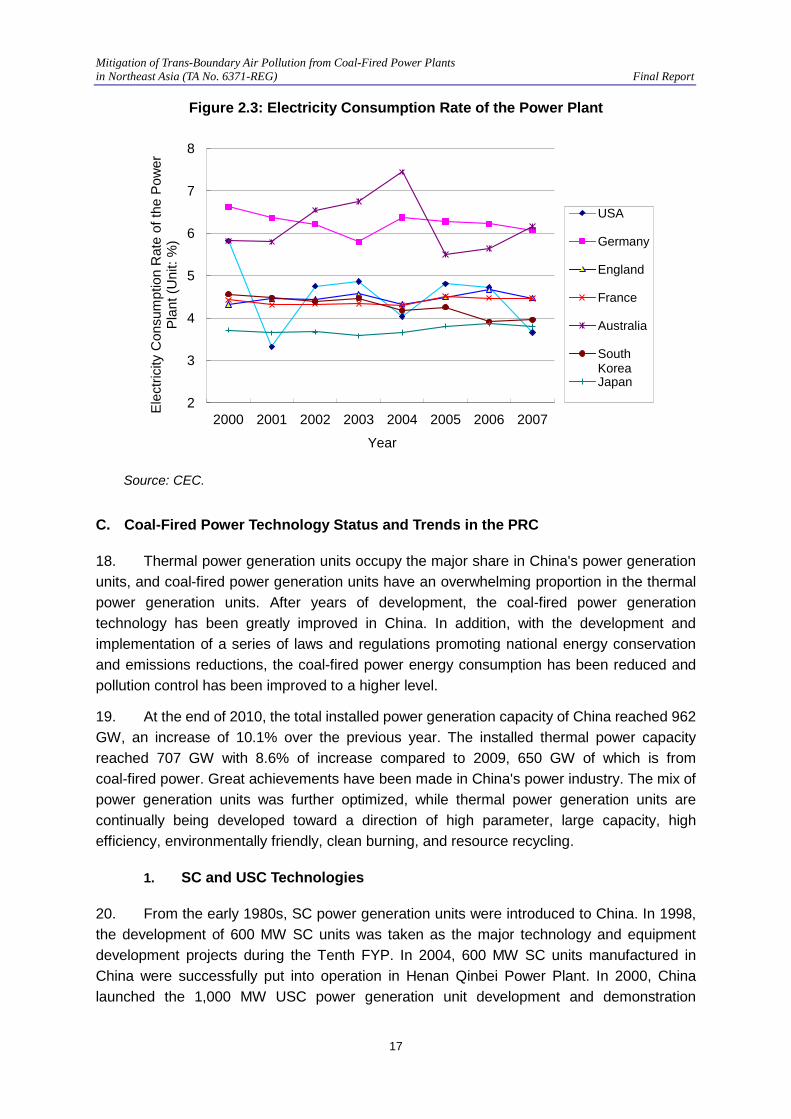
16. According to the yearly statistics of the Japanese Overseas Power Investigation Commission, statistics on the power industry of all countries, and the yearly statistics of the International Energy Agency, the thermal efficiencies, coal consumptions and internal electricity consumption rates of power plants of major developed countries, including the U.S., Germany, England, France, Australia, Japan, and the ROK, from 2000 to 2006 are shown in Figures 2.1, 2.2, and 2.3.
17. As shown in Figure 2.1, the seven developed countries have different thermal efficiencies for thermal power plants. The efficiencies in the U.S. and Australia were lower than those in the other five countries, which resulted in higher coal consumptions. The thermal efficiencies of thermal power plants in Germany, Japan, and the ROK were high at about 40%, which is at the international leading level. Due to the different thermal efficiency levels, the coal consumptions of power plants in Germany, Japan, and the ROK were low at about 300 grams of coal equivalent per kWh power generation, while in the U.S. and Australia it is high at 360 grams of coal equivalent per kWh, as shown in Figure 2.2. In
Mitigation of Trans-Boundary Air Pollution from Coal-Fired Power Plants in Northeast Asia (TA No. 6371-REG) Final Report
16
addition, in terms of the internal electricity consumption rate, Germany and Australia had higher figures, while Japan has extremely low internal consumption.
Figure 2.1: Thermal Efficiencies of Thermal Power Plants in Developed Countries
Source: China Electricity Council (CEC).
Figure 2.2: Coal Consumption in Thermal Power Plant (Unit: gram of coal equivalent/kWh)
Source: CEC.
30
32
34
36
38
40
42
44
2000 2001 2002 2003 2004 2005 2006
Ther
mal
Effi
cien
cy o
f Pow
er P
lant
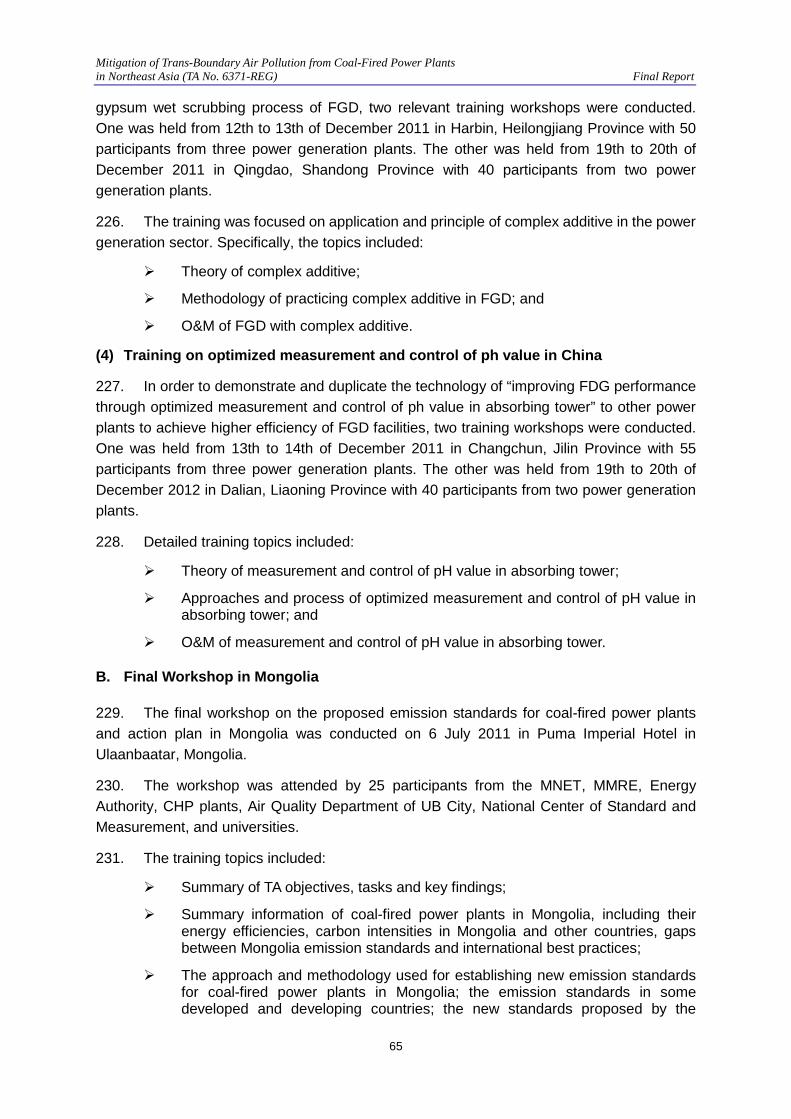
(%)
Year
USA
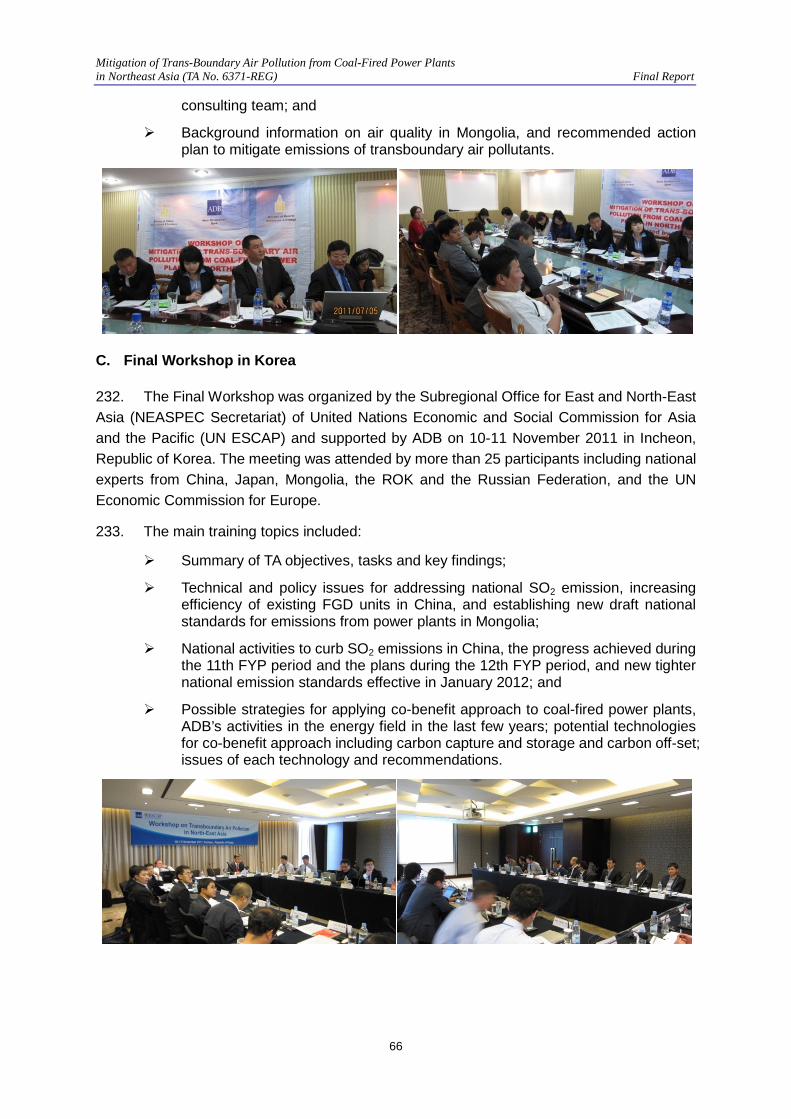
Germany
England
France
Australia
South Korea Japan
280
300
320
340
360
380
400
2000 2001 2002 2003 2004 2005 2006
Coa
l Con
sum
ptio
n in
The
rmal
Pow
er P
lant
(U
nit:
g / k
Wh)
Year
USA
Germany
England
France
Australia
South Korea Japan
Mitigation of Trans-Boundary Air Pollution from Coal-Fired Power Plants in Northeast Asia (TA No. 6371-REG) Final Report
17
Figure 2.3: Electricity Consumption Rate of the Power Plant
Source: CEC.
C. Coal-Fired Power Technology Status and Trends in the PRC
18. Thermal power generation units occupy the major share in China's power generation units, and coal-fired power generation units have an overwhelming proportion in the thermal power generation units. After years of development, the coal-fired power generation technology has been greatly improved in China. In addition, with the development and implementation of a series of laws and regulations promoting national energy conservation and emissions reductions, the coal-fired power energy consumption has been reduced and pollution control has been improved to a higher level.
19. At the end of 2010, the total installed power generation capacity of China reached 962 GW, an increase of 10.1% over the previous year. The installed thermal power capacity reached 707 GW with 8.6% of increase compared to 2009, 650 GW of which is from coal-fired power. Great achievements have been made in China's power industry. The mix of power generation units was further optimized, while thermal power generation units are continually being developed toward a direction of high parameter, large capacity, high efficiency, environmentally friendly, clean burning, and resource recycling.
1. SC and USC Technologies
20. From the early 1980s, SC power generation units were introduced to China. In 1998, the development of 600 MW SC units was taken as the major technology and equipment development projects during the Tenth FYP. In 2004, 600 MW SC units manufactured in China were successfully put into operation in Henan Qinbei Power Plant. In 2000, China launched the 1,000 MW USC power generation unit development and demonstration
2
3
4
5
6
7
8
2000 2001 2002 2003 2004 2005 2006 2007
Elec
trici
ty C
onsu
mpt
ion
Rat
e of
the
Pow
er
Plan
t (U
nit:
%)
Year
USA
Germany
England
France
Australia
South Korea Japan
Mitigation of Trans-Boundary Air Pollution from Coal-Fired Power Plants in Northeast Asia (TA No. 6371-REG) Final Report
18
program. USC coal-fired power generation technologies and applications were covered as a special study on the clean coal technology, and listed in the National Tenth FYP and National 863 Program. The Yuhuan Power Plant was the first project using 1,000 MW USC power generation units. Three USC units, including #1 and #2 units of the Yuhuan Power Plant and #7 unit of Zou County Power Plant, were put into operation in the fourth quarter of 2006, marking the new era of the development and technology of the Chinese power industry.
2. Combined Heat and Power
21. In recent years, China has witnessed a rapid development in CHP. According to statistics, by the end of 2009, the total national installed capacity of CHP reached 144.6 GW, accounting for about 22% of the total installed thermal power capacity, or about 17% of the total installed power generation capacity. By the end of 2009, the annual heat supply from the heat and power cogeneration was 2.58 billion GJ in China, with a 3.4% increase rate over 2008. CHP provided about 30% of the heat energy for urban space heating, and about 80% of urban industrial steam. In particular, small-sized CHP units are the main central heating sources for medium and small cities, economic development zones and industrial parks.
3. IGCC Technology
22. Since the 1980s, China has taken IGCC technology as the national key scientific and technological development subject. In the past two decades, China has made great achievements in the system research, key component development, auxiliary technologies and equipment, and innovation exploration and research, and has established a number of experimental benchmarks to conduct component performance laboratory research and industrial preliminary research. Two IGCC power plants are under construction. One is the 250 MW coal-based IGCC power plant in Tianjin owned by China Huaneng Group and Tianjin City Government. The other is the 200 MW Banshan IGCC in Zhejiang Province.
Mitigation of Trans-Boundary Air Pollution from Coal-Fired Power Plants in Northeast Asia (TA No. 6371-REG) Final Report
19
III. POWER PLANTS IN NORTHEAST ASIA
A. Power Plants in Mongolia
1. Installed Capacity
23. Coal-fired power plants provide the majority of power generation for Mongolia. In 2010, the total power generation capacity of Mongolia reached 4312.7 million kWh, with 98.7% from coal-fired power plants.5 There are seven main coal-fired power plants in Mongolia with a total installed capacity of 836.3 MW, as shown in Table 3.1. The CES, with 95% of share in the total installed capacity, is the largest energy supply system in Mongolia. It includes five CHP plants, one transmission network, four distribution networks, and supplies power to the cities of UB, Darkhan and Erdenet and the centers of 13 provinces. The total installed capacity of the CES is 794 MW. Due to aged, deteriorated, and unreliable equipment, the actual available power capacity is 615 MW. The capacity of the three large sized power plants, including CHP2, CHP3 and CHP4 located in UB, accounts for 90% of the total installed capacity in the CES. Detailed information on coal-fired power plants in Mongolia is presented in Appendix 2.
Table 3.1: Coal-Fired Power Plants in Mongolia
No. Thermal Power
Plants Capacity
(MW)
Available Capacity
(MW)
Share in CES (%)
Location Installation
Year Efficiency (in 2009)
1 CHP2 21.5 18 2.7% UB 1961 21.0
2 CHP3 136 105 17.5% UB 1968 38.6
3 CHP4 560 452 70.2% UB 1983 40.1
4 Erdenet Plant 28.8 39 6% Erdenet City 1987 40.8
5 Darkhan Plant 48 21 3.6% Darkhan City 1965 28.5
CES Subtotal 794.3 615 100% --
6 Dornod Plant 36 -- -- Dornod Aimag 1969 19.4
7 Umnugobi Plant 6 -- -- Umnugobi Aimag 2001 --
Total 836.3 Source: Energy Statistics Yearbook, Energy Regulatory Authority (ERA), Mongolia, 2010.
2. Conditions of the Coal-Fired Power Plants
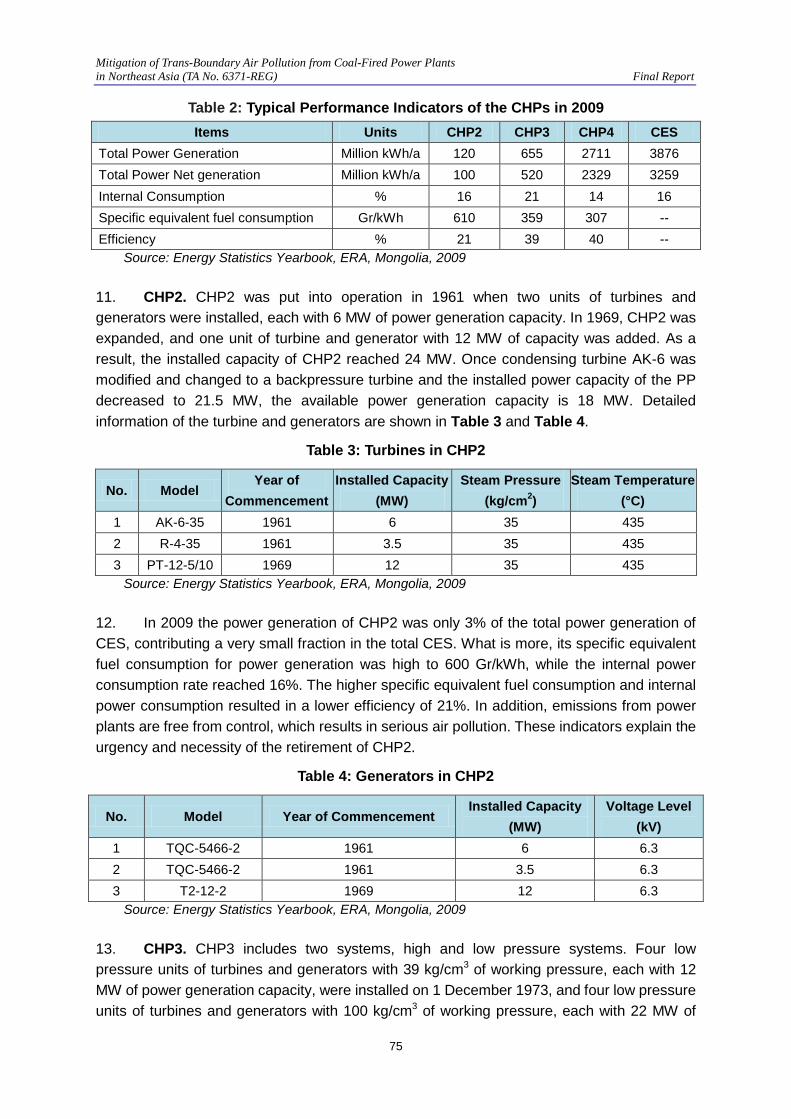
24. All of the coal-fired power plants have poor efficiencies, typically less than 40%. In particular, Power Plant #2, Darkham Power Plant and Dornod Power Plant were constructed before 1970 and have operated for a long period of time without proper maintenance, and they are currently operating at very low efficiencies (less than 30%). The typical performance indicators of the three CHPs in 2009 are shown in Table 3.2.Power Plant #2 is to be
5 Mongolian Energy Statistic Data 2010, Energy Regulatory Authority.
Mitigation of Trans-Boundary Air Pollution from Coal-Fired Power Plants in Northeast Asia (TA No. 6371-REG) Final Report
20
decommissioned soon and Power Plant #3 will also be decommissioned around 2015. The Government has proposed to construct a new and efficient CHP plant with 820 MW of power generation capacity to meet the electricity and heat demand.
Table 3.2 Typical Performance Indicators of Power Plants in Mongolia
Items Units CHP2 CHP3 CHP4 CES Total power generation million kWh/a 120 655 2711 3,876 Total power net generation million kWh/a 100 520 2329 3,259 Internal consumption % 16 21 14 16 Specific equivalent fuel consumption g/kWh 610 359 307 -- Efficiency % 21 39 40 --
Source: Energy Statistics Yearbook, ERA, Mongolia, 2009.
25. Though emission standards for coal-fired power plants have been developed and issued in Mongolia, emissions of SO2, NOx, CO, and particulate matters (PMs) from UB power plants were not fully controlled. Only CHP4 was equipped with an electrostatic precipitator (ESP) in 2004. Pollutant emissions from other power plants were free from control. The pollutant emissions from the coal-fired power plants in Mongolia have become the major contributor to local air pollution, and it is recognized that the emissions must be controlled in order to mitigate air pollution in Mongolia and further Northeast Asia.
26. There is an obvious large potential to increase energy efficiency of power plants in Mongolia through replacing inefficient power plants with new efficient ones and rehabilitating existing power plants.
B. Power Plants in the PRC
1. Installed Capacity
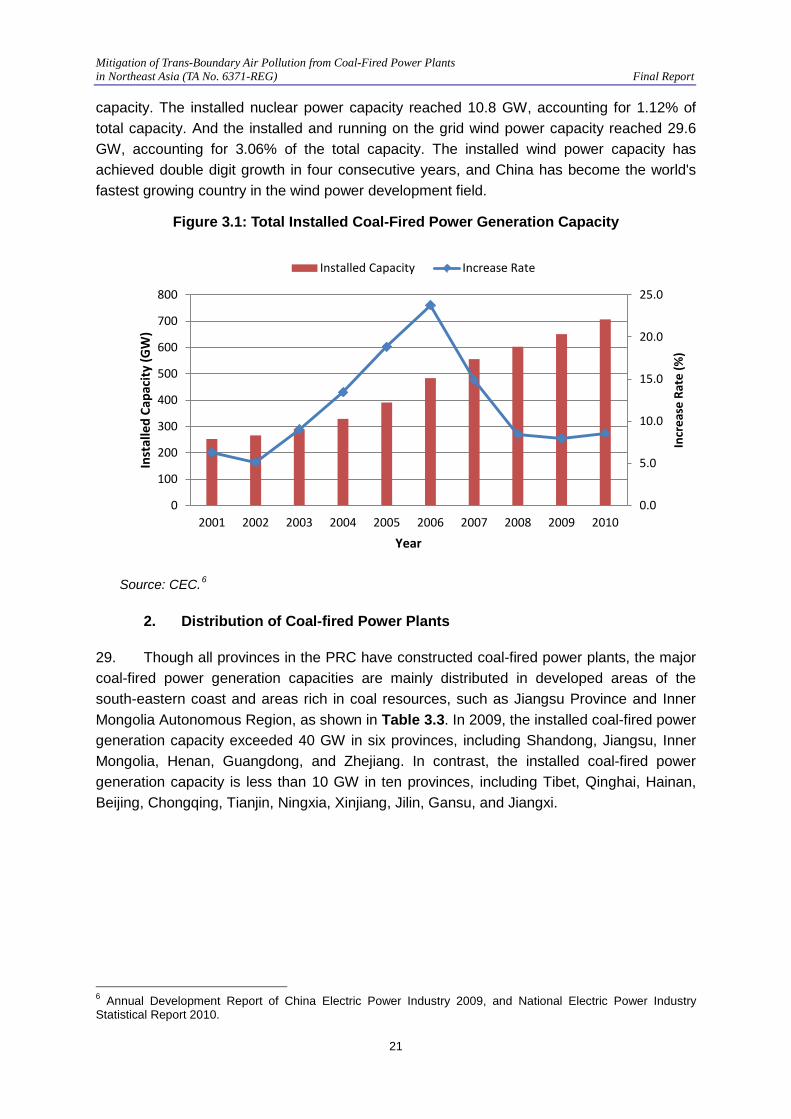
27. The PRC’s total installed capacity of thermal power generation has experienced a rapid increase since 2000, as shown in Figure 3.1. By the end of 2010, the total installed capacity of coal-fired power generation reached 650 GW, representing 67.6% of 966 GW of the total power generation capacity in the PRC in 2010. The increase rate of installed capacity of coal-fired power generation was continuously raised from 5.1% in 2002 to 23.62% in 2006. Since 2006, the increase rate gradually decreased, but still reached over 8% in the last two years. It is estimated that coal-fired power generation will continue to increase at a certain rate due to the continuous and stable economic development in the PRC. Though the Government of the PRC promotes a switch from fossil fuels into renewable energy, coal-fired power generation will still keep a stable increase rate and dominate the power generation in the near future in the PRC.
28. In 2010, the newly installed thermal power units, whose capacity were 600 MW or more, accounted for 54% of the total capacity of all new thermal power units, while the units with a capacity of 300 MW or more were over 91%. A total of 21 USC units with a total capacity of 1 GW have been put into operation in China. China’s installed hydropower capacity reached 216.05 GW, ranking first in the world, accounting for 22.36% of the total
Mitigation of Trans-Boundary Air Pollution from Coal-Fired Power Plants in Northeast Asia (TA No. 6371-REG) Final Report
21
capacity. The installed nuclear power capacity reached 10.8 GW, accounting for 1.12% of total capacity. And the installed and running on the grid wind power capacity reached 29.6 GW, accounting for 3.06% of the total capacity. The installed wind power capacity has achieved double digit growth in four consecutive years, and China has become the world's fastest growing country in the wind power development field.
Figure 3.1: Total Installed Coal-Fired Power Generation Capacity
Source: CEC.6
2. Distribution of Coal-fired Power Plants
29. Though all provinces in the PRC have constructed coal-fired power plants, the major coal-fired power generation capacities are mainly distributed in developed areas of the south-eastern coast and areas rich in coal resources, such as Jiangsu Province and Inner Mongolia Autonomous Region, as shown in Table 3.3. In 2009, the installed coal-fired power generation capacity exceeded 40 GW in six provinces, including Shandong, Jiangsu, Inner Mongolia, Henan, Guangdong, and Zhejiang. In contrast, the installed coal-fired power generation capacity is less than 10 GW in ten provinces, including Tibet, Qinghai, Hainan, Beijing, Chongqing, Tianjin, Ningxia, Xinjiang, Jilin, Gansu, and Jiangxi.
6 Annual Development Report of China Electric Power Industry 2009, and National Electric Power Industry Statistical Report 2010.
0.0
5.0
10.0
15.0
20.0
25.0
0
100
200
300
400
500
600
700
800
2001 2002 2003 2004 2005 2006 2007 2008 2009 2010
Incr
ease
Rat
e (%
)
Inst
alle
d Ca
paci
ty (G
W)
Year
Installed Capacity Increase Rate
Mitigation of Trans-Boundary Air Pollution from Coal-Fired Power Plants in Northeast Asia (TA No. 6371-REG) Final Report
22
Table 3.3: Power Generation Capacities in Provinces of the PRC (2010)
Area and Province
Total Hydraulic Generation Thermal Generation
Capacity (GW)
Increase from last year (%)
Capacity (GW)
Increase from last year (%)
Capacity (GW)
Increase from last year (%)
The PRC 966.4 10.6% 216.1 10.1% 709.7 9.0%
Beijing 6.3 1.4% 1.1 0.0% 5.1 0.4%
Tianjin 10.9 9.0% 0.0 0.0% 10.9 8.8%
Hebei 42.2 10.1% 1.8 0.0% 36.6 4.3%
Shanxi 44.3 8.3% 1.8 13.0% 42.1 7.5%
Inner Mongolia 64.6 16.3% 0.9 2.4% 54.0 11.8%
Liaoning 32.3 25.3% 1.5 0.7% 27.7 22.9%
Jilin 20.4 27.7% 4.3 9.5% 13.9 31.3%
Heilongjiang 19.7 4.2% 0.9 0.0% 16.8 0.4%
Shanghai 18.6 12.1% 0.0 - 18.4 11.4%
Jiangsu 64.7 14.3% 1.1 0.0% 60.0 14.4%
Zhejiang 57.2 2.0% 9.7 1.4% 43.6 0.7%
Anhui 29.3 3.2% 1.7 4.3% 27.6 3.1%
Fujian 34.7 14.4% 11.1 1.2% 23.1 21.9%
Jiangxi 17.1 11.3% 4.0 991.9% 12.9 12.5%
Shandong 62.5 2.8% 1.1 0.9% 60.0 2.0%
Henan 50.6 8.1% 3.7 0.0% 46.9 8.7%
Hubei 49.1 7.4% 30.9 2.8% 18.2 15.8%
Hunan 29.1 6.4% 13.0 13.4% 16.1 1.2%
Guangdong 71.1 11.0% 12.6 11.9% 52.9 9.5%
Guangxi 25.3 -0.7% 14.9 1.3% 10.4 -3.5%
Hainan 3.9 1.8% 0.8 7.1% 3.0 -3.9%
Chongqing 11.7 2.9% 4.9 7.7% 6.7 -0.9%
Sichuan 43.3 13.6% 30.7 18.9% 12.6 2.5%
Guizhou 34.1 10.3% 16.6 21.6% 17.5 1.3%
Yunnan 36.1 13.8% 24.4 16.5% 11.3 5.8%
Tibet 0.8 -86.3% 0.4 0.0% 0.3 210.0%
Shaanxi 23.6 8.1% 2.2 15.1% 21.4 7.4%
Gansu 20.8 17.4% 6.1 2.9% 13.2 20.5%
Qinghai 12.6 18.3% 10.7 22.2% 1.9 0.0%
Ningxia 13.7 44.3% 0.4 0.0% 12.7 44.1%
Xinjiang 16.1 25.5% 3.0 23.0% 11.7 23.1% Source: CEC, National Electric Power Industry Statistical Report 2010.
Mitigation of Trans-Boundary Air Pollution from Coal-Fired Power Plants in Northeast Asia (TA No. 6371-REG) Final Report
23
30. There are three heavy acid rain regions in the PRC located in southwest region, central China, and southeastern coastal region. Southeastern coastal region is the acid rain area that is closest to Northeastern Asia Sub-region. Coal-fired power plants in Jiangsu, Shandong, and Zhejiang are the major causes of acid rain.
3. Conditions of the Coal-Fired Power Plants
31. As the coal-fired power generation is increasingly developed during the last ten years, the technologies of power generation and emissions control have also experienced great improvement. The typical existing technologies and development tendency are summarized in the following:
During the implementation of the policies on substituting large scale efficient thermal power plants for small inefficient thermal power plants, a large number of inefficient and heavy polluting thermal power plants were phased out in the PRC. The USC power generation technology, which is a clean coal technology that relies on very high pressures and temperatures to achieve greater efficiency of fuel use, has been successfully used in a series of efficient coal-fired power plants and is being extensively promoted.
Efficient and environment-friendly 300 MW CHP units have been widely used in the areas with stable heating demands, with which many small, inefficient and heavy polluting coal-fired heating boilers have been replaced.
IGCC technology has been well studied. IGCC power plants can offer a potential of 45-50% efficiency and it is a promising clean coal technology with near-zero emission. The PRC started to construct an IGCC power plant with a 250 MW capacity in the Harbor Industrial Park in Tanggu District of Tianjin City, and it is expected to be put into service in 2012. This IGCC plant is partially funded by Asian Development Bank (ADB).
By the end of 2010, the operating power generation units with FGD in the whole country had exceeded 0.56 billion watt, which accounts for 86% of the capacity of coal power units throughout the country.
The average coal consumption per kWh power generation was reduced from 370 gram/kWh (g/kWh) in 2005 to 333 g/kWh in 2010, a 10% decrease. 7
32. With improvement and development in the coal-fired power generation industry in the PRC, energy efficiency and emission reduction have become the important performance indicators and targets for coal-fired power plants.
7 Source: CEC
Mitigation of Trans-Boundary Air Pollution from Coal-Fired Power Plants in Northeast Asia (TA No. 6371-REG) Final Report
24
IV. EMISSION STANDARDS IN SOME SELECTED COUNTRIES
33. One of the tasks under the TA is to propose air emission standards for coal-fired power plants in Mongolia. The consulting team reviewed and conducted extensive research on many countries’ emission standards for coal-fired power plants in order to have a comprehensive understanding of regional and international best practices that are applicable to Mongolia for the new emission standards for power plants. The current emission standards of some selected countries, including Mongolia, China, the ROK, Japan, the U.S., and the UK, are shown in Appendix 3, and they are summarized in this section of the report.
A. Emission Standards for Power Plants in Mongolia
34. The current emission standards for coal-fired boilers, including steam boiler for power plants in Mongolia, were established in 2008 (MNS5915:2008). It is the first standard of this kind in Mongolia for power plant boilers and HOBs. The standards regulated SO2, NOx, CO, and PM emissions from coal-fired boilers of power plants and HOBs. There are 15 different emission limitation levels on each pollutant for different types of boilers and capacities, including steam boilers and hot water boilers.
35. Mongolia’s current emission standards are based on emission measurements from existing boilers, so they are complex and not well justified. The measurement amounts are used as emission standards for a specific type of boilers. There are no certain patterns to follow with boiler type or size (capacity) because each boiler’s age and deterioration is different. No emission control equipment is used on HOBs and most of the coal-fired steam boilers for power plants, except CHP4 which is equipped with ESP for PM control. Uncontrolled pollutants emitted from these boilers and power plants pollute the air in surrounding areas.
36. In addition to not using emission control equipment, these boilers are very old and inefficient and use outdated technologies, which make the air pollution problem more serious. The majority of Mongolia’s boiler houses and power plants were built in the former Soviet era based on 1960s-1970s technologies. Most of them are at or nearing the end of their using life due to old age and lack of proper maintenance, especially during the 1990s when the Mongolian economy changed from a planned system to a market-based system. Even though some of them like CHP4 have gone through major repairs over the last 10 years using international funds, most of them need urgent replacement. The result is very low-energy efficiency and massive fuel losses and high emissions.
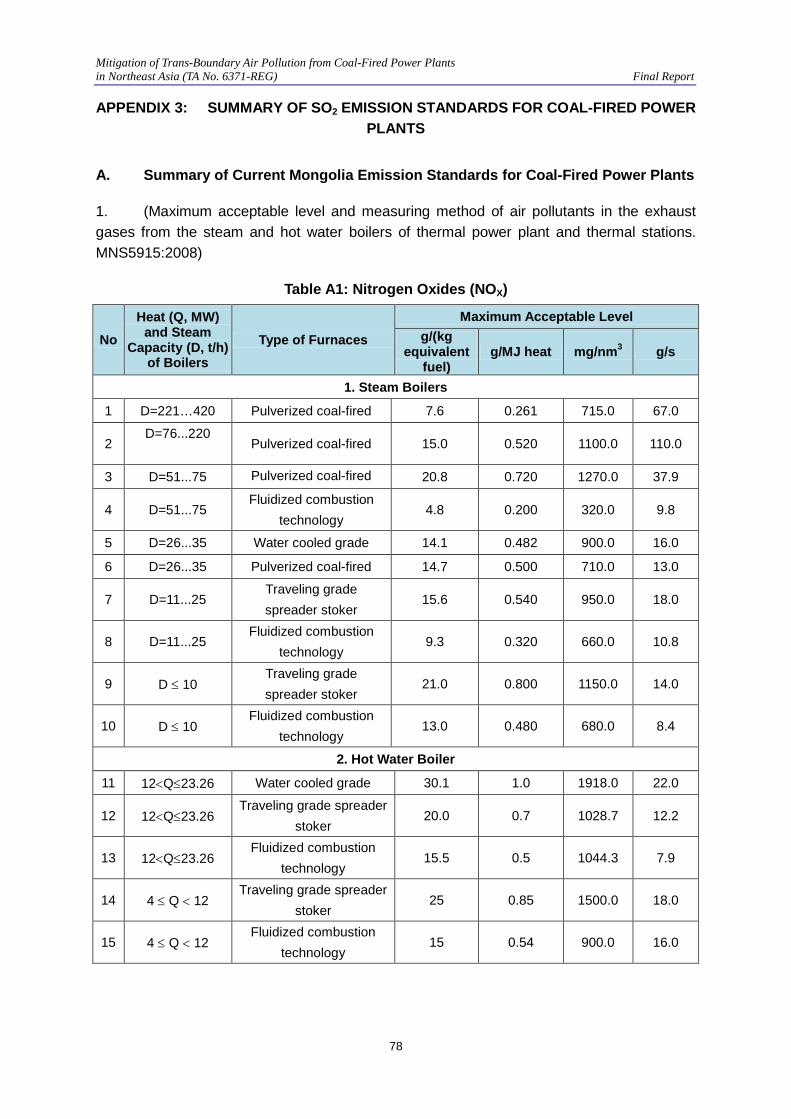
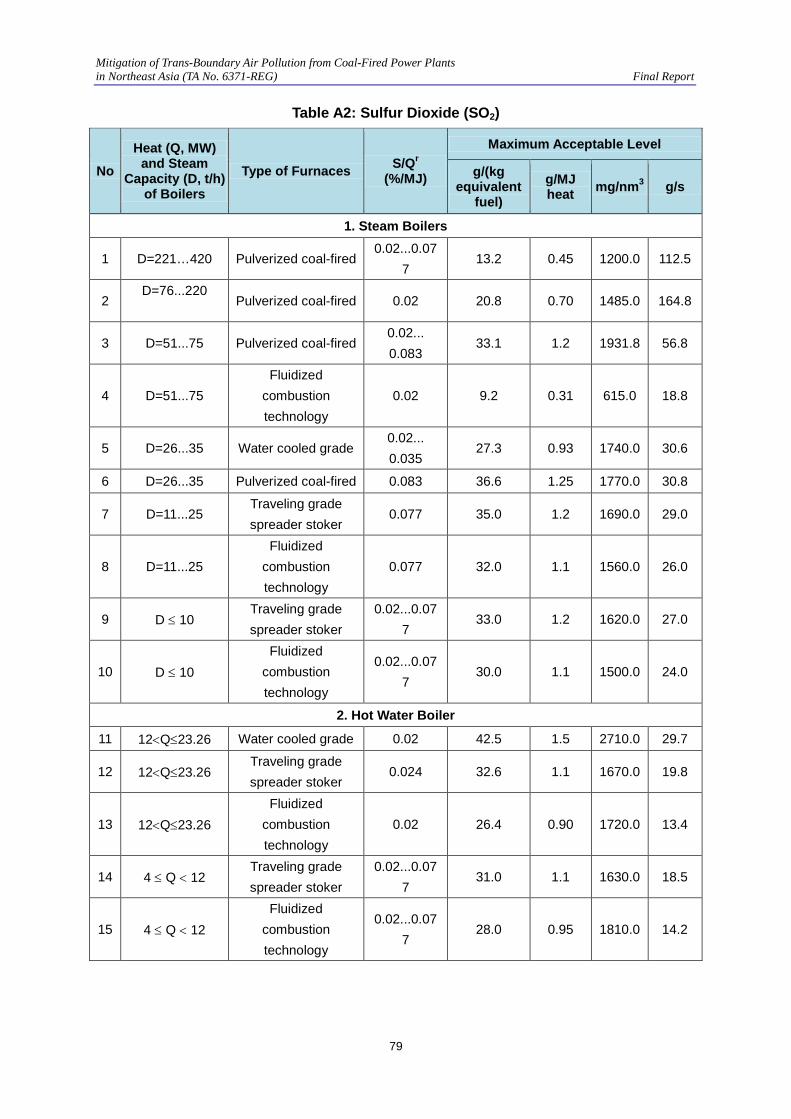
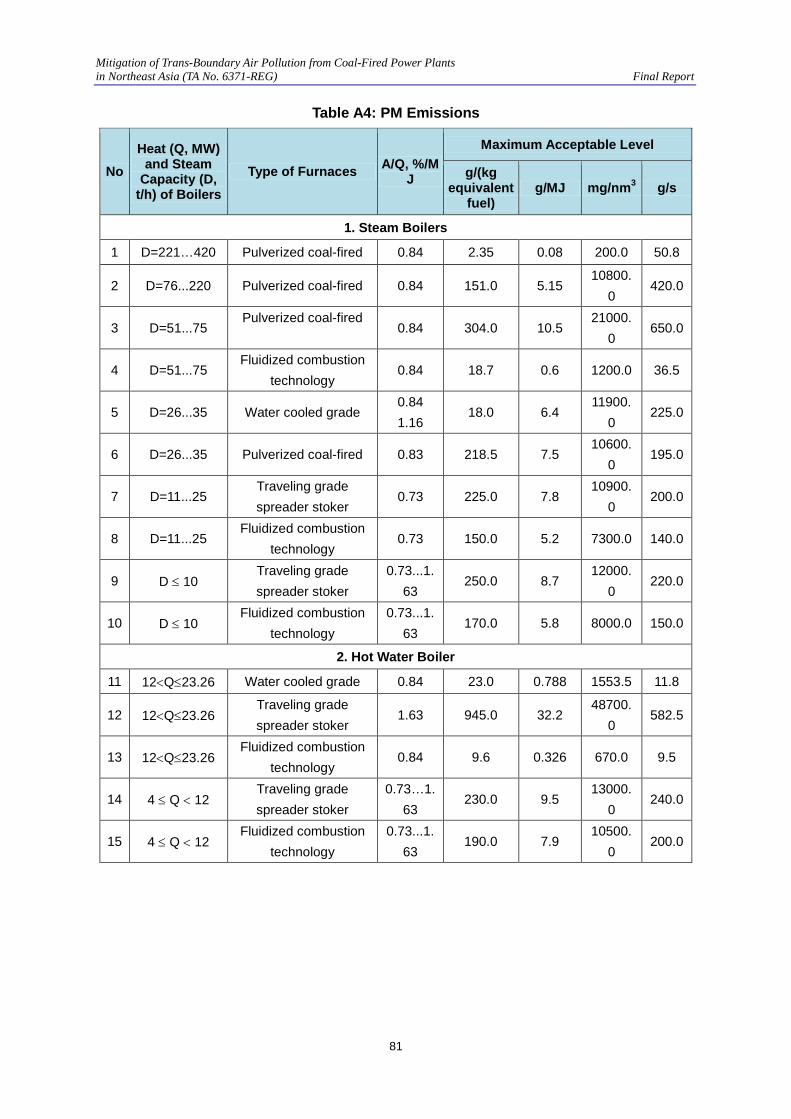
37. For example, PM emissions from existing boilers are at a level of 10,000 mg/m3, which is 100 times of the international best practice levels. High PM concentration is the most serious air pollution problem in UB area, which causes health problems. SO2 emission is between 600-2,700 mg/m3 depending on sulfur content in coal and combustion technologies; while NOx is between 320-1,900 mg/m3. Maximum acceptable levels of air pollutants in the exhaust gases from the steam and hot water boilers in Mongolia are shown in Appendix 3.
Mitigation of Trans-Boundary Air Pollution from Coal-Fired Power Plants in Northeast Asia (TA No. 6371-REG) Final Report
25
38. The Government of Mongolia has been planning to build a new CHP plant in UB areas for over 10 years to meet the increasing demand for heat and electricity in UB. A feasibility study of the new CHP plant was completed in May 2011 and this plant will have the state-of-the-art control equipment to reduce PM, SO2 and NOx emissions.
B. Emission Standards for Power Plants in the PRC
39. In China, the total coal-fired power plant capacity increased from 45,600 MW in 1980 through 285,640 MW in 2003 and to 650,110 MW in 2010. The rapid growth of coal-fired power plants resulted in increased air pollutions. In 1979, the first Chinese Environmental Protection Law was promulgated. Since then, the air pollutants emission standards have been updated several times, gradually becoming more stringent. The original emission standards for the power industry (GB13223-1991 and GB13223-1996) were rather tolerant. From 1 January 2004, the new “Air Pollutant Emission Standards for Thermal Power Plants” (GB13223-2003) became effective to replace the old standards. In order to meet more stringent emission requirements, in 2011 the Chinese government further revised the 2003 version into GB13223-2011, which became effective since 1 January 2012. The 2011 version has much more stringent emission requirements than before.
40. The 2003 emission standards of air pollutants for thermal power plants applies to all pulverized coal combustion power generating boilers, and all coal-fired power generating boilers with a capacity larger than 65 tons/hour (t/h) except stoker boilers. It allows PM emission of 50 mg/m3 for new coal-fired power plants in most parts of China while the standard is 100 mg/m3 for remote areas in western China for the power plants burning coal of sulfur content less than 0.5%. SO2 emissions are 400-1,200 mg/m3 for facilities in different locations. NOX emission standards are 450-1,100 mg/m3, depending on the volatile matter in coal.
41. The 2003 standards contain different emission requirements for thermal power plants constructed in different phases.
Phase I: Emission standards shall apply to new construction, expansion, and/or rebuilding of power plant projects that were put into operation or obtained approval on the environmental impact assessment (EIA) report before 31 December 1996.
Phase II: Emission standards shall apply to new construction, expansion, and/or rebuilding of power plant projects that were put into operation or obtained approval on the EIA report from 1 January 1997 to 31 December 2003.
Phase III: Emission standards are applicable to new construction, expansion, and/or rebuilding of power plant projects that were put into operation or obtained approval on the EIA report from 1 January 2004 onwards.
42. In addition to the time of construction, the power plant location is another factor affecting emission limitation standards. Power plants in urban areas have much stricter standards than those in rural areas. The power plant facilities have one year to achieve first stage and another five years to achieve final stage of the standards.
Mitigation of Trans-Boundary Air Pollution from Coal-Fired Power Plants in Northeast Asia (TA No. 6371-REG) Final Report
26
43. There were different emission limit values for PM and SO2 applied to power plants with FGD systems approved before the date that the standards came into force, and power plants at coal mine-mouths in the western region outside the “Two Control Zones” that burn low sulfur coal (sulfur content of feed coal < 0.5%). The emission limits applicable to boilers burning waste coal as main fuel is less stringent than those used under the above-mentioned situation. The different criteria are used for NOx emissions based on volatile matter in coal.
44. The 2011 emission standards of China applies to all pulverized coal combustion power generating boilers, and all coal-fired power generating boilers with a capacity larger than 65 tons/hour (t/h) except stoker boilers. It requires PM emissions be less than 30 mg/m3. SO2 emissions standards are 100-200 mg/m3 for new facilities and 200-400 for existing ones. NOX emission standards are 100-200 mg/m3 for all, depending on the volatile matter in coal. These standards shall be followed for new boilers from 1 January 2012 and for existing coal-fired power plants from 1 July 2014, respectively. The detailed regulations are shown in Appendix 3.
45. China’s current emission standards have gradually caught up with those of the developed countries in Northeast Asia and other places in the world, including the ROK, Japan, and the U.S. China has developed its air pollution standard mechanism, acquired from developed countries, considering issues such as policy, social and economic conditions, control technology availability, and financial affordability. With technology and economic development, Chinese air pollution standards will become more stringent than ever before.
C. Emission Standards for Power Plants in Japan
46. Japan is a developed country and one of the first countries to realize serious air pollution and establish emissions standards. The Ministry of the Environment of Japan is responsible for establishing and implementing environmental policies and regulations on air pollution control, monitoring and management, setting up basic environmental plans and regional environmental pollution control programs, etc.
47. The primary law on environmental protection, the Basic Law for Environmental Pollution Control came into force in 1967 and was replaced in 1993 by the “Basic Environment Law” that also includes sustainable development. In 1968, the Air Pollution Control Law was enacted providing the basis for air pollution legislation in Japan.
48. Japan first regulated PM emission and later added SO2 to its emission control pollutants. In 1973, one more pollutant of NOx was added to emission control matters. The environmental laws and standards have been amended over the years. Japan has the among the most stringent air pollution standards in the world for power plants. Even so, some local governments in Japan have developed standards more stringent than the national standards.
49. Regulatory measures against air pollutants emitted from factories and business sites are set in forms of emission/discharge standard, K value control that limits the amount of flue gas emission, total amount control that limits the amount of air pollutants emitted into the atmosphere, and ambient air quality standard that limits the concentration of air pollutants in ambient atmosphere.
Mitigation of Trans-Boundary Air Pollution from Coal-Fired Power Plants in Northeast Asia (TA No. 6371-REG) Final Report
27
50. The current emissions standard for PM from large-scale coal-fired power plants in general areas is 100 mg/m3 for new plants built after 1 June 1982 and in the defined areas.
51. In Japan, the discharge amount of SO2 is limited on the basis of the value estimated from a constant K that is determined at every designated area, and the effective stack height. The advantage of this standard is that it allows more stringent regulations in vulnerable areas by making K smaller. Emission limit values for SO2 can be calculated using the following formula:
q = K x 10-3 x He2
where q is the permissible hourly emission volume of SO2 (m3/h). Regulations on total amount of SO2 emissions are also set at each area and/or plant based on the total emission reduction plan. K values range from 1.17 to 17.5 and therefore the SO2 emission standards for power plants are quite different depending on the stack height and power plant location.
52. The current standard for NOx emission concentration limits for coal-fired power plants is 200 mg/m3. The same emission limit values for NOx apply to both existing and new plants. The emission standards for coal-fired power plants in Japan are shown in Appendix 3. In practice, emissions from power plants in Japan are much less than the national standards.
D. Emission Standards for Power Plants in the ROK
53. The ROK took the initial steps by setting the emission standards on NOx in February 1979, followed by standards on carbon monoxide (CO), PM, ozone, and hydrocarbon in 1983, and lead in February 1991. These were further strengthened in 1993 by establishing new standards on sulfurous acid gas and hydrocarbon.
54. The Ministry of Environment implemented the “Special Measures for Metropolitan Air Quality Improvement,” a policy that stipulates emission standards, a total air pollution load management system, emissions trading system, and the supply of low emission vehicles led to the legislation of Special Act on Metropolitan Air Quality Improvement in December 2003. Today, legally binding emission standards are actively enforced in industrial sites in the ROK.
55. The ROK emission regulations set SO2 limits of 100 ppm and 80 ppm for existing and new large power plants, respectively. NO2 emission standards are 350 ppm and 150 ppm for existing power plants built before and after 1990, respectively. NO2 emission limit is 80 ppm for new power plants. PM emission limits are 40 mg/m3 and 20 mg/m3 for existing and new power plants, respectively. Also under the new regulation from 2010, the mercury emission limit is set at 0.1 mg/m3. A summary of emission limitations for power plants in the ROK is shown in Appendix 3.
56. The ROK government understands the importance of environmental management and rewards those who not only comply with emission standards but go beyond compliance. For example, if a company maintains SOx emission at less than 60% of the legal limit, NOx emission less than 70% of the legal limit, and PM emission less than 50% of the legal limit, the ROK government will recognize it as an “Environmentally Friendly Company” and reward it. Therefore, most power plants have their own internal emission standards that are more
Mitigation of Trans-Boundary Air Pollution from Coal-Fired Power Plants in Northeast Asia (TA No. 6371-REG) Final Report
28
stringent than the national standards. In Dangjin Coal Firing Power Plant, for example, while the national legal limit is 100 ppm for SO2, 150 ppm for NOx, and 40 mg/m3 for PM, the internal guidelines at the company are 45 ppm for SO2, 50 ppm for NOx, and 12 mg/m3 for PM.
E. Emission Standards for Power Plants in the United States
57. Background. In the U.S., coal-fired power plants have been the focus of the emission control efforts. The emissions from large facilities such as power plants were regulated under the Clean Air Act (CAA) of 1970, which was amended in 1977 and later in 1990. The CAA requires the U.S. Environmental Protection Agency (USEPA) to set national standards for pollutants considered harmful to public health and the environment. The centerpiece of the 1970 CAA is the National Ambient Air Quality Standard program which sets air quality standards for six main pollutants: SO2, NOx, PM, CO, ozone, and lead. New source emission regulation standards are set by the New Source Performance Standards (NSPSs) published in 1979.
58. Since many boilers built before these regulations continued to operate, and had a substantial number of years of useful life remaining, one major revision in a 1977 amendment restricts pollution control for newly-built sources and brings older plants under the CAA regulations. It instituted the new source review, which requires companies to obtain permits before modifying equipment or process.
59. The 1977 CAA Amendments required the USEPA to implement new source performance standards for SO2 based on a percentage reduction from uncontrolled levels. This was intended to promote the installation of FGD systems at new plants. The 1979 NSPS required a 70-90% reduction of SO2 emissions (depending on coal sulfur content and heating value) for new plants built after 1978.
60. The next major revision of the CAA occurred in 1990, when the U.S. Congress passed the CAA Amendments of 1990 to comprehensively address air pollutants emissions. The 1990 amendment also addresses acid rain pollution by creating a market-based system as a means to reduce SO2 emissions from power plants. The SO2 cap-and-trade program was initiated as the Acid Rain Program under Title IV of the 1990 CAA Amendments to achieve an emission cap of 8.95 million tons of SO2 annually in 2010.
61. Approach of Current Standards. All new plants, or major additions to existing plants, need to comply with the NSPS standards. The USEPA determines standards for each new source by evaluating cost, environmental effects, and best available technologies. New sources are subject to stricter emissions control technology and permitting specification. However, existing power generating facilities built before the effective dates of the air pollution laws and associated regulations are exempt from this requirement. If “grandfathered” facilities subsequently undergo major modification, then they are required to undergo permitting and review, and to implement state-of-the-art pollution controls.
62. The emission schedule under NSPS is rather complicated. Emission limitations are based on the capacity of facility, the year the facility was built, the type of fuel used, the heat
Mitigation of Trans-Boundary Air Pollution from Coal-Fired Power Plants in Northeast Asia (TA No. 6371-REG) Final Report
29
input rate of generating unit, and the type of emission pollutant. Both emission concentration limitation and cap (percentage reduction of the potential emission) are applied.
63. For PM and SO2 emission, there are three different timeframes for electric utility generating units based on the construction time of the unit. The cut-off times are 17 August 1971 through 18 September 1978; 18 September 1978 through 28 February 2005; and after 28 February 2005. For NOx emission, there are four different time frames for generating units based on the time of construction. The cut-off times are 17 August 1971 through 18 September 1978; 18 September 1978 through 9 July 1997; 9 July 1997 through 28 February 2005; and after 28 February 2005. Emission standards for PM, SO2, and NOx for newly-built, expanded, and rebuilt coal-fired power plants in the U.S. are shown in Appendix 3.
64. Newly Proposed Rule in 2011. The USEPA is working on tougher national standards for smog, first-time rules on coal-ash waste, and new limits on mercury emissions. The USEPA has proposed a different set of rules to use the CAA for the first time to curb CO2 emissions linked to climate change.8
65. On 16 March 2011, the USEPA issued a rule that will reduce emissions of toxic air pollutants from power plants. It is also proposing to revise the NSPS for fossil-fuel-fired electric generating units. This NSPS would revise the standards for new coal- and oil-fired power plants on PM, SO2 and NOx.
66. The proposed new standards for newly-constructed coal-fired power plants are 181 g/MWh for SO2 and 22.7 g/MWh for PM. These standards are significantly more stringent than the existing standards.9
67. The USEPA estimates that there are approximately 1,350 units affected by this action, including approximately 1,200 existing coal-fired units and 150 oil fired units at about 525 power plants. It estimates that the total national annual cost for implementing this rule will be $10.9 billion in the year of 2016, and the health benefits associated with reduced exposure to fine particles are $59 billion to $140 billion in 2016.10
F. Emission Standards for Power Plants in the EU
68. The first EU-wide environmental policy, the Environmental Action Program, was introduced in 1972. The Directive on Integrated Pollution Prevention and Control (96/61/EC) was adopted in 1996 and came into effect in 1999. It required member states to introduce permitting procedures to various industrial processes, including combustion installations with a capacity greater than 50 MWth.
69. Limitations on emissions and concentrations of air pollutants were set in the Directive on National Emission Ceilings for Acidifying and Ozone-Forming Air Pollutants (2001/81/EC). This directive, effective from November 2001, covered four air pollutants: SO2, NOx, volatile organic compounds, and ammonia. It set binding emission ceilings to be attained by each Member State by 2010. 8 U.S. News, July 6, 2010. 9 U.S. Federal Register, Vol. 76, No. 85, Tuesday, May 3, 2011, Proposed Rules. 10 U.S. EPA Fact Sheet, Proposed Power Plant Mercury And Air Toxics Standards, March 2011.
Mitigation of Trans-Boundary Air Pollution from Coal-Fired Power Plants in Northeast Asia (TA No. 6371-REG) Final Report
30
70. The Directive on the Limitation of Emissions from Large Combustion Plants (2001/80/EC) became effective on 27 Nov 2001 and it lays down limit values for emissions of air pollutants from combustion plants with a rated thermal capacity of at least 50 MWth, irrespective of the fuel used. The directive also includes emission ceilings and reduction targets specifically for SO2 and NOx emissions from existing plants.
71. The limit value of 50-100 mg/m3 for PM emission may be applied to existing and new plants depending on rated thermal input capacity larger or smaller than 500 MWth, while a limit value of 30-50 mg/m3 may be applied to new plants operating after 27 November 2003 with a rated thermal input capacity larger or smaller than 100 MWth as the dividing boundary.
72. The limit values for emissions of SO2 from existing and new plants operating before 27 November 2003 formed a linear decreasing pattern, with 2,000 mg/m3 for plants with a capacity smaller than 100 MWe and 400 mg/m3 for plants with a capacity at or larger than 500 MWe. For further new plants, limit values for emissions of SO2 are 200 mg/m3 for plants with a capacity larger than 100 MWth and 850 mg/m3 for plants with a capacity smaller than 100 MWth. Where the emission limit values cannot be met due to the characteristics of the fuel, a percentage rate of desulfurization shall be achieved.
73. The limit values for emissions of NOx from existing and new plants and further new plants have been set. But EU members will have to achieve the levels until end of 2015. For solid fuel in general, especially for solid fuel with a volatile content less than 10%, there are looser standards. The emission standards for power plants in EU are shown in Appendix 3.
G. Characteristics of Various Emission Standards
74. Some countries, like the U.S., have a very complicated schedule for emissions standards while other countries like the ROK take a simpler approach. The general characteristics of various emission standards can be summarized as follows:
75. The exhaust gases from burning coal contain primarily PM, SO2, and NOx; volatile organic compounds; and heavy metals, etc. The main focuses are on emissions of particulates less than 10 microns (μm) in size (PM10), SO2, and NOx.
76. Fuel type/quality plays a very important role in meeting the stringent emission standards. Therefore, there are different emission standards for solid, liquid or liquid fossil fuels, and other non-fossil fuels. For solid fuels like coal, there are different NOx emission standards for fuels with different amount of volatile matter.
77. There are many facilities in service before emission standards are established. Thus, standards are different for existing facilities equipped with old technologies and new facilities adopting new technologies. Even for existing facilities, because their remaining service life is quite different, some standards are different according to the facility initial build time.
78. Old facilities have years to prepare and update their technologies to gradually catch up with emission standards. They would be subject to more stringent standards after repair, renovation, or reconstruction. If they do not improve and meet the emission standards set for them during the transition time, they will be forced to be phased out.
Mitigation of Trans-Boundary Air Pollution from Coal-Fired Power Plants in Northeast Asia (TA No. 6371-REG) Final Report
31
79. The emission controls are designed to reduce emissions and protect human health. The controls on the plants, and perhaps outside the plants, are necessary to mitigate the impact of the plants on the airshed in which they are located. Standards are typically more stringent in cities/urban areas with high population densities than in remote areas with less people.
80. The emission control limits exhaust gas emission concentration in facilities. Some countries go further to limit both emission concentration and the total amount in a region or even a whole country.
81. It is more advantageous for big facilities to perform emission control than small ones, simply because of the economy of scale. Therefore, standards for big facilities are more stringent than for small ones. Emission standards have been improved with time, and new standards are issued every a few years. With emission standards gradually becoming more and more stringent, the cut-off line for big facilities has moved from 500 MW to 300 MW, or even down to 10 MW.
82. The emission standards are based on advanced control technologies like ESP, FGD, and selective catalytic reduction (SCR). Without these technologies, it is not possible to achieve these emission reductions. For example, from the early 1980s, high efficiency dust collectors such as ESP and bag houses gradually played dominant roles in coal-fired power units in China. Low-efficiency PM collectors, such as multi-cyclones, wet scrubbers, or venture-scrubbers, which had been the dominant equipment in the past 30 years, almost disappeared in new power plants. Precipitators with collection efficiencies as high as 99.9% are available in the commercial market now.
H. Comparison of Emission Standards of Various Countries
83. A comparison of current emission limitations from various developed countries like the U.S., EU, and Mongolia’s Asian neighbors Japan and the ROK, as well as developing countries like China, is summarized in Table 4.1.
Table 4.1: Comparison of Existing Emission Limits for Coal-Fired Power Plants
84. It can be seen from the above table that Japan has the lowest SO2 emission standard at 170 mg/m3 while Mongolia has the highest SO2 emission standard at over 2,700 mg/m3 for relative large water cooled grade hot-water boilers. The U.S. has taken the case-specific approach of setting emission limits for each proposed new power plant using the best available control technology, and the actual SO2 emission limits are much lower than 184 mg/m3.
Mitigation of Trans-Boundary Air Pollution from Coal-Fired Power Plants in Northeast Asia (TA No. 6371-REG) Final Report
32
85. For PM emission standards, the ROK has the lowest emission standards among the five countries and EU. The U.S. and China also have very stringent PM standards. The Japan’s PM standards were established a long time ago and have not been revised since most power plant emissions are far below 100 mg/m3. Again, Mongolia has the highest emission standards for PM. The maximum acceptable level for PM of traveling grade speeder stoker hot-water boilers is as high as 48,700 mg/m3.
86. For NOx emission standards, China has the lowest standards at 100 mg/m3 at key areas while Mongolia has the highest at 1,900 mg/m3 for relative large boilers. It has been reported that the actual NOx emission levels in both Japan and U.S. are much lower than the standards.
87. The comparisons of emission standards for SO2, PM and NOx for coal-fired power plants in the five countries and EU region are presented in Figure 4.1 to Figure 4.3.
Figure 4.1: Comparison of Average SO2 Emission Standards
Source: TA Consultant
0
500
1000
1500
2000
Mongolia China Japan ROK U.S. EU
1660
250 515
195 184
1200
SO2(mg/m3)
Mitigation of Trans-Boundary Air Pollution from Coal-Fired Power Plants in Northeast Asia (TA No. 6371-REG) Final Report
33
Figure 4.2: Comparison of Average PM Emission Standards
Source: TA Consultant
Figure 4.3: Comparison of Average NOx Emission Standards
Source: TA Consultant
0
5000
10000
15000
20000
25000
Mongolia China Japan ROK U.S. EU
24450
25 100 20 30 65
PM (mg/nm3)
0
200
400
600
800
1000
1200
Mongolia China Japan ROK U.S. EU
1110
150 200 169 252 400
NOx (mg/nm3)
Mitigation of Trans-Boundary Air Pollution from Coal-Fired Power Plants in Northeast Asia (TA No. 6371-REG) Final Report
34
V. PROPOSED EMISSION STANDARDS FOR MONGOLIAN POWER PLANTS
88. Through review, comparison and analysis of the current Mongolian emission standards for coal-fired power plants and emission standards of other developing countries (China) and developed countries (U.S., EU, Japan, and the ROK), the characteristics of standards and the procedures for establishing the standards can be understood. Based on the experience and lessons learned from others, and considering the current status of Mongolia regarding availability of coal, financial, environmental, and technology resources as well as people’s understanding and acceptability, through careful comparison and analysis, we propose this draft idea on emission standards for the Ministry of Nature, Environment and Tourism (MNET) to consider.
A. Scope of New Mongolia Emission Standard
89. The air pollution in the Capital City of Mongolia is very serious, especially during winter time. In term of the smoke problem, UB is among the most polluted cities in the world, as shown in Figure 4.2 of the previous chapter. Pollutants such as PM and SO2 are much higher than the international standards. Annual average concentrations of PM10 are higher than the Mongolian and international air quality standards. The measured PM10 levels by AMHIB11 in UB are 2-5 times higher than Mongolia’s standards of 50 μg/m3, 5-10 times higher than the value of 20 μg/m3 specified in the World Health Organization (WHO) Guideline, and 3-7 times higher than the European limit value of 40 μg/m3.12
90. It is well documented that particles (primary PM10, PM2.5, and secondary PM due to SO2 and NOx emissions) cause negative health effects when inhaled by people. Inhaling PM can severely affect lungs and hearts. Statistics show that over 50,000 people suffer from respiratory diseases. In 2007, it was estimated that the maximum health costs associated with the air pollution in UB was $147 million equivalent, representing 8.0% of UB’s gross domestic product (GDP) and 3.8% of national GDP. To mitigate the serious impacts from air pollution, more than 6.4 billion MNT has already been spent in combating smoke and air pollution in the last few years. However, in 2009, the smoke and air pollution in UB increased by 28% compared to the previous year due to the increase of settlement in ger areas of UB.13
91. In UB, the main sources of ground level PM concentrations are primary carbonaceous particles from coal combustion for heating and cooking (ger households) and industrial activities (HOBs and power plants). Emissions from coal-fired power plants are one of the major contributors to the bad air quality in UB.
92. SO2 and NOx are also major sources of acid rain and cause trans-boundary air pollution in other countries. They cause soil deterioration, agriculture and fishing disasters. In 2009, coal consumption from the three main power plants in UB was 3.79 million tons. The PM, SO2, NOx emissions from these power plants in UB were 14,381, 30,330, and 9,171 tons, 11 the World Bank in partnership with Mongolian counterparts launched an ”Air Monitoring and Health Impact
Baseline” (AMHIB) study in 2008 12 Air Pollution in Ulaanbaatar, World Bank, December 2009. 13 Business Mongolia by Amarsanaa, December 2009.
Mitigation of Trans-Boundary Air Pollution from Coal-Fired Power Plants in Northeast Asia (TA No. 6371-REG) Final Report
35
respectively. Therefore, more stringent emission standards on PM, SO2, and NOx are urgently needed to reduce current emissions to acceptable levels. The new emission standards will cover PM, SO2, NOX emissions as controlled pollutants for existing and new power plants.
B. Structure of New Emission Standards
93. Developed countries such as the U.S., EU, Japan, and the ROK have spent decades in developing and implementing their air pollution standards. In the early stages of standard development, they had to overcome the obstacles of people’s understanding and availability of technologies. Today, people have a better understanding about the effects of air pollution on human health and our living environment. In addition, more advanced control technologies are available than ever before. There are many lessons we can learn from past experience in setting air quality and emission standards.
94. For example, China has benefited from the experience of developed countries. From 1979, when China established its first environmental laws, to 2012, when more stringent environment laws are adopted, China spent more than 30 years gradually shortening the gap in learning and finally caught up with developed countries.
95. Mongolia faces a more favorable policy and technology environment, benefitting from the experiences of developed and developing countries, advanced control technologies, and international cooperation. Now Mongolia can develop new emission standards in line with international standards in a shorter time frame than China. By developing an emission standard in line with international standards, Mongolians will benefit from fewer health problems caused by air pollution. Northeast Asia countries will also benefit from reduced economic loss caused by acid rain and will contribute to curbing global warming.
96. However, any emission standards should be set considering the country’s special social acceptability and technically feasibility. The standards should be determined by technical options assessment and with the ability and willingness to pay for pollution reduction by civil society. The standards must be strictly enforced so maximum environmental and social benefits can be realized.
97. There are seven existing power plants and hundreds of HOBs in Mongolia. Mongolia still relies on them to provide power and heating for the citizens. These boilers are produced with old technologies and have no control of air emission in most cases. New standards will consist of two parts for the existing and newly-built facilities, respectively. New standards will give existing facilities some time to meet new standards, and otherwise they will be phased out.
98. Almost half of Mongolia’s 2.7 million populations live in UB. The population density is large in UB, like in the large cities of the U.S., China, and other countries in the world. In the other remote areas, the population is very small, with less than a few people in a square kilometer. Therefore, new standards in these areas will be different from the standards near urban areas.
Mitigation of Trans-Boundary Air Pollution from Coal-Fired Power Plants in Northeast Asia (TA No. 6371-REG) Final Report
36
99. Unlike the U.S. and China with diversified power plant capacities and boiler types and ages, Mongolia has relatively fewer power plants and thus it is not necessary to further divide the power plants by capacity and age when establishing air emission standards.
C. Proposed New Standards for Mongolia Power Plants
100. The proposed new standards should be in line with the international emission standards and meanwhile consider Mongolia’s economic capacity. According to the World Bank’s 2009 data, Mongolia’s GDP per capita is ranked 114th in the world (see Table 5.1).14 It is far lower than the developed countries and thus it is not realistic to set the emission standards to the levels of the developed countries.
Table 5.1: A Summary of GDP per Capita for Selected Countries
U.S. EU15 Japan ROK China Mongolia
Ranking 6th 22th 28th 85th 114th
GDP per capita ($) 45,989 32,900 32,453 27,168 6,828 3,522
101. The following new Mongolia air emission standards are proposed for coal-fired power plants for discussion among various stakeholders. These standards covered multi pollutants and have two parts for new and existing power plants respectively. The first part will apply to new coal-fired power plants and be in line with the Chinese standards issued in 2003 (Table 5.2 and Table 5.3). The second part is for existing power plants and HOBs (Table 5.4). It is proposed that existing power plants comply with the new standards by 2020. This will allow them to rebuild or retrofit the plants with new pollution control equipment to meet new standards.
102. Since most coal deposits in Mongolia are low sulfur coal, the emission standards for SO2 can be tighter than those for high sulfur coal without increasing control cost. So the emission limit for plant built in Area II is tighter than 2003 Chinese standards. According to the calculation shown later of this section, 600 mg/m3 is achievable for most coal used in Mongolia when control equipment has a control efficiency of 90% or more. Thus, the SO2 emission limit for coal-fired power plants in Area II can be set at 600 mg/m3 rather than 1,200 mg/m3 in the 2003 Chinese standards.
Table 5.2: Proposed PM and SO2 Emission Standards for Newly-Built Power Plants
Region SO2 (mg/m3) PM (mg/m3)
Area I 400 50
Area II 600 200 Note: Area I is defined as urban areas where the population density equals to or greater than 10 persons per square kilometer or the population is 1,000 or greater per square kilometer.
14 World Development Indicators database, World Bank website, accessed on 13 April 2011. 15 The World Factbook, Central Intelligence Agency website, accessed on 13 April 2011.
Mitigation of Trans-Boundary Air Pollution from Coal-Fired Power Plants in Northeast Asia (TA No. 6371-REG) Final Report
37
Area II is defined as remote areas that have a population density smaller than 10 persons per square kilometer or the population is less than 1,000 per square kilometer.
Table 5.3: Proposed NOX Emission Standards for Newly-Built Power Plants
Volatile Content in Coal NOx (mg/m3)
Vdaf <10% 1,100
10%≤ Vdaf ≤20% 650
Vdaf > 20% 450
Table 5.4: Proposed SO2 and PM Emission Standards for Existing Power Plants
Phase SO2 PM
Before Dec. 31, 2014 50% reduction from the 2010 level or 1,200 mg/m3
75% reduction from the 2010 level or 2,000 mg/m3
Before Dec. 31, 2017 Another 50% reduction from the 2014 level (75% reduction from the 2010 level ) or 600 mg/m3
90% reduction from the 2010 level or 200 mg/m3
Before Dec. 31, 2020 In line with the 2010 standards for new facilities
50 mg/m3 In line with the 2010 standards for new facilities
D. Rationale of the Proposed New Standards
103. The Mongolia Government has identified environment protection and improvement as a national priority. In December 2009, the Government debriefed Resolution No. 46 of the Parliament on decreasing air pollution in UB City. The Government promised to decrease air pollution by 50% and will spend 180 billion MNT on combating air pollution problems.16 The proposed new emission standards are consistent with the Mongolian national strategy.
104. The proposed new Mongolia emission standards will greatly reduce emissions from power plants and bring most noticed pollutant emissions in line with other countries’ emission standards and international air quality standards. The comparison of new Mongolia emission standards and other countries is shown in Table 5.5.
Table 5.5: Comparison of New Mongolia Standards with Other Countries’ Standards
Mitigation of Trans-Boundary Air Pollution from Coal-Fired Power Plants in Northeast Asia (TA No. 6371-REG) Final Report
38
E. Targets are Achievable
105. Whether the proposed emission standards are achievable or not has been carefully evaluated when the draft new standards are developed. There are many pollution control technologies that are proven and commercially available to control emissions from coal-fired power plants. The proposed emission standards for new power plants are based on the installation of ESP or baghouse, FGD technologies (including wet process, semi-dry process, and dry process), and low NOx generation or selective non-catalytic reduction (SNCR) system, which are mature technologies and widely available. Some control technologies for PM, SO2, NOx, or the combined are summarized below and more detailed descriptions are presented in Appendix 4.
106. Dust Control. Common PM control technologies are ESP, fabric filter collectors (baghouse), wet scrubbers and cyclone mechanical collectors. Most advanced PM control equipment used to control PM emissions from power plants is ESP and baghouse filter. The overall (mass) collection efficiencies of ESP are normally 99.5% and can even exceed 99.9%. Baghouses can often reach removal efficiencies of 99.9%. Wet scrubbers designed for removing 85% of SO2 can provide control of PM emissions with a removal efficiency of greater than 90% for particles with diameters above 10 microns. Multiple cyclones have overall mass removal efficiencies of 70-90%.
107. SO2 Removal. As a countermeasure against air pollution and acid rain, establishment of an FGD device is required for newly-established coal-fired power plants. The FGD measures include limestone gypsum, sea-water washing, ammonia scrubbing, Wellman-Lord, circulating fluidized bed (CFB), spray dry, duct spray dry, furnace sorbent injection, sodium bicarbonate injection etc. Suitable scale and performance efficiency of FGD are shown in Table 5.6. Some control equipment has the capability of simultaneously reducing emissions of multiple pollutants; such equipment may offer the potential to achieve emission control at a lower cost and reduced environmental footprint compared to conventional controls. All of these technologies and equipment are commercially available. Detailed advantages and disadvantages of these technologies are included in Appendix 4. Mongolia can select the most suitable control technologies based on the specific situation for an individual power plant.
108. CFB boiler has been widely adopted in power plants for its characteristics of saving coal, high efficiency and high reliability. Desulfurization in the boiler using limestone is another outstanding advantage of a CFB boiler. Generally, the combustion temperature of a CFB boiler is between 800°C and 1,000°C and it is the right temperature range for the activity of limestone decomposing into lime. The desulphurization efficiency is high at this temperature range. Therefore, with appropriate Ca/S and particle size of limestone, the desulphurization efficiency of 80% or more can be reached when Ca/S ratio is about 2.0. Thus a CFB boiler is comparatively fit for using middle and low sulfur fuel to produce power and control the emission simultaneously.
Mitigation of Trans-Boundary Air Pollution from Coal-Fired Power Plants in Northeast Asia (TA No. 6371-REG) Final Report
39
Table 5.6: FGD Equipment for SO2 Emission Reduction
FGD Type Suitable Scale Efficiency (%) S % in Coal
Wet technology 100-1,000 MW 95-98 Up to 5%
Dry technology 10-300 MW (1 unit)
Up to 500 MW (multiple units) >93 Under 2%
109. NOx Control. The SNCR system is used for control of NOx. A reagent is injected into the flue gas in the furnace within an appropriate temperature window. The NOx and reagent react to form nitrogen and water. Emissions of NOx thus can be reduced by 30% to 50%. A typical SNCR system consists of reagent storage, multi-level reagent-injection equipment, and associated control instrumentation. The SNCR reagent storage and handling systems are similar to those for SCR systems. However, because of higher stoichiometric ratios, both the ammonia and urea SNCR processes require three or four times as much reagent as SCR systems to achieve similar NOx reductions.
110. The reagent injection system must be able to place the reagent where it is most effective within the boiler because NOx distribution varies within the cross section. An injection system that has too few injection control points or injects a uniform amount of ammonia across the entire section of the boiler will almost certainly lead to a poor distribution ratio and high ammonia slip. Distribution of the reagent can be especially difficult in larger coal-fired boilers because of the long injection distance required to cover the relatively large cross-section of the boiler. Therefore, multiple layers of reagent injection as well as individual injection zones in cross-section of each injection level are commonly used to follow the temperature changes caused by boiler load changes.
F. Projection of Emission after Installation of Control Equipment
111. Based on the typical sulfur content and heating values of major coal deposits in Mongolia, the SO2 emissions can be estimated for different efficiencies of controls. The power plant emissions will be less than 400 mg/m3 and able to meet the newly-proposed standards if they are installed with FDG with a control efficiency of 90%. The results are presented in Table 5.7.
G. Approval of the New Emission Standards for Coal-fired Power Plants
112. The proposed new emission standards are consistent with the Mongolian national strategy and will greatly reduce emissions from power plants and bring most pollutant emissions in line with other countries’ emission standards and closer to the international air emission standards. This proposed standards were approved by the 71st decree of the National Council of Standardization and Measuring on 16th December 2011, and Mongolian Agency for Standardization and Metrology has formally published the new standards in December 2011 entitled “Maximum Acceptable Level and Measuring Method of Air Pollutants in the Exhaust Gases from Steam and Hot Water Boilers of Thermal Power Plants and Thermal Stations” (MNS6298:2011), which is shown in Appendix 5.
Mitigation of Trans-Boundary Air Pollution from Coal-Fired Power Plants in Northeast Asia (TA No. 6371-REG) Final Report
40
Table 5.7: Projection of SO2 Emission after Control for Major Coal Deposits
Coal Deposit Sulfur in Coal
(%)
Heating Value
(MJ/kg)
Mass Balance Calculation
SO2 Emission (ng/J)
S to SO2 convert factor F
FGD with 90%
Emission Reduction
(ng/J)
FGD with 90%
Emission Reduction (mg/m3)
FGD with 95%
Emission Reduction
(mg/m3)
Baganuur 0.36 14.4 500 0.9 45 128 64
Shivee-Ovoo 0.9 11.7 1,538 0.9 139 394 197
Shariin Gol 0.6 17.2 698 0.9 63 179 90
Aduunchuluun 1.4 12.3 2,276 0.9 205 584 292
Tavantolgois 0.69 21.3 648 0.9 59 166 83
*S to SO2 convert factor: 0.9 for pulverized coal boilers and 0.8 for CFB boilers.
113. The projected emission rates for different type of boilers after installing ESP as PM control devices are shown in Table 5.8.
Table 5.8: Projection of PM Emissions after ESP Control
Mitigation of Trans-Boundary Air Pollution from Coal-Fired Power Plants in Northeast Asia (TA No. 6371-REG) Final Report
41
VI. MITIGATION PLANS AND CO-BENEFITS APPROACH
114. Several important pollutants, including CO, NOx, SOx, and hydrocarbons, are produced by fossil fuel combustion and can cause serious pollution if emitted directly into the atmosphere. Many countries have developed and implemented mitigation plans and taken effective measures to reduce the pollutant emissions from coal combustion. These mitigation plans for SO2 and CO2 are summarized in this section of the report.
A. Mitigation Plan for SO2 and CO2 in the PRC
1. Mitigation Plan and Results during the Eleventh FYP Period17
115. The economy of the PRC has experienced sustained growth in recent decades and continued growth is anticipated in coming years. Energy consumption of the PRC has robustly increased with an average annual increase rate of 9.9% from 2001 to 2010. The PRC has become the world’s second largest energy consumer after the U.S. Growing energy demands from the expanding economies have been met predominantly by fossil fuels, which have accounted for over 90% of the total energy consumption during the last decade and produced the majority of the air pollutants from stationary sources.
116. The Government of the PRC has made great efforts to protect the environment, improve energy efficiency and reduce CO2 emissions. The national Eleventh FYP for Energy Development provides the guidance for efficient exploitation and use of energy. It targets that energy intensity will be reduced from 122 tons of standard coal equivalent (tce) per million CNY in 2005 to 98 tce per million CNY in 2010, with a 20% reduction and an average annual reduction rate of 4.4%. At the same time, SO2 emissions reduction is estimated at 8.4 million tons and CO2 emissions reduction at 360 million tons during the Eleventh FYP period.
117. Regarding the power sector, one of the major pollutant sources and coal consumers, the targets of energy efficiency and pollutant emission reduction are also prepared in the Eleventh FYP for Energy Development. The coal equivalent consumption per kWh power is targeted to be reduced from 370 g/kWh in 2005 to 355 g/kWh in 2010, and 35 million tce each year will be conserved. In addition, the PM emissions from coal-fired power plants will be no more than 1.2 g/kWh, and SO2 emission will be no more than 2.7 g/kWh.
118. To meet these targets, the government has adopted a series of incentives including energy-efficiency funding and financial incentives and has actively pursued industrial restructuring, technological upgrading, improved demand-side management, and decommission of inefficient facilities. More importantly, beginning in early 2007, the Government of the PRC adopted unprecedented actions to phase out inefficient power generating units, and decided to phase out 50 GW of power generation capacity in small thermal power plants before 2010. By the end of 2010, small thermal power plants with a total generating capacity of 77 GW were decommissioned. This has resulted in significant reduction in coal consumption, GHGs, and other pollutant emissions, as well as an
17 Source: CEC
Mitigation of Trans-Boundary Air Pollution from Coal-Fired Power Plants in Northeast Asia (TA No. 6371-REG) Final Report
42
impressive improvement in energy efficiency. The following is a summary of GHGs and SO2 emissions reduction during the Eleventh FYP in the PRC.
2. Coal Consumption for Power Supply
119. In 2010, the standard coal consumption for power supply by thermal power units of 6000 KW and above throughout the country was 333 gram/KWh, which dropped 7 gram/KWh over last year, and was lower than that of the U.S. (356 gram/KWh) and Australia (360 gram/KWh). During the Eleventh FYP period, the average coal consumption for power supply by thermal power units declined by 37 gram/KWh accumulatively, equivalent to accumulative standard coal savings of approximately 0.32 billion tons. The corresponding CO2 emission reduction was about 0.9 billion tons.
120. In 2010, the grid line loss rate throughout the country reached 6.53%, declining by 0.19% over the previous year, and 0.47% lower than the target value of 7% identified during the Eleventh FYP, ranking at the national advanced level of the same power supply load density conditions. During the Eleventh FYP period, the line loss rate had a cumulative 0.68% decline, equivalent to a saving of 16.4 million tons of standard coal. The equivalent emission reduction of CO2 was 4.5 million tons.
3. Emission Reduction
121. During the Eleventh FYP period, great efforts were made for SO2 emission reduction in the electric power supply industry, involving continuous efforts in retrofitting the desulphurization devices of the operating thermal power units and ensuring that all newly-built coal-fired units are installed with FGD devices to maximize the emission reduction effects. With effective technical and management measures adopted, SO2 emissions of the electric power industry continued to decline. By the end of 2010, the capacity of operating power generation units with FGD throughout the country exceeded 560 GW, accounting for 86% of the total capacity of coal power units of the nation, 36% higher than that of the U.S. in 2009. The annual FGD capacity has reached 12.9 million tons.
122. The SO2 emissions generated by electric power supply throughout the country were 9.26 million tons in 2010, declining by 2.3% than previous year and about 29% than 2005. From 2005 to 2010, the SO2 emission generated by the power supply industry among the total emission of the country dropped from 51.0% to 42.4%, declining by 8.6%. The thermal power generated SO2 emissions index dropped from 6.4 gram/KWh in 2006 to 2.7 gram/KWh in 2010, which achieved the Eleventh FYP’s target and exceeded the 2009 U.S. level of 3.4 gram/KWh. As compared to 2005, the electric power supply generated SO2 emission in 2010 declined by 3.74 million tons while the national declining level was 3.64 million tons from other sectors.
123. In 2010, the total NOx emission generated by electric power supply was approximately 9 million tons in the country, which increased by 1.6 million tons (21%) compared to that of 2005, lower than the growth rate of thermal power generating capacity, with the increase speed slowing down in recent years. The NOx emission index for thermal power plants dropped from 3.62 g/kWh in 2005 to 2.64 g/kWh in 2010, a reduction of 27%.
Mitigation of Trans-Boundary Air Pollution from Coal-Fired Power Plants in Northeast Asia (TA No. 6371-REG) Final Report
43
The main reason for decline of NOx emission is that all newly-built coal-fired power generation units were equipped with low NOx burners, some of the existing units were also retrofitted with low NOx burners, and part of small fire power generation units with higher NOx emissions were decommissioned.
124. The approval of EIA reports for newly-built thermal power construction projects basically requires synchronous construction of fuel gas denitration devices. The capacity of power generation units with fuel gas denitration devices in operation throughout the country has reached about 80 GW, accounting for 12% of the total capacity of all coal-fired power generation units. The capacity of denitration projects under construction and in planning (inclusive of the planned power plant projects) has exceeded 100 GW. The power generation units with fuel gas denitration device in operation are dominated by newly-built units, and over 95% adopt the SCR technology.
4. Mitigation Plan and Targets during the Twelfth FYP Period18
125. In November 2009, the PRC announced to reduce carbon intensity per unit of GDP in 2020 by 40%-45% from the 2005 level by developing renewable energy, promoting nuclear power plants, increase proportion of non-fossil fuel in the primary energy to 15% by 2020, and expanding 40 million ha of forest coverage and 1.3 billion m3 forest growing volume by 2020.
126. The Outline Twelfth FYP has been issued and the specific plans by region and industry during the 12th FYP period are under preparation or published gradually. The Government of the PRC issued the Comprehensive Activity Program for Energy Efficiency Improvement and the Program for Emission Reduction. These programs include energy efficiency improvement and emission reduction plan and specific activities. The energy efficiency will be improved. By 2015, the standard coal consumption per 10,000 CNY GDP will be reduced to 0.869 ton, with a 16% reduction compared to 2010; the total energy savings will reach 670 million tce during the Twelfth FYP. Emissions control will be facilitated. By 2015, total SO2 emissions will be controlled to 20.86 million tons, with an 8% decrease compared to that in 2010, and total NOx emissions will be controlled to 20.46 million tons, with a 10% decrease compared to that in 2010. It is requested that DeNOx devices be installed by coal-fired power plants to control NOx emissions.
127. In line with the development program plan for electric power industry and by comprehensive analysis of the actual effect of the technology development progress, the target of energy savings and emission reductions are basically estimated as follows:
128. Coal consumption. It is expected that by 2015 the average coal consumption for power supply will reach 325 gram/KWh with 8 gram lower than that in 2010, and that the average annual standard coal savings of 43.04 million tons will be met.
129. Pollutant emissions It is expected that by 2015 the overall annual SO2 emission of around 8 million tons will be controlled, with the unit thermal power SO2 emission reduction up to 1.8 gram/KWh; and that the electric power supply generated NOx emission of around 18 Source: China Electricity Council.
Mitigation of Trans-Boundary Air Pollution from Coal-Fired Power Plants in Northeast Asia (TA No. 6371-REG) Final Report
44
7.5 million tons will be controlled, with the unit thermal power NOx emission reduction up to 1.7 gram/KWh.
130. To meet the above targets, the government will initiate a series of incentives including specific national policies, industrial sector restructuring, technological upgrading, demand-side management improvement, and decommissioning of inefficient facilities.
5. National Policies
131. The Environmental Protection Department and other departments issued the Guiding Opinions on Promoting the Work of Joint Prevention and Control of Atmospheric Pollution and Improving Regional Air Quality in May 2010. The Notice required that emissions from coal-fired power plants should be strictly controlled, the construction of coal-fired projects should be stringently limited in the important regions, and the total quantity control of regional coal consumption should be carried out. In addition, it proposed to promote construction of low-sulfur and low ash coal blending projects, and raise the proportion of coal washing and selection. Especially, the enterprises not equipped with desulphurization facilities in the focus areas were prohibited to directly use the coal containing more than 0.5% of sulfur. It required that the zones where combustion of high-polluting fuel is prohibited should be stringently monitored and managed, and the scope of prohibited zones will be gradually expanded to limit inefficient and polluted combustion of coal.
6. Increase Non-fossil Fuel Shares in Primary Energy
132. China has taken many efforts in improving the mix of primary energy supply, and actively promoted non-fossil fuel share in it. In 2009, fossil fuel based power plants contributed to 74.5% of the total installed power generation capacity, and produced 81.8% of the total power generation. In contrast, non-fossil based power plants have 25.5% share in the total installed power generation capacity and 18.2% share in the total power generation.
133. In 2009, the Energy Bureau of National Development and Reform Commission declared that the share of non-fossil fuel in the total primary energy will increase to 15% by 2020, including 4% from nuclear energy, 9% from hydro energy, and 2% from wind, solar, tidal, and other forms of energy. Hydro energy will play a vital role in reducing GHGs and pollutant emissions. The installed hydro power generation capacity will increase from 196 GW in 2009 to 380 GW in 2020.
134. By the end of the Twelfth FYP period, the new non-fossil fuel power generation capacity will reach 220 GW, which includes 100 GW of hydropower, 33 GW of nuclear power, and 75 GW from wind power and solar energy. The new power generation capacity by non-fossil fuel in 2015 will be about 6.9 million KWh, saving 195 million tons of standard coal and reducing approximately 540 million tons of CO2, 3.3 million tons of SO2, and 0.9 million tons of NOx compared to 2010.
Mitigation of Trans-Boundary Air Pollution from Coal-Fired Power Plants in Northeast Asia (TA No. 6371-REG) Final Report
45
7. Replacing Small Inefficient Thermal Power Plants and Upgrading Technologies
135. The energy-efficient power generating units with a high capacity represented by 600-1,000 MW SC power generation units will be developed and installed as the mainstream. By 2015, the units with a capacity of 600 MW and over will reach 50% or so. In addition, technology upgrading will be conducted for the existing power generation units with a capacity of 30 GW to improve the energy efficiency and mitigate emissions.
136. In addition, small and inefficient thermal power plants will be replaced by large scale efficient thermal power plants. As of the end of 2010, the power generation units with a capacity of 200 MW and below still maintained a total capacity of about 180 GW. During the Twelfth FYP period, the power industry will be requested to strictly implement the national energy policies, decommission small inefficient thermal power units in a well-planned manner, strengthen the operational management, and optimize the control process.
8. IGCC
137. IGCC is an important foundation for realizing near-zero emissions of pollutants and CO2 during the coal-fired power generation process. It is one of the China's key technological research and development areas. China Huaneng Group launched the “Green Gen (Green Coal)” development project in 2004, and set up a green coal-fired power company jointly with seven other companies engaged in power generation, coal, and investment to promote the project. The project was divided into three phases. The first phase, during the Eleventh FYP period, will build a 12 MW gas combined cycle power generation demonstration unit in Shantou city power plant. The second stage, during the Twelfth FYP period, will build a 30 ~40 MW coal gasification combined cycle power generation system demonstration project. Finally in 2020, a coal-based green energy system will be formed adapted to China’s national conditions. It will be dominated by gas-based hydrogen production, hydrogen turbine and combined cycle power generation and fuel cell based power generation, and also conduct CO2 separation and processing.
9. Combined Heat and Power
138. CHP as a measure to save energy has been widely accepted. It offers improved environmental quality, reduced energy consumption, and improved grid reliability. It has been recognized that CHP is an efficient, clean, and economical solution to heating and electricity supply for urban areas, compared to the combination of condensing power generation and HOB house (the combination). Many countries have issued special incentive policies to promote the use of high-efficiency CHP due to the potential benefits including saving primary energy and reducing emissions, in particular GHGs. In addition, efficient use of energy by CHP can also contribute positively to the security of energy supply. Therefore, China is actively taking measures to ensure that the potential is better exploited within the framework of the internal energy market.
139. In 2009, CHP provided about 30% of heat energy for urban space heating, and about 80% of urban industrial steam. In particular, small-sized CHP units are the main central
Mitigation of Trans-Boundary Air Pollution from Coal-Fired Power Plants in Northeast Asia (TA No. 6371-REG) Final Report
46
heating sources for medium and small cities, economic development zones and industrial parks. To strengthen environmental protection, many small-sized, inefficient, and polluted heating boilers used in north China will be decommissioned. Instead, CHP will become the major heat source for heating.
10. Carbon Capture and Storage Development
140. China has actively conducted research and demonstration on carbon capture and storage (CCS) technology, and participated in international cooperation since 2005. The governments, enterprises and research institutions in the CCS field have made many useful attempts.
141. In terms of policy support, CCS as a cutting-edge technology has been included in the national long-term technology development plan. As one of the key technologies of controlling GHG emissions and mitigating climate change, CCS technology was included in the special action of the four main areas of activity in the “Chinese Scientific and Technological Actions on Climate Change” established in 2007. During the Eleventh FYP period, the national “863” program also provided great support to the development of CCS technology. The National Development and Reform Commission published a response to national climate change program in June 2007, and it emphasized the focus on developing CCS technologies, and strengthening the international climate change technology research, development, application and transfer.
142. The National Mid- and Long-term Scientific and Technological Development Plan (2006-2020) listed CCS technology as a cutting-edge technology. In order to develop efficient, clean and near-zero emissions of CO2, fossil energy development and utilization were the key research areas for advanced energy technologies. In addition, the China National Climate Change Program has identified China's specific objectives, basic principles, key areas of polices and measures against climate change, and included developing CCS as an important area to reduce GHG emissions.
143. The CO2 capture test and demonstration unit of Beijing Huaneng Thermal Power Co., Ltd. was the first CO2 capture demonstration project used in coal-fired power plants. The project was completed in July 2008, and the design flue gas treatment capacity was 2372 Nm3/h, capturing CO2 20.5 t/h. After construction, commissioning, and trial production, the device ran smoothly work in the range of 60~120% of the rated capacity. The continuous use hour was 6,000 hours per year, and the captured and separated CO2 concentration was more than 95%.
144. In addition, the 100,000 ton CO2 capture device of Shanghai Shidongkou Second Power Plant under China Huangneng Group was put into operation in 2009. The 10,000 ton CO2 capture device of Chongqing Hechuan Shuanggui Power Generation Co. Ltd. was put into operation in January 2010. Besides, several CCS projects are under construction or under preparation.
Mitigation of Trans-Boundary Air Pollution from Coal-Fired Power Plants in Northeast Asia (TA No. 6371-REG) Final Report
47
11. Optimizing Grid Operation
145. Grid operation can be improved through the following measures: i) good coordination and arrangement for power generation and transmission; ii) improvement of the main network performance; and iii) optimization of powerless configuration. It is expected that the grid transmission line loss rate will reach 6.45% by 2015, declining by 0.1% than that in 2010. By 2015, the system is expected to save 1.87 million tons of standard coal due to the reduction of line loss.
12. More Stringent Air Pollution Emissions Standards
146. The amended version of Air Pollutant Emission Standards for Thermal Power Plants was issued in 2011. The new emission limit for SO2 is much stricter. It is understood that 100% of the coal-fired power plants must be equipped with FGD to meet the requirement of the standard, and about 80% of the coal-fired units equipped with FGD also need to be retrofitted for upgrading FGD to meet the new emissions requirement. There is still a certain potential for emissions reduction in thermal power plant FGD projects.
147. To meet the limitation level as specified in the new standards, the operation and maintenance (O&M) of the existing power generation units with FGD must be improved. A series of measures shall be taken including mixing of coals with different qualities, improving the reliability of the FGD device, improving the knowledge and capacity of operating staff, and strengthening the management and emissions reduction capacity. What is more, the most effective measure is to adopt a market approach by which the construction and operation of FGD devices is transferred to a third-party through concession for improvement of desulphurization management and emissions reduction.
148. Taking into account new coal units constructed during the Twelfth FYP period, it is expected that, by the end of 2015, the installed capacity of desulphurization will reach 0.93 billion watts, the annual FGD capacity will reach 21 million tons, the annual SO2 emission of around 8 million tons will be controlled, and the specific SO2 emission will be reduced to 1.8 gram/KWh.
149. According to the new standards, all coal-fired power plants must be equipped with denitration devices to comply with the emissions standard. Therefore, during the Twelfth FYP period, a lot of thermal power plants will be rehabilitated for denitration.
150. Taking into account new coal units constructed during the Twelfth FYP period, it is expected that NOx emission will be around 7.5 million tons, with the NOx emission declining to 1.7 gram/KWh by the end of 2015. The installed capacity of desulphurization facilities will reach 560 GW, and the annual capacity of NOx reduction will reach 3.7 million tons.
13. Clean Development Mechanism Projects in the Power Sector
151. The Clean Development Mechanism (CDM) projects in the power industry have been very active and they include: (i) power plants alternating: replacing inefficient and polluting small units with the cleaner, more efficient large units; (ii) fuels alternating: use of cleaner
Mitigation of Trans-Boundary Air Pollution from Coal-Fired Power Plants in Northeast Asia (TA No. 6371-REG) Final Report
48
fuels such as natural gas, biomass, oil and other fuels to replace coal; (iii) clean coal technology.
152. According to the information of the China CDM network, since 18 June 2009, the Chinese Government officially accepted 2,597 applications for CDM projects, including 142 CDM projects of the power industry. With the incentives of CDM, many low-carbon and clean projects will be proposed and implemented.
B. Mitigation Plan for SO2 and CO2 in Mongolia
1. Introduction
153. The Mongolian economy is among the most energy-intensive in the world, as shown in Figure 6.1. The ambient air monitoring data suggests that UB is one of the most polluted cities in the world, especially during winter, when all CHP plants, hundreds of HOBs, and tens of thousands of home-heating stoves operate at full capacity. The energy sector is considered the most significant source of CO2 emissions in Mongolia, contributing to 80% of the CO2 emissions. In 2006, the energy sector and transportation sector accounted for 47% and 41%, respectively, of the total NOx emissions from fuel combustion activities in Mongolia.
Figure 6.1: Energy Intensity by Sector (koe/USD)
koe = kilogram or 1,000 tons of oil equivalent
Source: Energy Efficiency Indicators on www.enerdata.fr
154. Compared to developed countries such as the U.S. and Japan, the current requirements of SO2 and NOx emission standards are too loose. What is more, coal-fired power plants do not fully comply with these emission standards. Even though the law has relevant provisions, compliance with the law has not been achieved as the law enforcement is not adequate. In addition, CO2 is not regulated at present and there is no standard for CO2 emissions.
Mitigation of Trans-Boundary Air Pollution from Coal-Fired Power Plants in Northeast Asia (TA No. 6371-REG) Final Report
49
155. Despite that Mongolia is one of the top 10 most energy-intensive and carbon-intensive countries in the world,19 it has not developed comprehensive mitigation plans for SO2 and CO2 up to now. The pollutant emissions from the coal-fired power plants in Mongolia should be controlled in order to mitigate air pollution in both Mongolia and Northeast Asia, and thus it is very important to develop a mitigation plan for Mongolia’s coal-fired power plants.
156. In order for Mongolia to become more economically competitive and more environmentally friendly, energy conservation and energy efficiency must become a higher priority. Energy efficiency improvement is a basic and significant way of addressing both energy security and environment concerns.
157. In combination with the newly-developed emission standards, the emission levels and monitoring requirements will be specified for the existing power plants and newly-constructed power plants in the National Strategic Plan for application of the “co-benefit” approach on air pollution control and GHG mitigation. A proposed national strategic plan to mitigate the GHG and SO2 is presented in Appendix 6 and summarized in the following sections. The government air pollution mitigation activities should be monitored and assessed for improvement and adjustment.
2. Regulatory Framework and Compliance
158. In order to assume the role of promoter and facilitator, the government should define the legislative and administrative frameworks. The focus should be placed on development of new regulations for energy efficiency standards and natural resource management practices and improved enforcement of existing regulations.
159. Existing laws, regulations and standards. The laws, regulations, and policies that have been promulgated in Mongolia to mitigate air pollution are summarized as follows:
Law on Air, 1995
Air Quality Standard, Mongolian National Standard MNS 4585:1995, 2007
Law on Environmental Protection, 1995
Exhaust Gases Emitted from Vehicles: Diesel-Gasoline vehicles
Maximum Acceptable Levels and Measuring Methods of Exhaust Gases for TPP, 2008
Government Policy on Ecology, 1997
21st Century Sustainable Development Program of Mongolia, 1998
National Air Protection Program, 1999
National Integrated Policy Based on Millennium Development Goals of Mongolia, 2008
Governmental Action Program, 2008-2012 (Industrialization) 19 Developing Energy Consevation Law and Action Plan for Mongolia, ADB TA final report (2012).
Mitigation of Trans-Boundary Air Pollution from Coal-Fired Power Plants in Northeast Asia (TA No. 6371-REG) Final Report
50
Sustainable Energy Sector Strategy, 2003-2010 (Legislations)
Law on Energy, 2001
Parliamentary Resolution #46 on Measures to Reduce Urban Air Pollution, 2007
Governmental Resolution #218 on Measures to Reduce Urban Air Pollution, 2007
160. The main policy guidelines and programs in the energy sector related to GHG mitigation policies include:
Renewable Energy Law, 2007
Coal Program
Mongolia Integrated Power System
Mongolia Sustainable Energy Sector Program
Development Strategic Plan (2002-2010)
Mongolian National Renewable Energy Program (June 2005)
Liquefied Petroleum Gas Program
161. The Mongolian Law on Air was issued on 31 March 1995, and several amendments have been made since then. In addition, emission standards for coal-fired power plants (MNS5919), namely maximum acceptable level and measuring method of air pollutants (CO, SO2, NOx, PM) in the exhaust gases from steam and HOBs of thermal power plants and thermal stations, were developed and issued in 2008 in Mongolia. The detailed existing national policies and plans related to SO2 and CO2 for Mongolia are summarized in Appendix 7.
162. Proposed by the Mongolian President and discussed in the Parliament, the Law on Air Pollution Reduction in Capital City was passed on 11 February 2011. This law includes fines and penalties for individuals and businesses who violate the limits and contains tax incentives applicable to individuals and businesses for reducing air pollution. The following principles are to be followed to reduce air pollution in the capital city:
To restrict the use of raw coal for household heating purposes and promote the use of electricity, plutonian heat, coke coal, and gas fuel;
To impose penalties liabilities for violation to those individuals or economic entities who disobey the air legislation; and
To strengthen the integrated efforts by the state, economic entities, or individuals to implement the air pollution reduction measures.
163. Publishing the Energy Conservation Law. Publishing the energy conservation law and implementing the energy efficiency measures are actions included in the agenda of the Ministry of Mineral Resources and Energy (MMRE). It has clearly stated the importance of actions on energy efficiency to address energy security, climate change, and economic challenges. The Government of Mongolia developed a draft energy conservation law in 2011 under the assistance of ADB. It needs to obtain approval from the Parliament before formal publication.
Mitigation of Trans-Boundary Air Pollution from Coal-Fired Power Plants in Northeast Asia (TA No. 6371-REG) Final Report
51
164. Adopting New Air Emission Standards for Power Plants. New air emission standards for coal-fired power plants are proposed under this TA (see Section V of the main report). The current situation of Mongolia’s power sector is carefully considered and emission standards are proposed for both existing and new coal-fired power plants. Consultations on the new standards have been conducted, and the new standards should be discussed and adopted by relevant authorities as soon as possible so that emissions will be controlled to minimum levels.
165. Improving the Environmental Permitting System. Air pollution and emission permitting system can be an effective tool. Emission limitations and pollution control requirements can be specified in the permit for each major stationary source. The permit should also specify emission monitoring and reporting requirements. Governmental agencies should inspect these facilities to make sure the emission standards and permit conditions are complied with. Enforcement actions should be taken for facilities that violate the standards and permit conditions.
166. Strengthening Environmental Compliance. In addition to development of new environmental laws, regulations, and emission standards, it is more important to enforce the implementation of these laws and regulations and review their compliance with these requirements. Since most power plants do not have continuous emission monitoring system and the enforcement authority has limited manpower and equipment, regular measurements of emissions from power plants are not conducted. Inspection and enforcement must be enhanced with the assistance of continuous emission monitor system.
167. Develop an Energy Efficiency and Conservation Action Plan. An action plan to improve energy efficiency is being drafted by the Government of Mongolia. The action plan can help guide and facilitate development and implementation of policies on energy efficiency improvement through: i) placing policies related to energy conservation and efficiency enhancement within the broader policy context; ii) allocating responsibility for implementation, monitoring, and evaluation; iii) prioritizing resource allocation across the energy efficiency portfolio; and iv) capturing synergies between policies and avoiding duplication. The action plan will be developed aiming at achieving increase in energy efficiency and reduction in energy intensity by 2020. It will include measures to improve the energy performance of products and buildings; to improve the yield of energy production and distribution; to reduce the impact of transport on energy consumption; to facilitate financing and investments in the sector; to encourage and consolidate rational energy consumption behavior; and to step up international actions on energy efficiency.
3. Institutional Improvement and Financial Incentives
168. Establish Institutional Framework and Structure. Publishing the energy conservation laws is the first step to improve energy efficiency and implement energy efficiency measures. However, now there is still no agency in the country officially designated to develop and implement the national and energy efficiency policies and programs for key sectors. Thus, it is essential to establish a solid institutional framework with clear
Mitigation of Trans-Boundary Air Pollution from Coal-Fired Power Plants in Northeast Asia (TA No. 6371-REG) Final Report
52
responsibility description for well coordinated efforts toward improvement of energy efficiency in Mongolia.
169. Inter-Agency coordination. Air pollution and energy problems are becoming increasingly complex and interrelated, and will require extensive coordination for comprehensive implementation of GHG mitigation policies. Different ministries and some other organizations are involved in a number of activities, but very often, the activities between different stakeholders are not coordinated and no information is available for what has been already initiated or implemented in certain areas. It is important to clearly coordinate the ministries and responsible organizations to formulate the GHG mitigation policies and implement the GHG mitigation projects.
170. Financial support. Many energy efficiency measures are fully cost-effective with very short payback periods; however, many such measures are not undertaken due to financial barriers. The Ministry of Finance and MMRE should work together in establishing incentive programs to promote energy efficiency. These incentive programs could include subsidies for research and development of new technologies; cost-recovery energy pricing and tariff; custom subsidies, tax credits and low interest loans for energy efficiency improvement products and projects; high taxes for using inefficient technologies; energy conservation funds; and private investment involvement in energy efficiency projects.
171. Prioritize funding. The implementation of mitigation measures will require significant investment. Since Mongolia is constrained by many economic problems, it is essential that funds be more clearly prioritized at the national planning level, and those resources allocated according to economic and technical criteria.
4. Actions on the Energy Supply Side
172. The strategic actions on the energy supply side to mitigate GHGs and SO2 emissions can be classified into five categories: i) replacing old power plants; ii) upgrading the UB district heating system; iii) expanding the use of renewable energy resources; iv) encouraging the implementation of energy efficiency improvement projects; and v) other actions such as coal washing and processing.
173. Replacing Old Power Plants. The overwhelming majority of power and heat generated comes from the three CHP plants in UB, which use extraction condensing turbines. Part of the steam is extracted from the turbines to meet heating requirements (steam and hot water) during the heating season of eight months, and the remaining steam flow is used to generate electricity and is condensed with cooling water. Heat supplies account for 40% of gross energy consumption.
174. The coal-fired CHP plants in Mongolia have low efficiencies due to outdated technologies and inadequate maintenance for many years. These low efficient coal-fired power plants have been identified as the main sources of air pollution and GHG emissions in Mongolia. Air pollutant emissions from coal-fired power plants are not monitored and there is no ambient air monitoring station around the plants. Nationwide, there are several air quality monitoring stations; however, only a limited number of indicators in relation to the polluting
Mitigation of Trans-Boundary Air Pollution from Coal-Fired Power Plants in Northeast Asia (TA No. 6371-REG) Final Report
53
substances in ambient air are recorded. Because there is no air pollution control equipment or monitoring devices installed in existing power plants (except CHP4), the actual emissions from coal-fired power plants are not monitored and recorded. Analytical methods based on coal characteristics have been used to determine the pollutant emissions.
175. As mentioned earlier, coal-fired CHP plants are by far the most significant sources of GHGs and SO2 emissions, so replacing old power plants is a good first step. Building new CHP plants to replace old and inefficient ones is a very important strategic action for Mongolia’s energy security and its environmental protection.
176. The Government of Mongolia is proposing to construct the CHP5 plant at the existing CHP3 site. The proposed capacity of CHP5 is 820 MW of power generation and 1,101 Gcal/hr (1,280 MW) of heat generation to meet the forecasted demands in 2020. CHP5 will have an overall thermal efficiency of about 69%, compared to the thermal efficiencies of 40%, 38.6%, and 21% in the current CHP4, CHP3, and CHP2 facilities, respectively20.
177. Once the new CHP plant operates at full capacity, the emissions from the coal-fired plants will be significantly reduced. The improvement in emissions control is best illustrated by comparing the emissions per kMh power generated, as shown in Figure 6.1.
Source: Consultant estimates.
178. All new power plants, including this CHP5, must be required to control emissions, install emission monitoring systems and comply with new emission standards.
179. Upgrading the UB District Heating System. The UB district heating network is very complex and inefficient, due to old age of the main network and rapid expansion of the branch heating network in recent years to meet the heating and hot water need from new development areas in UB. The electricity consumption is 14 kWh/Gcal, which is much higher than the international level of less than 7 kWh/Gcal. Losses in the heat distribution systems are high, and the mitigation measures, such as minimizing leakage, replacing valves, and
20 2011 Energy Statistics, Energy Regulartory Authority
20.9
6.6 7.7
0.041.7 2
0
5
10
15
20
25
PM SO2 NOx
Emis
sion
Inte
nsity
(g/
kWh)
Pollutant
Figure 6.1: Comparison of Emissions of New and Old CHP Plants
Existing CHP
New CHP
Mitigation of Trans-Boundary Air Pollution from Coal-Fired Power Plants in Northeast Asia (TA No. 6371-REG) Final Report
54
reducing radiation losses, are urgently needed. The district heating system should be optimized in conjunction with the construction of the new CHP plant in UB.
180. Expanding the Utilization of Renewable Energy Resources. Mongolia has a significant amount of renewable energy resources, including solar, wind, and hydropower resources. Currently, however, very little progress is made in the development and utilization of renewable resources. The total renewable power generation only accounts for 0.5% of Mongolia’s total power generation. Renewable energy development has been included in the Government Action Program as important way to provide electricity in remote areas and among nomadic families.
181. Encouraging the Implementation of Energy Efficiency Improvement Projects. It is estimated that the CHP plants in Mongolia consume approximately 16% of the total electricity generated within the CHP plants21 while the international best practices standard is about 10%. This 6% difference is very significant and more effort should be made to improve the efficiency of the equipment in the plants. Encouraging energy efficiency improvement projects, including building new CHP plants and shutingdown old CHP plants, is essential in advancing energy efficiency improvement targets.
182. The loss of transmission system of the Mongolian Central Energy System is relatively high at 11.7% in 2010.22 It is estimated that the annual electricity consumption by substations and distribution losses are over 115 GWh. The reduction of losses in the electricity transmission/distribution system involves redesigning and/or rehabilitating the existing old transmission/distribution lines, installing more energy efficient equipment on poles and in power substations, and replacing old and inefficient pole-mounted transformers.
5. Actions on the Energy Demand Side
183. In addition to the above mitigation activities on the energy supply-side, the mitigation activities on the energy demand-side can contribute to pollution control and emission reduction as summarized below.
184. Reduce energy intensity in industry. The Mongolian economy is among the most energy-intensive in the world. Industry is one of the largest consumers of electricity in Mongolia. There is a huge potential for this sector to reduce carbon intensity through modernizing energy-intensive processes and implementing energy efficiency improvement projects.
185. According to the National Statistic Office (NSO) of Mongolia, the power plant sector consumed about 90% of the national total coal consumption. The electricity consumption by industry and construction, and households represents 44.9% and 17.3% of total electricity consumption, respectively. Power plants internal use and losses in transmission and distribution also count a big portion of total electricity consumption (15.5% and 11.8%). Therefore, it is of significant priority to make great efforts in energy efficiency improvement in this sector. 21 Mongolian Statistical Yearbook 2010. 22 Mongolian Statistical Yearbook 2010.
Mitigation of Trans-Boundary Air Pollution from Coal-Fired Power Plants in Northeast Asia (TA No. 6371-REG) Final Report
55
186. Energy efficiency improvement in space heating. In Mongolia, household sector is number one thermal energy consumer followed by industry and construction sector.23 Almost 65% of the total energy demand of households and 90% of the total energy used in the service sector are for space heating. A study on heat losses found that nearly 40% of heat is lost from houses and buildings. Many countries’ experience indicates that there is a huge potential in building efficiency improvement. However, to reap the full energy efficiency potential in the building sector, minimum energy efficiency performance requirements for new and renovated buildings and for components such as windows must be established.
187. Hot water and heating consumption in residential buildings can be reduced substantially through the introduction of consumption based tariff system and investments, including investment support from the city budget, state budget or other financial sources, on energy saving measures in the housing sector. Such measures include improved building insulation and installation of meters and temperature control valves for each household to measure actual heating and hot water consumptions, so as to encourage households to take appropriate actions to reduce consumptions and cost and contribute to the achievement of energy efficiency improvement. Tariffs for space heating and hotwater need to be set for cost recovery and on a consumption basis. In addition, the social protection of low-income households needs to be improved.
188. Energy efficiency improvement in the transport sector. There is a huge potential to control and reduce GHG emissions in the transport sector. Actions that can be taken include i) rehabilitating old pavement and building more new roads; ii) enforcing vehicle emission limitation; iii) promoting the use of public transportation in cities; iv) optimizing the transportation infrastructure; and v) promoting energy-saving vehicles.
189. Energy efficiency improvement in electrical appliances. Most households use standard incandescent light bulbs while some households use both standard incandescent light bulbs combined with fluorescent light bulbs. Lighting demand of households and service sectors accounted for 380 GWh and it is expected to increase in the future. There is a big opportunity to save energy if inefficient incandescent light bulbs are replaced by energy-efficient compact fluorescent lamps. The energy consumption can be reduced by about 70% while still maintaining the same light level. Similarly, there are energy saving opportunities in other electrical appliances such as refrigerator, TV, etc.
190. Contract Energy Management and Energy Service Companies (ESCOs). In order to develop a comprehensive and integrated approach, which targets the sustainable economic and environmentally-friendly development of the small and medium enterprises in industrial clusters, the concept of ESCO service should be promoted to implement energy efficiency projects. The development of energy conservation service, design evaluation, and inspection and auditing activities on energy efficiency and energy conservation should be encouraged.
23 Mongolia Statistical Yearbook 2010.
Mitigation of Trans-Boundary Air Pollution from Coal-Fired Power Plants in Northeast Asia (TA No. 6371-REG) Final Report
56
191. Public education. Public education and close cooperation and communication of suppliers with users are critical elements in the implementation of the GHG and SO2 mitigation measures in the residential and commercial building sector.
6. Implementation Schedule of Mitigation Plans
192. Since the energy supply sector has the highest GHG and SO2 emissions by far in Mongolia, restructuring and modernizing the energy sector should be one of the top priorities. The implementation of the proposed strategies and action plans for mitigating GHG and SO2 emissions are summarized below:
Pass the Energy Conservation Law in 2012;
Establish new emission standards for coal-fired power plants (2011-2012), which has been completed under this TA;
Develop an energy efficiency and conservation action plan in 2012;
Establish the institutional framework and structure for energy efficiency improvement and emission reduction by 2012;
Update and revise the Mongolia Energy Master Plan with consideration of promoting energy efficiency and emission reduction by 2012;
Develop financial incentive policies and programs to encourage energy efficiency projects by 2012;
Develop sector specific energy reduction targets for energy intensive sectors by 2012;
Develop programs to encourage contract energy management and ESCOs by 2012;
Implement other demand side energy efficacy actions from 2012;
Develop a comprehensive strategy for utilization of renewable energy resources by 2012;
Build CHP5 in UB by 2015 and remove CHP2 and CHP3 by 2015; and
Upgrade the UB district heating system by 2015.
193. To achieve SO2 emission reduction, installation of FGD devices in existing and new coal-fired power plants is the key. The following targets are recommended to systematically install FGD devices in existing coal-fired power plants:
By 2015, decommission CHP2 and CHP3 or install FDG control device on all units in these two CHP plants;
By 2025, retrofit the CHP plants in Erdenet and Darkhan towns with FDG control device equipped;
By 2030, retrofit the Dornod CHP plant with FDG control device equipped; and
By 2035, retrofit the Umnogobi CHP plant and all other coal-fired power plants with FGD control device equipped.
Mitigation of Trans-Boundary Air Pollution from Coal-Fired Power Plants in Northeast Asia (TA No. 6371-REG) Final Report
57
194. Through the implementing strategies and action plans identified above, it is recommended to set the long-term GHG emission target to be reducing GHG emission intensity by 50% by 2050. Specifically, the intermediate targets are as follows:
Reduce the GHG emission intensity by 15% by 2015;
Reduce the GHG emission intensity by 30% by 2020;
Reduce the GHG emission intensity by 40% by 2030; and
Reduce the GHG emission intensity by 50% by 2050.
Mitigation of Trans-Boundary Air Pollution from Coal-Fired Power Plants in Northeast Asia (TA No. 6371-REG) Final Report
58
VII. FGD ASSESSMENT AND DEMONSTRATION PROJECT
A. Assessment of the FGD Technology at Changshu Power Plant
195. The project requires an assessment of the trans-boundary air pollution, based on which a guidance manual on the reliability management and post project assessment technology for the FGD equipment will be developed. Therefore, the China Electricity Council (CEC), one of the implementation agencies for the project, proposed to assess air pollutant emissions control from two 300 MW power generation units in Changshu Power Plant (CPP) in Jiangsu Province of China.
196. The scope of the assessment includes four tasks as follows: i) technical assessment; ii) equipment assessment; iii) operation assessment; and iv) adjustability assessment.
197. In accordance with the work scope of the assessment, five specialists were selected, including an FGD specialist, power specialist, monitoring and test specialist, environment specialist, and O&M specialist, and work closely on the assessment. They conducted preliminary preparation, on-site assessment, data collection and processing, and prepared reports in accordance with the requirements of ADB. The detailed FGD assessment report is attached in Appendix 8.
1. Overview
198. There are four 300 MW power generation units in CPP, which were put into service in 1990s, with a total the installed capacity of 1,200 MW. However, FGD devices were not installed when they were constructed.
199. FGD devices were added later to the two 300MW units in the plant, and the flue gas emission control has been implemented following the “Emission Standard of Air Pollutants for Thermal Power Plants” (GB13223-2003). The two FGD devices were commissioned in September 2006 and April 2007, respectively. The FGD efficiency is 90% and emission of SO2 is less than 1,539 ton.
2. Desulfurizing Process System
200. The limestone-gypsum wet FGD technology is used, and the system is designed to handle 100% of the flue gas. The engineering principal of “one boiler equipped with one FGD tower” is adopted. The FGD system mainly consists of a limestone receiving and storage system; limestone slurry preparation system; flue gas system; SO2 absorption system; oxidation air system; gas-to-gas heater (GGH); gypsum slurry dewatering system; emergency slurry storage system; water supply and drainage system; compressed air system; electrical system; automatic control system; heating, ventilation, and and air conditioning; communication engineering; and firefighting and fire alarm system.
201. The limestone slurry plant will be designed to fit for all power generation units. The scheme of wet limestone slurry is adopted. The project utilizes limestone as the
Mitigation of Trans-Boundary Air Pollution from Coal-Fired Power Plants in Northeast Asia (TA No. 6371-REG) Final Report
59
desulphurization adsorbent, which is supplied by the nearby limestone mine. Limestone slurry is prepared in the process where limestone bunker with flat-bottom is connected with the wet milling system. Each wet milling system consists of a feeder with weighing meter, horizontal wet ball mill, wet milling slurry circulating pool, wet milling slurry circulating pump and limestone slurry cyclone, etc.
202. The blower is installed at the upstream flue gas from absorption tower of the flue gas system to ensure that a positive pressure is maintained during the FGD device operation, and at the same time, to prevent blower fan from corrosion by low-temperature flue gas.
203. The desulphurization reaction takes place in absorption tower after raw flue gas is cooled to 88°C from 124°C. In absorption tower, flue gas reacts with limestone slurry through full surface contact so as to remove SO2, and the flue gas temperature further drops to 46.8°C. After demisted by the tower top demister, clean desulphurized flue gas will return to GGH again and be heated to over 80°C, and finally released to atmosphere through double baffle of the clean flue gas and chimney.
204. Absorption tower is counter-current type spray absorber. The basement is slurry pond, while the upper is spray washing area where three spray nozzles are laid out. Flue gas flows through the spray zone from bottom up and released from absorption tower’s top after being washed and desulphurized.
205. The main subsystems of the gypsum dehydration system and wastewater treatment system include gypsum excavating pump system, gypsum swirler station (primary dewatering system), vacuum belt filter (secondary dewatering system), and wastewater swirler station.
206. A gypsum cyclone station is prepared for each absorption tower and installed on the top of the gypsum building. Underflow liquid of gypsum cyclone from the primary dewatering system directly flows into vacuum belt dehydrator to be filtered, washed and to obtain the main by-product – gypsum.
207. The overflow from gypsum cyclone station flows into feed tray of wastewater cyclone station and infiltrates into wastewater station by charging pump to conduct cyclone separation again. Underflow liquid enters into filtrate water tank and returns to FGD device for recycling.
208. The total electrical load of the two FGD units is about 8,837 kVA. A dedicated electric controlled building is built in the FGD zone since the FGD device works independently. The power for FGD is supplied by station utility system from 6kV auxiliary switchgear.
209. This project establishes an independent centralized control room with decentralized control system (DCS) adopted to monitor and control these two FGD units and their common systems. The DCS is composed of operator station, engineer station, redundant configured data highway and controller, and etc. The system has five operator stations and one engineer station. The control scope of the DCS includes limestone slurry preparation system, absorption tower system, blower fan system, oxidation blower system, and gypsum swirler system. The control of the FGD system can be done in the FGD control room by means of DCS system. The DCS includes FGD data acquisition system, modulating control system, and sequence control system.
Mitigation of Trans-Boundary Air Pollution from Coal-Fired Power Plants in Northeast Asia (TA No. 6371-REG) Final Report
60
3. Performance of the FGD
210. According to the on-site inspection, the operation output was 240 MW, lower than the rated output of 300 MW, and the amount of treated flue gas was 672,996 m3/h. The output of blower fan was far away from the rated value, allowing for overcoming the increased resistance caused by abnormal working condition. Pressure loss of the inner absorption tower was lower than the designed value, while GGH pressure loss was higher than the designed value. The outlet flue gas temperature exceeded 80°C and met the designed value.
211. It was monitored that the dust concentration of flue gas in FGD inlet exceeded the designed average value. During the acceptance test period, the average concentration of SO2 at FGD device inlet was 1,864 mg/Nm3, which was less than the designed value. According to the on-site inspection, the average concentration of flue gas SO2 at FGD device inlet was 2,831 mg/Nm3, which exceeded the designed average value of 2,132 mg/Nm3. As a result, the emission concentration of SO2 was 110.3 mg/Nm3, which exceeded the designed value of 90 mg/Nm3. FGD efficiency exceeded 95.7% of the contract value.
212. It can be concluded that the system parameters of FGD meet the design requirements, and the FGD efficiencies during the performance test and field observation period are 97.3% and 96.1%, respectively. Power consumption is 3,608.6 kWh/h and 3,533 kWh/h, respectively. Total consumption of process water is 32.12 t/h (performance test value) and limestone consumption is 2.62 t/h and 4.3 t/h, respectively. These indicators meet the requirements to guarantee good performance.
4. Conclusion of the Assessment
(1) The desulfurization efficiency and SO2 emissions of the FGD devices of the CPP meet the requirements for approval on the EIA by the environment protection department. The SO2 emission in the power plant can reach the relevant emission standard.
(2) The FGD process design is reasonable. The system configuration from limestone feeding to gypsum dehydration is complete. Equipment selection complies with the requirement of the design specifications.
(3) Limestone needed is adequately supplied and is of good quality. Water used in the process is from Yangtze River and is sufficient. Comprehensive utilization of all desulphurization gypsum makes the technology selected not only comply with the national principles for FDG technology selection in thermal power plants but also be suitable for the actual situation of the power plant. Thus, it lays a solid foundation for long and stable operation of the FGD device.
(4) The structure of absorption tower with independent intellectual property rights is adopted. The high-tower layout provides a good buffer when an anomalous liquid level occurs and thus facilitates handling of abnormal conditions.
(5) According to the annual utilization hours and planned and actual outage times, the
Mitigation of Trans-Boundary Air Pollution from Coal-Fired Power Plants in Northeast Asia (TA No. 6371-REG) Final Report
61
annual availability of the FGD device is over 95%, indicating that the operation of the FGD system is stable and reliable. The main equipment selection and configuration of the FGD device are reasonable. The design is flexible and adapted to the variation of sulfur content in coal for the time being.
(6) Since the FGD device was put into operation, major equipment including absorption tower lining, glass fiber reinforced plastic pipeline, other pipelines, GGH, grinding mill, slurry circulating pump, and other is in stable and normal operation. The FGD device is seldom out of operation due to equipment failure.
(7) It is recommended to identify the adaptability and limitation of each piece of equipment of the FGD device against the variation of the sulfur content of coal. Effective measures should be taken when necessary so as to ensure or improve the safe operation of the FGD device. It is suggested to actively optimize the operation of FGD device and conduct economic analysis to enhance the operational economy.
B. Demonstration Projects
1. Introduction
213. In accordance with the requirement of the TA report, a demonstration project for new FGD technology will be implemented. Demonstration activities will be prioritized and selected based on (i) potential for technology transfer; (ii) amount of potential impacts on reduction of trans-boundary pollution; (iii) resource availability; and (iv) potential for replication. Considering the current FGD technologies and main concerns in the FGD process, the CEC proposed two projects as the demonstration projects for new FDG technology application, i.e. the Evaluation of the Method of Complex Additive to Enhance Activity of Limestone Slurry in the FGD System, and Optimized Method of Measuring and Controlling pH Value of Solution in the Absorbing Tower of the FGD System.
214. The limestone gypsum wet scrubbing process is the state-of-the-art FGD technology for SO2 emission control, in which the flue gas is treated with limestone slurry in order to efficiently remove SO2 and then for neutralization. The final product is calcium sulphate dihydrate (gypsum). This is the most common FGD process widely applied in the world and has over 30 years of history of development and operation. Its desulphurization efficiency can reach 90%. In China, 92% of coal-fired power plants use this FGD technology. Meanwhile, more attention has been paid to the studies on limestone gypsum wet scrubbing process to improve the desulphurization efficiency and reduce operation cost of the FGD process.
215. Specifically, the method of complex additive to enhance activity of limestone slurry in the limestone gypsum wet scrubbing process and new method of measuring and controlling pH value of solution in the absorbing tower of the limestone gypsum wet scrubbing process of FGD are two of the most important methods to improve the desulphurization efficiency and reduce operation costs of the FGD process. Through the demonstration projects, the following is expected to be accomplished:
Mitigation of Trans-Boundary Air Pollution from Coal-Fired Power Plants in Northeast Asia (TA No. 6371-REG) Final Report
62
The potential for technology transfer will be evaluated and promoted;
Amount of potential impact on reduction of trans-boundary pollution will be estimated;
Resource requirements will be clarified; and
Technology replication will be demonstrated.
216. The demonstration projects will help reduce SO2 emissions, and replication and transfer of technology will be encouraged through training and information dissemination. The assessment report on the demonstration projects is shown in Appendix 9.
2. Technology Introduction
(a) Method of Complex Additive to Enhance Activity of Limestone Slurry
217. In the limestone gypsum wet scrubbing process, additives used for enhancing mass transfer and activity of limestone slurry can improve the desulphurization efficiency, prevent scaling, increase operation reliability of the FGD system, and decrease operation costs to some extent. The method to enhance activity of limestone slurry under the demonstration project is to optimize the mixture and ratios of complex additives comprising of adipic acid and chloride for making limestone slurry. During the limestone gypsum wet scrubbing process, by adding the additives into the absorbent, the limestone slurry will react with gas actively and completely under more favorable conditions, where it catalyzes the reaction and increases the reaction ratio by over 50%. This method can increase the desulphurization efficiency and reduce limestone consumption and operation costs, also allow system operations more flexible.
(b) Optimized Method of Measuring and Controlling pH Value of Solution
in the Absorption Tower
218. The optimized method of measuring and controlling pH value of solution in the absorbing tower during the limestone gypsum wet scrubbing process is essential to ensure a reliable, stable and accurate automatic control of FGD process. Originally, pH value of slurry is measured by pH sensor installed in the slurry pipe connected with absorbing tower of FGD or with circulating pool provided that gypsum slurry is circulated by a slurry pump. Due to existence of lots of gypsum crystals in slurry pipe and slurry pool, pH sensor is subjected to wearing and polluting by the gypsum crystals; as a result, the accuracy of pH sensor could be affected. In order to address this issue and enhance the reliability of pH sensor, more than one sensor and transformer have to be installed, which increases the capital cost and makes system configuration more complicated.
In order to ensure accurate measurement of pH value of slurry, many methods and sampling means have been developed and used in some FDG systems. This demonstration project is intended to introduce and demonstrate a new and reliable method and sampling means for measuring pH value of solution in the absorbing tower of the limestone gypsum wet scrubbing process. Under this method, one upper sampling port at the top of the absorbing tower and one lower sampling port at the bottom of the absorbing tower are designed. These two ports
Mitigation of Trans-Boundary Air Pollution from Coal-Fired Power Plants in Northeast Asia (TA No. 6371-REG) Final Report
63
are connected with each other through connecting pipes, where naturally driven slurry circulation will occur. The pH sensor is installed in the upper connecting pipeline. Compared to the original measurement methods, this method does not need a motor-driven pump to drive slurry circulation, and thus saves electricity. In addition, the pH sensor is installed at the upper part of the pipe, which can protect sensor from wearing by gypsum crystals. It thus provides more accurate measurement of pH value.
Mitigation of Trans-Boundary Air Pollution from Coal-Fired Power Plants in Northeast Asia (TA No. 6371-REG) Final Report
64
VIII. Capacity Building and Knowledge Transfer
219. One of the objectives of the TA is to provide adequate study and consulting services to ensure i) technical capacity and knowledge transfer regarding prevention and management of trans-boundary pollution will be improved, and ii) capacity for management of coal-fired power plant emissions in Mongolia through the development of emission standards will be enhanced.
220. In accordance with the requirement of the terms of reference, a training program was prepared based on the results of training needs assessment. Following the program, six technical workshops in relation to emission standards and FDG technologies were conducted. In addition, two final workshops were also conducted to disseminate the key findings and deliverables under the TA. More than 300 persons attended these workshops. The details about these workshops are described below.
A. Technical Workshops
(1) Training on proposed emission standards for Mongolia
221. A workshop was conducted on 2 November 2010 in Ulaanbaatar Hotel of Ulaanbaatar City, Mongolia. A total of 25 persons attended the workshop, including those from the MNET, MMRE, Energy Authority, three CHP plants in UB, Air Quality Department of UB City, and two universities.
222. The main topics covered in the workshop include:
The proposed emission standards for coal-fired power plants in Mongolia; and
The proposed national action plan on SO2 and CO2 reduction in Mongolia.
(2) Training on emission control in China
223. A workshop on emission control and standards dissemination of the power sector in China was conducted on 18th and 19th of November 2010 in Guobin Hotel of Zhangjiagang City, China. A total of 40 persons attended the workshop, including those from the CEC, China Power Investment Corporation, China Power Group, China Datang Corporation, three research institutes and four power plants.
224. The main training topics included:
Assessment on operation of facilities for environmental protection in coal-fired power plants;
Operation of limestone gypsum wet flue gas desulphurization system in coal-fired power plants; and
Technical regulation of bag house for flue gas of boilers.
(3) Training on complex additive in China
225. To disseminate the function of complex additive, promote and duplicate the application of complex additive to enhance activity of limestone slurry in the limestone
Mitigation of Trans-Boundary Air Pollution from Coal-Fired Power Plants in Northeast Asia (TA No. 6371-REG) Final Report
65
gypsum wet scrubbing process of FGD, two relevant training workshops were conducted. One was held from 12th to 13th of December 2011 in Harbin, Heilongjiang Province with 50 participants from three power generation plants. The other was held from 19th to 20th of December 2011 in Qingdao, Shandong Province with 40 participants from two power generation plants.
226. The training was focused on application and principle of complex additive in the power generation sector. Specifically, the topics included:
Theory of complex additive;
Methodology of practicing complex additive in FGD; and
O&M of FGD with complex additive.
(4) Training on optimized measurement and control of ph value in China
227. In order to demonstrate and duplicate the technology of “improving FDG performance through optimized measurement and control of ph value in absorbing tower” to other power plants to achieve higher efficiency of FGD facilities, two training workshops were conducted. One was held from 13th to 14th of December 2011 in Changchun, Jilin Province with 55 participants from three power generation plants. The other was held from 19th to 20th of December 2012 in Dalian, Liaoning Province with 40 participants from two power generation plants.
228. Detailed training topics included:
Theory of measurement and control of pH value in absorbing tower;
Approaches and process of optimized measurement and control of pH value in absorbing tower; and
O&M of measurement and control of pH value in absorbing tower.
B. Final Workshop in Mongolia
229. The final workshop on the proposed emission standards for coal-fired power plants and action plan in Mongolia was conducted on 6 July 2011 in Puma Imperial Hotel in Ulaanbaatar, Mongolia.
230. The workshop was attended by 25 participants from the MNET, MMRE, Energy Authority, CHP plants, Air Quality Department of UB City, National Center of Standard and Measurement, and universities.
231. The training topics included:
Summary of TA objectives, tasks and key findings;
Summary information of coal-fired power plants in Mongolia, including their energy efficiencies, carbon intensities in Mongolia and other countries, gaps between Mongolia emission standards and international best practices;
The approach and methodology used for establishing new emission standards for coal-fired power plants in Mongolia; the emission standards in some developed and developing countries; the new standards proposed by the
Mitigation of Trans-Boundary Air Pollution from Coal-Fired Power Plants in Northeast Asia (TA No. 6371-REG) Final Report
66
consulting team; and
Background information on air quality in Mongolia, and recommended action plan to mitigate emissions of transboundary air pollutants.
C. Final Workshop in Korea
232. The Final Workshop was organized by the Subregional Office for East and North-East Asia (NEASPEC Secretariat) of United Nations Economic and Social Commission for Asia and the Pacific (UN ESCAP) and supported by ADB on 10-11 November 2011 in Incheon, Republic of Korea. The meeting was attended by more than 25 participants including national experts from China, Japan, Mongolia, the ROK and the Russian Federation, and the UN Economic Commission for Europe.
233. The main training topics included:
Summary of TA objectives, tasks and key findings;
Technical and policy issues for addressing national SO2 emission, increasing efficiency of existing FGD units in China, and establishing new draft national standards for emissions from power plants in Mongolia;
National activities to curb SO2 emissions in China, the progress achieved during the 11th FYP period and the plans during the 12th FYP period, and new tighter national emission standards effective in January 2012; and
Possible strategies for applying co-benefit approach to coal-fired power plants, ADB’s activities in the energy field in the last few years; potential technologies for co-benefit approach including carbon capture and storage and carbon off-set; issues of each technology and recommendations.
Mitigation of Trans-Boundary Air Pollution from Coal-Fired Power Plants in Northeast Asia (TA No. 6371-REG) Final Report
67
IX. CONCLUSIONS AND RECOMMENDATIONS
234. Both China and Mongolia have made significant efforts in applying co-benefit approach to improve energy intensity and reduce SO2 and GHG emissions from their coal-fired power plants.
235. China has reached an overall energy intensity reduction of 20% from 2005 to 2010 and has also set a new target of 40-45% of energy intensity reduction by 2020 from the 2005 level.
236. In China, the emission standards for coal-fired power plants that became effective in 2003 has just been replaced by the new version released in end 2011. The new standards are much more strigent than the previous ones and they became effective on 1 January 2012.
237. In Mongolia, over 90% of the electricity is generated from coal-fired power plants, which are inefficient due to old age and lack of adequate maintenance. The Government of Mongolia is proposing to build a state-of-the-art CHP plant in UB. Once this new plant is operational, air pollutants emissions including SO2 will be significantly lower than those of existing CHP plants.
238. The Government of Mongolia is preparing a new energy conservation law. In the meantime, an energy efficiency and conservation action plan is being prepared. Once they are implemented, the energy consumption per unit GDP is expected to be much lower than the current level.
239. New air emission standards were proposed under this TA for Mongolia’s coal-fired power plants with reference to international best practices. The recommended new emission standards were adopted and were formally published in December 2011 entitled “Maximum Acceptable Level and Measuring Method of Air Pollutants in the Exhaust Gases from Steam and Hot Water Boilers of Thermal Power Plants and Thermal Stations” (MNS6298:2011). Coal-fired power plants will need to install emission control equipment to comply with the new standards.
Mitigation of Trans-Boundary Air Pollution from Coal-Fired Power Plants in Northeast Asia (TA No. 6371-REG) Final Report
68
APPENDIX 1: INTERNATIONAL COAL-FIRED POWER INDUSTRY STATUS AND
TRENDS
A. Coal-Fired Power Technologies and Trends
1. Coal is the world’s main power source. About half of the electricity in the U.S. is obtained from coal-fired power generation. China, India, Germany, Poland, South Africa, and Australia have an abundance of coal reserves. Coal-fired power generation represents more than half of the total electricity production, especially in China and India, where the proportion of coal-fired units reached 74.5% in the power sector.
2. At present, international coal-fired power technology is moving toward clean coal power generation, which will improve the efficiency of coal-fired power generation and reduce emissions. SC and USC power generation technology (USC), CFB boiler power generation technology, IGCC power generation technology, and pressurized circulating fluidized bed combustion combined cycle power generation technology (PFBC-CC) are the focus on the development of clean coal power.
1. The United States
3. According to “Technology Foresight 2005,” the U.S. first proposed a national clean coal program in 1986. The total investment of the program was more than $6 billion USD, and it has made significant progress. Recently, President Obama proposed that “the rapid development and deployment of the commercialization of clean coal technology, especially in the technology of CCS, will ensure the leadership of the United States in worldwide competition.” Ninety percent of U.S. coal consumption is for power generation, and clean coal power generation technology is the main target of the clean coal technology development.
4. IGCC technology in the United States can be summarized as follows: In 1984, the United States Cool Water Power Plant put into operation the first full run of IGCC industrial test equipment. Its machine power was 100 MWe. The power plant demonstrated the feasibility of IGCC power generation technology, and it is known as the world's cleanest coal-fired power station. There are four IGCC projects in the CCTP, which is directed by the U.S. Department of Energy. The investment of the four projects was $2.17 billion USD, accounting for 31% of the total investment. The Wabash River IGCC demonstration unit was put into commercial operation in September 1996. Its net power is 262 MWe and the design net efficiency is 40% (based on lower heating value or LHV). Tampa IGCC power station unit is net power is 250 MWe; its design net efficiency is 41% (LHV). Pinon Pine IGCC demonstration power plant unit is net output is 99.7 MWe; its unit net efficiency is 42% (LHV). The third-generation IGCC power plant funded by the Clean Coal Project of the U.S. Department of Energy is expected to be put into commercial operation in 2010. It uses high temperature purification and a three-pressure reheat heat recovery boiler, and has a turbine inlet temperature higher than 1,427ºC. Its waste heat boiler can directly generate high-pressure superheated steam and its efficiency is up to 52%.
Mitigation of Trans-Boundary Air Pollution from Coal-Fired Power Plants in Northeast Asia (TA No. 6371-REG) Final Report
69
5. The U.S. was the world’s first country to develop USC thermal power units, and began the exploration and research of SC power generation technology in the early half of the past century. The number of SC units of the U.S. ranks second in the world. With nine sets of the world's largest SC unit and one unit capacity is 1300 MW. Presently, the U.S. is proceeding with the new generation (760ºC) parameters materials research for USC boiler to develop higher temperature and pressure units.
2. Japan
6. Japan has set up a Clean Coal Technology Center in the NEDO in 1993 and formulated the so-called “Sunshine Plan.” Japan's clean coal technology development is divided into two parts: One is to increase thermal efficiency and reduce emissions such as fluidized bed combustion, coal gasification combined cycle power generation, and coal gasification fuel cell combined power generation technology. The second is to conduct the purification before and after the coal combustion, including fuel pre-treatment, the combustion process and combustion flue gas desulfurization, and de-nitrification for the effective utilization of coal.
7. Japan began to develop SC pressure units from the mid-1960s. Despite its late start, it absorbed the latest technology from the United States and Europe and developed rapidly. Now there are more than 60 SC thermal power units running in Japan. Japan also developed a USC study program and successfully developed USC units based on the maturing of the 24.1MPa/538ºC/566ºC SC unit. Japan's first 700 MW SC generating units were put into operation in June 1989. The main steam pressure is 31 MPa, the main steam temperature and reheat steam temperature is 566/566/566ºC, and unit thermal efficiency is 41.9%.
8. IGCC power generation schemes are proposed by the NEDO. Nine power companies led by the Tokyo Electric Power Company and the Central Research Institute and a total of 11 legal entities were funded by the Japanese government to develop the IGCC technology. The power plant in Fukushima Nakoso conducted testing under the Experimental Research Unit from 1986 to 1996; completed a pilot unit to choose the best IGCC power generation methods and practical key technologies from 1987 to 1988; and carried out tests to improve unit reliability with funding from the financial resources from 1999 to 2000.
3. European Union
9. The main objectives of EU clean coal technology development is to reduce a variety of pollutants from coal burning, CO2 and other GHG emissions, making coal-fired electricity cleaner and reducing coal consumption by increasing efficiency. Currently, in the improving energy conversion and utilization research and development, priority is on the reduction of pollution emissions and improved energy conversion and utilization efficiency. Expected by 2020, the EU coal-fired power generation efficiency will be higher than 50%. The projects being researched and developed are integrated gasification combined cycle power generation; coal and biomass; industrial, urban, or agricultural waste co-gasification (or burning); solid fuel gasification fuel cell combined cycle; and circulating fluidized bed combustion technology, etc.
Mitigation of Trans-Boundary Air Pollution from Coal-Fired Power Plants in Northeast Asia (TA No. 6371-REG) Final Report
70
10. There are two IGCC demonstration projects in the EU. The Netherlands Buggenum IGCC demonstration power plant unit has a net power of 253 MW and went into commercial operation in 1998. The Spanish Puertollano IGCC demonstration power plant has a net export power of 300 MW and as the world's largest single unit capacity IGCC power plant, with a net efficiency of 45% (LHV).
11. There are about 60 SC units in Europe, mostly in Germany, Italy, the Netherlands, and Denmark. At present, Germany has put into operation and is building about 20 USC units, of which the representative SC units are: the 500 MW generating units put into operation at the Staudinger power plant in August 1992 (parameters 25 MPa/540ºC/560ºC); the 933 MW generating units put into operation at the Lippendorf power plant in 1999 (steam parameters 26.7 MPa/554ºC/593ºC); the 965 MW generating units put into operation at the Niederaubem power plant in 2000 (steam parameters 26.9 MPa/580ºC/600ºC); and the 700 MW unit put into operation at the Hessler power plant (steam parameters 30 MPa/580ºC/600ºC).
12. In 1998 and in 2001, Denmark put into operation two sets of 400 MW SC units whose parameters are the same: 29MPa/582ºC/580ºC/580ºC. The two units were installed in the Nordjyllandsvaerket (NVV3) and Avedore (AVV2) power plants (the former coal, the latter gas). In the case of sea water cooling, the thermal efficiency is about 47%, making them the world’s highest thermal efficiency of thermal power units to date.
13. The reheated method development of the USC units in Europe is similar to Japan, with the exception of the two sets of USC units of Denmark which reheat twice (the rest of Europe USC units have also changed into one time re-heat). The difference from Japan is that the main steam pressure and temperature are increased at the same time (30.5 MPa/580ºC/600ºC), and the thermal efficiency are the same with the unit which parameters are 29 MPa, 580ºC, and was reheated two times.
14. In recent years, the EU is proceeding with the Thermie 700 Project. The project’s goal is to make the next generation of USC steam units’ parameters up to 37.5 MPa/700ºC/700ºC, reaching 52%-55% efficiency. The project is expected to be completed in 2014.
B. The Power Plant Energy Consumption Level of Developed Countries
15. Annual statistics of Japanese overseas power investigation commission, Chinese power industry statistics of all countries, and the International Energy Agency statistics over the years outlining power plant thermal efficiency, coal consumption, and power plant electricity consumption rate conditions of major developed countries from 2000 to 2006 are shown in Table 1, Table 2, and Table 3.
16. In accordance with Table 1, the seven developed countries have different thermal efficiency of thermal power plants. The average efficiency in the U.S. and Australia was lower than that in other five countries, resulting in higher coal consumption. The thermal efficiency of thermal power plants in Germany, Japan, and ROK was high (about 40%, which is the international leading level).
17. Due to the different thermal efficiency level, the coal consumption of power plants in Germany, Japan, and ROK was low to about 300 gram coal equivalent per kWh power
Mitigation of Trans-Boundary Air Pollution from Coal-Fired Power Plants in Northeast Asia (TA No. 6371-REG) Final Report
71
generation, while the U.S. and Australia were high at 360 gram coal equivalent per kWh, as shown in Table 2.
18. In addition, in terms of the internal electricity consumption rate, Germany and Australia had a higher internal electricity consumption rate, while Japan had an extremely low internal consumption, as shown in Table 3.
Table 1: Thermal Efficiency of Thermal Power Plants (Unit: %)
Year U.S. Germany Britain France Australia ROK Japan
2000 33.3 39.8 36.2 40.0 33.2 39.5 38.9
2001 33.6 40.9 35.8 40.8 33.5 39.6 40.8
2002 34.1 40.4 36.3 40.3 33.4 40.0 41.0
2003 34.2 42.9 36.5 37.3 32.4 41.0 41.1
2004 34.2 43.1 36.2 35.6 33.8 40.7 40.9
2005 34.0 40.8 35.9 - 34.1 40.7 40.9
2006 34.5 39.3 36.3 - 34.1 41.0 39.4
Table 2: Coal Consumption in Thermal Power Plant (Unit: g/kWh)
Year U.S. Germany Britain France Australia ROK Japan
2000 369 309 339 307 370 311 316
2001 366 300 343 301 367 310 301
2002 360 296 338 305 368 307 300
2003 359 303 337 329 379 300 299
2004 359 306 339 345 363 302 300
2005 361 301 342 - 360 302 300
2006 356 306 338 - 360 300 312
Table 3: Electricity Consumption Rate of the Power Plant (Unit: %)
Year U.S. Germany Britain France Australia ROK Japan
2000 5.82 6.62 4.32 4.43 5.82 4.56 3.71
2001 3.32 6.36 4.45 4.31 5.80 4.48 3.65
2002 4.75 6.21 4.44 4.33 6.54 4.39 3.67
2003 4.86 5.80 4.57 4.34 6.75 4.47 3.58
2004 4.04 6.37 4.33 4.30 7.45 4.18 3.66
2005 4.81 6.28 4.49 4.51 5.50 4.26 3.81
2006 4.72 6.22 4.67 4.47 5.64 3.91 3.86
2007 3.66 6.07 4.47 4.46 6.16 3.96 3.80
Mitigation of Trans-Boundary Air Pollution from Coal-Fired Power Plants in Northeast Asia (TA No. 6371-REG) Final Report
72
APPENDIX 2: COAL-FIRED POWER PLANTS ANALYSIS IN MONGOLIA
A. Power and Heat Sources in Mongolia
1. Electricity is supplied through three centralized power grids and two isolated systems. The three centralized power grids are (i) Central Energy System (CES); (ii) Eastern Energy System (EES); and (iii) Western Energy System (WES). The two isolated systems are (i) Dalanzhadgad CHP plant and local grid, and (ii) Zhavhan and Gobi-Altai aimags. The power plants mainly include seven coal-fired power plants, two hydro power plants, diesel generators, and small renewable energy generators.
2. Coal-fired power plants provide the majority of power generation for Mongolia. There are seven main coal-fired power plants in Mongolia with total installed capacity of 836.3 MW; three large-sized power plants are located in UB. In 2009, 4 billion kWh of electricity was generated by thermal power plants and 11.05 million kWh of electricity was generated by hydropower plants. Moreover, 180.8 million kWh of electricity was imported from Russia and 21.2 million kWh of electricity was exported to Russia, due to the fact that the power plants of the system are based on conventional design and the capability of the load regulation during peak load is weak. Meanwhile, 2.8 billion kWh of electricity and 6.4 million Gcal of heat were distributed to final consumers.24
3. The CES, the largest energy supply system in Mongolia, consists of five CHP plants, one transmission network, and four distribution networks, and supplies power to the cities of UB, Darkhan, Erdenet, and the centers of 13 provinces. The total installed capacity is 794 MW in the CES. The maximum power loading of the CES was 695 MWe in 2009. The available power capacity is 615 MWe. The present available heating capacity of thermal power plants in UB is 1,585 GWth, while the actual heating demand is 1,555 GWth, and the available heating capacity is almost fully utilized.
4. Three major CHP plants, namely CHP2, CHP3, and CHP4 are located in UB. CHP2 is over 40 years old while CHP3 has been operating close to 40 years. It is generally agreed by experts that most parts of the heat production system are nearing the end of their life for these two plants. The expected retirement periods of CHP2 and CHP3 were 2005 and 2011, respectively.25 However, due to lack of new heating sources, these two plants are still operating.
5. CHP4 is the biggest coal-fired CHP plant in Mongolia with a design capacity of 560 WM. It covers 70% of the total electricity demand of the CES and 64% of the total heat energy demand of the district heating system of UB. The plant was built over 30 years ago and many upgrades and repairs have been done over recent years.
6. In addition to the CHPs, a lot of small HOBs and domestic stoves have been used in UB for space heating and domestic hot water production. By 2008, the UB population
24 Source: Energy Statistics, ERA, 2009. 25 Source: Feasibility Study on a Thermal Power Plant for Oyu Tolgoi Copper/Gold Mine Project, Japan International Cooperation Agency, 2006.
Mitigation of Trans-Boundary Air Pollution from Coal-Fired Power Plants in Northeast Asia (TA No. 6371-REG) Final Report
73
reached over a million and about 53 percent of the residents live in ger districts. In accordance with the Market Study of HOBs and Coal-Fired Water Heaters in 2008, 89 HOB houses and 1,005 coal-fired water heaters were used for public buildings and apartments in ger districts. HOBs were designed to provide heating service to one or several schools and kindergartens as their central heat supplier. In addition, domestic stoves are widely used in gers. The survey found that there are about 103,971 heating stoves26 in 2008.
B. Energy Efficiency of the Existing CHPs in Mongolia
7. The fuel utilization efficiency of CHPs, defined as net energy (electricity and heat) export compared to total fuel heat input to the boiler, is in the range of 20-40% for all stations. In a modern CHP, scheme figures of 50-80% are achievable. Reasons for the low total heat utilization are: low boiler efficiencies; low steam/water cycle efficiencies; excessive own consumption of heat and power; low condensate return and high-energy losses.
8. Through implementation of a series of measures for improving energy efficiency of CHPs, the energy efficiency of CHP3, CHP4, and Erdenet CHP have been improved greatly. The efficiency of CHP3 increased from 22.3% in 1995 to 38.6% in 2009. The efficiency of CHP4 was improved from 29.5% in 1995 to 40.1% in 2009. Erdenet CHP has the highest efficiency of 40.8%, but the Erdenet CHP has very small capacity and has little influence on local energy efficiency and environment improvement. However, the energy efficiency of CHP2 decreased from 28.9% in 1995 to 21% in 2009. Both Darkhan CHP and Dornod CHP have experienced a little efficiency improvement in last 14 years. The electrical efficiencies of all the power plants in the CES grid are given in the Figure 1.
Figure 1: Electrical Efficiencies of Power Plants in CES
Source: Energy Statistics Yearbook, ERA, Mongolia, 2009
26 Source: Heating in Poor, Peri-urban Ger Areas of Ulaanbaatar, Mongolia, the World Bank.
Mitigation of Trans-Boundary Air Pollution from Coal-Fired Power Plants in Northeast Asia (TA No. 6371-REG) Final Report
74
C. Air Pollution from CHPs Not Controlled
9. Emission standards for coal-fired power plants have been developed and issued in Mongolia; however, emissions of SO2, NOx, CO, and PMs from UB power plants remain problematic. UB CHP4 was equipped with an ESP, but emission control systems for SO2, NOx, and CO are not in place. Even worse: CHP2 and CHP3 don’t have any emission control devices. Additionally, many small coal-fired boilers and household stoves have been used for the purpose of heating and domestic use in UB. The air quality in UB is deteriorating rapidly due to lower energy efficiency of CHPs, boilers and stoves, and lack of efficient and adequate emission control instruments equipped for coal-fired facilities and appliances. During the past few years, complaints about air pollution in the city have increased dramatically, especially during the winter months. It was reported by a WB report that UB is one of the most polluted capital cities in the world in the winter.27
D. Power Plants in Mongolia
10. There are seven main coal-fired power plants in Mongolia with total installed capacity of 836.3 MW as shown in Table 1. With 95% of the total installed capacity, the CES is the largest energy supply system in Mongolia. Total installed capacity of the CES is 794 MW. Due to aged, deteriorated, and unreliable equipment, the actual available power capacity is 615 MWe. Three large-sized power plants, including CHP2, CHP3, and CHP4 located in UB, account for 90% of total installed capacity in the CES. The typical performance indicators of the three CHPs in 2009 are shown in Table 2. In the following paragraphs, we will describe the three power plants in detail in terms of power generation.
Table 1: Coal-Fired Power Plants in Mongolia
No. Thermal Power
Plants Capacity
(MW)
Available capacity
(MW)
Share in CES (%)
Location Installation
Year Efficiency (in 2009)
1 CHP2 21.5 18 2.7% UB 1961 21.0
2 CHP3 136 105 17.5% UB 1968 38.6
3 CHP4 560 452 70.2% UB 1983 40.1
4 Erdenet Plant 28.8 39 6% Erdenet city 1987 40.8
5 Darkhan Plant 48 21 3.6% Darkhan city 1965 28.5
CES Subtotal 794.3 615 100% --
6 Dornod Plant 36 -- -- Dornod aimag 1969 19.4
7 Umnugobi Plant 6 -- -- Umnugobi aimag 2001 --
Total 836.3 Source: Energy Statistics Yearbook, ERA, Mongolia, 2009
27 WB, 2009, Initial Assessment of Current Situation and Effects of Abatement Measures, Air Pollution in Ulaanbaatar
Mitigation of Trans-Boundary Air Pollution from Coal-Fired Power Plants in Northeast Asia (TA No. 6371-REG) Final Report
75
Table 2: Typical Performance Indicators of the CHPs in 2009 Items Units CHP2 CHP3 CHP4 CES
Total Power Generation Million kWh/a 120 655 2711 3876 Total Power Net generation Million kWh/a 100 520 2329 3259 Internal Consumption % 16 21 14 16 Specific equivalent fuel consumption Gr/kWh 610 359 307 -- Efficiency % 21 39 40 --
Source: Energy Statistics Yearbook, ERA, Mongolia, 2009
11. CHP2. CHP2 was put into operation in 1961 when two units of turbines and generators were installed, each with 6 MW of power generation capacity. In 1969, CHP2 was expanded, and one unit of turbine and generator with 12 MW of capacity was added. As a result, the installed capacity of CHP2 reached 24 MW. Once condensing turbine AK-6 was modified and changed to a backpressure turbine and the installed power capacity of the PP decreased to 21.5 MW, the available power generation capacity is 18 MW. Detailed information of the turbine and generators are shown in Table 3 and Table 4.
Source: Energy Statistics Yearbook, ERA, Mongolia, 2009
12. In 2009 the power generation of CHP2 was only 3% of the total power generation of CES, contributing a very small fraction in the total CES. What is more, its specific equivalent fuel consumption for power generation was high to 600 Gr/kWh, while the internal power consumption rate reached 16%. The higher specific equivalent fuel consumption and internal power consumption resulted in a lower efficiency of 21%. In addition, emissions from power plants are free from control, which results in serious air pollution. These indicators explain the urgency and necessity of the retirement of CHP2.
Source: Energy Statistics Yearbook, ERA, Mongolia, 2009
13. CHP3. CHP3 includes two systems, high and low pressure systems. Four low pressure units of turbines and generators with 39 kg/cm3 of working pressure, each with 12 MW of power generation capacity, were installed on 1 December 1973, and four low pressure units of turbines and generators with 100 kg/cm3 of working pressure, each with 22 MW of
Mitigation of Trans-Boundary Air Pollution from Coal-Fired Power Plants in Northeast Asia (TA No. 6371-REG) Final Report
76
power generation capacity, were installed in 1977. The detailed technical information of the units is seen in Table 5 and Table 6. At present, this power plant has an installed capacity of 136 MW, and the available capacity is 105 MW. Power Plant #3 covers 17 % of electricity demand of CES.
14. From Table 2, we see that the internal power consumption rate is high at 21%. Though both its specific equivalent fuel consumption and internal power consumption rate are more than the CHP4, its efficiency reaches 39%, which is close to CHP4. However, attention has been paid to the fact that the higher efficiency of CHP3 does not mean that it is an efficient plant. The high efficiency of CHP3 should be mainly due to its high 3:1 ratio of heat output to power output. Considering this higher ratio, we believe that CHP3 is not efficient. In addition, emissions from power plants are unregulated, resulting in serious air pollution.
15. CHP4. CHP4 is the biggest coal-fired CHP in Mongolia. It covers 70% of the total electricity demand of the Central Energy System of Mongolia. Installed capacity of the CHP4 is 560 MW in electricity generation, and the available capacity is 452 MW. The detailed power generation units are shown in Table 7 and Table 8. CHP4 was constructed under the design of the former USSR's equipment suppliers. Upon withdrawal of Russian economic support
Mitigation of Trans-Boundary Air Pollution from Coal-Fired Power Plants in Northeast Asia (TA No. 6371-REG) Final Report
77
and the return of Russian specialists in 1991, the CHP4 has faced a serious shortfall of electricity and heat supply due to lack of skilled staff and necessary spare parts. The Government of Japan has supported the implementation of several Grand Aid and Soft Loan projects to improve the condition of CHP4, which has subsequently improved the welfare of people in Mongolia. As a result of this support, the condition of CHP4 has greatly improved, heat and electricity generation has been increased, auxiliary power consumption was reduced, fuel consumption was reduced, specific power generation cost was reduced, critical full stop emergency situations have been eliminated, and a number of unplanned shortages were decreased. Compared to CHP2 and CHP3, CHP4 has the lowest internal consumption rate and specific equivalent fuel consumption, and the highest efficiency. In addition, it is the major power and heat source for UB.
*Note: Initial generation capacity was 80 MW. It was increased to 100 MW through modification of turbine.
Source: Energy Statistics Yearbook, ERA, Mongolia, 2009
Mitigation of Trans-Boundary Air Pollution from Coal-Fired Power Plants in Northeast Asia (TA No. 6371-REG) Final Report
78
APPENDIX 3: SUMMARY OF SO2 EMISSION STANDARDS FOR COAL-FIRED POWER PLANTS
A. Summary of Current Mongolia Emission Standards for Coal-Fired Power Plants
1. (Maximum acceptable level and measuring method of air pollutants in the exhaust gases from the steam and hot water boilers of thermal power plant and thermal stations. MNS5915:2008)
11 12<Q≤23.26 Water cooled grade 0.84 23.0 0.788 1553.5 11.8
12 12<Q≤23.26 Traveling grade spreader stoker
1.63 945.0 32.2 48700.
0 582.5
13 12<Q≤23.26 Fluidized combustion
technology 0.84 9.6 0.326 670.0 9.5
14 4 ≤ Q < 12 Traveling grade spreader stoker
0.73…1.63
230.0 9.5 13000.
0 240.0
15 4 ≤ Q < 12 Fluidized combustion
technology 0.73...1.
63 190.0 7.9
10500.0
200.0
Mitigation of Trans-Boundary Air Pollution from Coal-Fired Power Plants in Northeast Asia (TA No. 6371-REG) Final Report
82
B. Summary of Emission Standards for Power Plants in PRC
2. Since 1 July 2014, existing thermal power plants should follow the emission limits on PM, SO2 and NOx as Table B1. Since 1 January 2012, newly-built thermal power plants should be the emission limits on PM, SO2 and NOx as Table B1. Since 1 January 2015, coal-fired boiler should follow the emission limits on mercury and compound thereof.
Table B1: Maximum Allowable Emission Concentration of Air Pollutants (mg/m3)
Pollutants Applicable Condition Limits
PM All 30
SO2
Newly-built Boiler 100
200(1)
Existing Boiler 200
400(1)
NOx (converted to NO2) All 100
200(1)
Mercury 0.03 Source: GB13223-2011, Emission Standard of Air Pollutants for Thermal Power Plants
Note: (1) Thermal Power Plants, located in Guangxi, Chongqing, Sichuan and Guizhou, follow this emission limit.
3. Thermal power plants, located in special regions which will be regulated by national environment protection authority, should follow the special emission limits as Table B2.
Table B2: Special Maximum Allowable Emission Concentration of Air Pollutants (mg/m3)
Pollutants Applicable Condition Limits
PM All 20
SO2 All 50
NOx(converted to NO2) All 100
Mercury
0.03 Source: GB13223-2011, Emission Standard of Air Pollutants for Thermal Power Plants
Mitigation of Trans-Boundary Air Pollution from Coal-Fired Power Plants in Northeast Asia (TA No. 6371-REG) Final Report
83
C. Summary of Emission Standards for Power Plants in Japan
Table C1: Coal-Fired Boiler Emission Standard in Japan
Boiler SO2 Emission Limit NOX PM
Existing and New
Formulas(170-860mg/m3): Q=K×10-3×He2
He-Height of Chimney, m Q- SO2 Emission Amount, m3/h
K-Local factor, m/h
100 ppm or 200 mg/m3 (New
buildings)
100 mg/m3 (Built after June 1,
1982)
D. Summary of Emission Standards for Power Plants in ROK
Table D1: Current Air Pollution Regulations for Power Plants
Pollutant Fuel and Facility (≥500 MW, New plant) Emission Standard
SOx (ppm) Oil 70 (4)
Coal 80 (6)
NOx (ppm) Oil 70 (4)
Coal 80 (6) Gas 50 (4)
PM (mg/Nm3) Oil 20 (4)
Coal 20 (6) Notes: number in parentheses standards for oxygen concentration
Table D2: SO2 Emissions in the Last Few Years (Changes in Regulations)
Time 1998.12 1999.01~ 2005~ 2010~
Emission standard (ppm)
500(6)
270(6)
100(6)
80(6)
Emission standard (mg/m3) 1309 707 262 209
Source: KEPCO
Note: number in parentheses standards for oxygen concentration
Mitigation of Trans-Boundary Air Pollution from Coal-Fired Power Plants in Northeast Asia (TA No. 6371-REG) Final Report
84
E. Summary of Emission Standards for Power Plants in United States
Table E1: PM Emission Standard in U.S.
Build Time Type Emission (30 Days Average) mg/Nm3 Reduce Rate (%)
Source: New Source Performance Standards, revised in April 2009
Table E2: SO2 Emission Standard in U.S.
Time Type Emission Limit mg/Nm3 Reduce Rate (%)
Aug. 17, 1971- Sept. 18, 1978
Coal 520 ng/Joule 1480 -
Petroleum and gas 340 ng/Joule 985 -
Sept. 18, 1978- Feb. 28, 2005
Coal (Option 1) 520 ng/Joule 1480 90
Coal (Option 2) 260 ng/Joule 740 70
Anthracite 520 ng/Joule 1480 -
Oil and gas 340 ng/Joule 985 90
After Feb. 28, 2005
New (Option 1)
180 ng/Joule and 1.4 lb/MWh
Gloss output
522 and 635g/MWh -
New (Option 2) - - 94
Rebuild (Option 1)
180 ng/Joule and 1.4 lb/MWh Gloss output
or 65 ng/Joule Gloss input
522 and 635g/MWh
or 184
-
Rebuild (Option 2) - - 94
Rebuild (Option 1)
180 ng/Joule and 1.4 lb/MWh Gloss output
or 65 ng/Joule Gloss input
522and 635g/MWh
or 184
Rebuild (Option 2) - - 90
Source: New Source Performance Standards, Code of Federal Regulations, revised in April 2009
Mitigation of Trans-Boundary Air Pollution from Coal-Fired Power Plants in Northeast Asia (TA No. 6371-REG) Final Report
85
Table E3: NOx Emission Standard in U.S.
Time Type Emission Limit (30 Days Average) mg/Nm3 Reduce
Rate (%)
Aug. 17, 1971- Sept. 18, 1978
Lignite 260ng/Joule 740 -
Bituminous coal, lean coal and
anthracite 300ng/Joule 860 -
Lignite and Cyclone Burner 340 ng/Joule 985 -
Sept.18, 1978- July 9, 1997
Lignite 260ng/Joule 740 65
Bituminous coal, lean coal 260ng/Joule 740 65
Anthracite 210ng/Joule 615 65
Lignite and Liquid bottom boiler 340ng/Joule 985 65
July 9, 1997- Feb. 28, 2005
New
200ng/Joule and
1.6lb/MWh
Gloss output
573 and 726g/MWh -
Rebuild 65ng/Joule 185 -
After Feb. 28, 2005
New 130 ng/Joule
and 1.0 lb/MWh Gloss output
372 and 454g/MWh -
Rebuild
130ng/Joule and 1.0 lb/MWh
(454g/MWh) Gloss output or
47ng/Joule Gloss input
372 and 454g/MWh
or 135
-
Rebuild
180 ng/Joule and 1.4lb/MWh
gloss output or
65ng/Joule Gloss input
522 and 635g/MWh
or 185
-
Source: New Source Performance Standards, revised in April 2009
Mitigation of Trans-Boundary Air Pollution from Coal-Fired Power Plants in Northeast Asia (TA No. 6371-REG) Final Report
86
APPENDIX 4: ASSESSMENT OF FGD TECHNOLOGIES
A. Introduction
1. Coal is a primary fuel source and is widely used for power generation and for industrial and domestic purposes in many developing countries. The widespread use of coal on a significant scale with very few environmental controls has resulted in significant pollution problems. FGD technologies were introduced into The PRC in the early 1990s. So far, the desulfurization unit installation has reached 461 million kilowatts of capacity in The PRC. The total installed capacity of FGD units in The PRC in 2009 was around 74% of the national coal-fired generating capacity. Mongolia will start to install FGD in their coal-fired power plants in awareness of improving the air pollution problem. Further emphasis will be on an attempt to determine which technologies are the most suitable technologies for specific power plants either in the PRC or in Mongolia. The following paragraphs summarize various general/advanced FGD technologies’ principles and advantages/ disadvantages collected from other publications.
B. SOx Formation
2. All coal contains sulfur. Some of this sulfur, known as organic sulfur, is intimately associated with the coal matrix. The remaining sulfur, in the form of pyrites or sulfates, is associated with the mineral matter. The concentration of sulfur in coals varies widely and typically in the range of 0.4-4.0% by weight. Upon combustion, most of the sulfur is converted to SO2, with a small amount being further oxidized to sulfur trioxide (SO3).
S (Coal) + O2 ----> SO2
SO2 + 1/2 O2 ----> SO3
3. Over 98% of the combusted sulfur is in the form of SO2 because in the absence of a catalyst, the formation of SO3 is slow. In addition, depending on temperature, oxygen content, and the presence of catalysts (mainly iron and vanadium oxides), typically about 1% of the sulfur is converted to SO3. The SO3 is much more corrosive than SO2. Not all of the sulfur is converted to gaseous SOx. A fraction of the total sulfur in the coal is retained in the ash mainly in the form of CaSO4. Generally, a higher calcium content of the ash and a lower boiler operating temperature (such as in CFB) will increase the sulfur retaining in the ash and reduce gaseous SOx emission.
4. The SO2 emissions from tall stacks disperse pollutants into the upper atmosphere, contributing to trans-boundary pollution, such as acid rain. Sulfur and NOx emissions are the major causes of long-range acid rain deposition. The impacts occur considerable distances from the source of the pollution. Acid rain can cause deterioration in public health, reduce agricultural productivity, damage infrastructure, and cause ecosystem degradation. Trans-boundary air pollution from coal-fired power plants is a major regional environmental issue in Northeast Asia.
Mitigation of Trans-Boundary Air Pollution from Coal-Fired Power Plants in Northeast Asia (TA No. 6371-REG) Final Report
87
C. SOx Control Technologies
5. There are many state-of-the-art FGD technologies for SO2 emission control which are classified as wet, semi-dry, and dry FGD processes. New generations of FGD have overcome many early FGD disadvantages. They are more efficient, clean, and cost- effective. These technologies which are commercially mature and are offered by a number of suppliers are:
6. In the limestone gypsum wet scrubbing process, the flue gas is treated with limestone slurry in order to remove the SO2 and neutralize it. The final product is calcium sulphate dihydrate (gypsum). This is the most common FGD process now being installed worldwide, and has evolved over almost 30 years. Nowadays, a plant would normally be designed to achieve a high-quality gypsum product, which is suitable for wallboard manufacture. Earlier limestone-based FGD processes produced sulfite sludge or gypsum for dumping, but these types of design are not often adopted now.
7. There are a number of process variants and equipment arrangements which can be adopted; e.g., the absorber type and reheat methods can vary with the supplier and with the client’s requirements. The design consists of an open spray tower with a rotary regenerative reheater. The limestone gypsum plant is located downstream of the ESP or bag filter, so that most of the fly ash from combustion is removed before the gas reaches the FGD plant. For coal-fired plants, fly ash removal would be ~99.5%.
8. Flue gas from the ESP passes through an induced draught (ID) and/or booster fan and enters the gas/gas reheater. Here the gas is cooled as heat is extracted. The warm gas from the reheater enters the absorber and mixes with the process liquor. Some of the water is evaporated, and the gas is further cooled. The gas is scrubbed with the recirculating limestone slurry to remove the required amount of SO2. FGD plant manufacturers generally claim that over 95% of the SO2 can be removed within the absorber. This process also removes almost 100% of any hydrogen chloride (HCl) in the flue gas. At the top of the absorber, the gas passes through de-misters to remove suspended water droplets. After leaving the absorber, the gas is passed through the reheater again, to raise its temperature before being exhausted to the stack. Absorber outlet temperatures are typically 50-70ºC, depending mainly on the type of fuel burnt. The minimum gas temperature at the stack is often specified in national emission standards. Most plants have a by-pass duct, fitted with a (normally closed) damper. This would be opened in an emergency or during start-up, to allow flue gas to be diverted past the FGD plant, directly to the stack.
9. Limestone/gypsum slurry is pumped from the absorber sump to the spray headers at the top of the scrubber. As the slurry falls down the tower it contacts the rising flue gas. The
Mitigation of Trans-Boundary Air Pollution from Coal-Fired Power Plants in Northeast Asia (TA No. 6371-REG) Final Report
88
SO2 is dissolved in the water, neutralized and thus removed from the flue gas. Calcium carbonate from the limestone reacts with the SO2 and oxygen (O2 from air), ultimately to produce gypsum, which precipitates from solution in the sump. HCl is also dissolved in the water and neutralized to produce calcium chloride solution.
10. Fresh limestone slurry is pumped into the sump to maintain the required pH. At many plants, crushed limestone is milled on-site before being slurried and pumped into the absorber sump. Although a certain amount of liquor oxidation occurs naturally due to excess air in the flue gas, the sump liquor is sparked with air, oxidizing any remaining bisulfite to sulphate. Gypsum slurry (contaminated with ~3% limestone) is extracted from the absorber sump, thickened, de-watered and washed for subsequent storage before being dispatched from site.
11. As described above, HCl is removed from the flue gas in the scrubber to produce a calcium chloride solution. In addition to this, trace quantities of fly ash are also removed from the flue gas. These and impurities in the limestone will accumulate in the process liquor as dissolved metal salts and suspended minerals such as quartz. The concentrations of these contaminants must be controlled to ensure the gypsum purity is maintained at the required level and high concentrations of chloride do not inhibit the desulphurization process chemistry. The system is purged with water to control the concentration of these contaminants. Fresh water is added to the absorber via the de-mister wash. The purge stream is taken off as the overflow from the hydrocyclone system used for gypsum thickening. The purge stream, which contains dissolved solids and very fine suspended particles, is sent to the wastewater treatment plant. Here lime is added to raise the pH and precipitate heavy metals from the solution. The treated water is then normally discharged from the site.
12. Despite falling prices, the limestone gypsum process should still be regarded as relatively high in capital cost, significantly higher than most other processes except ammonia scrubbing and the regenerative types. It is also more complex than some other process types. However, for many applications it will provide a lower operating cost than other lime-based processes. This is because limestone is normally much cheaper than lime, and normally the by-product gypsum can be sold rather than incurring a disposal cost. This becomes particularly important for plant with a high sorbent consumption. The limestone gypsum process will usually offer the lowest through-life cost option for large inland plant with medium- to high-sulfur fuel, a high load factor and a long residual life.
13. The limestone gypsum process is the most well-developed and widely adopted FGD process worldwide, and is the one normally adopted for a large power station. The total worldwide installed capacity is approximately 149,000 MWe for coal-fired plants alone. The technology is very well understood and is offered by many contractors. It probably offers a lower commercial risk than any other process, and a plant can be obtained at a competitive price. The process is capable of high sulfur removal efficiency, even with fairly high-sulfur fuel. Most suppliers would now offer 95% removal for use with European coals. Some recent plants have been designed for up to 98% removal. As already noted, there are several design variations centered on the layout of the absorber itself. The most common design type today is the single loop open spray tower with the flue gas flowing upward through the scrubber.
Mitigation of Trans-Boundary Air Pollution from Coal-Fired Power Plants in Northeast Asia (TA No. 6371-REG) Final Report
89
Marsulex, ABB, Lurgi Lentjes Bischoff (LLB), Babcock Borsig, Kawasaki, and IHI produce this type. Babcock and Wilcox and Babcock Hitachi have a very similar design but theirs includes a tray at the bottom of the gas treatment zone. This provides gas/liquid contact and presents a more even flow profile to the spray headers. The traditional Mitsubishi Heavy Industries (MHI) design is very different from the others. It is not an open spray tower, but has a layer of packing in order to obtain effective gas/liquid contact. Also the flue gas is normally drawn down the tower rather than upward. Recently MHI has adopted a type of open spray tower which it calls the double-contact flow scrubber.
E. Sea-Water Washing
14. The sea-water washing (SWW) process uses untreated sea water to scrub the flue gas, taking advantage of sea water’s natural alkalinity in order to neutralize the SO2. After scrubbing, the water used is treated with air to reduce its chemical oxygen demand and its acidity, and is then discharged back to the sea.
15. This is a relatively new technology for desulphurization of power plant flue gases, although it has been used on small-scale industrial applications for over 30 years. There are only two suppliers, ABB and LLB, the former having the most experience; LLB is currently commissioning its first plant.
16. The ABB design is shown schematically in Figure 1. Flue gas from the ESP and ID fan passes through a booster fan before entering the gas/gas reheater. The gas from the reheater enters the absorber and mixes with the relatively cold sea water. The flue gas is cooled and saturated with water vapor. This low temperature arises because the sea water passes directly through the scrubber, and is not recycled as in other wet scrubbing processes.
Figure 1: Illustration of Sea-Water Washing Process
17. The gas is scrubbed with the (alkaline) sea water to remove the SO2. The manufacturers claim that up to 99% of the SO2 can be removed within the absorber. This process also removes almost 100% of any HCl in the flue gas. At the top of the absorber, the gas passes through a de-mister to remove suspended water droplets.
Mitigation of Trans-Boundary Air Pollution from Coal-Fired Power Plants in Northeast Asia (TA No. 6371-REG) Final Report
90
18. After leaving the absorber, the gas is passed through the reheater again, to raise its temperature before being exhausted to the stack. Because the flue gas leaves the absorber at a low temperature, perhaps 15-40ºC depending upon the local sea water temperature, an additional form of reheat is sometimes required. One option is to force a small percentage of hot untreated flue gas into the cold treated gas stream, after it has left the absorber, but before it reaches the gas/gas reheater. This dries as well as warms the treated gas, and helps prevent the reheater fouling and corrosion.
19. In all applications of the SWW process on power plant, raw sea water is obtained from the steam turbine condenser outlet. In most plants, all the condenser outlet water is used in the FGD plant, so as to utilize all the available alkali from this source. Part of this water is pumped into the top of the absorber tower. As the water falls down the tower, it passes through the packing and comes into close contact with the rising flue gas and dissolves the SO2 and any HCl. The acidified liquor is collected in the absorber sump. It is not recirculated back to the top of the tower, but flows into the external mixing basin and aeration lagoon. Here it is combined with the remainder of the sea water from the condenser outlet, and air is blown through to reduce the chemical oxygen demand, and raise its pH by driving off carbon dioxide (CO2). The treated liquor is then discharged to the sea.
20. SWW FGD is a rapidly expanding technology, particularly in tropical countries. ABB has built 21 plants with a total installed capacity equivalent to 2470 MWe. LLB is currently commissioning two 610 MWe plants in Indonesia. SWW’s main advantage is that it requires no solid sorbent as a reagent, unlike nearly all other FGD processes. The plant design is relatively simple. The most obvious disadvantage is that it is limited to use at coastal sites. The process is capable of very high SO2 removal (up to ~97-98%), but only if the fuel sulfur content is below 2.5-3.0 wt%. High SO2-removal efficiencies at higher SO2 loadings would require additional sea water, above that used by the power plant for cooling, and would significantly increase capital and operating costs.
F. Ammonia Scrubbing
21. The ammonia/ammonium sulphate or ammonium scrubbing process works in a similar way to the limestone gypsum process except that aqueous ammonia is used as the scrubbing agent. SO2 is removed from the flue gas by reaction with ammonia, and the final product is ammonium sulfate.
22. Ammonia scrubbing has been used intermittently since the 1950s. The only plant currently operational is installed on a 350 MWe oil-fired boiler system at Dakota Gas Company’s Great Plains plant. This has been designed for 93% SO2 removal, treating gas from high-sulfur oil. The plant is operating successfully. FGD plant manufacturers indicate that SO2-removal efficiencies in the region of 98-99% can be achieved within the absorber systems, although commercial plants have been designed for 91-93% removal. There are two known suppliers with successful commercial experience, LLB and Marsulex.
23. Flue gas from the ESP and ID fan is passed through a booster fan before entering the gas/gas reheater. The gas then enters a prescrubber, where it comes into contact with a recirculating ammonium sulfate slurry. The gas is cooled and becomes saturated with water
Mitigation of Trans-Boundary Air Pollution from Coal-Fired Power Plants in Northeast Asia (TA No. 6371-REG) Final Report
91
vapor. The saturated gas leaves the pre-scrubber through a mist eliminator, and then enters the absorber, where it is scrubbed with subsaturated ammonium sulfate solution, which removes the required amount of SO2 from the flue gas. At the top of the absorber, the gas passes through two stages of de-misters to remove suspended water droplets.
24. The aqueous solution leaving the absorber is processed to produce ammonium sulfate, which is a relatively high-value product that can be used in fertilizers. The high value of this by-product is the principal advantage of this process. With high-sulfur fuels, the receipts from the sale of the sulfate can exceed the costs of operating the FGD plant.
25. However, there could be commercial risks associated with this, because the price of ammonium sulfate and ammonia are both very volatile. A potential risk arises from the need to store ammonia on-site, either in anhydrous form, or as a concentrated aqueous solution. This might cause serious difficulties in the planning stage, at certain sites. These plants are expensive to build, and require a large “footprint” similar to a limestone gypsum plant. The process has the advantage that there is no wastewater discharge, and there are unlikely to be problems of scaling and blockage. At certain sites, particularly those burning high-sulfur fuels, or with the potential to do so, this process could be a very attractive one. However, it is unlikely to achieve very widespread use because very few plants are needed to satisfy the market for ammonium sulfate fertilizer in a particular country or region.
G. The Wellman-Lord Process
26. The Wellman-Lord Process is regenerative, i.e., the active reagent used for removal of SO2 from the flue gas is regenerated in a second process stage, and returned to the first stage (absorber tower) for re-use. Consequently, the process does not involve the large-scale consumption of lime or limestone, unlike other processes described here. The process involves the wet scrubbing of SO2 from the flue gas with aqueous sodium sulfite solution. It produces a saleable by-product that, depending on the plant’s design, could be elemental sulfur, sulfuric acid, or liquid SO2.
27. The Wellman-Lord process has been installed in nearly 40 plants, in Japan, the U.S., and Germany. This includes over 300 0MWe of electric utility boilers, and many industrial plants. However, there appears to have been no new plants built in recent years.
28. Flue gas from the ESP and ID fan is passed through a booster fan before entering the gas/gas reheater. Here the gas is cooled as heat is extracted. The warm gas from the reheater enters the pre-scrubber/absorber and mixes with the process liquor. An equilibrium temperature is established, when the flue gas becomes saturated with water vapor. In the pre-scrubbing stage, fly ash and HCl are removed. In the main absorber, the gas is scrubbed with the process liquor, to remove the required amount of SO2. Typically 95-98% of the SO2 can be removed within the absorber. At the top of the absorber, the gas passes through de-misters to remove suspended water droplets. After leaving the absorber, the gas is passed through the reheater again, to raise its temperature before being exhausted to the stack.
Mitigation of Trans-Boundary Air Pollution from Coal-Fired Power Plants in Northeast Asia (TA No. 6371-REG) Final Report
92
29. A pre-scrubber is usually fitted upstream of the absorber, primarily to remove any HCl present in the flue gas. If HCl were to dissolve in the main absorber liquor, the concentration of sodium chloride in the liquor would progressively increase to levels where it would interfere with the chemistry governing the removal of SO2. The degree of desulphurization attained would hence progressively fall off.
30. In the main absorber, the flue gas is scrubbed with aqueous sodium sulfite solution, forming sodium bisulfate. The sodium bisulfite is decomposed by steam heating in an evaporative crystallizer to produce sodium sulfite and SO2. The sodium sulfite is returned to the flue gas absorber tower circuit for re-use, while the concentrated SO2 gas stream can then be treated as appropriate to produce a by-product suitable for export. Whether this is concentrated SO2 liquid, sulfuric acid, or elemental sulfur would depend on the local commercial environment.
31. This process can achieve a SO2-removal efficiency of well over 95% on high-sulfur fuels. It is expensive to install but relatively cheap to operate and, as such, in relation to other processes, is best suited to high SO2 removal requirements, high-sulfur fuel, and plant with a long residual life. Comparative studies have suggested that the operating cost is very similar to that of the limestone gypsum process.
32. The process also has the advantage that it does not require the consumption of large quantities of sorbent and does not produce large quantities of solid waste.
H. Circulating Fluidized Bed
33. In the CFB process, the flue gas is passed through a dense mixture of lime (calcium hydroxide), reaction products, and sometimes fly ash, which removes the SO2, SO3, and HCl. The final product is a dry powdered mixture of calcium compounds.
34. The process has been commercially available for over 10 years, and is an expanding technology, particularly for retrofitting to small- to medium-sized power plant. Because of its simplicity, higher performance, lower spatial requirement, and sometimes lower cost, it is nowadays being chosen instead of the more widely established spray dry process in certain applications. The process and variants on it are now supplied by several vendors, whose designs vary significantly, although the process chemistries are the same. The originator and most experienced vendor is LLB.
35. Flue gas from the air heater is carried through the inlet venture throat of the CFB reactor and passes upwards through a fluidized bed of lime, reaction products, and fly ash particles contained within the vertical reactor tower. This removes up to 99% of the SO2 and all of the SO3 and HCl from the flue gas. From here the gas is carried through the dust arrestor and the ID fan to the stack.
36. A large quantity of the PM in the CFB reactor is carried with the flue gas into the ESP or fabric filter (FF) located downstream. Most of the solids collected in the pre-collector and ESP are returned to the reactor, so as to achieve a high dust loading within the fluidized bed. The normal sorbent is quicklime, which is hydrated on-site to make calcium hydroxide powder (hydrated lime). This is injected into the base of the reactor. Water is also added to humidify
Mitigation of Trans-Boundary Air Pollution from Coal-Fired Power Plants in Northeast Asia (TA No. 6371-REG) Final Report
93
the flue gas and so improve SO2 and particulate removal. The water flow is controlled to achieve a temperature ~20ºC above the adiabatic saturation temperature of the gas.
37. The solid by-product from the process, including fly ash, is transported from the bottom of the ESP to a silo, prior to dispatch from site. CFB FGD plants have been fitted to a total of over 3,000 MWe of power plant, as well as units fitted to a variety of industrial processes (such as hydrogen fluoride removal), at sizes of up to 300 MWe. Major suppliers of the technology are LLB (Germany), Wulff (Germany), FLS Miljø of Denmark (gas suspension absorber or GSA process), and ABB (new integrated desulphurization or NID technology).
38. The CFB process is capable of very high SO2-removal efficiency, even with very high inlet SO2 concentrations. For example, one German plant achieved 97% SO2 removal with an inlet SO2 concentration of 13,000 mg Nm-3. Several CFB/GSA plant have achieved >99% SO2 removal. The process can also achieve complete removal of SO3.
39. This is a well-established FGD process with rapidly growing experience. It is cheaper to install than a limestone gypsum plant and costs about the same as a spray-dry plant. It has a much lower space requirement than a limestone gypsum plant, at least as high SO2-removal efficiency, and is capable of complete removal of SO3. It has almost unlimited turndown capability and accommodates very rapid changes in inlet SO2 concentration. Also, it does not normally suffer from serious scaling, plugging, or corrosion problems. However, it can be relatively expensive to operate and, in common with all other semi-dry processes, it generates a waste product that normally has to be disposed of.
I. Spray-dry Process
40. In the spray-dry process, concentrated lime (calcium hydroxide) slurry is injected into the flue gas, to react with and remove acidic compounds such as SO2, SO3, and HCl. The final product is a dry powdered mixture of calcium compounds. The spray-dry process is supplied by several vendors, whose designs vary significantly — although the process chemistries are the same.
41. The flue gas from the air heater is carried into the spray-dryer vessel, where it comes into contact with a finely atomized spray of lime and by-product slurry, delivered from a single high-speed rotary atomizer. This removes up to ~95% of the SO2 and most if not all of the SO3 and HCl from the flue gas. From here the gas is carried through the dust arrestor and the ID fan before discharge through the stack.
42. The normal sorbent fed to this process is quicklime. This is slaked on-site, with excess water, to produce a calcium hydroxide slurry (slaked lime).
43. This is mixed with the recycled by-product before being pumped to the rotary atomizer. The water in the slurry will humidify the flue gas and so improve both SO2 and particulate removal. The water flow rate is controlled so as to achieve a temperature approximately 20ºC above the adiabatic saturation temperature of the gas. When firing bituminous coal, the humidified gas temperature would be ~70ºC.
Mitigation of Trans-Boundary Air Pollution from Coal-Fired Power Plants in Northeast Asia (TA No. 6371-REG) Final Report
94
44. The solid by-product from the process, including fly ash, is transported from the bottom of the ESP to a silo, prior to dispatch from site. As with other semi-dry systems producing a throw-away by-product, the spray-dry process is relatively cheap to install, typically being ~70% of the cost of the equivalent limestone gypsum system. However, the variable operating costs are among the highest of the major FGD processes, due to both the high lime usage and the costs of by-product disposal. The lower sorbent utilization of the spray-dry process, compared with the CFB, means that additional costs are incurred twice: extra lime has to be bought and then a portion of this is dumped at a cost.
45. The spray-dry process is one of the most well-developed and widely-used worldwide. The total installed capacity is in excess of 15,000 MWe. The technology is well understood, and offered by a number of contractors.
46. The process is very similar in many respects to the CFB process and the two are in competition. The process can achieve 85-90% SO2 removal with moderately high-sulfur fuels.
47. The spray-dry process is cheaper to install than a limestone gypsum plant, and similar to or slightly more expensive than a CFB-type plant. However, like the CFB it can be relatively expensive to operate, depending on the relative costs of labor, power, lime, and limestone. The disposal cost of the residues produced also adds to the overall operating cost.
J. The Duct Spray-Dry Process
48. This process is essentially the same as conventional spray-drying, except that in this case the spray-dryer vessel is omitted, and the lime slurry is sprayed directly into the duct. The lime reacts with and removes the acid gases. The final product is a dry powdered mixture of calcium compounds.
49. The process has been developed by two suppliers, but has not yet reached full-scale continuous commercial operation. It is one of a number of FGD processes developed or being developed primarily for those instances in which a moderate degree of desulphurization (50-75%) is required on plant with limited operating hours and remaining lifetimes.
K. Furnace Sorbent Injection
50. This is another process developed for moderate degrees of desulphurization with low capital costs. The process involves the injection of hydrated lime into the furnace cavity of the boiler to absorb SO2. Spent sorbent is extracted with the fly ash, in an ESP or FF. The final product is a mixture of ash and calcium compounds.
51. This process was first investigated in the 1950s and a second phase has been under way since the 1970s. However, there are very few plants now in commercial operation, most being in Poland. Dry hydrated lime is blown pneumatically into the furnace, typically above the burners. This removes up to ~70% of the SO2 from the flue gas. From the boiler, the gas is carried through the air heater, dust arrestor, and ID fan before discharge through the stack.
52. It is one of the cheapest FGD processes to install but can be expensive to operate because it is inefficient in its use of sorbent. Because of this, furnace sorbent injection is most suitable for retrofit situations. It is well-suited to a situation where only a low SO2 removal
Mitigation of Trans-Boundary Air Pollution from Coal-Fired Power Plants in Northeast Asia (TA No. 6371-REG) Final Report
95
efficiency is required, and where there is little space available in the unit plant area. The fly ash cannot be collected separately from the spent sorbent. Consequently all the furnace ash as well as the solid by-product mixture must be dumped.
L. The Sodium Bicarbonate Injection Process
53. This process involves the direct injection of dry sodium bicarbonate into the flue gas duct downstream of the air heater, to react with and remove acidic compounds such as SO2, SO3, and HCl. The final product is a dry powdered mixture of sodium compounds and fly ash. It is suitable primarily for those applications where a moderate degree of desulphurization is required at low capital cost, although it should be noted that the reagent itself, sodium bicarbonate, is relatively expensive.
54. Sodium bicarbonate is pneumatically injected into the flue gas stream as a dry fine powder. This removes up to ~70% of the SO2 from the flue gas. SO3 and HCl are removed to some extent. From here the gas is carried through the dust arrestor and the ID fan before discharge through the stack. All of the PM from the process and the fly ash are carried with the flue gas into the dust arrestor — an ESP or FF.
55. The process has been demonstrated on four full-scale, coal-fired boilers of 80-575MWe in the U.S. It has also been demonstrated on a 120 MWe boiler in the UK by PowerGen.
M. Combined SOx/NOx Removal Systems
56. Both SO2 and oxides of nitrogen (NOx) are present in flue gases. Since emissions of both are regulated, it would, in principle, be highly desirable to remove both using the same process. However, despite the fact that both are acidic (and therefore amenable to reaction with a range of alkaline substances), in practice, separate methods are normally used for the control of each: conventional FGD processes are used to restrict SO2 emissions and NOx are limited either by combustion measures or selective catalytic reduction (SCR). One reason for this is that any combined SOx/NOx-removal system would have to be sufficiently effective at removing both species that no further system was required.
57. Several combined SOx/NOx-removal systems have, however, been developed to the point where they are suitable for deployment on utility scale boilers. One of the most advanced of these is the SNOX process.
58. The SNOX process has been developed by the Danish company Haldor Topsøe. The process is located downstream of the particulate control device. The flue gas is reheated and then undergoes SCR. The flue gas is then further heated and a second catalytic reactor oxidizes SO2 to SO3.
59. The gas is then cooled to condense out the SO3 as sulfuric acid. The condenser uses glass tubes to prevent excessive acid corrosion. A further point about the process is that, since both the oxidation of SO2 to SO3 and the reaction of water vapor with SO3 to form sulfuric acid are exothermic, for high-sulfur coals (i.e. >~2.5%) the heat released is sufficient
Mitigation of Trans-Boundary Air Pollution from Coal-Fired Power Plants in Northeast Asia (TA No. 6371-REG) Final Report
96
to offset the auxiliary power consumption. The process uses no reagents other than ammonia and produces sulfuric acid of saleable quality.
60. Large SNOX units have been built on plant in Denmark, Italy, and the U.S., with smaller units in Japan, the Czech Republic, Italy, and Denmark. A SNOX unit has been operational on Unit 2 (305 MWe) of Elsam’s Nordjyllansværket in Denmark since 1991. SNOX has also been installed in the U.S. under Clean Coal Technology Demonstration Program directed by the U.S. Department of Energy. A small unit was installed on a slip-stream (35 MWe equivalent) of Unit 2 at Ohio Edison’s Niles Station in Ohio.
N. LSFO and MEL
61. LSFO (limestone with forced oxidation) and MEL (magnesium-enhanced lime with forced oxidation) FGD technologies are most frequently selected for sulfur dioxide (SO2) reduction from coal-fired utility boilers.
62. Flue gas is treated in an absorber by passing the flue gas stream through a limestone or lime slurry spray. In typical absorber designs, the gas flows upward through the absorber countercurrent to the spray liquor flowing downward through the absorber. However, other designs are also available, including co-current and countercurrent designs, and where the gas is forced through the liquor in a froth-type bubbling absorber. In a typical design, slurry is pumped through banks of spray nozzles to atomize it to fine droplets and uniformly contact the gas. The droplets absorb SO2 from the gas, facilitating the reaction of the SO2 with reagent in the slurry. Hydrogen chloride present in the flue gas is also absorbed and neutralized with reagent, causing an accumulation of chloride ions in the process liquid. Some of the water in the spray droplets evaporates, cooling the gas at the inlet from approximately 300°F to 125°F-130°F, and saturating the flue gas with water. The desulfurized flue gas passes through mist eliminators to remove entrained droplets before the flue gas is sent to the stack.
63. After contacting the gas, the slurry collects in the bottom of the absorber in a reaction tank. The slurry is agitated to prevent settling. Limestone or lime consumed in the process is replenished by adding fresh limestone or lime slurry to the reaction tank.
64. In the LSFO process, the slurry is also aerated in the reaction tank to oxidize calcium sulfite hemihydrates (CaSO3 • ½ H2O) to calcium sulfate dihydrate (CaSO4 • 2H2O), or gypsum, which precipitates. This is where the term “forced oxidation” originates and it distinguishes this process from older, more troublesome limestone-based “natural oxidation” technology. The oxidized slurry is then recirculated to the spray headers. A portion of the slurry is withdrawn to remove the precipitated gypsum. Typically, this slurry is dewatered in a two-stage process involving a hydroclone and vacuum filter system to produce a gypsum cake for disposal or sale. Water removed from the gypsum slurry is returned to the process. A portion of this water is removed from the system as wastewater to limit accumulation of corrosive chloride salts in the process liquid.
65. In the MEL process, the slurry is aerated for the same reason, but in a separate tank, ultimately producing a gypsum cake similar to the LSFO process. Water removed from the
Mitigation of Trans-Boundary Air Pollution from Coal-Fired Power Plants in Northeast Asia (TA No. 6371-REG) Final Report
97
gypsum and soluble magnesium salts is recycled to the process, with a portion removed as wastewater for chloride control.
O. Double-Contact-Flow Scrubbers and Jet Air Sparger
66. In an effort against global warming, wet lime/limestone gypsum process has been applied in the treatment of flue gas from power plants since the 1970s. While the performance of desulfurization plants is steadily advancing, users are making increased demands every year for easy maintenance, low cost and energy saving of facility. To meet these demands, MHI has developed the double-contact-flow scrubber and the jet air sparger.
67. The double-contact-flow scrubber features (i) super-high desulfurization performance, (ii) simple structure and easy maintenance, and (iii) no problems of scaling; and the Jet Air Sparger is characterized by (i) high air utilization efficiency, (ii) possible elimination of oxidation air blower, and (iii) no rotating elements and easy maintenance. In actual plants, a desulfurization rate of 99.4% has been achieved.
P. Double-Contact-flow Scrubber
68. An example of a double-contact-flow scrubber developed using original MHI technology is shown in Figure 2.
Figure 2: Counter-current type double-contact-flow scrubber
69. Flue gas flows in from the inlet duct. The flue gas is purified after contact with absorbent liquid, and is discharged out of the system by way of the mist eliminator. The absorbent liquid is sprayed upward from a special wear-resistant nozzle installed in the bottom of the tower and desulfurize flue gas after gas-liquid contact. In a conventional scrubber, the inside is filled with packing, porous plate, multiple spray piping network and other structures, but this scrubber is very simple in structure, having only spray pipes installed immediately above the inlet duct. Accordingly, as compared with the conventional system, maintenance is easier, the cost is lower, much energy is saved, and the size is compact.
Mitigation of Trans-Boundary Air Pollution from Coal-Fired Power Plants in Northeast Asia (TA No. 6371-REG) Final Report
98
70. By interaction of falling fine liquid drops and uprising liquid drops, liquid layers of high gas-liquid contact efficiency and high density are formed, and a super-high desulfurization performance is achieved. Desulfurization efficiency is more than 99%.
71. The double-contact-flow scrubber has a simple structure, with only spray pipes immediately above the inlet duct. Maintenance is easy because the scrubber has no internal parts except for a single stage of sprays. Scaling does not occur inside the scrubber because there is no source of scale. In addition, since upward nozzles are used, the spray nozzles and spray pipes are always self-cleaned by the falling slurry. It is free from scale.
Q. Jet Air Sparger
72. The oxidizer was originally developed for the purpose of saving utilities. The oxidizer operates as follows: (1) Jet streams are carried out using the part of the discharge liquid from a scrubber circulation pump into a scrubber tank, (2) air is turned into fine bubbles using this liquid stream, (3) air-liquid contact is enhanced with slurry, and (4) efficient oxidizing of absorbent liquid is achieved with a small amount of air. Air utilization efficiency is high and energy consumption is much less than with a conventional oxidation lance with horizontal agitator. The jet nozzle can self-suck the air into the nozzle by ejector effect, and an oxidation air blower can be eliminated. The structure is simple because no rotating element is used and only the stationary nozzles, resulting in easy maintenance.
R. Wet FGD Process Advantages and Disadvantages
73. The wet FGD technologies have the following advantages when compared with other FGD technologies:
i) Well-established FGD technology on a variety of world coals with proven reliability.
ii) SO2 removals of 95% are common and removals as high as 98% can be attained.
iii) Adequate and commercially viable suppliers offer the technology.
iv) Reagents used by the process are plentiful and readily available.
v) Waste gypsum is stable for landfills without blending with fly ash and lime.
vi) It can be designed to produce wallboard-grade gypsum as a saleable by-product.
vii) The FGD system is not sensitive to boiler operational upsets and typical operating modes, such as cycling duty.
74. The wet FGD technologies can have the following disadvantages when compared with other FGD technologies:
i) The LSFO process circulates large quantities of slurry with the attendant high pumping power consumption.
Mitigation of Trans-Boundary Air Pollution from Coal-Fired Power Plants in Northeast Asia (TA No. 6371-REG) Final Report
99
ii) The pressure drop across the absorber increases the induced draft (ID) fan power consumption.
iii) These processes can produce a large volume of gypsum. The salability of this by-product is dependent on a sufficiently-sized gypsum market near the plant.
iv) The high potential for corrosion requires extensive use of costly corrosion-resistant alloys or nonmetallic liners as materials of construction for the absorber and other system components.
S. Dry FGD Process Advantages and Disadvantages
75. The dry FGD process has the following advantages when compared to wet limestone FGD technology:
i) The absorber vessel can be constructed of unlined carbon steel, as opposed to lined carbon steel or solid alloy construction for wet FGD. Typically, for units less than 300 MW, the capital cost is lower than for wet FGD. Typically, for units larger than 300 MW, multiple module requirements cause the dry FGD process to be more expensive than the wet FGD process.
ii) Pumping requirements and overall power consumption are lower than for wet FGD systems.
iii) Waste CaSO3, CaSO4, and calcium hydroxide are produced in a dry form and can be handled with conventional pneumatic fly ash handling equipment.
iv) The waste is stable for landfill purposes and can be disposed of with fly ash.
v) The dry FGD system uses less equipment than does the wet FGD system, resulting in fixed, lower O&M labor requirements.
vi) The pressure drop across the absorber is typically lower than for wet FGD.
vii) High chloride levels improve (up to a point), rather than hinder, SO2 removal performance.
viii) Sulfur trioxide (SO3) in the vapor above approximately 300°F, which condenses to liquid sulfuric acid at a lower temperature (below acid dew point), is removed efficiently with a spray dryer-baghouse. Wet limestone scrubbers capture less than 25% to 40% of SO3 and would require the addition of a wet ESP to remove the balance or hydrated lime injection. The emission of sulfuric acid mist, if above a threshold value, may result in a plume visible after the vapor plume dissipates.
ix) Flue gas following a spray dryer is unsaturated with water (30°F to 50°F above dew point), which reduces or eliminates a visible moisture plume. Wet limestone scrubbers produce flue gas that is saturated with water, which requires a gas-gas heat exchanger to reheat the flue gas to operate as dry stack. Due to the high costs associated with heating the flue gas, all recent wet FGD systems
Mitigation of Trans-Boundary Air Pollution from Coal-Fired Power Plants in Northeast Asia (TA No. 6371-REG) Final Report
100
in the U.S. have used wet stack operations.
x) Dry FGD systems have the capability of capturing a high percentage of gaseous mercury in the flue gas if the mercury is in the oxidized form. Further, due to the nature of the filter cake present in the fabric filter associated with LSD, the LSD equipment with a fabric filter will tend to capture a higher percentage of oxidized mercury than would LSD equipment with an electrostatic precipitator. The major constituent that will influence the oxidation level of mercury in the flue gas has been identified as chlorine. Considering the typical level of chlorine in coals in the U.S., we can expect that LSD systems applied to high chlorine bituminous coals will tend to capture a high percentage of the mercury present in the flue gas. Conversely, LSD systems applied to low-chlorine sub-bituminous coals and lignite will not capture a significant amount of the mercury in the flue gas.
xi) There is no liquid waste from a dry FGD system, while wet limestone systems produce a liquid waste stream. In some cases, a wastewater treatment plant must be installed to treat the liquid waste prior to disposal. The wastewater treatment plant produces a small volume of waste, rich in toxic metals (including mercury) that must be disposed of in a landfill. A dry FGD system provides an outlet for process wastewater from other parts of the plant when processing residue for disposal.
76. When compared to limestone wet FGD technology, the dry FGD process has the following disadvantages:
i) The largest absorber module used in the industry is 250 MW to 300 MW. Some suppliers of dry FGD systems have proposed absorbers as large as 350 MW for eastern bituminous coal-fired units. For units sized at 500 MW, two modules will be required. This will also result in large inlet and outlet ductwork and damper combinations.
ii) The process uses a more expensive reagent (lime) than limestone-based FGD systems and the reagent has to be stored in a steel or concrete silo.
iii) Reagent utilization is lower than for wet limestone systems to achieve comparable SO2 removals. The lime stoichiometric ratio is higher than the limestone stoichiometric ratio (on the same basis) to achieve comparable SO2 removals.
iv) Dry FGD produces a large volume of waste, which does not have many uses due to its properties, i.e., permeability, soluble products, etc. Researchers may yet develop some applications where the dry FGD waste can be used. Wet FGD can produce commercial-grade gypsum.
v) Combined removal of fly ash and waste solids in the particulate collection system precludes commercial sale of fly ash if the unit is designed to remove FGD waste and fly ash together. In some cases, FGD could be back-fit after the existing electrostatic precipitator, which would allow the sale of fly ash.
Mitigation of Trans-Boundary Air Pollution from Coal-Fired Power Plants in Northeast Asia (TA No. 6371-REG) Final Report
101
APPENDIX 5: NEWLY APPROVED EMISSION STANDARD IN MONGOLIA
STANDARD OF MONGOLIA
MAXIMUM ACCEPTABLE LEVEL AND MEASURING METHOD OF AIR POLLUTANTS IN THE EXHAUST GASES FROM THE STEAM AND HOT WATER
BOILERS OF TPP AND THERMAL STATIONS.
MNS6298:2011
Official publication
MONGOLIAN AGENCY FOR STANDARDIZATION AND METROLOGY ULAANBAATAR CITY
Mitigation of Trans-Boundary Air Pollution from Coal-Fired Power Plants in Northeast Asia (TA No. 6371-REG) Final Report
103
STANDARD OF MONGOLIA Classification code: 13.040.01
Maximum acceptable level and measuring method of air pollutants in the exhaust gases from new steam and hot water boilers of TPP and Thermal stations
MNS 6298:2011
This standard was approved by the 71st decree of the National Council of Standardization and Measuring on 16th December, 2011. The standard is in effect from the date of its registration. Requirements of the standard shall be guided. 1. Aim 1.1. To set the maximum allowable limits of air pollutants exhausted from new TPPs and their boilers. 2. Scope 2.1. The standard scope specifies the mass of pollutants in µg/m3 (micrograms per cubic meter), maximum allowable limits, and emission measuring method for air pollutants as Particulate Matters, carbon monoxide (CO), sulfur dioxide (SO2), nitrogen oxides (NOx) during the normal operations of new thermal power plant (TPP) and TPP boilers. 2.2. The compliance of the standard should be adhered in newly built coal burning TPP and TPS. 3. Standard Quotations 3.1. If there are some changes on used documents as a standard, shall be quoted the latest and official origin of them.
- Air quality, Technical requirements: MNS 4585:2007
- Maximum acceptable level and measuring method of air pollutants in the exhaust gases from new steam and hot water boilers of TPP and Thermal stations: MNS 5919: 2008
- Russian standard on maximum acceptable level of air pollutants in the exhaust gases from boilers: ГОСТ Р 50831: 1995
- Chinese standard on permissible exhaust gas standard from TPP: GB13223-2003
- United States standard on permissible exhaust gas standard from TPP: 40 CFR Ch. I (7-1-09 Edition)
Mitigation of Trans-Boundary Air Pollution from Coal-Fired Power Plants in Northeast Asia (TA No. 6371-REG) Final Report
104
- Korean standard air pollutants from TPP: 88/609/ЕЕС
4. Terminology Following terminologies are referred in the current standard. 4.1. “Normal” condition The condition, determined as: internal pressure of boiler flue gas is 101.325 pascals (760 mm of mmHg) and temperature of 273.15 K (0 °C) 4.2. “Standard” condition The condition, determined as internal pressure of boiler is 101.325 pascals (760 mm of mmHg) and temperature of 273.15 K (0 °C) and coefficient of excess air is αyx=1.4 4.3. Coefficient of excess air α The comparative ratio of the amounts of air needed for per unit of coal combustion and calculated (theoretical) air requirement.
Exp: 1 kg fuel (coal) is calculated as per unit of fuel. Coefficient of excess air α varies considerably depending on the fuel combustion condition of each boiler.
4.4. Maximum allowable emission limits of air pollutants Maximum acceptable level of air pollutants in the exhaust gases from the steam and hot water boilers or maximum acceptable level of toxic emissions from other pollution sources
Exp: This is expressed by units “g/second” or “t/year” and when uniting with the air pollutants, discharged from other sources, pollution concentration should not be higher than the levels, stated in the standard of “Ambient air quality”
4.5. Net calorific value (lower heating value), Qj
r The lower heating value is determined by subtracting the heat of vaporization of the liquid water in the fuel and H2O vapor from the amount of heat released during the complete combustion of 1kg coal-fuel.
Exp: The calorific value depends on fuel compound characteristics. 4.6. Natural fuel Natural fuel is a fuel used for heat generation in the Thermal Power Plant or Thermal Stations. 4.7. Equivalent fuel (Qj
Mitigation of Trans-Boundary Air Pollution from Coal-Fired Power Plants in Northeast Asia (TA No. 6371-REG) Final Report
105
4.8. Emission of pollutants released from 1 kg fuel combustion Emission level of air pollutants in the plume smoke produced during the combustion of 1 kilogram natural or equivalent fuel is expressed in the units of g/kg.fuel or g/kg.J.eq. fuel. 4.9. Emission of pollutants per unit heat released from combustion of fuel The level of air pollutants for unit amount of heat released during fuel combustion, are indicated by units of g/kCal or g/MJ. 4.10. The mass concentration of pollutants The mass of pollutant concentrations per cubic meter of smoke in the normal condition, is commonly expressed in unit mg/nm3 (milligram per cubic normal meter) 4.11. The volume concentration of pollutants The volume of pollutant concentrations per cubic meter of smoke, is commonly expressed in 1 cm3/m3. 4.12. Steam capacity of boiler The rate of steam production per hour, expressed in D, t/hour 4.13. Heating capacity of a boiler The rate of heat output per hour from hot water boiler, expressed in Q, MW 5. Maximum Permissible Emission Limits 5.1. The maximum acceptable emission limits of air pollutants of CO, SO2, NOx, and particulate matters in the exhaust gases of steam and hot water boilers are shown in Tables 1 and 2. Table 1: Maximum Acceptable Emission Limits of Air Pollutants of Carbon Monoxide, Sulfur
Dioxide, and Particulate Matters
Zone CO,
mg /m3 SO2,
mg /m3 Volitile ash/PM
mg /m3 Zone I (residential area with population concentration more than 10 per/km2 and less than 1,000 per/km2)
180 400 50
Zone II (remote area with population concentration less 10 per/km2)
Mitigation of Trans-Boundary Air Pollution from Coal-Fired Power Plants in Northeast Asia (TA No. 6371-REG) Final Report
106
Exp: Vdaf – Volitile compound concentration in coal ash and flammable objects.
6. Measuring Method 6.1. General requirements
6.1.1. Chimney height and diameter of exit shouls provide effective condition of plume smoke velocity to be two times higher than an average of ambient wind flow.
6.1.2. In conformity of this standard and in order to determine the emission level of gaseous air pollutants, pocket with lid for fixation (placing) of sampling devices should be installed in a flue gas stream of each boiler or in the main flue gas stream canal, connected with chimney of the power plant.
6.1.3. Under the following conditions, emission rate of air pollutants in the exhaust gases shall be examined through validated measuring techniques:
a) After the new constructions of power plant, steam and hot water boiler
b) After the power plant rehabilitation and refurbishment work
c) Measuring test of air pollutants emission in the flue gas is considered to be undertaken once a year, in winter
d) During the environmental monitoring and assessment work, executed by authorized organization or certified body
e) Under the request of manufacturer or customer
6.1.4. Emission rate or concentration of pollutants in the exhaust gases such as CO, SO2, and NOx, fly ash must be measured and determined under normal operational condition by using certified high accuracy test instruments. 6.1.5. The experimental conditions for the measurement shall be provided by heating-up boiler to normal function and achieve a condition that, actual capacity should not be less than 70 percent compared to the nominal capacity. 6.1.6. Performance characteristics and test methods of emission measuring instruments for air pollutants in the exhaust gases shall meet the requirements, specified in Term 5 of this standard. 6.1.7. Measuring instrument shall be prepared and installed according to operational instruction manual. 6.2. Measuring procedure
Mitigation of Trans-Boundary Air Pollution from Coal-Fired Power Plants in Northeast Asia (TA No. 6371-REG) Final Report
107
6.2.1. Emission measuring test shall be carried out in order of following procedure: - Switch the power supply.
- Aspirate air and determine oxygen concentration in the inlet air.
- Open the lid of pocket which is installed in a boiler’s flue gas stream or in the main flue gas stream canal connected with chimney and place the sampling devices, fitting to its cross section axis.
- After setting up the calibration by programming fuel type (coal, liquid, and gas), make gas aspirator work by placing measuring instrument in testing fixation.
- After the stabilization of testing indicators, record the measuring results and print the data.
- Measuring test should be conducted at least five times before determining a maximum, minimum, and averaged value.
6.3. Concentration of air pollutants is expressed by “µg/m3” according to the measurement results. 6.3.1. Converting measured values of air pollutants concentration to the normal condition then be determined by the following expression, where coefficient of excess air is estimated as α=1.4. 6.3.2. In expression by mass concentration of pollutants, mg/m3 estimated as:
Cv - Measured average value of volume concentration (ppm) of pollutants in exhaust gases C - Measured average value of mass concentration (mg/m3) of pollutants in exhaust gases
𝑉𝑥𝑥𝑜 - Theoretical volume of dry gas, released from fuel combustion, by nm3/kg α - Coefficient of excess air 𝑉𝑎𝑜 - Theoretical air volume, needed for 1 kg fuel combustion, by nm3/kg t - Smoke temperature, °C B - Air pressure under normal condition as 101325Pa, by Pa
Mitigation of Trans-Boundary Air Pollution from Coal-Fired Power Plants in Northeast Asia (TA No. 6371-REG) Final Report
108
6.4. Emission rate of pollutants in the exhaust gases determine by the following expression.
6.4.1 Emission rate of air pollutant, released from combustion of 1 kg fuel, by g/kg.fuel or g/kg.eq.fuel
m1=ci∗Vy∗10-3 or mi=Ci∗Vy∗ (Qr e/Qi
r) ∗10-3
where:
Ci - Measured average value of mass concentration (mg/m3) of pollutants in exhaust gases Vy=Vo
xx+(α-1)∗Voa - Actual volume of dry gas, released from combustion of 1 kg
fuel, by nm3/kg Qr
e - Lower heating value of 1 kilogram equivalent fuel, by MJ/kg Qr
i - Lower heating value of 1 kilogram actual fuel, by MJ/kg
6.4.2 Emission rate of air pollutant per 1 MJ heat, released from combustion of fuel, by g/MJ
Êi= (Ci⋅Vó⋅10-3)/ Qir
6.4.3. Emission rate of air pollutant per unite time, released from combustion of fuel, by g/sec
Ìi=Ci⋅Â i⋅Vó⋅10-3
where:
B1- Actual fuel consumption for sec, kg/sec
7. Technical Requirements for Measuring Instrument 7.1. Emission estimation measurement shall be performed using measuring equipments, validated by an accredited laboratory.
7.2. Technical requirements for emission measuring equipment are shown in Table 3.
Table 3: Technical Requirements of Measuring Units
No Item Measured Range Resolving Power
1 Carbon dioxide, CO2 0...25 % 0.01%
2 Oxygen, O2 0...21 % 0.01%
3 Carbon monoxide, CO 0...10000 ppm 1 ppm
4 Nitrogen oxide, NO 0...3000 ppm 1 ppm
5 Nitrogen dioxide, NO2 0...500 ppm 0.1 ppm
Mitigation of Trans-Boundary Air Pollution from Coal-Fired Power Plants in Northeast Asia (TA No. 6371-REG) Final Report
13 Fly ash 0...3000 mg/m3 ±12 mg/m3 8. Safety Precaution Requirements 8.1. Measuring instruments and equipments shall be installed at the workplace in conformity with the operating instruction manuals and all appropriate safety precautions must be taken. 8.2. Noise frequency or vibration level at working environment shall comply with the requirements of Mongolian standard MNS 0012-013:1991: “Workplace Atmospheres, Hygienic Requirements.” 8.3. During the measuring test, following instructions must be taken care:
− Do ensure the electrical safety and appropriate power supply.
− Protective eye shield, mouth cover should be worn against ash and dust at all times.
− Proper clothing and protective equipments should be used to prevent burns and other thermal hazards, caused by hot flue gas of boiler.
Mitigation of Trans-Boundary Air Pollution from Coal-Fired Power Plants in Northeast Asia (TA No. 6371-REG) Final Report
110
APPENDIX 6: NATIONAL STRATEGIC PLAN FOR CO2 REDUCTION IN MONGOLIA
A. Current Air Pollution Situation for Coal-Fired Power Plants
1. Coal-fired power plants provide the majority of power generation for Mongolia. There are seven main coal-fired power plants in Mongolia with a total installed capacity of 836.3 MW. In 2010, the total power generation of Mongolia reached 4312.7 million kWh, with 98.7% from coal-fired power plants. It is planned that at least 0.50 GW electricity capacity will be increased in the next 15 years, and an additional 0.15 GW of heat demand in the next 15 years need to be met through a combination of: (i) installation of new CHP plants, (ii) introduction of energy efficiency investments, and (iii) installation of HOBs.
1. Current Conditions of the Coal-Fired Power Plants
2. All of the coal-fired power plants have poor efficiencies, typically less than 40%. In particular, Power Plant #2, Darkhan Power Plant, and Dornod Power Plant were constructed before 1970 and operated for a long period of time without proper maintenance. They currently operate at very low efficiencies (less than 30%). Power Plant #2 is due to be decommissioned soon and Power Plant #3 will be decommissioned around 2015. The Government has proposed to construct a new and efficient CHP plant with a capacity of 300 MW power generation to meet electricity and heat demands.
3. These low efficient coal-fired power plants have been determined as the main sources of the air pollution and GHG emissions in Mongolia. There has been no comprehensive study conducted to assess the trans-boundary air pollution in Mongolia. There are no measuring points and network monitoring air pollution from coal-fired power plants. There are several air quality monitoring stations in Mongolia, located in UB city, Darkhan city, Choibalsan town, and Dalanzadgad town. However, these stations have recorded only a few indicators of the polluting substances in ambient air concentrations. Except emissions from power plants, air quality monitoring stations report compound emissions from other air pollution sources such as from motor vehicles and conventional stoves of ger-area households.
4. Currently, there are no internal air pollution control equipments or monitoring devices installed in power plants. Therefore, it is not possible to calculate actual emissions from coal-fired power plants as stationary sources. Analytical methods based on coal characteristics are used to determine the pollutant emissions quantity.
5. On the other hand, no desulphurization devices were installed to measure pollutant emissions and the GHG. The thermal power plants in Mongolia were constructed by outdated Russian technology 40-50 years old. Due to the country’s economy, technical rehabilitation and proper maintenance was not established for the power plants.
Mitigation of Trans-Boundary Air Pollution from Coal-Fired Power Plants in Northeast Asia (TA No. 6371-REG) Final Report
111
2. Air Pollution Standards for Power Plants in Mongolia
6. Currently, there are no specific SO2 emission regulations for power plants in Mongolia. Based on ambient air monitoring data, UB is one of the most polluted cities in the world.
7. According to the CLEM measurements, daily SO2 concentrations in UB have reached up to above 80 μg/m3. Allowing for the possibility that this method produces values which are too low, the SO2 levels can at times be higher than the EU Limit Value of 125 μg/m3. Levels are much higher than the recent WHO Guideline of 20 μg/m3. The WHO Interim Target 1 for developing countries is 125 μg/m3 and the Interim Target 2 is 50 μg/m3.
8. Mongolia heavily relies on coal for its energy and heating generation. Large stationary sources of emissions such as coal-fired power plants contribute significantly to the air pollution in UB.
9. Total installed power capacity in Mongolia is 0.83 GW, with close to 100% coal-fired, grid-connected generation. Three power plants in UB, supplying 80% of the energy needs, consume more than 3.3 million tons of coal per year. Power Plant #4, located in UB, is the dominant plant operating on the low-quality, highly polluting domestic lignite coal. The use of coal by HOBs and power plants accounted for close to 50% of the total emissions of UB in 2005.
10. Formal measurements of SO2 and NO2 emissions were carried out at several points during the last years, and since 2006, some researchers of the National University of Mongolia started to measure the PM. UB’s SO2 daily average value is 125 μg/m3 or even higher, which significantly exceeds the WHO Guideline of 20 μg/m3 (24-hour mean).
11. Based on results of the emission testing at Mongolian power plants and the sulfur content testing in different coals, it is possible to estimate the SO2 emissions from the power sector in Mongolia. The following figure illustrates the SO2 emissions in the last 10 years.
Figure 1: Estimated SO2 Emissions from Power Plants in Mongolia
12. A calculation has been made that three main power plants in UB use 3.3 million tons coal per year and generate considerable pollutants: 35,300 tons of ash, 16,950 tons of CO2, and 36,900 tons of NOx.
Mitigation of Trans-Boundary Air Pollution from Coal-Fired Power Plants in Northeast Asia (TA No. 6371-REG) Final Report
112
B. Review and Summarize Current Air Pollution Measures
13. Since 1976, there are four ambient air quality monitoring stations in UB City, measuring air quality by three main indicators of polluting substances such as sulfur dioxide (SO2), nitrogen oxides (NOx) and PM or dust. Figure 2 shows the locations of air quality monitoring stations in UB. Figure 3 shows the air quality records acquired by these stations in UB.
Figure 2: Location of Air Quality Monitoring Station in UB
Figure 3: Air Quality Records Acquired by UB Stations
Nitric Dioxide NO2 Sulfur
Mitigation of Trans-Boundary Air Pollution from Coal-Fired Power Plants in Northeast Asia (TA No. 6371-REG) Final Report
113
14. There were four operating coal-fired thermal power plants in UB until 1987. In 1988, the TPP1 was decommissioned by the decree of the MNET due to its outdated technical condition and old operational lifetime. Since then, three thermal power plants were activated to provide electricity and heat supply to the UB city. Only the TPP4 was installed with dust and ash collecting devices. Unfortunately, this filtering equipment has not been coordinated regularly; it operated just temporarily between the years 2000 to 2002. The TPP4 was equipped with an internal monitoring system, but its regular function failed. Therefore, such power plants fuel combustion emissions data are not available.
1. National Standards on Air Pollution
Air Quality Standard, MNS 4585:1995, 2007
Exhaust gases emitted from vehicles-Diesel-Gasoline vehicles
Sustainable Energy Sector Strategy, 2003-2010/Legislations
Law on Environmental Protection, 1995
Law on Air, 1995
Law on Energy, 2001
Parliamentary Resolution #46 on some measures to be implemented for reducing of urban air pollution, 2007
Governmental Resolution #218 on measures to be implemented for reducing of urban air pollution, 2007
3. Laws, Agreements, and Regulations on Air Pollution
Related Environmental Laws (SO2, CO2, NOx)
15. The Mongolian Law on Air Pollution was adopted on 31 March 1995 and several amendments were added through the Parliament discussions. The revised Law on Air Pollution was approved in July 2010. Some provisions in this Law are compulsory for thermal power plants to abide by:
Mitigation of Trans-Boundary Air Pollution from Coal-Fired Power Plants in Northeast Asia (TA No. 6371-REG) Final Report
114
Article 13. Permit to Operate a Larger Stationary Source of Air Pollution
13.1 Citizens, economic entities, and/or organizations which manufacture using stationary sources of production, which discharge air polluting substances into the air, and cause hazardous physical impacts shall have an assessment conducted by the professional service and shall acquire a permit from the Soum or Duureg local governor.
The permit as referred in the Article 13.1 of this law shall state the volume of air polluting substance which may be discharged and the hazardous physical impacts caused by the stationary source, and shall include mitigation measures and other requirements provided by law to protect the air from pollution and hazardous physical impacts.
As mentioned in the Article 13.2 of this law, the procedure of establishing the admissible contents of air polluting substances and the level hazardous physical impacts shall be approved by the central state administrative organization in charge of environment protection.
16. However, the current legal provisions are not being complied with appropriately in actual practice. Because of reasons such as no approval of comprehensive emission standards and non-compliance of standard requirements in the state-owned power plants, the current legal provision is not in compliance.
17. Certain provisions on permitting systems were stated in the law on air. However, the inspection agencies do not put much effort into enforcing legal compliance.
Article 15. Restriction on the Discharge of Air Polluting Substances and Causing
Hazardous Physical Impacts
15.1 After receiving from the professional service a warning of the possible increase in volume of air pollution because of natural and climatic conditions, an economic entity or organization shall take measures to reduce the discharge of air polluting substances and the hazardous physical impacts by its stationary sources, as described in the Article 14.2 of this law.
15.2 In event of the discharge of air polluting substances by a stationary source of an economic entity or organization where the hazardous physical impacts prove to be greater than the established standard and the circumstances become dangerous to human health and the environment, state health and environment inspectors may limit or suspend the activities of the responsible economic entity or organization.
15.3 Utilization of non-stationary sources which discharge air polluting substances in volumes greater than the standard requirements and cause greater hazardous physical impacts may be limited by environmental inspectors and authorized officers of the police, according to procedures set up jointly by the Central State Administrative Organization together with other respective agencies.
15.4 Environmental and health inspectors may submit to authorized agencies a recommendation to stop or to change the industrial operation of an economic entity or an organization which repeatedly neglects the requirements of emission standards, permissible limits of hazardous physical impacts, or terms and requirements stated in the permit. An authorized agency shall review and
Mitigation of Trans-Boundary Air Pollution from Coal-Fired Power Plants in Northeast Asia (TA No. 6371-REG) Final Report
115
make an appropriate decision on the recommendation within 30 days.
15.5 To protect the air from pollution, the driving of certain vehicles of city streets and residential areas may be limited or prohibited by the decree of a governor of a local Duureg/Soum.
15.6 It is prohibited to throw waste in places other than specifically designated areas, or burn waste openly, and engage in other activities which neglect the standard requirements of waste removal or destruction.
18. As above mentioned, the permitting system was legalized. However, the compliance of such law provisions is not enforced effectively due to the following reasons:
Non-compliance of the pollutants emission standards in the state-owned, outdated power plants;
During harsh winters with very low temperatures, fines are not always imposed and power plants are not always in strict compliance. Invariably they emit air polluting substances in volumes greater than the established limits.
There is a lack of investment in the rehabilitation and modernization of outdated TPPs.
There is a non-application of emission standard on stationary sources.
No comprehensive permitting system on air pollution emissions was realized.
19. In order to resolve this condition, two kinds of measures are taken: i) specific amendment made to the Law on Air in 1995; and ii) a law on Air Pollution Reduction in Capital City. Article 18, Equipping the Pollution Source has the following provisions:
Any citizen, economic entity, and/or organization engaged in industries employing a source which discharges air polluting substances into the air and causes hazardous physical impacts shall install in the source such instruments and equipment to monitor and control the air pollution and clean and reduce the hazardous physical impacts without regard for the commencement of operations.
The Central State Administrative Organization in charge of a respective industry, local governors of a Duureg or a Soum, and environmental inspectors shall control the installation at each source of air pollution cleaning equipment which reduces hazardous physical impacts. The aforementioned shall also control the regular operation of the above-mentioned facilities.
20. Upon the initiative of the Mongolian President, the Law on Air Pollution Reduction in Capital City was passed on 11 February 2011 through Parliament discussion. This law includes fines for people and businesses not following limits, and establishes tax incentives to individuals and businesses reducing air pollution:
21. Article 4, Main principle and activities to reduce the air pollution in Capital City:
4.1. To reduce air pollution in capital city, the following activities will be implemented in phases:
4.1.1. To increase the capacity of the energy sources, expand electricity distribution and supplying grid connection of the Ger districts;
4.1.2. To establish the air quality improvement zones in Ger districts and
Mitigation of Trans-Boundary Air Pollution from Coal-Fired Power Plants in Northeast Asia (TA No. 6371-REG) Final Report
116
regulate the cost of energy through economic incentives;
4.1.3. To take measures in priority for delivering energy, other services, or exemptions to households in Ger districts;
4.1.4. To offer tax rebates to individuals and businesses who are initiated to introduce the modern technology to reduce air pollution;
4.1.5. To regulate the basis to build accommodations and real properties through long-term mortgage loans with low interest, using the shares of distribution from mining industry or land rentals;
4.1.6. To establish the financial incentive system at regional basis to enhance the increase job places and improvement of investment in rural areas and creation of favorable living condition to support resettlement of population in rural area;
4.1.7. To promote the development of regional centers and remote districts of the UB city for the decentralization the urban area;
4.2. The following principles are defined to reduce air pollution in the capital city:
4.1.2 To restrict the use of raw coal for household heating purposes and promote the use of electricity, plutonian heat, coke coal, and gas fuel;
4.1.2 To activate liabilities for violation to those individuals or economic entities who disobeyed the air legislation;
4.1.3 To strengthen the integrated effort of state, economic entities, or individuals to implement the air pollution reduction measures.
4. Establishment/Enhancement of Permitting System for All New Power
Plants
22. If a permitting system for air pollution was in effect, it would be the main leverage for reducing air pollution. One obvious solution is to implement emission reduction management in the existing coal-fired power plants through the air pollution permitting system.
23. Another solution is to establish air pollution emission for new power plants. Unfortunately, an air pollution permitting system is not currently enforced because of the above-mentioned reasons. Some provisions related to this issue are compulsory for thermal power plants to abide by:
Article13, Permit to operate a Larger Stationary Source of Air Pollution:
13.1. Citizens, economic entities, and/or organizations which manufacture using stationary sources of production which discharge air polluting substances into the air and cause hazardous physical impacts shall have an assessment conducted by the Professional Service and shall acquire a permit from the Soum or Duureg local governor.
13.2. The permit referred to in Article 13.1 of this law shall state the volume of air polluting substance which may be discharged and the hazardous physical impacts caused by the stationary source, and shall include mitigation measures and other requirements provided by law to protect the air from pollution and hazardous physical impacts.
13.3. As mentioned in Article 13.2 of this law, the procedure of establishing the
Mitigation of Trans-Boundary Air Pollution from Coal-Fired Power Plants in Northeast Asia (TA No. 6371-REG) Final Report
117
admissible contents of air polluting substances and the level hazardous physical impacts shall be approved by the Central State Administrative Organization, in charge of environment protection.
24. However, the above-mentioned legal provisions have never been accomplished due to the outdated conditions of power plants and the financial inadequacy to comply with the standard requirements.
C. Issues and Causes
25. Three thermal power plants provide electricity and heat to UB. Only the TPP4 was equipped with desulphurization devices, with a filtering capacity of 93% of the discharges and the sort wet coals. However, the treatment at standard level is not achieved due to the absence of internal monitoring and an inadequacy of the operational regime. Nowadays, power plants in Mongolia discharge air pollutants (SOx, NOx, CO, and SO2) into the air by 100%, bringing significant pollution to the environment.
26. Because of very low winter temperatures, strict requirements for the power plants’ emissions are not easily attainable. Thus, rehabilitating the existing power plants with phase out management and retrofitting them completely with modern technology is urgently needed.
27. The main difficulty faced in the modernization of power plants is the investment. In order to resolve financial sources and investments, an opportunity provided by the Kyoto Protocol should be seized and a well-grounded study on a basis of multilateral participation executed.
D. National Strategy to Mitigate GHG and SO2
28. The emission standard levels and monitoring requirements shall be specified distinctively for the existing power plants and newly-constructed power plants in the National Strategy Plan for application of the “co-benefit” approach on air pollution control and GHG mitigation.
1. Policy for existing power plants
29. Laws and regulations on “Law on Air,” “Energy Law,” and the national programs for air pollution mitigation can be covered based on the policy for existing power plants. Policies on energy efficiency and technical requirements to rehabilitate the existing power plants should be taken into account. Either way, the compliance of the standard requirements approved in 2008 has to be taken into account.
2. Policy for new power plants
30. The Policy for new power plants shall consist of such components: to introduce some additional amendments to the “Law on Air” and “Law on Energy”; to develop and approve the emission source standard for new power plants; to enforce the implementation of environmental management in thermal power plants; and to improve monitoring and implementation of the emission standards.
Mitigation of Trans-Boundary Air Pollution from Coal-Fired Power Plants in Northeast Asia (TA No. 6371-REG) Final Report
118
31. (a) Institutional integration: As stated before, the energy sector is the main source of GHG. Emissions and energy problems are becoming increasingly complex, and will require extensive coordination for comprehensive implementation of the GHG mitigation policies. Responsibilities for policymaking and implementation of energy-related issues belong to the Ministry of Mineral Resources and Energy. But the leading organization in the GHG mitigation policies is the MNET. It is important to clearly coordinate the ministries and responsible organizations to formulate the GHG Mitigation policies and implement the GHG Mitigation projects.
32. (b) Prioritize funding: The implementation of mitigation measures will require significant investment. Since Mongolia is constrained by many economic problems, it is essential that funds be more clearly prioritized at the national planning level, and those resources allocated according to economic and technical criteria. In particular, resources should be allocated in such a way that funding is transferred directly to the acting organizations. Cooperating organizations should also allocate some share of the funding.
33. (c) Provide legislative base: In order to assume the role of promoter and facilitator, the government should define the legislative and administrative frameworks. Implementation of the GHG and SO2 mitigation projects usually requires a large initial investment in expensive, modern technologies. Certain economic and policy mechanisms will be critical for the implementation of mitigation options. One of the economic mechanisms could be the use of taxes, tax incentives, and subsidies to overcome the barrier of high investment costs. In that way, more efficient technologies, a less carbon-intensive energy source, and better resource management practices may be implemented. The use of tax incentives in particular could be focused on the importation, purchasing and leasing of energy-efficient equipments. Moreover, subsidies will be needed to fund activities such as:
Research and development of new technologies;
Provision of low interest loans;
Rebates for the purchase of energy efficient equipment;
Development of public education.
34. The mechanisms for developing a regulatory base should focus on:
Development of new regulations for energy efficiency standards and natural resource management practices;
Improved enforcement of existing regulations.
35. The technology procurement initiative is an important strategy to support the development of improvement of energy efficiency in energy supply and end-use sectors. Public education and close cooperation/communication of suppliers with users is a critical element in the implementation of the GHG and SO2 mitigation options in the residential and commercial building sector. This can be achieved by developing a wide range of educational tools, such as equipment efficiency labeling, information pamphlets for homeowners, and radio/television advertisements. In addition to the extension of a country’s national power grid, broad development of small-scale hydropower projects and a small wind and Photovoltaic
Mitigation of Trans-Boundary Air Pollution from Coal-Fired Power Plants in Northeast Asia (TA No. 6371-REG) Final Report
119
(PV) Solar System will not only be important for the implementation of mitigation options, but also for the sustainable development in rural areas.
36. The main Policy Guidelines & Programs in energy sector related to GHG mitigation policies are:
“Renewable Energy Law” approved in 2007
Coal Program
Mongolia Integrated Power System (MIPS)
Mongolia Sustainable Energy Sector
Development Strategy Plan (2002-2010)
Mongolian National Renewable Energy Program (approved in June 2005)
Liquefied petroleum gas (LPG) Program
37. The GHG emissions inventory for the energy sector has been prepared for the period between 1990-2006, considering emissions of the three main GHGs, namely, carbon dioxide (CO2), methane (CH4), and nitrous oxide (N2O), as well as the indirect gases carbon monoxide (CO), nitrogen oxides (NOx), non-methane volatile organic compounds (NMVOC), and sulfur dioxide (SO2).
38. CO2 emissions from solid fuel combustion for the period 1990-2006 are presented in Table 1 and were calculated using the sector approach. The table shows that most of the solid fuel or coal (64-85%) was used in the energy industry for generation of electricity and heat in power plants and heating boilers during the period 1990-2006.
Table 1: CO2 Emissions from Solid Fuel Combustion (Gg and Percentage)
Year Sectors
Energy Manufacturing Transportation Commercial Residential Agricultural Other TOTAL
1990 6.074 1.576 156 412 838 217 259 9.532
63.7 16.5 1.6 4.3 8.8 2.3 2.7 100
1995 5.444 974 132 293 190 38 314 7.385
73.7 13.2 1.8 4.0 2.6 0.5 4.3 100
2000 6.123 284 100 314 278 4 136 7.240
84.6 3.9 1.4 4.3 3.8 0.1 1.9 100
2005 6.346 154 137 258 499 5 151 7.570
83.8 2.0 1.8 3.4 6.6 0.3 2.0 100
2006 6.328 289 165 211 677 11 244 7.925
79.8 3.6 2.1 2.7 8.5 0.1 3.1 100
39. The energy sector is the most significant source of CO2 emissions in Mongolia. In 2006, CO2 emissions from solid fuel combustion were 7,925 Gg, of which the energy industry,
Mitigation of Trans-Boundary Air Pollution from Coal-Fired Power Plants in Northeast Asia (TA No. 6371-REG) Final Report
120
manufacturing industry, transportation, commercial, residential, and agricultural sectors emitted 79.8%, 3.8%, 2.1%, 2.7%, 8.5%, and 0.1%, respectively.
40. Fuel combustion activities are the most significant sources of NOx. Within fuel combustion activities, the most significant sources are the energy industries and mobile sources. In 2006, the energy industries and transportation sectors accounted for 88% (energy industries: 47%; transport: 41%) of the NOx emissions from fuel combustion activities in Mongolia.
41. SO2 is not a GHG but its presence in the atmosphere may influence climate. SO2 emissions are directly related to the sulfur content of fuel. The most significant source of SO2 emissions in Mongolia is coal. But sulfur content of the coal in Mongolia is low.
3. GHG and SO2 Mitigation Activities
42. Energy Sector. The analysis of GHG emissions shows that most GHG emissions in Mongolia are from coal combustion. This means that GHG emission mitigation policy should focus on the reduction of coal use through coal substitution. In particular, there is considerable scope to replace fossil fuels by other clean energy resources such as renewable energy resources.
43. Renewable Energy Resources. Mongolia has considerable renewable energy resources, including hydropower and solar energy. It has significant hydropower potential with 3,800 rivers and streams. Based on this potential, the number of small hydropower plants has been increasing during recent years. Large-scale hydro plants are being identified.
44. Hydropower provides a clean alternative source of energy with no direct GHG emissions. It contributes to the reduction of GHG emissions by displacing the electric power that would otherwise have been generated by coal-fired electric power plants. In Mongolia, two hydropower plants, one with a capacity of 11 MW and another with 12 MW, operate as approved CDM projects reducing GHG emissions and generating certified emission reductions.
45. Mongolia has considerable wind energy resources. In the steppe and Govi regions, the annual average wind speed is 4 m/s. Forty-seven percent of Mongolia is classified as territory with the “highest possibility” for wind energy installations. In particular, the southern provinces have wind regimes of 150-200 W/m2 with wind durations of 4,000-4,500 hours per year.
46. It has been estimated that more than 10% of the country has good-to-excellent potential for wind energy applications on a commercial scale. Several wind farm projects with 30-50 MW capacity in various areas of Mongolia are being considered. The objective of these projects is to generate electricity using wind energy sources and to reduce the need for electricity generation by the coal-fired power plants that currently supply the Central Grid of Mongolia, thereby reducing GHG emissions.
47. The total solar energy resources, evaluated as the annual solar radiation on the entire national territory, have been calculated to potentially achieve 2.2 x 1,012 kWh. The potential
Mitigation of Trans-Boundary Air Pollution from Coal-Fired Power Plants in Northeast Asia (TA No. 6371-REG) Final Report
121
solar energy varies from 1,200 kWh/m2/y to 1,600 kWh/m2/y in the different regions of Mongolia.
48. The installation of large-scale, carbon-free, renewable electricity, such as very large-scale PV (VLC-PV) systems in the Govi region of Mongolia, may contribute to both protecting against air pollution and supporting regional development. It is possible to implement pilot research projects in the areas along the railways and consider VLC-PVs in the Mongolian Gobi Desert in the future.
4. Efficient Use of Traditional Energy Resources
49. The primary mitigation potential for Mongolia is to use the existing traditional energy sources, such as coal, more efficiently. Coal is the most important primary energy source because Mongolia has large coal reserves, lacks natural gas, and has insufficient oil reserves.
50. There are around 320 coal deposits and occurrences (80 deposits and 240 occurrences), according to the Geological Information Center of Mongolia. Total geological coal resources are estimated at approximately 150 billion tons, including about 24 billion tons explored.
51. The coal-fired power plants produce approximately 98% of the country’s electrical power energy, and diesel power generators provide 01.4%, and renewable energy sources (hydro, solar, and wind) provide 0.5%.
52. There is huge potential to reduce the GHG emission in the ways of improving efficient use of solid fuels in coal-fired power plants or boilers and the wise electricity consumption of end users. Residential heating is essential for living and manufacturing during the harsh Mongolian winters. The season lasts for eight months and sometimes winter temperatures reach -40-50°C. As a consequence of intensive urbanization over the last few years, the population of urban areas has increased drastically. Therefore, air pollution and the GHG emissions are critical issues due to the increased number of coal-firing household stoves and boilers.
53. The energy sector of Mongolia is the largest contributor to GHG emissions. The cold continental climate and the low energy content of Mongolian coal contribute to a high rate of carbon dioxide (CO2) release when measured on a per capita basis. The estimate for national GHG emissions in 2006 is 15.6 million tons or roughly 6.02 tons per capita. This estimate is larger than that for per capita GHG emissions in the great majority of developing countries and exceeds the world average.
54. The country’s pattern of energy use is determined by its economic growth, large land area, climate regimes, low population density, and significant indigenous resources.
55. Extraction condensing turbines are used in the CHP plants. Part of the steam is extracted from the turbines to meet heat requirements (steam and hot water) and the remaining part of the steam flow is cooled and condensed by using cooling water. Due to harsh, cold climate conditions in winter, heat is an essential energy use. Heat supplies account for 40% of gross energy consumption.
Mitigation of Trans-Boundary Air Pollution from Coal-Fired Power Plants in Northeast Asia (TA No. 6371-REG) Final Report
122
56. The following GHG mitigation options are identified in the energy sector:
i) Energy Supply Sector
Increase renewable options
− Hydropower plants; − Wind farms; and − PV and solar heating.
Improve the efficiency of heating boilers
− Improve the efficiency of existing HOBs; − Install boilers with the new design and high efficiency; and − Convert steam boilers into small capacity thermal power plants.
Improve household stoves and furnaces
− Modernize existing household stoves and furnaces; − Implement the new design for household stoves and furnaces; and − Change fuels for household stoves and furnaces.
Improve coal quality
− Coal beneficiation and − Apply effective mining technology and facilities, including selective mining
and dewatering system coal handling plants.
Improve CHP plants
− Improve efficiency and − Reduce internal use.
ii) Energy Demand Sector
District heating and building environment
− Make building insulation improvements; − Implement improvements of district heating system in buildings; and − Improve lighting efficiency.
Industry
− Improve housekeeping procedures; − Implement motor efficiency improvements; − Improve lighting efficiency; and − Adopt technology changes (e.g., dry processing for cement industry, etc.)
57. The options having the largest potential for GHG mitigation are listed below:
− Coal Beneficiation;
Mitigation of Trans-Boundary Air Pollution from Coal-Fired Power Plants in Northeast Asia (TA No. 6371-REG) Final Report
123
− Combustion Efficiency Improvement; − Reduction of Station’s Own Use (existing plants); − Reduction of Transmission and Distribution Losses; − PVs; − Small Wind Generators; − Biomass Gasifiers; − Small Hydroelectric Projects; − Cogeneration; − Motor Efficiency Improvement; − Fuel Consumption Efficiency Improvement; − Efficient Coal Stoves; − Efficient Lighting; and − Building Insulation Improvement.
58. Taxonomy of options was developed through the screening of the potential mitigation options. CO2 emissions depend on fuel characteristics, and the most effective way to abate them is through the rational use of energy. Therefore, mitigation options to reduce CO2 emissions from the energy sector considered in the assessment may be grouped into two major categories: (1) energy conservation or efficiency improvements and (2) substituting less carbon-intensive energy sources for those that are more carbon-intensive.
59. For each potential mitigation option, the following technical data/characteristics were developed.
− Scope and range of the application; − Availability/commercial readiness; − Potential for GHG mitigation/abatement; and − Current constraints in Mongolia that will inhibit the application of the option,
including financial, institutional, policy, informational, or other constraints.
E. Energy Supply
60. Coal Beneficiation. There exists no provision for coal preparation at mine sites, and as a result, there is no quality control in the supply system. Approximately 70 percent of coal is transported more than 150 km by railway on average. Coal quality often does not meet the minimum standard requirements, and in many cases, emergency situations at the power stations are caused by the low quality of coal. Better quality control at the mines and installation of “selective” crushers and screening equipment has been recommended to reduce the amount of rock and inert material transported to the power stations. Coal washing at the mine site is now common in many countries.
61. This option is already included in the Mongolian Environmental Action Plan. The coal benefaction plan will result in local benefits such as the reduction of ash disposal in residential areas, reduced SOx emissions, and increased coal transportation efficiency.
Mitigation of Trans-Boundary Air Pollution from Coal-Fired Power Plants in Northeast Asia (TA No. 6371-REG) Final Report
124
Combustion of high quality coal at the power plants will increase gross efficiency of power generation and reduce the station’s own use.
62. Station’s “Own Use.” All the thermal power plants in Mongolia are designed for cogeneration; they provide base load electricity and hot water for district heating. Steam from industry is also processed for these purposes. The station’s own use of energy is very high in thermal power plants.
63. This high consumption of electricity for “own use” can be explained mainly by the low coal quality which results in much longer coal mill operating hours and by the high leakage losses in the pipeline which results in high electricity consumption by the pressurizing pumps. Investigations carried out to date indicate that through the installation and proper maintenance of control equipment and improved housekeeping procedures, such as eliminating leaks, repairing insulation, and recovering condensate and boiler blow down, savings in a station’s own use of up to five percent of the gross generation can be achieved. This option is highly feasible, and in fact its implementation has already begun.
64. The emissions reduction impact of this option is assessed to be in the medium range, and its local benefits are considered to be high.
65. Electricity Transmission/Distribution Loss Reduction. The loss of transmission system of the Mongolian Central Energy System is estimated to be relatively high.28 The reduction of losses in the electricity transmission/distribution system involves redesigning and/or rehabilitating the existing old transmission/distribution lines, installing more energy efficient equipment on poles and in power substations, and replacing old and inefficient pole-mounted transformers. On the other hand, nontechnical losses could be reduced through strict monitoring and eliminating electricity theft.
66. District Heating System Losses. District heating systems exist in all major cities and towns in Mongolia. Losses in the heat distribution systems are high, and urgent measures, such as minimizing leakage, replacing valves, and reducing radiation losses are required29. Building losses are also high and residential consumers have no means of regulating temperatures. A number of projects on heating system are implemented in UB city.
67. The proposed CHP5 with 820 MW power generation capacity will be constructed. A feasibility study on CHP5 financed by ADB is being implemented. Potentially, it will replace the existing CHP2, the low pressure system in the CHP3, and lots of HOBs which will greatly mitigate the GHG and SO2 emission.
1. Hydropower Development
68. Hydropower development is one of the best options for electricity supply to remote and limited demand consumers. Currently Taishir (11 MW) and Durgun (12 MW) hydropower plants are starting operation, and more than 20 hydropower sites have been identified, with capacities ranging from 5 MW to 110 MW. This option is moderately feasible in Mongolia. The government of Mongolia has instituted a policy to develop small- and medium-sized hydro 28 The transmission and distribution loss reached 11.7% according to Mongolian Statistical Yearbook 2010. 29 The internal heat use and distribution loss was over 6.5% according to Mongolian Statistical Yearbook 2010.
Mitigation of Trans-Boundary Air Pollution from Coal-Fired Power Plants in Northeast Asia (TA No. 6371-REG) Final Report
125
projects, so policy barriers are low. The emissions reduction impact of this option is high, and its local benefits are expected to outweigh the negative impacts.
2. PV Solar Energy
69. Mongolia is located in a region with abundant sunshine, typically between 2,250 to 3,300 hours each year. Possible targets for the application of solar energy are the families of nomadic herdsmen. During the last ten years, different kinds of small solar-electric units have been introduced into rural households. The PV power generation is a mature technology for small power applications. The PV market is currently very small, but the market growth has been 25% annually internationally. The PV systems have been shown to be the less expensive option when compared to small gasoline generators. At present, small-scale PV systems (10 to 1,000 W) are used in remote areas. It has been assessed that in Mongolia the PV power systems are competitive with conventional energy sources for small power applications for nomadic families.
3. Wind Power Generation
70. Among renewable energy technologies, wind energy has been proven to be the most competitive in terms of cost for the bulk power market internationally. Mongolia has very little experience with wind energy. There have been few systematic assessments of the potential of wind energy resources in Mongolia. According to the available meteorological data prepared by the National Renewable Energy Center, the annual average wind speed in the southeastern part of the country is in the range of 4 to 5 m/s. As in the case of solar energy, there is considerable potential in supplying nomadic livestock herders in the Gobi Desert with small portable wind generation systems. Renewable energy development is included in the Government Action Program as the principal way to provide electricity in remote areas and among nomadic families. Turbine generators (100-150 kW) could be placed in provincial centers in the southern part of Mongolia. The most promising sites should get priority in order to establish the technical and economic feasibility of operating 100-150 kW wind turbine generators in parallel with existing diesel generators. Also, large-scale wind farm projects could be implemented in Mongolia.
4. Bioelectricity System (Biomass Gasifier Technology)
71. Bioelectricity has been shown as a potential and feasible option to meet all the current and projected electricity requirements of rural areas in the majority of developing countries. It is possible to install sustainable biomass-based electricity generation systems in island provinces instead of installing expensive power-generating assets to generate all the electricity required. Electricity can be generated 24/7. The average electricity demand in remote villages in Mongolia is estimated to be around 150 to 250 kW. Approximately 50 remote villages located in the northern part of Mongolia, from a total of 384 rural villages, are potential candidates for the installation of biomass gasifiers.
72. End-use/Demand Side Energy Efficiency Measures Lighting Efficiency Improvement. This demand-side management option concerns replacing inefficient
Mitigation of Trans-Boundary Air Pollution from Coal-Fired Power Plants in Northeast Asia (TA No. 6371-REG) Final Report
126
incandescent light bulbs (ILBs) with energy-efficient compact fluorescent lamps (CFLs). CFLs provide the same amount of light as an incandescent light bulb, but use roughly 70 percent less electricity.
73. Although CFLs are more expensive than ILBs, they are more economical on a lifecycle basis due to savings in electricity costs. The economic feasibility of this option for Mongolia is currently assessed to be in the medium range due to the fact that it is financially accessible only to a limited number of consumers. The emissions reduction impact of this option is assessed to be in the medium range.
74. Building Insulation Improvement. In Mongolia, there is a central heating supply system in bigger towns and Aimag centers. Almost 65 percent of the total energy demand of households and 90 percent of the total energy used in the service sector are for space heating. A study on heat losses found that nearly 40 percent of heat is lost from houses and buildings. The heat losses occur through windows, walls, and doors; design and construction of most multifamily buildings in bigger cities is very similar to buildings found in much of the former Soviet Union.
75. A study of local building standards found that heat demand in multifamily buildings could be reduced by about 60 percent. The feasibility of this option for Mongolia is currently assessed to be in the high to medium range. Policy barriers are assessed to be low because the Government has a policy of encouraging energy savings. The emission reduction impact of this option is assessed to be in the medium range.
76. Motor Efficiency Improvement in Industry. Industry is one of the largest consumers of electricity in Mongolia. Motors and pumps are the main consumers of electricity in the industrial sector. Existing motors and pumps are old, and their efficiencies are very low. An energy audit study for the principal industries shows that there is the potential to improve motor and pump efficiency by more than 20 percent. The emissions reduction impact of this option is assessed to be high.
5. Measures to Ensure the Implementation of the Mitigation Plans
77. The Government has to improve implementation of a monitoring system installation with modern technology in coal-fired power plants. Though the installation of internal monitoring devices does not result directly in emission reduction, it will provide an availability to monitor and assess the emission volumes of air pollutants from power plants.
78. Recommendations and measures to ensure mitigation plan implementation include the following steps:
New emission standards should be adopted, so emissions will be controlled to minimum levels;
All new power plants must be required to control emissions and comply with new emission standards;
The existing power plants emissions should comply with the proposed compliance schedule in the new emission standards;
Mitigation of Trans-Boundary Air Pollution from Coal-Fired Power Plants in Northeast Asia (TA No. 6371-REG) Final Report
127
Current government air pollution mitigation activities in the power sector should be monitored and assessed; and
The proposed new CHP plant in UB should be built as soon as possible so the outdated technologies and inefficient power plants can be phased out.
79. The Law of Air (2010) has the following provisions:
Article 7, Rights and Duties of citizens, economic entities or organizations:
7.1 Citizens, economic entities, or organizations shall have the following rights and duties:
7.1.1. Economic entities and/or organizations shall comply with State Administrative Organization regulations and statutes on air; decree of the local governors of a Duureg/Soum; and requirements of environmental inspectors;
7.1.2. Economic entities and/or organizations shall meet with all legislation on air protection, emission standards, and norms;
7.1.3. Any citizen, economic entity, and/or organization engaged in industrial or service purposes utilizing major stationary sources shall install an internal monitoring system to control the discharge air polluting substances;
7.1.4. Economic entities and/or organizations shall implement internal monitoring in accordance with the environmental monitoring program, as stated in the Detailed Environmental Impact Assessment report;
7.1.5. Economic entities and/or organizations shall provide by a specified date reports and data on their activities for internal monitoring internal control to the local professional service agency in charge of air quality matters, as referred to in the Article 10.5 of this law;
7.1.6. Economic entities and/or organizations shall receive TA and consultancy from professional organizations.
80. But compliance of these law provisions is not satisfactory at present in Mongolia. In addition, the emissions and discharges do not meet with the current laws and standard requirements.
6. Implementation Schedule of Mitigation Plans
81. Since energy supply sector has the highest GHG and SO2 emissions by far in Mongolia, restructuring and modernizing the energy sector should be the top priority. The implementation of the proposed strategies and action plans for mitigating GHG and SO2 emissions are summarized below:
Pass Energy Conservation Law in 2011
Establish new emission standards for coal-fired power plants (2011-2012)
Develop an energy efficiency and conservation action plan in 2011
Establish institutional framework and structure for energy efficiency improvement and SO2 reduction by 2012
Update and revise the Mongolia Energy Master Plan with consideration of promoting energy efficiency and SO2 reduction by 2012
Mitigation of Trans-Boundary Air Pollution from Coal-Fired Power Plants in Northeast Asia (TA No. 6371-REG) Final Report
128
Develop financial incentive policies and programs to encourage energy efficiency projects by 2012
Develop sector specific energy reduction targets for energy intensity sectors 2011-2012
Develop programs to encourage contract energy management and ESCOs by 2012
Implement other demand side energy efficacy actions (from 2012)
Develop a comprehensive strategy for utilization of renewable energy resources by 2012
Build CHP5 in UB by 2015 and CHP2 and CHP3 by 2015
Upgrade UB district heating system by 2015
82. To achieve SO2 emission reduction, requiring FGD device in existing and new coal-fired power plants is the key. The following targets are recommended to systematically install FGD technologies in existing coal-fired power plants:
By 2015, decommission CHP #2 and CHP #3 or install FDG control device on all units in these two CHPs;
By 2025, retrofit CHPs in Erdenet and Darkhan towns with FDG control device;
By 2030, retrofit Dornod CHP plant with FDG control device; and
By 2035, retrofit Umnogobi CHP plant and all other coal-fired power plants with FGD control device.
83. Through implementing strategies and action plans identified above, it is recommended to set the long-term GHG emission target reduce GHG emission intensity by 50% by 2050. Specifically, the intermediate targets are as follows:
Reduce the GHG emission intensity by 15% by 2015
Reduce the GHG emission intensity by 30% by 2020
Reduce the GHG emission intensity by 40% by 2030
Reduce the GHG emission intensity by 50% by 2050
Mitigation of Trans-Boundary Air Pollution from Coal-Fired Power Plants in Northeast Asia (TA No. 6371-REG) Final Report
129
APPENDIX 7: SUMMARY OF EXISTING NATIONAL POLICIES AND PLANS RELATED
TO SO2 AND CO2 FOR MONGOLIA
A. Laws, Agreements, and Regulations on Air Pollution-Related Environmental Laws (SO2, CO2)
1. The Mongolian Law on Air was adopted on 31 March 1995 and several amendments were added through the Parliament discussion. In compliance of this Law and as a main source of air pollution, thermal power plants were obligated to adhere by the following provisions:
1. Article 7. Volume of Air Polluting Substances and Hazardous Impacts
The volume of admissible contents of air polluting substances and the level of hazardous impacts, as well as the volume of air polluting substances and hazardous impacts discharged by various means of transportation and the methods of determination of volume, shall be determined by standards.
The permissible volume of air polluting substances discharged and the hazardous impacts caused by stationary sources of production and services owned and operated by citizens, economic entities, and organizations shall be determined by the Certified Department.
The cumulative volume of air polluting substances discharged into the air and of hazardous impacts caused by all resources shall not exceed the volume determined under this Law.
The procedure for determining the permissible volume referred to in paragraph 2 of this Article shall be adopted by the State Administrative Central Organization in charge of nature and environment.
2. Article 8. Air Pollution Discharge and Hazardous Impacts Permit
Citizens, economic entities, and organizations engaged in production which discharges air polluting substances and causes hazardous impacts and using stationary sources shall obtain recommendations from the Certified Department and a permit from the Soum and Duureg Governors.
The permit shall state the volume of air polluting substances which may be discharged and the hazardous impacts caused by the stationary source as required in this Law, and shall include mitigation measures and other requirements provided by the law to protect the air from pollution and hazardous impacts.
In the event of the unavoidable discharge of air polluting substances and the causing of hazardous impacts for admissible volumes which have no standards, the State Administrative Central Organizations in charge of health and nature and environment may jointly issue a temporary permit based on the characteristics and amount of the substance and its impact on human health and the environment.
Citizens, economic entities, and organizations which have been issued a temporary permit shall submit by the date established in the permit the
Mitigation of Trans-Boundary Air Pollution from Coal-Fired Power Plants in Northeast Asia (TA No. 6371-REG) Final Report
130
standards for the discharge of air polluting substances and the hazardous impacts and have them adopted by the authorized organization.
3. Article 9. Measures for the Critical Increase of Air Pollution and Hazardous
Impacts
In the event of the critical increase of air polluting substances and hazardous impacts caused by disaster, commercial accidents, or other reasons which exceed the level in the standards and become dangerous to human health and the environment, the management of the responsible economic entity and/or organization and the Certified Department shall immediately inform the Aimag, Capital City, Soum, and Duureg Governors and the public.
To reduce air pollution and hazardous impacts, the economic entity or organization indicated in this law or its official shall place the economic entity or organization in an emergency status or suspend its operation, and, if necessary, take measures to protect and evacuate the local residents as provided by the Article 10. Restrictions on Air Pollution Discharge and Hazardous Impacts by the State Administrative Central Organization in charge of nature and environment.
4. Article 10. Restrictions on Air Pollution Discharge and Hazardous Impacts
After receiving from the Certified Department a warning of the possible increase in the volume of air pollution because of natural and climatic conditions, economic entities and organizations shall take measures to reduce the discharge of air polluting substances and hazardous impacts by its stationary sources as described in this Law.
In event of the discharge of air polluting substances by a stationary source of an economic entity or organization where the hazardous impacts prove to be greater than the established limits and the circumstances become dangerous to human health and the environment, state health and environmental inspectors may limit or suspend the activities of the responsible economic entity or organization.
Use of vehicles and other non-stationary sources which discharge air polluting substances in volumes greater than the established limits and cause greater hazardous impacts may be limited by environmental inspectors and authorized police officers according to procedures set up jointly by the State Administrative Central Organization in charge of nature and environment and other respective organizations.
Environmental and health inspectors may submit to authorized organizations a recommendation to stop or to change the commercial operation of an economic entity or organization which repeatedly neglected permissible limits of air polluting substances, hazardous impacts, conditions and requirements stated in the permit. The authorized organization shall review and make an appropriate decision on the recommendation within 30 days.
5. Article 11. Air Protection Requirements during Construction
Standards for permissible limits on the content of air polluting substances and hazardous impacts shall serve as the basis for the selection of the site location, design, construction, beginning operations, expansion, or renovation of
Mitigation of Trans-Boundary Air Pollution from Coal-Fired Power Plants in Northeast Asia (TA No. 6371-REG) Final Report
131
equipment and technology for any building for commercial, service, or other purposes.
Construction of a building for commercial or service purposes which has a potential of extremely hazardous impacts on the air shall be approved by the authorized organization on the basis of the proposals of the local Citizen Representative Khurals and the recommendations of the Certified Organization.
An environmental impact assessment shall be done prior to construction of an economic entity or organization engaged in activities which discharge air polluting substances or causes hazardous impacts.
6. Article 12. Air Protection Requirements for Settled Area Construction
Authorized organizations and officials shall develop a general plan for the location and development of towns, villages, or other settled areas considering the potential changes in air characteristics and the potential hazardous impact.
The plan mentioned in this Law shall be reviewed and licensed by the State Administrative Central Organization in charge of nature and environment.
7. Article 13. Pollution Source Equipment
Citizens, economic entities, and organizations engaged in industries employing a source which discharges air polluting substances into the air and causes hazardous impacts shall install in the source such instruments and equipment to monitor and control the air pollution and clean and reduce the hazardous impacts regardless of the date of the commencement of operations.
The State Administrative Central Organization in charge of a respective industry, Soum and Duureg Governors, and environmental inspectors shall control the installation of air pollution cleaning equipment which reduces hazardous impacts at each source. The aforementioned shall also control the regular operation of the above mentioned facilities.
8. Article 14. Actions to Reduce GHG Discharges
Economic entities and organizations establishing new or extending production or services shall install advanced equipment and technology which permit the discharge of GHGs like hydrogen, uric gas, and nitrous dioxide in volumes compatible with international standards.
If it is determined that discharge of GHGs has increased during a certain year, administrative and territorial unit authorities and the management of relevant economic entities and organizations shall be required to take measures to reduce the discharge of GHGs.
If a situation involving hazardous environmental impacts has arisen because of the increase in volume of GHGs, an environmental inspector may force an economic entity or organization to stop activities which discharge GHGs.
9. Article 15. Ozone Layer Protection
To protect the ozone layer and to prevent hazardous impacts to it, an organization authorized by the Certified Department and by the State Administrative Central Organization in charge of nature and environment shall
Mitigation of Trans-Boundary Air Pollution from Coal-Fired Power Plants in Northeast Asia (TA No. 6371-REG) Final Report
132
monitor the status of the ozone layer and fluctuations in intensity of ultra-violet rays.
The State Administrative Central Organization in charge of nature and environment shall approve a list of substances which have hazardous impacts to the ozone layer.
The customs agency and citizens, economic entities and organizations engaged in production or services shall provide the Central Certified Department information on the production and import of substances included in the list mentioned in this Law.
2. The above-mentioned legal provisions have never been accomplished due to the outdated conditions of power plants and the financial inadequacy to comply with the standard requirements. Current low tariff sets of electric and heating supply weakens the financial independence of power plants as well. Increasing the tariff levels to cover its cost faces hard resistance and social arguments. Specifically due to political reasons, the Government has sometimes forbidden an increase in the energy tariff.
B. Conventions and Programs
1. Environmental Conventions
3. Mongolia has joined several international treaties and conventions on the reduction of air pollution and emissions of GHGs and fulfills its obligations under the following treaties:
United Nations Framework Convention on Climate Change
The Vienna Convention on Protection of Ozone Layer
The Montreal Protocol on Substances, Depleting the Ozone Layer
2. Related Environmental Programs
4. At the national level, the Government of Mongolia has undertaken numerous national programs and action plans in terms of reducing air pollution and emissions of GHGs such as:
National Program Against Air Pollution
National Program for Reduction Waste
Comprehensive National Development Strategy of Mongolia
Mongolian Action Plan for the 21st Century
National Program for Climate Change
5. The National Program against Air Pollution was adopted in 2000 and the National Program for Waste Reduction in Mongolia was approved in 2002, but implementation of these National programs has been prolonged due to lack of financial support.
6. The Mongolian Action Plan for the 21st century was approved by the Government in 1998 and the Comprehensive National Development Strategy was approved by the Mongolian parliament in 2007. Both of these initiatives were endorsed as national declaration
Mitigation of Trans-Boundary Air Pollution from Coal-Fired Power Plants in Northeast Asia (TA No. 6371-REG) Final Report
133
umbrella programs. But because of uncertain funding source, currently these implementation activities have not been able to launch.
7. As for the National Program for Climate Change, the Government formulates some amendments and revisions to this program and after adaptation of additional amendments, the program will be endorsed with guarantees for financial source and action planning.
8. In order to solve the air pollution of UB, the Government has developed a “Smokeless UB” program in March 2010 and submitted it under parliament discussion for approval. According to the program, the best solution to reduce air pollution is by building more apartment blocks and as a major source of air pollution, Ger districts will be turned into apartment districts. Although aspects of energy efficiency improvement and rehabilitation of power plants were not represented in the scope of the program planning, the project of building new the Power Plant V in UB was included in the implementation framework.
C. Other Related Standards
9. In Mongolia, the interested party shall develop draft standards for relevant sectors and submit it for consideration to the National Center for Standardization and Metrology. After reviewing the draft version of the standard, the National Center for Standardization and Metrology transfers it to the National Committee for approval. The National Committee consists of a number of experts representing various economic sectors.
10. In order to monitor coal-fired power plant emissions, the standard on “Maximum acceptable level and measuring method of air pollutants in the exhaust gases from the steam and hot water boilers of TPP and Thermal stations” of Mongolia was approved in 2008.
11. Application of the standard requirements has not commenced yet because internal control systems which monitor air pollution are not installed in state-owned TPPs. In other words, because of very low winter temperatures and the lack of financial support for investment needed for TPPs to replace outdated equipment from the Soviet Union era, the Government continues to allow dangerous amounts of emissions into the air. Though nowadays power plants discharge air polluting substances in volumes greater than the established limits, no penalty or fine imposing system for air pollution is imposed in Mongolia. Following the Law on Air, the highest fine rate is defined as U.S. $180. Therefore the fine/penalty system does not take effect as a financial leverage for economic entities to reduce air pollution and strengthen environmental protection. In case of enforcing the standards with a high fine for air pollution emissions, state-owned power plants will not be affected greatly because the fine amount will be paid from the state budget.
D. Institutional Arrangements
1. Lead Ministries on Air Pollution and Climate Change
12. Currently, the lead ministries on air pollution and climate change includes the following: MNET, MMRE, Ministry of Food and Agriculture of Mongolia, Ministry of Roads, Transportation, Construction & Urban Development of Mongolia, and National Agency for Meteorology, Hydrology and Environment Monitoring.
Mitigation of Trans-Boundary Air Pollution from Coal-Fired Power Plants in Northeast Asia (TA No. 6371-REG) Final Report
134
13. In the current situation, only the MNET works intensively on policy formulation, development, and implementation of reducing air pollution and monitoring of air quality. It is unfortunate that other ministries do not pay much attention to combating air pollution and improving air quality. Particularly, the MMRE does not recognize the urgent need of equipping power plants with internal monitoring systems and reducing hazardous and toxic gas emissions.
14. The MNET is a state administrational organization charged with improving the policy formulation, legislation, implementation, and monitoring of air pollution and environmental protection areas. The Department of Air Quality manages its activities as a component agency of MNET, providing management for provincial Departments of Air Quality.
1. National Arrangements on National Committee on Climate Change
15. The National Committee on Air Pollution Reduction was founded in 2007 and headed by MMRE. It consists of representatives from related ministries, agents, and research and investigation Institutes.
2. Climate Change Office
16. Since 2008, the Climate Change Coordination Office of Mongolia manages its activity with a focus to create and develop international cooperation on climate change. At the national level, this office formulates approaches, documentation, and takes measures to strengthen the National Capacity for adaptation to climate change.
Mitigation of Trans-Boundary Air Pollution from Coal-Fired Power Plants in Northeast Asia (TA No. 6371-REG) Final Report
135
APPENDIX 8: ASSESSMENT OF THE FGD TECHNOLOGY AT CHANGSHU POWER PLANT
1. Project Overview
17. There are four 300 MW power generation units in the Changshu Power Plant (CPP), which were put into operation in 1990s. The total installed capacity of the power plant is 1,200 MW. However, flue gas desulphurization (FGD) system was not installed at the time of power plant construction. The design coal of the power plant is bituminous coal. The coal analysis is shown in Table 1.
Table 1: Coal Analysis
Item Unit Design coal Backup coal
1. Industrial analysis
Mt % 8.8 10.5
Aar % 17.15 9.66
Var % 24.11 24.50
Q ar,net kJ/kg 22064 23655
2. Elementary analysis
Car % 57.63 63.04
Har % 3.73 3.63
Oar % 10.80 11.70
Nar % 1.17 0.78
St,ar % 0.82 0.69
3. Ash fusion point
DT °T 1170 1250
ST °C 1260 1350
FT °T 1350 1400
4. Coal ash composition
SiO2 % 53.12 51.84
CaO % 5.52 2.97
MgO % 1.02 0.98
Fe2O3 % 6.29 14.23
Al2O3 % 25.61 23.98
K2O % 1.20 1.27
Na2O % 0.22 0.13
TiO2 % 1.07 0.94
SO3 % 3.85 1.72 Source: CPP
Mitigation of Trans-Boundary Air Pollution from Coal-Fired Power Plants in Northeast Asia (TA No. 6371-REG) Final Report
136
18. The process water quality analysis of FGD device is shown in Table 2:
Table 2: Process Water Quality Analysis
No. Item Tested Unit Result
1 Total solid mg/L 162.8
2 Suspended solid mg/L 4.4
3 pH (25℃) 7.92
4 Total alkalinity mmol/L 1.87
5 CO32- mmol/L /
6 Total hardness mmol/L 2.12
7 Permanent hardness mmol/L 0.25
8 Humate mmol/L /
9 Ca2+ mg/L 35.08
10 Fe mg/L 0.0073
11 Na+ mg/L 6.33
12 Mg2+ mg/L 6.50
13 K+ mg/L 1.53
14 Sulphate mg/L 23.38
15 Chloride mg/L 10.50
16 Dissolved solid mg/L 158.40
17 SiO2 mg/L 8.50
18 Electric conductivity us/cm 231
19 OH- mmol/L 0
20 HCO3- mmol/L 114.11
21 Temporary hardness mmol/L 1.87
22 Negative hardness mmol/L /
23 Chemical oxygen demand (COD) mg/L 0.759
Source: CPP
19. The FGD system of the 2 × 300 MW unit in the CPP power plant was proposed as technology transfer project and the flue gas emission follows the “Emission Standard of Air Pollutants for Thermal Power Plants” (GB13223-2003). The general contract of FGD device was signed in March 2005, and the two FGD systems were commissioned in September
Mitigation of Trans-Boundary Air Pollution from Coal-Fired Power Plants in Northeast Asia (TA No. 6371-REG) Final Report
137
2006 and April 2007, respectively. The efficiency of FGD is 90% and emission per year of SO2 is less than 1,539 tons.
20. The FGD project was constructed via the mode of engineering, procurement, and construction (EPC), including the required technological design, device selection, procurement, transportation and storage, manufacture and installation, design of the buildings, construction, debugging, testing and inspection, commissioning, assessment and acceptance, eliminating defects, training and final delivery into production, all of which should meet the normal operation of the units with FGD device, as well as the demolition and recovery of existing facilities.
2. Technical Process of FGD System
21. The FGD in the CPP Power Plant adopts limestone-gypsum wet process, and it is designed to treat 100% of the flue gas volume. The scheme of “one boiler with one FGD” is adopted. The flue gas from boiler is induced out through flue gas collector and driven into gas-to-gas heater (GGH) to heat the desulphurized flue gas by blowing fan. The flue gas enters absorption tower of FGD system to be desulphurized and its temperature decreased from 120℃ to 90℃. The desulphurized flue gas returns to GGH to be heated after being demisted by the demister on the top of FGD tower, and the temperature of the clean flue gas will be heated from 47.1°C to more than 80°C (design condition) and finally released to the atmosphere through the stack.
22. FGD systems mainly include limestone receiving and storage system, limestone slurry preparation system, flue gas system, SO2 absorption system, oxidation air system, GGH, gypsum slurry dewatering system, emergency slurry storage system, water supply and drainage system, compressed air system, electrical system, automatic control system, high voltage alternating current and air-conditioning, communication engineering, and fire fighting and fire alarm system.
2.1 System Configuration
2.1.1 Limestone Slurry Preparation System
23. The limestone slurry plant is designed to be fit for all power generation units, including four power generation units, each with 300 MW of power generation capacity. The scheme of wet limestone slurry is adopted. Two mills (horizontal wet ball mill) are installed with 10 ton/hour of slurry capacity for each mill. The limestone from the mill should meet the requirement of SO2 absorption system and the particle diameter should be less than 0.044 mm (90% of which can pass 325 mesh screen).
24. The FDG project utilizes limestone as the desulphurization adsorbent, which is supplied by the nearby limestone mine. The particle diameters are less than 20 mm. The limestone-gypsum wet FGD technology requires that CaO content in limestone should not be less than 52% and MgO content should not be more than 2%.
25. Limestone slurry preparation process: Limestone bunker is a flat-bottomed bunker. Three conical unloading openings are designed at the bottom of the bunker (set up two first),
Mitigation of Trans-Boundary Air Pollution from Coal-Fired Power Plants in Northeast Asia (TA No. 6371-REG) Final Report
138
and each unloading opening is matched with one wet milling system. Each wet milling system consists of weigh feeder, horizontal wet ball mill, wet milling slurry circulating pool, wet milling slurry circulating pump and limestone slurry swirler, etc. The prepared solid content is about 30%. Limestone slurry which has a particle diameter of less than 325 mesh flows into limestone slurry storage tank where it is stored and sent to absorption tower by a slurry pump.
2.1.2 Flue Gas System
26. The blowing fan is arranged in the upstream side of untreated flue gas of absorption tower by the flue gas system in order to ensure positive pressure throughout the FGD device operation, at the same time, to avoid low-temperature flue gas corrosion to blowing fan.
27. The untreated flue gas from boiler will enter into the blowing fan and GGH after passing through the double baffles. The untreated flue gas temperature, under the design conditions, is decreased from 124°C to 88°C, and then desulphurization reaction will occur in absorption tower after untreated flue gas is cooled. In absorption tower, flue gas should have sufficient contact reaction with limestone slurry so more SO2 can be removed, and the gas temperature further drops to 46.8°C. After being demisted by the tower top demister, desulphurized flue gas will return to GGH and be heated to more than 80°C, and finally be released to atmosphere through double baffle of the clean flue gas and then the stack.
2.1.3 SO2 Absorption System
28. The SO2 absorption system is the core of a FGD system including absorption tower, demister, limestone slurry circulation pump and oxidation blower, etc.
29. Absorption tower is a counter-current spray absorber. Its diameter is 12 m, and the tower height is about 40 m. The basement is slurry pond, while the upper is spray washing area where three spray nozzles are designed. Flue gas flows through the spray zone from bottom to top and is released from absorption tower top after being washed and desulphurized. In order to avoid forming precipitation between flue gas and spray liquid in the inlet of gas-liquid contact zone, spraying by process water should be adopted and the inwall of absorption tower inlet needs to be washed.
30. The absorption tower body is steel structure with glass flake epoxy resin lining. Each absorption tower adopts three centrifugal circulation slurry pumps, which are all in operation, and two Roots-type forced oxidation blowers, one of which is in operation and another one is for back up.
31. The absorption tower needs to be repaired when FGD device is not in service or during emergency outage. The slurry in absorption tower needs to be ejected by gypsum excavating pump and stored in emergency storage tank.
32. A horizontal radial arrangement of the four side-entry agitators in the slurry pond is designed, which at the bottom of absorption tower is to keep flow regime of the slurry, so that the effective substance of FGD (solid particles of CaCO3) can also keep a uniform suspension state in the slurry, to ensure slurry's absorption and reaction capacity forming SO2.
Mitigation of Trans-Boundary Air Pollution from Coal-Fired Power Plants in Northeast Asia (TA No. 6371-REG) Final Report
139
2.1.4 Gypsum Dehydration System
33. The main subsystems of the gypsum dehydration system and wastewater treatment system include gypsum excavating pump system, gypsum swirler station (primary dewatering system), vacuum belt filter (secondary dewatering system) and wastewater swirler station.
34. Two gypsum excavating pumps (one for operation and one for back up) need to be designed for each absorption tower and installed outdoor in order to transport gypsum slurry from absorption towers to gypsum cyclone stations. The gypsum excavating pumps can also discharge slurry in absorption towers to emergency slurry tanks.
35. A gypsum cyclone station is equipped with an absorption tower and installed on the top of the gypsum building. The slurry, which contains about 50% of solid by concentrating in the gypsum cyclone station, directly flows into the vacuum belt dehydrator for secondary dehydration, while the overflow which contains 3% to 5% of solid flows into the wastewater cyclone station.
36. Underflow liquid of the gypsum swirler from the primary dewatering system will directly flow into the vacuum belt dehydrator to be filtered and washed and result in the main by-product -- gypsum. The capacity of vacuum belt dehydrator is designed at 150% of gypsum produced by FGD on condition that two boilers combust designed coal on the boiler maximum continuous rate (BMCR) working conditions. Two systems are put into operation when four boilers are under the designed BMCR working conditions. The quality of dewatered gypsum is designed to have the humidity less than 10% and amount of Cl- less than 100 ppm.
37. The overflow from the gypsum cyclone station will flow into the feed tray of the wastewater cyclone station and infiltrate into the wastewater station by loading pump for cyclone separation again, so that overflowing liquid that contains 3% of solid and underflow liquid that contains 10% of solid are obtained. After the overflow enters the wastewater tank, it is sent to the ash forebay of the power plant. Underflow liquid enters into filtrate water tank and returns to FGD device for recycling.
38. There is a gypsum storage room for the two FGD systems, and its volume is designed in accordance with the amount of gypsum produced by the two boilers that run for seven days (24 hours/day) under the BMCR working conditions. The gypsum storage room is configured with forklift and load-out facilities of gypsum loading vehicle. The output of gypsum is about 14.83 ton/hour. Gypsum is used as cement additives and gypsum building products.
2.1.5 Electrical System
39. The total electric load of the two FGD units is about 8,837 kVA, in which the maximum single load is from the FGD blower fan with a capacity of 2,500 kW/unit. A special electric controlled building is built in the FGD zone based on the relatively independent features of the FGD device.
40. The FGD project is a major modernization and expansion of the existing plant. The FGD device, as a component of the plant, has its power supplied by the Plant. The power
Mitigation of Trans-Boundary Air Pollution from Coal-Fired Power Plants in Northeast Asia (TA No. 6371-REG) Final Report
140
source of the FGD device is from a 6-kV auxiliary switchgear. According to the calculation, the capacity of high voltage transformer meets the technical requirement of the FGD device.
41. The system of 380/220V is an earthed neutral system, in which power and lighting systems share a low voltaic transformer. Two-stage FGD of 380/220 V is set for low voltage and power supply respectively by two low voltage dry transformers. The interconnection switch is set for two-stage FGD of 380/220 V and manually shifts between the two stages.
2.1.6 Thermodynamic Instrument and Control System
42. As per the provisions of the “Design Codes for Thermal Power Plant” (DL5000-2000), this project establishes an independent centralized control room, which adopts the Decentralized Control System (DCS) to monitor and control these two FGD systems.
43. The DCS is composed of five operator stations, an engineer station, a redundant data highway and a controller. The I/O point scale of the FGD decentralized control system has about 3,000 points according to the formation of the FGD system.
44. The control scope of the DCS includes a limestone slurry preparation system, an absorption tower system, a blower fan system, an oxidation blower system and a gypsum swirler system. The work for controlling the FGD system can be done in the FGD control room by means of the DCS.
45. The DCS includes a FGD data acquisition system (DAS), modulating control system (MCS), and sequence control system (SCS).
2.1.7 Piping System
46. The piping system (with various supports and hangers) is designed to bear various loads and stresses. Displacement of thermal expansion and stress of the main pipelines are calculated. In addition, it is ensured that force and moment of pipeline acting on the equipment are within the required range by each equipment manufacturer. All piping systems are designed to include high point exhaust and low point drainage. Non-lining pipelines are connected by welding, while lining pipelines by flange.
2.1.8 Thermal Insulation and Anticorrosion
47. The flue gas pass adopts prefabricated insulation layer for thermal insulation and the structure of insulating layer adopts horizontal and vertical lapped manner of adjacent insulation layer. The insulating layer is covered with coating layer. The absorption tower, without any thermal insulation measure, can also ensure stable technical parameters and successful internal reaction process during normal operation.
48. All flues gas passes of the FGD device are made of steel plates. The flue gas pass of untreated flue gas ahead of the GGH inlet does not need to be treated with anticorrossion process because of the higher flue gas temperature. The flue gas passing the GGH outlet is close to the acid dewpoint due to the lower flue gas temperature (down to 100℃). Glass flake resin coating is adopted on the non-moving parts where they have contact with flue gas. The
Mitigation of Trans-Boundary Air Pollution from Coal-Fired Power Plants in Northeast Asia (TA No. 6371-REG) Final Report
141
GGH non-moving component and all flue gas passes of clean flue gas behind the outlet of the absorption tower are coated with glass flake resin for anticorrosion.
49. The two power generation units share a 240 m tall stack with no anti-corrosion measure after FGD.
50. Due to strong corrosion and high solid content of the slurry, all slurry pipelines adopt rubber carbon steel pipe to become corrosion resistant and abrasion-proof, as well as prevent deposition of solids and block up. Rubber pipeline also has good thermal insulating property.
51. The absorption tower is cylindrical, the tower shell is made of carbon steel, and the inner surface adopts glass flake resin lining for anticorrosion.
2.2 Working Conditions of the System
2.2.1 Power Generation Capacity
52. The main parameters of the power plant are summarized as follows: i) capacity of the units: 300 MW; ii) BMCR: 1,025 ton/hour; and iii) designed volume of flue gas (hygrometric state): 1,214,854 Nm3/h.
2.2.2 Coal Property
53. Comparison of designed property value and actual value of the coal fired is shown in Table 3.
Table 3: Designed Value and Actual Value of Coal Property
Item Unit Designed Value
Checking Value
Actual Value
Elementary analysis
Car Average Value wt-% 57.63 63.04 52.05
Har Average Value wt-% 3.63 3.63 3.53
Oar Average value wt-% 10.8 11.70 5.04
Nar Average value wt-% 1.17 0.78 1.10
Sar Average value wt-% 0.82 0.69 0.73
Technical analysis
Vdaf Average value wt-% 24.11 24.5 22.16
Aar Average value wt-% 17.15 9.66 29.55
Mar Average value wt-% 8.8 10.5 8.0
Qnet,ar Average value kJ/kg 22,064 23,655 20,607
Source: CPP
54. It can be concluded from Table 3 that ash contents of fired coal are higher than the designed value. The net calorific values are lower than the designed values.
Mitigation of Trans-Boundary Air Pollution from Coal-Fired Power Plants in Northeast Asia (TA No. 6371-REG) Final Report
142
2.2.3 Working Condition and Quality of Flue Gas
55. Comparison between the performance acceptance value and designed value of the FGD system is shown in Table 4.
Table 4: Working Conditions of the Flue Gas
Item Designed Value Acceptance Test
Value of NO.1 Unit
Acceptance Test Value of NO.2
Unit
Unit output (MW) 300 300 192.9
Blower
fan
Volume of flue gas (Nm3/h) (dry) 1,123,511 - 1,096,159
Inlet pressure (Pa) - 1,864 -
Inlet temperature (℃) 125 - -
Outlet pressure (Pa) 3,400 68 2,540
Electric current (A) 323 390.8 -
Power (kW) 2,800 40.8 -
GGH
Untreated side
Outlet pressure (Pa) - - -
Outlet temperature (℃) Manufacturer - -
Clean side
Outlet pressure (Pa) Labeled - -
Outlet temperature (℃) Networking >80 94/86
Absorp- tion tower
Outlet pressure (Pa) - 97
Outlet temperature (°C) 60 56
Total pressure loss of the FGD device (Pa) <3,400 2,175
GGH pressure loss (Pa) 1,000 -
Pressure loss of inner absorption tower (Pa) 1,200 -
Pressure loss of flue (Pa) 1,200/1,100 -
Source: Consultant estimates
56. According to the on-site inspection, the bypass baffle of No.1 unit is closed, and the actual power generation was 240 MW, lower than the rated output of 300 MW. The amount of treated flue gas is 672,996 m3/hour. The output of the blowing fan is much higher than the rated value, which can overcome the increased resistance caused by abnormal working condition. Pressure loss of the inner absorption tower is lower than the designed value, while the GGH pressure loss is higher than the designed value. The outlet flue gas temperature is over 80°C, reaching the designed value. No. 2 unit was out of service.
57. The parameters of No. 1 unit flue gas are shown in Table 5.
Mitigation of Trans-Boundary Air Pollution from Coal-Fired Power Plants in Northeast Asia (TA No. 6371-REG) Final Report
143
Table 5: Main Parameters of Flue Gas of No.1 Unit
Item Designed Value
Acceptance Test Value On-site Inspection
Inlet of FGD
device
Smoke and dust (mg/Nm3) 200 192.9 205.8
Nitrogen oxide (NO2) (mg/Nm3) - - -
SO2 (mg/Nm3) 2,132 1,864 2,831
Oxygen content (%) 6.09 - 6.66
Outlet of FGD
device
Smoke and dust (mg/Nm3) <200 68 99.4
Nitrogen oxide (NO2) (mg/Nm3) - 390.8 405
SO2 (mg/Nm3) dry 6% oxygen 90 40.8 110.3
Source: Consultant estimates
58. It can be seen from Table 5 that the dust concentration of flue gas at the inlet of No.1 FGD device is over the designed average value. During the acceptance test period, the average concentration of SO2 at the FGD device inlet is 1,864 mg/Nm3, which is less than the designed value. According to the on-site inspection, the average concentration of SO2 in FGD device inlet is 2,831 mg/Nm3, which exceeds the designed average value (2,132 mg/Nm3) and results in the emission concentration of SO2 of 110.3 mg/Nm3, which exceeds the designed value of 90 mg/Nm3. The FGD efficiency reaches 95.7%.
2.3 FGD System Performance
59. Table 6 summarizes the main parameters and performance of No.1 desulfurizer.
Table 6: Main Parameters and Performance of No.1 FGD
Tested Item Unit Guaranteed or Design
Value Performance
Test Value Field
Observation
Desulfurization efficiency
100% load % ≥95.7 97.3 -
80% load % ≥95.7 98.0 96.1
Concentration of untreated fume SO2
100% load mg/m3
2,132 1,505 -
80% load - - 2,831
Temperature of clean fume
100% load °C ≥80 86 -
80% load °C - 80 81
Tested Item Unit Guaranteed or Design
Value Performance
Test Value Field
Observation
Temperature of 100% load °C 125 136 -
Mitigation of Trans-Boundary Air Pollution from Coal-Fired Power Plants in Northeast Asia (TA No. 6371-REG) Final Report
144
Tested Item Unit Guaranteed or Design
Value Performance
Test Value Field
Observation
untreated fume 80% load °C 125 128 127
Mass concentration of
clean fume smoke
100% load mg/m3 - 99.4 -
80% load mg/m3 - 76.3 60
Mass concentration of untreated fume
smoke
100% load mg/m3 200 192.9 -
80% load mg/m3 200 131.0 203
Efficiency of dust collection
100% load % - 48.4 -
80% load % - 41.8 70
Desulphurization system
pressure drop
100% load Pa ≤3,400 2175 -
80% load Pa - - 2,744
Power consumption
100% load kWh/h ≤4,456 3,608.6 -
80% load kWh/h - 3,048.8 3,533
Process water consumption 100% load ton/hour 40.36 32.12 -
Mitigation of Trans-Boundary Air Pollution from Coal-Fired Power Plants in Northeast Asia (TA No. 6371-REG) Final Report
145
Tested Item Unit Guaranteed or Design
Value Performance
Test Value Field
Observation
Limestone size pump dB ≤85 74.0 -
Gypsum size discharge pump dB ≤85 83.8 -
Absorber tower size agitator dB ≤85 82.9 -
Process water pump dB ≤85 81.0 -
Control room dB - 61.2 -
Outside of limestone mill room dB ≤85 84.0 -
Gypsum swirler dB ≤85 74.7 -
Flux of untreated fume
100% load m3/h 1,130,170 1,096,159 -
80% load m3/h - 845,311 659,798
Flux of clean fume
100% load m3/h - 1,102,476 -
80% load m3/h - 850,239 -
Moisture content of
untreated fume
100% load % - 6.99 -
80% load % - 5.77 -
Moisture content of clean
fume
100% load % - 11.68 -
80% load % - 10.38 -
Limestone Quality
Degree of purity % 90 94.6 94.2 -
CaO % - 53.0 52.8 -
MgO % - 0.32 0.66 -
325 meshes passing rate % 90 95.6 95.2 -
Limestone size density kg/m3 - 1,217.7 1,210.1 -
Absorber tower size analysis
pH / - 5.52 5.69 5.7
Size density kg/m3 - 1,114.5 1,098.4 -
Cl- mg/l - 9,993.4 10,599 -
Source: Consultant estimates
60. It can be concluded from Table 6 that the parameters of the FGD system meet the design requirements. The FGD efficiencies during the performance test and field observation period are 97.3% and 96.1% respectively, power consumption is 3,608.6 kWh/h and 3,533 kWh/h respectively, total consumption of process water is 32.12 ton/hour (performance test value), limestone consumption is 2.62 ton/hour and 4.3 ton/hour respectively, all of which meet the requirements of performance guarantee values. However, the noise levels of the three circulation pumps exceed the design values.
Mitigation of Trans-Boundary Air Pollution from Coal-Fired Power Plants in Northeast Asia (TA No. 6371-REG) Final Report
146
2.4 Process Assessment and Recommendations
2.4.1 Process Assessment
61. The process design of the FGD system is technically sound. The system configuration from limestone charging to gypsum dehydration is complete. Equipment selection complies with the design requirement. The space for the four FGD systems has been reserved.
62. The power generation units were put into operation without reserving space for FGD systems. Through rearrangement of existing equipment, space was made for the two FGD units. Generally the layout of equipment is reasonable and compact, complying with relevant regulations of operation, equipment repair, transportation and fire fighting.
63. The equipment performance and quality of major equipment selection and configuration are acceptable. Both import and domestic equipment is used in the FGD systems.
64. The automation of the system is very high. The parameters of major equipment and ancillary equipment on the site are input to the DCS system. Operating staff can start, monitor and stop the equipment and system in the master control room.
65. The desulphurization booster fan adopts movable vane adjustable axial flow fan, which contributes to energy-saving and cost-reduction.
66. Part of flue design is cylinder structure, which can save steel and reduce project cost.
67. Wet-type outlet circulation tank is designed as underground tank, which can expand volume and save space. Vertical pump is adopted and equipment such as electrically operated entrance gate is reduced, which reduces investment as well as maintenance work.
68. The configuration of gas analysis meter is good. SO2 analysis meters are installed at the FGD inlet, outlet and the stack inlet. The DCS control screen shows the desulfurization efficiency of FGD device and overall desulfurization degree including branch road fume.
2.4.2 Recommendations
69. For field observation of No. 1 Unit, under the working condition of 241 MW and after FGD closing bypass damper, the parameters of the desulfurizer had pressure drops of 950 Pa of GGH on the untreated flue gas side, and 804 Pa on the clean flue gas side. The total GGH resistance is 1,754 Pa, which indicates that GGH bears relatively high resistance due to ash deposition. Under this condition, when the unit is operated at full load, it is difficult for the desulphurization system to treat all volume of flue gas and it is also a potential safety hazard.
70. The following recommendations are made: i) The air source of soot blower should be changed from compressed air to steam of about 0.9 MPa to improve soot blowing efficiency and effectiveness of GGH. ii) Since the height of heat exchanger is 450 mm, one-side blowing capacity is limited. A soot blower is recommended to be installed at the lower part of GGH to enhance dynamics of blowing heat exchanger, so as to reduce GGH resistance, save power consumption of desulphurization and improve FGD reliability and safety.
Mitigation of Trans-Boundary Air Pollution from Coal-Fired Power Plants in Northeast Asia (TA No. 6371-REG) Final Report
147
71. The following measures are also recommended: i) Open the boiler stack wind system during suspension of main engine; ii) Conduct quick-opening, main protection and air-tight test to the bypass damper of desulfurizer; iii) Observe the impact of bypass damper quick opening on negative pressure of boiler furnace. The bypass damper should be opened and closed regularly to ensure its reliability.
72. Currently the pH meter for absorber tower is installed in front of the dehydration house swirler. Before dehydration of gypsum, pH value in the tower is unable to display, thus operators on duty cannot effectively control the pH value. It is recommended to install the pH meter on the circulation line of the outlet return tower of gypsum discharge pump. The gypsum discharge pump should be started before smoke to circulate in the tower to show pH value.
73. Desulphurization system sampling and chemical examination analytical work should be further reinforced. For example, gypsum qualitative analysis should be conducted once a week and chemical examination frequency of limestone material should be increased appropriately.
3. Major Equipment for Desulphurization
3.1 Brief Introduction of Equipment
74. The basic information of the major FGD equipment is shown in Table 7.
Table 7: Conditions of FGD Major Equipment
Name Country of Origin Quantity Specification Structure
Absorber tower China 2 Φ12 m×41.72m Carbon steel
Spray nozzle 312 90~110m3/h Helix
Demister Italy 2 PP wave pattern
Demister spray nozzle Italy 2 PP
GGH United Kingdom 2 F=16200m2 Carbon steel
Auxiliary air blower China 2 Q=1774800 m3/h P=3400 Pa
Movable vane adjustable axial
flow fan
Oxidation fan China 4 Q=4800 m3/h P=140 kPa Roots blower
Circulation pump Germany 6 Q=5900~5200 m3/h H=22.5~25.6 m
Horizontal centrifugal
pump
Flue gas damper China 6 4.5 m×9.2m 6.6 m×5m 6.1 m×5m
Louver double dampers
Absorber tower agitator United States 8 N=22kW Spooning
Mitigation of Trans-Boundary Air Pollution from Coal-Fired Power Plants in Northeast Asia (TA No. 6371-REG) Final Report
148
Name Country of Origin Quantity Specification Structure
Mill China 2 Φ2400 mm×5800mm
Gypsum hydrocyclone South Africa 2 Q=35.7 t/h
Wastewater hydrocyclone South Africa 1 Q=25.7 m3/h
Dehydrator China 2 Q=21.9 t/h
Fume automatic monitoring system China 2
Gas system anticorrosion China 2 Scale anticorrosion
Equipment localization rate (calculated in terms of price ratio)
Absorption Tower
75. The spray void tower is adopted by the absorption tower of the FGD device, which is equipped with agitator, oxidation air distribution system, spray layer, demister and anticorrosive lining. The relevant technical specifications are listed below:
Volume of smoke of the absorption tower inlet: 1,611,844 m3/h (wet, design condition)
Volume of smoke of the absorption tower outlet: 1,470,829 m3/h (wet, design condition)
Ca/S: 1.03
Diameter of the slurry pool of the absorption tower: 12 m (inner diameter) Diameter of the absorption tower: 12 m (inner diameter) Height of the slurry pool: 12 m Height of the absorption tower: 41.72 m (total height)
Volume of the slurry pool: 1,356 m3
Blower Fan
Structural form: Movable vane adjustable axial stream mode Main parameter: design flow: 1,774,800 m3/h (wet) Design head pressure: 3,400 Pa Efficiency: 87.31% Shell: Q235-A Vane wheel: 15 MnV Vane: 15 MnV Main shaft: 42 CrM0 Capacity of motor: N=2,800 kW, 6,000 V
Mitigation of Trans-Boundary Air Pollution from Coal-Fired Power Plants in Northeast Asia (TA No. 6371-REG) Final Report
149
Motor type: YKK800-8 Cooling mode of motor: air cooling Gross weight of the blower fan and motor: 55 tons
76. Auxiliary equipment: the blower fan is equipped with independent fluid control oil station and lubricating oil station.
Oxidation Fan
Structure: Roots blower Main parameter: air capacity: 4,800 Nm3/h Pressure: 140 kPa Capacity of motor: 250 KW 6,000 V Outlet temperature: over 100°C
Slurry Circulation Pump
77. The slurry circulation pump adopts unaflow, single-stage and unplugged horizontal shaft centrifugal pump. The technical specifications of circulation pump are listed below:
Pattern: Unaflow, single-stage and unplugged horizontal centrifugal pump, three/tower. Main parameter: The flow for each of the three pumps is 5900/5270/5200 m3/h, respectively. The head for each of the three pumps is 22.5/23.5/25.6 m, respectively. The power for each of the three pumps is 560/560/560 kW 6000V, respectively.
Gypsum Swirler
Quantity: 2 Main parameter: processing capacity: 35.78 t/h (water content ratio: 80%) Solid content at the inlet: 20% Solid content of the base flow: 50% Solid content of the overflow: 5.45%
GGH
Main parameter: Temperature of the original flue gas (inlet/outlet): 126.0℃/91.0℃ Temperature of the clean flue gas (inlet/outlet): 47.1°C/80°C Leakage ratio (from original flue gas to clean flue gas): < 1% Diameter of rotor: 11,800 mm Heating area: 16,200 m2
Mitigation of Trans-Boundary Air Pollution from Coal-Fired Power Plants in Northeast Asia (TA No. 6371-REG) Final Report
150
Heat exchange components: Enameling porcelain steel with a carbon content <0.08%; the thickness of heat exchange component is 1.2 mm (including enamel coating); the coating thickness of enamel is 0.2 mm (one-sided). The weight of GGH: 206 t
78. The technical performance specifications of each GGH auxiliary equipment are listed below:
High-pressure washing water pump: Q=7 m3/h, △P=10 MPa Low leakage blower fan: Q=36,600 Nm3/h, △P=6,000 Pa Seal fan: Q=1,500 Nm3/h, △P=8,000 Pa Soot blower: fully retractable
Wet Ball Mill
Quantity: 2 Specification: Ф2,400 mm×5,800 mm Capacity of motor: 380 kW 6,000V Output: 10 t/h
Vacuum Belt Dehydrator
Quantity: 2 Output: 21.9 t/h (water content of gypsum is 10%) Water content of the gypsum inlet: 50% Water content of the gypsum outlet: <10%
3.2 Maintenance of Equipment
79. Since the operation of the FGD device, major equipment has been generally in stable and propitious operation. The main problems are as follows: i) The quality of original mechanical seal in some pumps is unreliable and the service life is short; ii) The deviation between densimeter and actual measurement is relatively big; iii) It is easy for gypsum to accumulate and block up at the feed opening of vacuum leather belt dehydrator; iv) The quality of rotational flow matter at gypsum hydrocyclone station is unreliable and it often ruptures; v) The output of gypsum discharge pump cannot be matched with the gypsum cyclone station; vi) Booster fan load cannot be regulated with the variation of unit load automatically, etc.
3.3 Technological Improvement for Equipment
80. In the light of issues identified during operation of the desulfurizer, the CPP power plant adopts technological improvement to major equipment, achieving satisfactory effectiveness.
Mitigation of Trans-Boundary Air Pollution from Coal-Fired Power Plants in Northeast Asia (TA No. 6371-REG) Final Report
151
(1) Technology professional improvement
Improve the outlet of limestone feeding vibrator and retrofit inspection door. Rectify and reform the feed inlet of gypsum belt conveyer. Rectify wash water and install corresponding drainage facilities. Rectify and reform the head of limestone weighing belt feeder. Replace all water seal and inlet valve with needle-type regulating valve. Improve connection mode of craters at wash water pipelines of demister. Improve the filtrate water pump from plastic vane pump to alloy vane pump. Retrofit subsystem superphylum at the rotating machinery industrial cooling
water system which can be conducive to overhaul and maintenance over #3 and #4 Unit FGD plants.
(2) Thermal control system improvement
Concentrate pneumatic actuator solenoid valves of the FGD plants in the control box.
Add mill operation time statistics in the DCS system for reasonable arrangement of equipment repair.
Improve oil pump chain logical circuit of booster fan oil station to enhance safe reliability of fan operation.
Improve washing program of the wash water system for the FGD plant demister, which eradicates water impact problems at wash water pipelines and ensures safe operation of pumps, valves and pipelines.
Pneumatic actuator solenoid valves of the FGD plants shall be concentrated in the control box.
3.4 Equipment Assessment and Recommendation
3.4.1 Equipment Assessment
81. Major equipment of the desulfurizer includes booster fan, absorber tower circulation pump, oxidation fan, gypsum dehydration system, and limestone size preparation system, all of which have been generally in stable and propitious operation.
(1) Booster fan: in stable operation. The output can meet the requirement of smoke volume when main engine is operated at full load.
(2) Absorber tower circulation pump: basically in smooth and reliable operation. Spray effect in the tower is good, which ensures desulfurization efficiency of the system.
(3) Oxidation fan: during debugging period the run time fault incidence was high Bearing
Mitigation of Trans-Boundary Air Pollution from Coal-Fired Power Plants in Northeast Asia (TA No. 6371-REG) Final Report
152
pedestal often vibrated and produced high temperature, and thus the equipment performance is poor. However, after the power plant conducted overhaul and improvement, the operation reliability of the fan was improved.
(4) Analysis meter system: pH meter and densimeter are imported equipment with basically accurate standardization. PH meter and densimeter are washed regularly per shift. However, the deviation between densimeter and actual measurement is relatively big after long running.
(5) Gypsum dehydration system: it is in public use of all plants and in good operation condition. But gypsum is prone to accumulate and block up at feed opening. It is proposed to retrofit vibrator or high polymer material inside lining to reduce gypsum clogging at feed opening.
(6) Limestone size preparation system: it is in public use of all plants and in relatively normal operation condition. The size quality and quantity prepared can meet the requirement of system operation. But blocking phenomenon in wet milling feed inlet is relatively serious.
82. With regard to equipment price, the localization rate of two sets of desulphurization devices achieves 75%. Imported equipment is primarily the equipment in the tower. The lectotype, performance and quality of major home equipment are preferable. Compared to imported equipment, the home equipment's maintenance and accessories replacement are more convenient and swift, which lays a good foundation for stable operation after going into operation.
3.4.2 Recommendations
(1) Valve pneumatic devices shall adopt reliable brands to ensure stable operation and little maintenance so as to reduce the system failure rate.
(2) Vacuum leather belt dehydrator is recommended to abandon cloth leather belt. The gypsum shall directly fall into the gypsum pool vertically after dehydration.
(3) The compressed air blowing effect of the GGH soot blower is unapparent. It is proposed to use steam of 0.9 MPa as medium for soot blowing.
(4) Limestone size and gypsum size densimeters are easy to block, which shall adopt optimum design.
(5) Voltage regulating device shall be retrofitted to demister wash water.
(6) Process water spray is recommended to be adopted. Wash the inwall at the absorber tower inlet to avoid fume and spray liquid from precipitating at inlet air and liquid contact zone.
Mitigation of Trans-Boundary Air Pollution from Coal-Fired Power Plants in Northeast Asia (TA No. 6371-REG) Final Report
153
4. Operation of the FGD Device
4.1 Operation Conditions
83. The FGD device is generally in stable operation. All the key technical indicators achieve or exceed the designed value. The field of production is in good condition and each piece of equipment is operating normally. The on-site fault report is complete; defect treatment is in a timely manner; the level of facility maintenance and overhauling is high; and the equipment is in a good condition.
84. On-site inspection for the operational conditions of No. 1 FGD system is shown in Table 8. The assessment for the operational state of the 2 × 300 MW units of the FGD system is shown in Table 8 and Table 9.
Table 8: On-site Inspection on the Operational Conditions of NO. 1 Unit of the FGD System
Category Item Unit Time Time Time
Average 14:20 11:01 14:10
Unit output MW 300 300 218 272.7
FGD inlet
Pressure kPa -0.27 -0.26 0.017 -0.171
Pressure kPa -0.24 -0.23 0.014 -0.162
Pressure kPa -0.26 -0.25 0.114 -0.132
Blower fan outlet
Pressure kPa 2.35 2.32 2.32 2.33
Temperature ºC 129.2 135.5 128.8 131
SO2 mg/Nm³ 3090 3346 2843 3093
O2 % 5.97 5.97 6.86 6.27
Smoke and dust mg/Nm³ 204.8 183 199.8 195.9
GGH raw gas outlet
Pressure kPa 1.78 1.76 1.81 1.78
Temperature ºC 96.9 101.4 95.2 97.8
Pressure difference kPa 0.57 0.56 0.51 0.55
GGH clean gas outlet
Pressure kPa -0.04 -0.04 -0.04 -0.04
Temperature ºC 80.4 80.5 81.7
83.7 83.7 84.9
81.3 79.7 81.5
81.8
Pressure difference kPa 0.753 0.738 0.728 0.74
FGD outlet
Smoke capacity Nm3/h 756877 800708 665526 741037
Temperature ºC 48.5 50 48.1 48.9
SO2 mg/Nm3 118.4 152.7 112.9 128
NOx mg/Nm3 439.6 434 407.2 426.93
H2O % 12.43 10.98 13.37 12.26
Mitigation of Trans-Boundary Air Pollution from Coal-Fired Power Plants in Northeast Asia (TA No. 6371-REG) Final Report
Table 9: Assessment of the Operational Conditions of 2 × 300 MW Units of the FGD System
Item Main Reasons
The situation when power plant staff received the FGD device
The CPP is basically satisfied. The general operation of FGD device is normal and a little remaining work exists.
Quality of the document The CPP is basically satisfied. Some equipment information is not detailed enough.
Matching of the FGD system The CPP is satisfied. The FGD requirement for each load of the main engine can be met.
Device parameter selection The CPP is satisfied. Equipment selection is relatively reasonable.
Device arrangement The CPP is satisfied. The overall arrangement is reasonable.
FGD device conditions
Startup The effect of startup is satisfying and the time of startup is short. It can be started with the main unit, which can meet the desulphurization need of the main unit.
Shutdown Effective. FGD device can be shut down along with the main unit.
Load variation Excellent adaptability. FGD device has good adaptability during the load variation.
Bypass operation It can be operated normally when bypass damper is closed.
Low load Good operation condition under the low load. Desulphurizing ability can be met.
Medium load Good operation condition under the medium load. Desulphurizing ability can be met.
High load Good operation condition under the high load. Desulphurizing ability can be met.
Overload Good operation condition under the overload. Desulphurizing ability can be met.
Flue gas system
Comprehensive The CPP is generally satisfied with the flue gas system. The overall performance is reliable.
Adjustment for bypass pressure difference
The CPP is satisfied with the adjustment for bypass pressure difference. Adjustment can be normally adopted along with the blower fan adjustment.
Adjustment for the flue gas flow of booster fan
The CPP is satisfied with the adjustment for flue gas flow of booster fan. The flow control has good performance and matches with the main unit.
Mitigation of Trans-Boundary Air Pollution from Coal-Fired Power Plants in Northeast Asia (TA No. 6371-REG) Final Report
156
Item Main Reasons
Bypass damper control The CPP is satisfied with bypass damper control. The control is reliable.
Lime- stone size system
Comprehensive The CPP believes that the overall limestone size system is superior. The overall performance is reliable and output can meet the requirement.
Liquid level control The CPP thinks that the liquid level control is appropriate and normal.
Concentration control The CPP thinks that the concentration control is appropriate and stable.
Absorp- tion tower system
Comprehensive The CPP believes that the absorption tower system is superior. The comprehensive desulphurizing ability can meet the requirement.
Liquid adjustment The CPP thinks that the liquid adjustment is appropriate and stable.
PH adjustment The CPP is satisfied with pH adjustment. PH adjustment is stable.
Flow control of discharged gypsum slurry
The CPP is satisfied with the flow control of discharged gypsum slurry. Flow control is stable.
Flush- ing system
Flushing system of demister
The CPP is satisfied with the flushing system of demister. The operation is stable.
Flushing system of absorption tower inlet pipe
The CPP is satisfied with the flushing system of absorption tower inlet pipe. The operation is stable.
Gyp- sum dehy- dration system
Comprehensive The CPP believes that the overall gypsum dehydration system is superior. The overall performance is stable.
Filter cake thickness control of vacuum belt dehydrator
The CPP thinks that the filter cake thickness control of vacuum belt dehydrator is appropriate. Filter cake thickness is well-distributed.
Water level control of filter fabric cleaning tank
The CPP thinks that the water level control of filter fabric cleaning tank is appropriate. Water level is stable.
Water level control of filtrate water tank
The CPP thinks that the water level control of filtrate water tank is appropriate. The operation of water level is stable and no need to be controlled.
Oxidation air system The CPP is satisfied with the oxidation air system. The operation is reliable and the noise is big.
Process, filtrate water system The CPP is satisfied with the process, filtrate water system. The operation is stable.
Emergency slurry system The CPP thinks that the emergency slurry system is superior and stable.
Blower fan The CPP thinks that the blower fan is good and the operation is stable.
GGH The CPP is satisfied with GGH. The effect of soot blowing is not satisfying.
Circulation pump The CPP thinks that the circulating pump is superior and its operation is stable.
Mitigation of Trans-Boundary Air Pollution from Coal-Fired Power Plants in Northeast Asia (TA No. 6371-REG) Final Report
157
Item Main Reasons
Flue gas damper The CPP thinks that the flue gas damper is superior and the switch is reliable.
Mill The CPP thinks that the mill is superior. The operation is stable and the output can meet the requirement.
Vacuum pump The CPP is satisfied with vacuum pump. The operation is stable.
Key valve The CPP thinks that the key valve is superior. The key valve is imported from Germany and its quality is trustworthy.
Gypsum dehydration
Hydrocyclone The CPP is satisfied with hydrocyclone. The effect of cyclone separation is satisfying. The service life of cyclone is relatively short, which is a quality problem.
Vacuum conveyer belt
The CPP thinks that the vacuum conveyer belt is superior and its operation is stable.
Wastewater treatment None.
Electrical equipment The CPP is satisfied with the electrical equipment. The overall condition is stable, but the laying of some circuit is not standard, which is an installation problem.
Monitoring system The CPP thinks that the monitoring system is superior. The measurement is accurate and the test is simple.
DCS system The CPP thinks that the DCS system is superior and stable.
Noise The CPP is satisfied with noise control. The noise of some equipment exceeds the standard, but it is in the unattended area.
4.2 Operation Management
85. The FGD device will be incorporated to the operation management with the main units by CPP after the FGD device be delivered to the CPP power plant. The Power Department will be responsible for specific operation management. The Department of Safety Production will be responsible for equipment management and appoint a full-time system engineer. CPP Maintenance Company will be responsible for overhaul and maintenance work. A desulphurization maintenance team will be specially established for engineering overhaul. Subsidiary Company of CPP will be responsible for desulphurization materials (limestone and gypsum) and establish a desulphurization marketing department.
4.3 Effect of Operation
86. The commissioning rate of the FGD device is relatively high and the operation is stable. All the indicators and operation condition of the site equipment are basically normal. The operational method for equipment is relatively simple. The monitoring data is visible. The equipment can be operated continuously and stably and emission control requirement for SO2 can be met.
87. The major equipment of the FGD device is generally in stable operation, which ensures desulfurization efficiency and operational reliability of the system.
Mitigation of Trans-Boundary Air Pollution from Coal-Fired Power Plants in Northeast Asia (TA No. 6371-REG) Final Report
158
88. The absorption tower adopts high-tower layout method. It will provide a decent buffer when an anomalous liquid level occurs so as to facilitate handling of the abnormal condition.
89. Most of the onsite parameters are controlled by the unit DCS, which can facilitate the operating staff to monitor and control site equipment.
90. The localization rate of the CPP equipment is 75%. The major equipment, such as circulating pump, GGH, agitator, swirler and demister, is all imported equipment. However, the actual operation indicates that the value of some imported equipment is not equivalent to their price. Thus, the rationality of procuring imported equipment needs to be further discussed.
91. The commissioning rate of the FGD device is continuously increased. The commissioning rates for the two FGD devices are all over 95%.
4.4 Assessment of System Operation
92. The exterior quality of limestone feeding is relatively poor. We suggest that the CPP power plant improve the control of supplied materials and reduce the impact on system safety.
93. Slurrying system is far from the absorption tower and slurry delivery pipe is long. It is imperative to increase the head pressure of the slurry delivery pipe, so as to ensure sufficient slurry supply. Consequently, the abrasion of pipeline is relatively serious. It is suggested to increase the number of feed box so that the pipeline abrasion can be reduced.
94. The running value of slurry pH in the absorption tower is recommended to be 5.2 to 5.6. The value that is higher than the abovementioned value can increase the calcium sulfur ratio.
95. The pressure difference of GGH is relatively large according to the on-site inspection. To ensure a normal working condition of GGH, it is suggested to replace soot blowing method for compressed air by steam soot blowing test, so that the heat transfer surface can be thoroughly cleaned up. It is suggested to not adopt high pressure water wash before rehabilitation.
5. Desulphurization Construction
5.1 Design
(1) Flue gas parameter of the FGD inlet
96. The design condition of FGD is the working condition of boiler BMCR. The design coal for burning and flue gas parameters of FGD inlet are shown in Table 10.
Mitigation of Trans-Boundary Air Pollution from Coal-Fired Power Plants in Northeast Asia (TA No. 6371-REG) Final Report
159
Table 10: Flue Gas Parameter of FGD Inlet
Item Unit Dry Basis Wet Basis Remarks
Flue gas composition under the working condition of boiler BMCR (standard condition, real O2)
CO2 Vol% 13.54 12.53 -
O2 Vol% 6.09 5.63 -
N2 Vol% 80.28 74.28 -
SO2 Vol% 0.07 0.07 -
H2O Vol% 0 7.48 -
Pollutant composition in flue gas under the working condition of boiler BMCR (standard condition, dry basis, 6% O2)
Item Unit Design coal - -
SO2 mg/Nm3 2131 - -
SO3 mg/Nm3 <150 - -
Cl (HCl) mg/Nm3 ≤80 - -
F (HF) mg/Nm3 ≤25 - -
Dust concentration (outlet of draught fan) mg/Nm3 200 - -
Flue gas parameter in the working condition of boiler BMCR
Item Unit Design coal Check coal -
Volume of smoke in the FGD inlet
×104 Nm3/h 113.017 117.7815 Dry basis, actual oxygen content
×104 Nm3/h 122.1514 126.4305 Wet basis, actual oxygen content
×104 Nm3/h 112.3511 112.5546 Normal state, dry basis, 6% O2
×104 Nm3/h 121.4854 121.0222 Normal state, wet basis, 6% O2
Flue gas temperature in the outlet of draught fan °C 125 125 Normal value
Flue gas pressure in the outlet of draught fan Pa -150 -150 BMCR working condition
The volume of smoke and temperature in the outlet of draught fan under different boiler loads (6% O2) (design coal)
Item Unit BMCR 80% ECR 60% ECR 40% ECR
The volume of dry flue gas in the outlet of draught fan ×104 m3/h 164.2096 132.6524 111.1677 70.8016
The volume of smoke in the outlet of draught fan ×104 m3/h 177.4815 142.3437 119.2893 75.9742
Flue gas temperature in the outlet of chimney °C 110.2 - - -
Mitigation of Trans-Boundary Air Pollution from Coal-Fired Power Plants in Northeast Asia (TA No. 6371-REG) Final Report
160
(2) Performance guarantee value
97. Under the design condition, the main performance guarantee value of the FGD system is shown in Table 11.
Table 11: Performance Guarantee Value of the FGD device
No. Item Guarantee Value
1 Desulfurization efficiency of FGD device ≥95.7%
2 Maximum capacity of FGD device (2 units) Maximum security load
≤8912 kW ≤140 kVA
3 Limestone consumption (designed sulfur content and volume of smoke) ≤imes t/h
4 Flue gas temperature of the system outlet, which is corresponding to 80% and 100% volume of smoke 80°C
5 The total flue gas resistance of FGD device ≤he t Pa
6 Fogdrop content at demister outlet ≤og mg/m3
7 Process water consumption (2 units) ≤roces t/h
8 Gypsum quality
CaCO3+MgCO3 contentua%
CaSO4·2H2O content ≥90%
CaSO3·1/2H2O≤0.5%
Free moisture ≤ 10%
Cl-cntent≤0.01%
F-content≤0.01%
Mg2+content≤0.021%
9 Noise ≤85 dB(A)
(3) Design evaluation
98. The overall layout of the FGD device is basically reasonable. The FGD device adopts zoning layout, i.e. the main equipment (including blower fan, absorption tower, GGH, and gypsum dehydration) is laid out in a concentrated manner behind the unit chimney, while the adsorbent is arranged separately.
99. Flue pipe arrangement, various pipelines and channel plan (including aerial pipeline, direct buried pipelines, planning and design for the connection with outside channel) in the scope of design are marked clearly at the design boundary.
100. Each system design of the FGD device basically complies with the “Technical Code for Designing FGD Plant of Fossil Fuel Power Plants” (DL/T 5196-2004).
5.2 Construction
101. The FGD project with 2 × 300 MW units is constructed using the method of EPC, including the required technological design, device selection, procurement, transportation
Mitigation of Trans-Boundary Air Pollution from Coal-Fired Power Plants in Northeast Asia (TA No. 6371-REG) Final Report
161
and storage, manufacture and installation, design of the buildings, construction, debugging, testing and inspection, commissioning, assessment and acceptance, eliminating defects, training and final delivery into production, all of which should be within the FGD system and meet the normal operation of the units with the FGD device, as well as the demolition and recovery of existing facilities.
102. The actual construction period of the two FGD devices is 24 months. The construction agency has a clear objective of project quality management. The quality system is basically sound and the operation is normal. The construction can be conducted in strict compliance with quality control measures and quality plan. The quality management is under control. All the test results of processing equipment are satisfying and system operation is normal.
6. Technical Economy Assessment
103. The total investment of the FGD installation project is CNY19,500, in which the engineering design fee accounts for 5.8%, civil engineering cost 12.3%, equipment cost 66.0%, installation cost 14.2%, and others 1.7%. The specific investment is 325 yuan/kW. The project cost is reasonable as per the price level and project scope analysis in 2005.
104. The FGD device for the 2 × 300 MW unit has 5,000 utilization hours per year. The production cost for the two FGD sets is CNY42.8783 million. The cost of limestone accounts for 6.64% of the production cost, electricity cost 47.86%, water charge 0.94%, depreciation charge 30.32%, cost of operational maintenance staff 8.68%, and maintenance cost 8.16%. The total cost of SO2 desulphurization is 1.87 yuan/kg.
7. Conclusion
(1) The desulfurization efficiency and SO2 emission will meet the approval requirements from the environment protection department in environmental impact statement of FGD project. The SO2 emission in the power plant can reach the standard.
(2) The process design of FGD is reasonable. The system configuration from limestone changing to gypsum dehydration is complete. Equipment selection complies with the requirement of design discipline.
(3) The limestone resource is properly utilized by the power plant and its quality is superior. The water source is sufficient, which is from Yangtze River. Comprehensive utilization of all desulphurization gypsum makes the technology selection not only comply with the national principle for technology selection in thermal power plant, but also meet the actual situation of the power plant. Thus, it lays a solid foundation for long and stable operation of the FGD device.
(4) The absorption tower of our independent intellectual property and high-tower layout method is adopted. It will provide a decent buffer when an anomalous liquid level occurs and facilitate handling of the abnormal condition.
Mitigation of Trans-Boundary Air Pollution from Coal-Fired Power Plants in Northeast Asia (TA No. 6371-REG) Final Report
162
(5) From the aspects of the annual utilization hours and actual situation of planned and unplanned outage times, the annual availability of the FGD device is over 95%. Consequently, the operation of the FGD system is stable and reliable. The equipment selection and configuration of the FGD device body are reasonable. The design allowance is also taken into consideration, so as to meet the situation of the existing power plant’s coal-fired sulfur when it varies.
(6) Since the FGD device was put into operation, absorption tower lining, glass fiber reinforced plastic pipeline, other pipelines, GGH, grinding mill, slurry circulating pump, and other major equipment are in stable and normal operation. Basically, the FGD device is not out of operation due to the equipment failure.
(7) Considering the various sulfur content of coal, it is recommended to identify the adaptability and limitation of each FGD device. Effective measures should be taken when necessary so as to ensure or improve the safe operation capacity of the FGD device. It is suggested to actively optimize the operation of FGD device and conduct economic analysis to enhance the operational economy.
Mitigation of Trans-Boundary Air Pollution from Coal-Fired Power Plants in Northeast Asia (TA No. 6371-REG) Final Report
163
APPENDIX 9: DEMONSTRATION PROJECTS
Application Example of Thermal Power Plant Desulfurization Technology
Demonstration Project I:
Technical Name: Combined Additive for Enhancing Limestone Slurry Activity in Desulfurization System
Mitigation of Trans-Boundary Air Pollution from Coal-Fired Power Plants in Northeast Asia (TA No. 6371-REG) Final Report
164
1. Summary of Technology
1.1 Research Background
105. Under the existing technology, fossil fuel is often used by power stations and industrial boilers, such as coal and oil. Because these fossil fuels contain sulfur components, the combustion process will produce sulfur dioxide and other toxic substances. Limestone - gypsum wet FGD devices are widely used by boilers in large power stations for removing sulfur dioxide from boiler flue gas.
106. Chemical reaction process of wet limestone desulfurization consists of the following five processes: i) SO2 is diffused and dissolved by gas phase penetrating the interface of gas-liquid; ii) Hydration of dissolved sulfur dioxide; iii) Alkaline dissociation; ; iv) Dissolution of CaCO3 solid particles and subsequent dissociation; and v) Formation of salt. Desulfurization process involves gas, liquid, and solid-phase reaction, and the mechanism is quite complex. On the basis of film theory, a number of mathematical models of limestone slurry absorbing sulfur dioxide are proposed. These models are expressed in the form of enhancement factor.
107. There are many factors that can affect the enhancement factor, of which the organic additive is a significant factor. Organic additive, as mass transfer enhancement additive, can not only improve the desulfurization efficiency and utilization of absorbent, but also prevent scaling to improve system reliability and reduce operating costs. Therefore, the research of additive has always been a hot topic.
1.2 Research Process
108. The method of strengthening limestone slurry activity in FGD process is to add combined additives composed of adipic acid and chlorine prepared by certain proportion in limestone slurry. The mass ratio is as follows: adipic acid: chloride =1:1~1:3. Molecule formula of adipic acid is HOOC (CH2)4COOH. Add amount: 1000±15% mg/l. General formula of chloride salt is x (Cl) n, chloride dosage: 1000 ~ 3000 ± 15% mg/l. Chloride salt is sodium chloride NaCl, magnesium chloride MgCl2 or calcium chloride CaCl2.
109. Specific implementation method is to, under normal temperature and pressure, directly add the industrial adipic acid with a dosage of 850 mg/l, 900 mg/l, 1000 mg/l, 1050 mg/l or 1100 mg/l and sodium chloride with a dosage of 1 time, 1.5 times, 2 times, 2.5 times, 3 times of the dosage of adipic acid. During dosing, real-time monitoring is needed on all performance indicators and desulfurization efficiency.
1.3 Technical Description and Working Principle
110. Limestone-gypsum wet FGD process is restricted by the following two pH values: (1) Gas-liquid two-phase interface is the lower pH value to reduce SO2 dissolution and absorption rate; (2) Solid-liquid two-phase interface is that higher pH value that enables CaCO3 dissolution and dissociation. Use combined additive made up of adipic acid and
Mitigation of Trans-Boundary Air Pollution from Coal-Fired Power Plants in Northeast Asia (TA No. 6371-REG) Final Report
165
chloride can adjust pH value and achieve the effects of enhanced mass transfer and diffusion.
111. The working principle is described through the following chemical reaction:
112. Due to the limited solubility of SO2 and solid CaCO3, adding adipic acid provides an alkaline basic group, and enhances fluid membrane mass transfer factor. It can not only promote the dissolution of CaCO3 and improve their dissociation rate and reduce liquid phase resistance, but also promote dissolution of SO2 and reduce the gas phase resistance. Addition of chloride enhances the dissociation of the compound. In addition, the presence of adipic acid is in favor of the CaSO3 precipitation, making the reaction of limestone slurry cycle absorb SO2 repeatedly. Adipic acid plays a similar catalyst role.
113. The technology’s role is improving coal-fired power plant desulphurization systems, stabilizing the operation effect and improving the desulfurization efficiency. In limestone-gypsum wet FGD reaction, join combined additive into absorbent-limestone slurry, in favor of dissolution of gas and generation of solid products in desulfurization reaction. At the same time, the reactions catalysis effect is achieved, making the reaction activity increased by 50%, the desulfurization efficiency improved, consumption of limestone reduced, operating costs lowered, and the operation flexibility of the system improved.
1.4 Feasibility of Technology Promotion
114. This technology uses adding mixture additives of adipic acid and chloride, including adipic acid [HOOC (CH2) 4COOH] with stable, non-toxic, non-hygroscopic and other features, in terms of storage and transportation without treatment. Chloride salt is sodium chloride (NaCl), magnesium chloride (MgCl2), or calcium chloride (CaCl2), with stable chemical property, accessible and reasonable prices. This mixed additive with high security and reliability features is easy for site operation and application.
Mitigation of Trans-Boundary Air Pollution from Coal-Fired Power Plants in Northeast Asia (TA No. 6371-REG) Final Report
166
115. At the same time, after the actual measurement and adding the mixed additives, under the condition that the catalysis effect system reactivity is increased by more than 50%, the desulfurization efficiency of desulfurization system is increased by 10%. Under the same conditions, the consumption of limestone is reduced by 10%, and residues (FGD gypsum) by 10%.
116. The market price of adipic acid is 14,000 yuan/ton, sodium chloride 5,000 yuan/ton, and limestone powder 200 yuan/ton. According to the dosing ratio of 1000 mg/l adipic acid and 2000 mg/l sodium chloride, according to each absorber’s slurry tank volume of 1,200 m3, for the first time it requires to dose 1.2 tons of adipic acid and 2.4 tons of sodium chloride. The cost is 28,800 yuan. The additive replenishment amount of each month is 30% with a cost of 8,600 yuan. That is 103,200 yuan a year. The total cost is 132,000 yuan. Flue gas volume of flue gas of sulfur dioxide concentration 3000 mg/Nm3, according to 900,000 Nm3 200 MW coal-fired units calculation, need to consume limestone 4.3 t/h. After dosing additives the consumption of limestone can be reduced by 10% (0.43 t/h). With 5,000 hours per year, 21,500 tons of limestone can be saved. The limestone purchasing cost is 430,000 yuan. Removing the additive dosing cost of 132,000 yuan, an annual operating cost saving is 300,000 yuan.
117. According to the above arguments, the technology can be widely applied given its technical and economic advantages.
2. Case Study of Engineering Application I: Datong Second Power Plant Flue Gas
Desulfurization Project
2.1 Plant Profile
118. Datong second power plant is a key project constructed during the national “sixth five-year plan” period for taking advantage of Shanxi energy, making full use of the abundant coal resources in Datong area, and easing electric tension in Beijing. The total installed capacity of Phase I was planned as 1.2 million-kilowatt with 6 homemade 200,000-kilowatt generating sets installed. The project was formally started on 14 October 1978. The first generating set generated electricity on 30 June 1984; the six generating sets generated electricity together on 25 November 1988. Then Phase I of the project was completed. This power plant bears the important task of supplying electricity to the capital of Beijing. It is a high temperature and pressure condensing power plant that was designed and installed with the main equipment made by our county.
119. Brief description of the boiler: pulverized coal fired boiler with super-high pressure, single medium reheat, natural circulation, and dry slagging steam dome. Design and operating parameters of the boiler include:
Supplier: Dongfang Boiler Manufactory Boiler type: DG670/140-5~8 Fuel: coal Supporting and starting fuel: number 0 light diesel oil
Mitigation of Trans-Boundary Air Pollution from Coal-Fired Power Plants in Northeast Asia (TA No. 6371-REG) Final Report
167
Exhausted gas temperature (before amendments): 140°C Exhausted gas temperature (after amendments): 140°C Minimum stable combustion load without oil: 80 MW Designed coal consumption of boiler: 77.9 t/h Dust removal method: electrostatic precipitators Dust removal efficiency: 99.6% Dust content in flue gas from combustion of dust collector: 200 mg/Nm3
2.2 Brief Introduction of Desulfurizing Process
120. The FGD system was not designed during project construction. With the improvement of the national environment protection policies, the requirement on the flue gas emission in large power station is increasingly strict. After reconstruction of the FGD system, 6×200 MW units were under FGD construction by Beijing Langxinming Environmental Protection Technology Co., Ltd. with the EPC method. The complete wet FGD process of limestone-gypsum was adopted. The units of #2, #3, #4, and #5 adopt two-boilers-and-one-tower process, i.e. #2 unit and #3 unit use #23 FGD; #4 unit and #5 unit use #45 FGD. Two FGD systems adopt one electric controlled complex building. They have circulating slurry pump, process water pump, process water tank, industrial water tank, industrial water pump, oxidation blower, cable interlayer, high/low voltage distribution room, and control room configured inside the building.
121. The two FGD systems share one gypsum disposal building. One gypsum storehouse, two sets of gypsum dewatering equipment, two sets of limestone flour warehouse and slurry equipment are configured inside the building. #23 FGD and #45 FGD was put into operation in February 2007 and February 2008 respectively. #1 unit and #6 unit are configured with one-boiler-and-one-tower system, i.e. #1 FGD system and #6 FGD system. The utility system is shared for #23 FGD system and #45 FGD system and was put into operation in October 2008 and March 2009 respectively.
Table 1: Analysis Data of Coal and Ash Composition Name/
Symbol Unit Design Coal Quality Yungang Soft Coal
Check Coal Quality Jinghuagong Soft Coal
Check Coal Quality (2)
Cy % 70.13 64.78 65.2
Hy % 3.93 3.93 4.21
Oy % 7.01 7.17 6.43
Ny % 0.68 0.71 0.88
Sy % 1.11 0.53 1.50
Wy % 9.8 13.68 7.4
Aymax % 14.39 18.50
Wf % 4.23 3.01
Ay % 7.36 9.2 15.18
Vr % 29.76 31.76 34.52
QDWy KJ/Kg 26729.8 24753.5 25080.00
Mitigation of Trans-Boundary Air Pollution from Coal-Fired Power Plants in Northeast Asia (TA No. 6371-REG) Final Report
168
Name/ Symbol Unit Design Coal Quality
Yungang Soft Coal Check Coal Quality
Jinghuagong Soft Coal Check Coal Quality (2)
V0 Nm3/Kg 7.08 7.05 6.75
K 1.125 0.93
R90 % 2503
Source: Datong Second Power Plant
Table 2: Adsorbent Component Analysis
Mineral Component Unit Value
CaO wt-% 50.49
MgO wt-% 2.51
Fe2O3 wt-% 0.41
Al2O3 wt-% 0.64
SiO2 wt-% 2.81
Content of water (wet solid) wt-%
- particle diameter μm 44
- grinding quality (grindability index) kWh/t 11
Source: Datong Second Power Plant
122. Absorbent quality: purity of CaCO3 is 89.3%, purity of MgCO3 is 4.2%; and fineness is less than 10% with 325 mesh sieves.
Table 3: Flue Gas Parameters of Desulfurization System
1
FGD inlet gas data Unit Value
Exhaust gas volume (standard state, wet basis, 6%O2) Nm3/h 900871
Exhaust gas volume (standard state, dry basis, 6%O2) Nm3/h 841308
·Draft fan outlet flue gas temperature °C 140
·FGD process design flue gas temperature °C 140
·Lowest flue gas temperature °C 120
·Highest flue gas temperature °C 145
2
FGD inlet gas composition
·N2 vol - %, dry 80.434
·CO2 vol - %, dry 11.84
·O2 vol - %, dry 7.585
·SO2 vol - %, dry 0.092
·H2O vol - %, wet 6.612
3
FGD inlet pollutant consistency (6%O2, standard state, dry basis)
·SO2 mg/Nm3 3000
·SO3 mg/Nm3 30
·HCl as Cl mg/Nm3 50
Mitigation of Trans-Boundary Air Pollution from Coal-Fired Power Plants in Northeast Asia (TA No. 6371-REG) Final Report
169
·HF as F mg/Nm3 20
·Designed dust concentration mg/Nm3 200
Source: Datong Second Power Plant
123. The desulfurization efficiency of the system is designed to be 95%. The system successfully passed the acceptance check after installed and was put into commercial operation.
2.3 Parameter Comparison before and after Demonstration Technology Application
124. The volume of flue gas and SO2 content of flue gas are both changed due to the variation of the coal-fired unit in the late period of operation. In particular, the FGD system is continuously operating under the condition that the SO2 content is 4,800 mg/Nm3, which exceeds the original 50% of designed SO2 content.
125. The FGD system is overloaded during the actual operation. The increase of SO2 content causes descent of pH inside the absorption tower. The low pH value impacts the absorption of SO2, which makes a vicious circle of system operation.
126. Under the extremely harsh operating conditions, the difficult operation problem of the system is to be solved urgently. Venue and funding constraints make it very difficult to make major changes to existing systems. After a demonstration, using this technology to enhance combination of limestone slurry additives in the desulfurization system is the only viable solution.
127. The concrete operation is to add proportionally prepared combined additives, which consist of adipic acid and chlorine salt, and increase the supply of limestone slurry.
128. The activity of the absorbent is enhanced through the reaction of additive and adsorbent and effectively guarantees the pH value in the reaction zone of the absorption tower between 5 to 5.5. The system can achieve desulfurization efficiency of 95% and ensure the reaction of gypsum crystallization is under the optimal condition, so as to realize a minor change of the system and reach the prospective result.
Table 4: Operation Data
Project Item Unit Original
Designed Parameter
Actual Operating
Data
Related Parameter after Adding the
Combined Additives
Exhaust gas volume (standard state, dry basis
6%O2) Nm3/h 900871 900871
FGD inlet SO2 mg/Nm3 3000 4800
Limestone consumption t/h 4.3 6.8 6.4
Combined additive dosing amount
Adipate (t) 0 0 1.2
Sodium chloride (t) 0 0 2.4
Desulfurization efficiency % 95 87 95 Source: Datong Second Power Plant
Mitigation of Trans-Boundary Air Pollution from Coal-Fired Power Plants in Northeast Asia (TA No. 6371-REG) Final Report
170
129. From the parameters listed in the table, it shows that the desulfurization efficiency does not reach 95% in overload operation; after the addition of combined additives, it can guarantee 95% desulfurization efficiency without large system adjustment. Therefore, the combined additives significantly enhance the reactive behavior of limestone slurry.
130. For the sake of the economic analysis, the market price of adipate is 14,000 yuan/ton, sodium chloride 5,000 yuan/ton, and limestone powder 200 yuan/ton. Each absorption tower requires one-time addition of 1.2 tons of adipic acid and 2.4 tons of sodium chloride. The cost is $28,800. Additive replenishment is 30% per month, and the annual cost is $103,200. So the total cost is $132,000.
131. For the maintenance for the normal pH value of the reactive slurry pond of each absorption tower, it needs to dose sufficient absorbent limestone slurry. The limestone consumption difference before and after dosing combined additive is 5% (0.4 t/h), if 5,000 hours per year, and it will save $400,000 of limestone cost.
132. In addition to running cost savings, the cost of the system technical reform is saved, such as increasing of absorption tower spraying layer, replacement of circulating slurry system, changes of oxidation air system, which is at least 3.5 million yuan/set.
133. At present, Datong second power plant has six sets of 200 MW generators; all use the enhanced desulfurizing method to dose combined additives into the system to slightly change the original system. It successfully realizes the improvement of the desulfurization efficiency, reduction of limestone desulfurization agent dosing. Therefore, this technology is both technologically and economically viable.
3. Case Study of Engineering Application II: Thermal Power Co., Ltd Flue Gas Desulfurization Project in Handan
3.1 Plant Profile
134. Handan thermal power plant was constructed in 1958 and was divided into four phases. The Phase I and II projects have reached the age of retirement and been shut down. Currently, the running unit is the Phase III project, which was put into operation in 1990. It contains a 2×220 t/h pulverized coal furnace and 2×25 MW back pressure heat supply unit. There is also a technical renovation project completed in 1999 including a 2×670t/h pulverized coal furnace and 2×200 MW double-extraction heating unit. The four furnaces have a total power generating capacity of 450 MW and a heating capacity of 980 t/h, including industrial heat load of 380 t/h and heat load of 600 t/h. As per the Power Development Plan, the power plant in Phase V was upgraded to 200 MW and put into operation in December 2006.
135. The Phase III two units have been shut down in the countdown stage, without considering the exhaust FGD process transformation. The two 200 MW units in Phase IV have been running for many years, without FGD facilities synchronously installed when it was built. The technology upgrade was done in 2005, with the FGD equipment added. It was completed and delivered for use in March 2007. In Phase IV new 200 MW unit was established and constructed. After the government promulgated the policy on the power plant
Mitigation of Trans-Boundary Air Pollution from Coal-Fired Power Plants in Northeast Asia (TA No. 6371-REG) Final Report
171
flue gas emissions, the FGD project was simultaneously constructed with the unit, and transferred to series production with the host in December 2006.
136. The FGD project of the above-mentioned units was constructed by the Beijing Langxinming Environmental Protection Technology Co., Ltd. via the EPC mode.
(1) Type: Y4-2×60–14N031F; (2) Air capacity: 80×104 m3/h; and (3) Wind pressure: 3,163–2489 Pa.
Forced draught fan 2
(1) Type: G4-73–14NO25.5F; (2) Air capacity: (34.2–46.1) ×104 m3/h; and (3) Wind pressure: 8,721–5,778 Pa.
ESP 2
(1) Type: FAA4×40– 2×76–145 (2) Electric field quantity: 4 (3) Dedusting efficiency: 99.5%; (4) Volume of treated flue gas: 750,000 m3/h; and (5) Manufactory: Zhejiang Feida Environment Protection Technology Co., Ltd.
Chimney 1 One concrete chimney of 210 m high. Its base diameter is 18 m and the inner diameter of its top is 4 m.
Source: Handan Thermal Power Plant
3.2 Desulfurization Process
137. The FGD of the Handan thermal power plant FGD adopts limestone-gypsum wet FGD process, using the furnace and tower desulfurization equipment. The desulfurization rate is not less than 95%. The absorbent preparation system and gypsum handling system have been considered with the same desulfurization process.
138. The absorbent preparation system uses overflow wet ball mill machine and provides the amount needed by the 3X200 MW unit. The desulfurization system uses absorbent—limestone slurry—to provide the slurry to the absorber tower through the supply slurry system.
139. After first level hydrocyclone enrichment process, gypsum by-product generated by FGD turns into gypsum slurry with a solid content of 40~60%. Gypsum slurry flows automatically into the thick slurry tank. Through the thick slurry pump, gypsum slurry is
Mitigation of Trans-Boundary Air Pollution from Coal-Fired Power Plants in Northeast Asia (TA No. 6371-REG) Final Report
172
transported to the vacuum dewatering belt machine for dewatering to become dehydrated gypsum with a water content of 10%. Comprehensively utilization of the desulfurized gypsum should be considered. If the utilization is difficult, the gypsum will be carried by transport vehicles to the ash yard and jettisoned. The FGD system includes the following subsystems.
Flue System
140. The FGD system has an independent flue gas system installed. When the FGD plant is running, the flue bypass damper is closed, and flue gas is led into the FGD system. The flue gas was driven by the FGD forced draft fan into GGH for cooling, and then into the absorber. Clean flue gas from the absorber goes into the heating side GGH. After being warmed to 80℃ by the chimney, it is discharged into the atmosphere.
Absorber System
141. Flue gas enters the underside of the absorber, contacts with the slurry counter-current, and makes the absorption reaction in the tower. The reactants in the absorber slurry pool undergo oxidation reaction and produce by-product of desulphurization -- dehydrated gypsum. The clean flue gas after being washed and decarbolized by absorbent, goes through the mist eliminator to remove droplets, and enters into the heating side of GGH and is discharged into the chimney.
142. Absorber is empty structure, without filling unit. There are three mixers at the bottom of the slurry tank and two sets of secondary oxidation agitators on the top. Three spray layers made of FRP are installed. The nozzle is made of silicon carbide. Each spray layer has a circulating pump. The circulating flow rate of slurry is about 5,300 m3/h.
Oxidation Air System
143. No. 11 and 12 absorbers share one oxidation air system, with three oxidation fans, two in operation and one for backup. The oxidation capacity of an oxidation fan is 3,500 Nm3/h. The oxidation fan uses a root blower. No. 13 fan unit includes two oxidation fans, one in operation and one for backup.
Gypsum Slurry Dewatering System
144. The absorber discharges slurry that is composed of gypsum (CaSO4•2H2O), salt mixture (MgSO4, CaCl2), limestone (CaCO3), calcium fluoride (CaF2) ,and gray grains.
145. The discharged slurry goes through the gypsum slurry discharge pump and enters into the gypsum slurry cyclone to separate finer solid particles from the slurry by cyclone overflow (fine gypsum particles, undissolved limestone and fly ash, etc.) These small solid particles under the influence of gravity flow automatically and return to the absorber. Condensed large particles of gypsum and plaster slurry are removed from the cyclone underflow port, and the condensed gypsum slurry has a first level dehydration of 50% (wt). Under the normal FGD conditions, these large particles and gypsum slurry flow automatically to the slurry tank. The slurry pump delivers them to the vacuum belt conveyer for secondary dehydration with a water content of less than 10%. Desiccated gypsum naturally precipitates in stacking room for storage, which will be delivered by the loading vehicles.
Mitigation of Trans-Boundary Air Pollution from Coal-Fired Power Plants in Northeast Asia (TA No. 6371-REG) Final Report
173
146. The common secondary gypsum dewatering system is designed for the three boilers, which are equipped with two vacuum belt dewaterers, each having a capacity of 75% of the amount of gypsum, contributing about 17.2 t/h. Each vacuum belt has a separate auxiliary system, including water ring vacuum pump, filter cloth wash water tank, pump, filter cake washing water tank, gas-water separator, etc.
Water Systems for Process Purpose
147. The water system in the fourth phase has a water tank of 150 m3 (#11 and #12 share one). It can meet the system water consumption for 1.5 hours, with three water pumps (two in operation and one for backup) having a capacity of 120 m3/h. Technology water is delivered to technology water users by the technology water pump.
148. The technology water system in the fifth phase has a technology water tank of 100 m3, with two technology water pumps (one in operation and one for backup) having a capacity of 120 m3/h. Technology water is delivered to technology water users by the technology water pump.
Emptying System
149. The slurry pipe and pump of FGD installations at normal operation need to be washed during outage of the FGD system. Rinse wastewater needs to be collected into the drainage pit. Each absorber tower has a drainage hole. Pits pump collects water via the drainage hole, which will be delivered to the absorber slurry pool by land. The tank size for collecting water is 3000×3000×3000. In the pulping and dewatering plant, one water filter tank is constructed. Collected water is driven by pump to the mill for mixing. The size of filtered water tank is 6000×6000×3000.
Absorbent Preparation System
150. Wet ball mill pulping system deploys dual columns. It runs in three shifts. Considering the load of the three plants, it is determined that the capacity of the pulping system is 2×75% of the absorbed dose required for the desulfurization of the entire three furnace plants. At the lower load the pulping equipment can meet the requirement of absorbent consumption. Under the condition of large absorber consumption, other pulping equipment will be in motion in a short time.
Absorbent Supply System
151. Limestone slurry tank is equipped with four limestone slurry transfer pumps, two running and two for backup, and two 65 m3/h supply pumps for the fourth phase, and two 45 m3/h pumps supply slurry for the fifth phase. To prevent deposition in slurry pipeline when the unit loads changes, supply slurry system is designed in the form of circle conveying, and the requirement of limestone slurry per unit is 13 m3/h.
3.3 Main Technical Parameters
Fuel
Mitigation of Trans-Boundary Air Pollution from Coal-Fired Power Plants in Northeast Asia (TA No. 6371-REG) Final Report
174
152. The source of the plant fuel mainly includes Jinhuagong coal mine and some local coal. Half is supplied by the state coal mines, and the other half by small coal mines, on the design basis of the sulphur content of coal being 1.25%.
Table 6: Fire Coal Quality Analysis No. Name Unit Design coal Check coal
1 Car % 53.33 50.00
2 Har % 3.51 3.50
3 Oar % 3.53 3.50
4 Nar % 1.22 1.22
5 St,ar % 1.25 1.60
6 Clar % 0.262 /
7 Mar % 7.82 6.00
8 Mad % 0.94 1.30
9 Aar % 30.11 35.00
10 Vdaf % 17.8 17.0
11 Qnet,v,ar kJ/kg 21173 20000
12 Coal consumption t/h 106.9 /
Source: Handan Thermal Power Plant
Table 7: Consumption of Coal
Coals
Consumption
The Project: 2x200 MW
Design Coal Check Coal
Per hour t 2x106.9 2x103.3
Daily t 2x2138 2x2066
Annual 104 t 2x70.55 2x68.18
Source: Handan Thermal Power Plant
Table 8: Limestone Component Analysis
Composition
Mine Name SiO2 (%) Fe2O3 (%) Al2O3 (%) SO3 (%) CaO (%) MgO (%)
Laolonggou 1.36 0.12 0.18 0.14 53.35 1.22
Jiabei 1.31 0.10 0.21 0.27 52.78 1.22
Ping’an 1.52 0.16 0.20 0.14 52.21 2.45
Yishe 2.98 0.23 0.19 0.27 51.08 2.86
Yehe 0.0328 53.77 1.56
Mitigation of Trans-Boundary Air Pollution from Coal-Fired Power Plants in Northeast Asia (TA No. 6371-REG) Final Report
175
Source: Handan Thermal Power Plant
Gas Parameters of the FGD System
Volume of treated flue gas of each boiler (standard condition, hygrometric state, actual O2): 900,000 Nm3/h
Volume of treated flue gas of each boiler (standard condition, dry state, actual O2): 863,550 Nm3/h
O2 content of flue gas (standard condition, dry state, actual O2): 5.8% O2 content of the inlet (standard condition, dry state, actual O2): 2,843 mg/Nm3 Dust content at the inlet (standard condition, dry state, actual O2): 347 mg/Nm3 Flue gas temperature at the inlet: 135ºC Flue gas temperature at the outlet: >80ºC
3.4 Contrast
153. The project has passed the acceptance check by the Environmental Protection Agency and third-party inspection agencies. It has started operation smoothly, and fully meets the design requirements. The main technical indicators are as follows.
Flue gas parameter at the inlet of the FGD device
Volume of flue gas: 900,000 Nm3/h (standard condition, hygrometric state, actual O2) Volume of flue gas: 863,550 Nm3/h (standard condition, dry state, actual O2) Volume of flue gas: 8% (standard condition, dry state, actual O2) SO2 content of flue gas: 2,351 mg/ Nm3 (standard condition, dry state, actual O2) Dust content of flue gas: 347 mg/Nm3 (standard condition, dry state, actual O2) Flue gas temperature: 135ºC
Flue gas parameter at the outlet of the FGD device
SO2 content of flue gas: 161 mg/Nm3 (standard condition, dry state, actual O2) Dust content of flue gas: 84.6 mg/Nm3 (standard condition, dry state, actual O2) Flue gas temperature: 80ºC Desulfurization efficiency: 95% Calcium sulfur ratio: 1.03 mol/mol Volume of gypsum: 7.4 t/h (water content of 10%)
Indicators of the FGD system
Limestone consumption: 4.3 t/h Power consumption of the FGD device: 3,912 kW Volume of process water (industrial water): 43 t/h Domestic water: 1 t/h Utilization hours in a year: 6,600 hours
Table 9: Material Consumption Item Unit Quantity Remark
Water break consumption of circulating water t/h 38
Make-up water consumption of circulating water t/h 5
Limestone consumption t/h 4.2
Mitigation of Trans-Boundary Air Pollution from Coal-Fired Power Plants in Northeast Asia (TA No. 6371-REG) Final Report
176
Output of gypsum (water content: 10%) t/h 7.2
Auxiliary steam t/h 5 GGH sweeping
Source: Handan Thermal Power Plant
4. Proposed Solutions for Meeting the Coal Sulfur Content Increases
154. With the rapid economic development of China, coal becomes in short supply. To ensure regular electricity generation, the coal quality purchased by the power plant was changed dramatically, which exceeded the frequent usage scope of early EIA and FS. The FGD system was in an overloaded state for a long time, which could have potential safety hazard, increase the emission of flue gas bypass, and strengthen the pressure of environment protection.
4.1 Expansion and Rehabilitation Plan
155. The power plant started demonstration of expansion and rehabilitation in December 2009 and prepared the expansion and rehabilitation FSR.
156. The expansion and rehabilitation program is designed to allow the coal sulfur content to be 2.0% and other parameters remain the same. For this reason, the original system needs to be modified as follows:
Installation of equipment
The limestone flour warehouse will be established outside with a diameter of 9 m and volume of 800 m3. Inside the warehouse, a limestone slurry tank, limestone slurry transfer pump, and additional slurry supply pump of #12 unit will be installed. The limestone slurry transfer pump is used for supplying slurry to the original limestone slurry tank;
Gypsum discharge pump and its pipeline, gypsum swirler and its pipeline will be replaced;
The original oxidation blower and its pipeline will be replaced.
Table 10: Specification and Technical Requirements of Key Equipments
Name Specification and Technical Requirements Quantity
Oxidation fan MJLS(A)300a Q=5300 Nm3/h, P=0.85 bar; motor power: 220 kW (replacing the original blower) 5
Gypsum cyclone station D6-10/6 VV100-8-1, gypsum slurry treatment capacity: 120 m3/h; concentration: 15% wt. One cyclone is reserved. 3x1
Gypsum discharge pump
Q = 120 m3/h, H = 70 m. Capacity of motor: 55 kW (replacing the original pump) 3x2
Limestone flour warehouse V = 800 m3, diameter = 9 m, height = 25 m, material: concrete 1
Top bag filter Type: MC-II; filter area: 30 m2; air flow rate: 4000 Nm3/h; N = 11 kW 1
Vacuum pressure relief valve SF508, DN500, set pressure: +2.58 kPa to -0.86 kPa 1
Mitigation of Trans-Boundary Air Pollution from Coal-Fired Power Plants in Northeast Asia (TA No. 6371-REG) Final Report
177
Name Specification and Technical Requirements Quantity
Feeder Supporting discharge nozzle and connecting pipe; output: 60 t/h, capacity of motor: 2.2 kW 2
Electric air lock Capacity: 0.75 kW 2
Limestone slurry tank V = 150 m3, φ = 6 m, H = 5 m, carbon steel lining scale 1
Agitator of limestone slurry tank Capacity of motor: 11 kW 1
Limestone slurry transfer pump
Q = 65 m3/h, H = 70 m, Capacity of motor: 55 kW (#12 unit is added; the original pump only provides supply slurry to #11 unit) 2
Limestone slurry transfer pump
Q = 65 m3/h, H = 70 m. Capacity of motor: 55 kW (replacing the original slurry pump of #13 unit) 2
Limestone slurry transfer pump
Q = 65 m3/h, H=40 m, Capacity of motor: 37 kW (used for supplying slurry to the original limestone slurry tank) 2
Table 11: Costs Associated with System Transformation Item Costs (10,000 yuan)
Equipment (including modification of civil engineering) 550
Installation 130
Technical services and design fees 80
Demolition and transformation 100
Total 860
Source: Handan Thermal Power Plant
157. According to the transformation program, after completion, the project can achieve the following performance indicators.
Table 12: Performance Indicators of the Project Item Unit Quantity Description
1 Amount of recycled water back water t/h 38
2 Water circulating supplementary water t/h 5
3 Limestone consumption t/h 7
4 Gypsum production (water content: 10%) t/h 12
5 Auxiliary steam t/h 5 GGH purge
6 SO2 concentration in flue gas (inlet)
mg/Nm3 (Standard condition, dry state, and actual O2)
4700
7 SO2 concentration in flue gas (outlet)
mg/Nm3 (Standard condition, dry state, and actual O2)
250
8 Desulfurization efficiency % 95
Source: Handan Thermal Power Plant
Mitigation of Trans-Boundary Air Pollution from Coal-Fired Power Plants in Northeast Asia (TA No. 6371-REG) Final Report
178
5. Conclusion
158. According to the operational principle of the new technology of active combined additives of limestone slurry in the consolidated FGD system, the FGD system does not need to make a major modification. Only combined additives need to be added, which are mixture of adipic acid and sodium chloride by 1:2, to the slurry tank of the absorption tower (1,000 mg/l of adipic acid and 2,000 mg/l of sodium chloride). If the volume of the slurry tank is 1450 m3, the amount to be added for each absorption tower is 1.45 t of adipic acid and 2.9 t of sodium chloride for one time. The cost is CNY34,800. The replenishment amount of the additives is 30% for each month and the annual expense is CNY125,300. The total cost is CNY160,100. If the service life of the unit is 30 years, the expense during the operation period will be CNY4.8 million.
159. Therefore, it can be seen that when the new technology of adding active combined additives of limestone slurry into the consolidated FGD system is used under the condition that the sulfur content of coal is 50% higher than the design value, the system and equipment only need minor modification and its investment is the least.
160. The power plant has used the new technology of active combined additives of limestone slurry for the operation of FGD system since 2009. The inspection of the practical operation indicates that the operation of the FGD system has achieved long-term security and stability and the desulfurization efficiency has achieved 95%. Moreover, the cost and expense are better than those of the scheme of hardware modification.
Mitigation of Trans-Boundary Air Pollution from Coal-Fired Power Plants in Northeast Asia (TA No. 6371-REG) Final Report
179
Demonstration Project II
Measurement and Control Method of pH Value of Absorber Slurry
1. Summary of Technology
1.1 Research Background
161. In limestone/lime-gypsum FGD system, absorber slurry’s pH value measurement is the automatic control key of the desulfurization system. At present, pH value is measured using forced circulation slurry. On the slurry pipeline to the flue gas desulfurization absorber tower or in circular pool, pH sensor for measuring the slurry pH value is installed. There is a large number of gypsum crystals in the slurry on the slurry pipeline or in a circular pool, making the pH meter contact worn and polluted by the gypsum crystals during operation, which reduces the measurement accuracy. To resolve this issue and to improve the reliability of the pH meter, it is often necessary to install more than one transmitter in the slurry pipeline, but this in turn causes new problems of high equipment investment and complex structure.
1.2 Research Process
162. The specific implementation method is shown in Figure 1 on the following page. First obliquely cutting an upper nozzle (1) inside the lower sourcing opening (9). The inclined intersection angle of “a” between the lower nozzle (1) and absorption tower wall (6) is 15°. Upward obliquely cutting an upper sampling pipe (2) inside the upper sourcing opening (10). The inclined intersection angle of “β” between the upper sampling pipe (2) and level line is 18°. The upper pipe (2) is connected with the shut-off valve of the upper pipe (4) outside the absorption tower. The lower pipe (1) is connected with the shut-off valve of the lower pipe (3) outside the absorption tower. The upper pipe (2) is connected with the upper part of the lower nozzle (1) and intersected with Y shape. The rinse interface (8) is opened for connecting the wash pipe at the intersection of the bottom of lower nozzle. The fluidization pipe (7) is formed from the interaction of (1) and (2) to the upper part of lower nozzle (anticorrosive coating is in the internal wall of fluidization pipe, upper pipe, and lower nozzle). There is a rubber cover on the top of (7). The contact head of pH meter (5) is inserted downward to the fluidization pipe and a nut-shaped connecting fitting (12) is connected on the top of (5). The connecting fitting is placed on the cover.
Mitigation of Trans-Boundary Air Pollution from Coal-Fired Power Plants in Northeast Asia (TA No. 6371-REG) Final Report
180
Figure 1: Implementation Method of pH Value Measurement
Note: Markers in the map: 1 — down nozzle, 2 — up nozzle, 3 — shut-off valve of down nozzle, 4 — shut-off valve of up nozzle, 5 — pH meter contact, 6 — absorber tower wall, 7 — fluidization pipe, 8 — rinse-interface, 9 — lower sourcing opening, 10 — upper sourcing opening, 11 — coping, and 12 — connecting piece
163. The methods for measuring the pH of the liquid in the FGD absorption tower is as follows:
A: Lower sampling opening (9) is designed at the bottom of the absorption tower wall (6) and upper sampling opening (10) is designed at the top of the absorption tower wall. The sampling device for measuring pH of the liquid in the FGD absorption tower is connected between (9) and (10).
B: Open the shut-off valve (4) of the upper pipe and shut-off valve (3) of the lower nozzle (1). The liquid in the absorption tower is led into the fluidization pipe (7) by the lower nozzle (1).
C: The liquid is separated in (7). After precipitation of the gypsum crystal in the liquid, it is fed into absorption tower through the fluidization pipe and lower nozzle. The separated gypsum is fed into the absorption tower through the fluidization pipe and upper pipe. Consequently, the natural circulation of the liquid is formed.
D: The pH value of the liquid is collected by contact head of the pH meter in the fluidization pipe and the pH value is showed by the pH meter.
Mitigation of Trans-Boundary Air Pollution from Coal-Fired Power Plants in Northeast Asia (TA No. 6371-REG) Final Report
181
E: Under the action of gravity of the absorption tower slurry, the new slurry is fed into (7) through (1) and the natural circulation of the slurry is formed. The intake of the slurry in the absorption tower is controlled by the shut-off valve of the lower nozzle and shut-off valve of the upper pipe. The contact head of the pH meter is anti-fraying and antipollution when it is washed by circulating liquid. When it needs to be washed, the valve of wash pipe is opened and the gypsum crystal on contact head of pH meter is washed through the resin interface (8).
1.3 Technical Description and Working Principle
164. A sampling device for measuring the pH value of the liquid in FGD absorption tower is proposed by the technology. It has lower sampling opening at the bottom of absorption tower wall and upper sampling opening at the top of absorption tower wall. A lower nozzle is inserted downward at the lower sampling inlet and shut-off valve is installed outside the tower. An upper nozzle is inserted upward at the upper sampling inlet and shut-off valve is installed outside the tower. The upper pipe is connected with upper part of lower nozzle outside the tower and intersected with Y shape. The fluidization pipe is formed from the interaction to the upper part of lower nozzle. There is a cover on top of fluidization pipe. The sensor of pH meter is inserted downward from the cover to the fluidization pipe. There is an connector of wash pipe at the bottom of the intersection.
165. The slurry in absorption tower goes into fluidization pipe lower through lower sampling opening and is separated by lower nozzle. After precipitation of the gypsum crystal in the slurry, it is fed into absorption tower through the bottom of fluidization pipe and lower nozzle. The separated gypsum is fed into absorption tower through fluidization pipe and upper pipe.
1.4 Technical Application
166. The technology is applied to improve the operation stability and desulfurization efficiency of the FGD system in the coal fired power plant. The main reaction mechanism of desulphurization is: SO2 capture, formation of sulphate and gypsum crystal, and etc. These reactions are in closely relationship with the pH value.
Chemical process of SO2 capture
167. The process of SO2 capture includes chemical reaction of liquid phase and liquid phase of anisotropism/solid phase reaction. In the initial stage, after absorption into the water, the colliquable SO2 will have the following reaction:
SO2+H2O → “H2SO3“O H++HSO3 - ←→ 2H++ SO3
2- (1)
168. Figure 4-1 shows the relationship between reaction process and pH value of the product and solution. Upon research, the area above line 2 is existence region of SO3
2-; while the area between line 1 and line 2 is existence region of HSO3
-;
169. The area below line 1 is the equilibrium zone of SO2+H2O. When the pH value is 7.2, gram molecule mixture of sulfite equivalent and sulfurous acid hydrion is generated. When the pH value is less than 5, only sulfurous acid hydrion exists. When the pH value drops to below 4.5, the proportion of SO2 hydrate is enlarged and balanced with physical dissolved
Mitigation of Trans-Boundary Air Pollution from Coal-Fired Power Plants in Northeast Asia (TA No. 6371-REG) Final Report
182
SO2. When the pH value is between 5 and 6, the deliquescent SO2 exists in the form of sulfurous acid hydrion HSO3
-. Therefore, in order to ensure a sustained and efficient SO2 capture, the following measures should be taken: the pH value should be controlled between 5 and 6, and the reaction should be pushed toward the generation of 2H++ SO3
2-. The measures must be taken to remove one reaction product from formula (1) to maintain the ph value and concentration gradient of the reactant.
Figure 2: Dissolution of SO2 in Water
Formation of Sulphate
170. In order to keep the pH value between 5-6 and a favorable generation of 2H++SO32-
so that a sustained and efficient SO2 capture can be achieved, the measures must be taken to remove one reaction product from formula (4-1) and consume hydrion H+ to maintain the ph value and concentration gradient of the reactant. In order to achieve this purpose, the process of technical research of wet desulphurization should be adopted: hydrogen sulfate is oxidized to generate sulfate by adding oxygen and SO3
2- is reduced. The pH value is maintained between 5 to 6 by adding the adsorbent of CACO3 and consuming hydrion H+. Moreover, sulfate concentration of the solution is reduced through calcium sulphate generated by the reaction of sulfate and adsorbent.
171. After the gaseous SO2 is dissolved in solution, it generates HSO3- and the absorption
reaction gets into the second stage. During this period, HSO is oxidized to hydrogen sulfate by adding oxidation air and quickly resolved into SO4
2-, so that the required concentration gradient of SO2 dissolution is maintained (see Formula 2 for the reaction formula);
HSO3-+1/2O2 HSO4-SO4
2-+H+ (2)
172. Due to the release of sulfite ion, the reaction result shall make the pH value decline.
173. The study indicates that with sufficient oxidizer, any existing sulfite ion can be directly transformed to sulfate.
SO32-+1/2O2 SO4
2- (2)
012345678910
0 0.2 0.4 0.6 0.8 1
12
Mitigation of Trans-Boundary Air Pollution from Coal-Fired Power Plants in Northeast Asia (TA No. 6371-REG) Final Report
183
174. Calcium sulfite crystal, which exists in the form of solid state, will be fed into the solution again due to the reduction of SO3
2- concentration in this processing stage. Sulphate will be formed through further reaction.
175. Figure 4-2 shows the relationship between oxidation of sulfite and pH value. There is a huge impact on the oxidation reaction of sulfite from pH value and the impact is maximum when the pH value is 4.5-4.7. In addition, the impacts are also from temperature and impurity in the solution (catalysis activated metal of Mn, iron, and Mg, etc.). These micro metals get into wash suspension liquid primarily through adsorbent and flue gas.
Figure 3: Impact on the Oxidation Ratio of HSO3- from the pH Value
Source: Consultant.
176. After formation of sulphate, the reaction of SO2 capture gets to the final stage, i.e. generation of solid salt crystal and precipitation. The calcic solution is used in this project. The material generated is calcium sulphate and becomes gypsum CaSO4·2H2O by precipitation.
Ca2++ SO42-+2H2O CaSO4·aS2Oa (4)
Effect of pH Value on Crystallization
177. Change of the oxidation rate due to change of the pH value has the potential to directly influence the relative saturation of gypsum. As shown in Figure 2, when the pH value is 4.5, oxidation of sulfite is strongest. This shows that compared with the sulfite ion, oxidation of sulfite is much better. When the pH value reduces, oxidation rate reduction can be interpreted as concentrations decrease of HSO3
- (see Figure 1).
178. From the above reaction mechanism it can be seen clearly that stable operation of the desulfurization system and desulfurization efficiency of flue gas are directly related to absorber tower slurry pH value, which has been widely practiced.
3.3 3.7 4 4.5 5 6 6.8
Oxidation Ratio of HSO3-
Mitigation of Trans-Boundary Air Pollution from Coal-Fired Power Plants in Northeast Asia (TA No. 6371-REG) Final Report
184
Comparison with Traditional Measurement Methods
179. Compared with traditional measurement methods, the new technology has the following advantages: simple structure, energy saving, slurry in the pH measurement device can be naturally circulated to the absorber tower, and power equipment is not needed. PH meter contact is inserted down into the top of fluidization tube, with its top fixed through the connector to the coping, thus the pH meter contact will not be worn and polluted by gypsum crystals in slurry, and is easy to wash, which effectively solves the problem that the content is easy to wear and be polluted, and can ensure the measurement accuracy and meet the requirement of the desulfurization process.
1.5 Feasibility of Technical Improvement
180. From the above discussion the advantages of the technology in the practical application has been clearly expounded. Its ease of operation and technical feasibility are beyond doubt. Making a simple comparison on the economy, this technology needs only one device to achieve accurate pH test, and can implement non-power operation. In contrast, pipeline measurement needs two sets of equipment to choose data from one of them, which not only can easily cause confusion of numerical difference, but also has high cost and short maintenance period and needs be replaced frequently. The greatest disadvantage is that it needs a pump to provide power to get relatively accurate data of the full pipe. Both from the technical and economic perspective, the technology of pH value measurement and control method is optimal and has feasibility of popularization and application.
2. Project Application Case Study I
2.1 Power Plant Overview
181. Xuanwei Power Plant was built in 1958. After the four-phase construction in 1978, the power plant formed an installed capacity of 4x25+2x50=200 MW (#1~6 units). In 2001, the five-phase extension of the power plant constructing 2x300 MW units (#7, 8 units) was completed and put into operation. In June 2002, after the demolition of the old #1~6 units, the sixth-phase expansion project of 2x300 MW units (#9 and 10 units) started construction, and was put into operation in December 2003 and June 2004, respectively.
182. Xuanwei Power Plant continued the seventh-phase expansion (2x300 MW). When the sixth-phase extension project was planned and designed, project site was reserved in its main building-end for seventh-phase expansion. Two units of the seventh-phase project were completed in June 2006 and in January 2007, respectively. When the host of the power plant was put into operation, construction of the supporting FGD project was completed in the same period and started operation.
Mitigation of Trans-Boundary Air Pollution from Coal-Fired Power Plants in Northeast Asia (TA No. 6371-REG) Final Report
185
Table 1: List of Design Parameter of the Boiler and Other Main Equipment Device name Parameter Unit Value
Boiler
Type Subcritical natural circulation drum furnace
Evaporation of the super heater (BMCR) t/h 1025
Super heater outlet steam pressure (BMCR) MPa.g 18.24
Super heater outlet steam temperature (BMCR) ℃ 541
Evaporation of the reheater (BMCR) t/h 849.4
Reheater inlet pressure (BMCR) MPa.g 3.82
Reheater outlet pressure (BMCR) MPa.g 3.62
Reheater inlet temperature (BMCR) ℃ 3.22
Reheater outlet temperature (BMCR) ℃ 541
Boiler flue gas temperature (BMCR) ℃ 125.7
Actual coal consumption of boiler (BMCR) t/h 147.33 (Designed coal)
Dust collector
Quantity (per furnace) 2
Type Double room more electric field
Collection efficiency %
Induced draft fan outlet dust concentration mg/Nm3 150-200 (Designed coal)
Induced draft fan
Type and configuration (BMCR) A furnace with two
Wind volume m3/s 361.9
Wind pressure Pa 4804
Motor power kW 2500
Chimney Height / outlet diameter m 210/7.5
Material Reinforced concrete
Main flue
Flue gas velocity (design flow) m/s
Design pressure Pa ~2000
Section size mm×mm 5000×10000
Centerline elevation of the flue m 14.5
Source: Consultant
2.2 Desulfurization Process Overview
183. Xuanwei Power Plant’s FGD uses the limestone - gypsum wet FGD technology.
Mitigation of Trans-Boundary Air Pollution from Coal-Fired Power Plants in Northeast Asia (TA No. 6371-REG) Final Report
186
184. According to the principle of unified planning, centralized layout, phased implementation of the sixth and seventh phase desulphurization project, interface and reserve sites was left for the sixth phase desulphurization project in the design of thermal control, civil engineering, process and technology and electric. This project were divided into two phases, the first phase for #11 and #12 furnace FGD, and the second phase for #9 and #10 furnace FGD. The design desulfurization efficiency is not less than 90%. Each furnace has an absorber, with supporting desulfurization blower and flue gas heat exchanger connected with flue for gas desulfurization.
185. The sixth and seventh phase desulfurization projects share the absorbent preparation system, secondary gypsum dewatering system, process water system and spare slurry discharge system. Each furnace has a separate desulfurization booster fan, flue gas heat exchanger, absorbing tower and gypsum hydrocyclone.
186. The absorbent preparation system uses outsampling limestone blocks (limestone blocks is less than 50 mm) and constructs wet grinding slurry system. The system has two limestone wet ball mills, one for operation and another for backup. The capacity of a single unit is designed based on the design coal for 75% of limestone consumption of the four boilers working under BMCR.
187. The secondary gypsum dewatering system has two vacuum belt dryers, one for operation and another for backup. Each output is determined based on 75% of limestone consumption of the four boilers working under BMCR. Secondary gypsum dewatering system adopts two vacuum belt dehydrators, one for operation and another for backup. The output of each dehydrator is in the light of burning design coal when 75% of the required gypsum consumption of the four boilers working under BMCR. The by-product gypsum which is generated by desulphurization is temporarily piled up in the store room and delivered to the lime plant for storage.
188. Considering the needs of the sixth-phase desulfurization for process water system, the project set up a process water tank and three process pumps.
189. Spare slurry tank’s volume is 100% of the volume of a single absorber slurry tank. When the system is in overhaul and repair, gypsum slurry is pumped to the spare slurry tank. After overhaul, gypsum slurry is pumped back to the absorber, thus the time needed for system operation can be shortened.
2.3 Main Technical Parameter
Table 2: Coal Component Analysis
Item Symbol Unit Designed
Coal Quality
Checked Coal Quality (A)
Checked Coal Quality
(B)
Total moisture Mt % 6.20 7.50 5.35
Base water Mad % 1.14 1.39 1.09
Ash Aar % 35.10 39.25 31.50
Volatile matter Vdaf % 27.96 28.82 26.11
Mitigation of Trans-Boundary Air Pollution from Coal-Fired Power Plants in Northeast Asia (TA No. 6371-REG) Final Report
187
Item Symbol Unit Designed
Coal Quality
Checked Coal Quality (A)
Checked Coal Quality
(B)
Gross calorific value Qgr.ar MJ/kg 20.31 17.98 22.06
Net calorific value Qnet.ar MJ/kg 19.54 17.58 21.42
Qnet.ar Kcal/kg 4667 4198 5116
Carbon Car % 49.91 44.16 55.29
Hydrogen Har % 3.03 2.97 2.90
Oxygen Oar % 4.61 5.05 3.87
Nitrogen Nar % 0.87 0.83 0.79
Total sulfur St.ar % 0.38 0.31 0.41
Iron sulfide sulfur SP.ar % 0.22 0.07 0.20
Sulfate sulfur Ss.ar % 0.01 0.02 0.02
Organic sulfur So.ar % 0.15 0.25 0.19
Combustible sulfur Sc.ar % 0.28 0.24 0.30
Harrington wear index HGI 86 90 86
USSR thermal wear index BTU 1.62 1.62 1.61
Wear index Al mg/kg 11
Ash deformation temperature DT °C 1240 1190 1250
Ash softening temperature ST °C 1320 1280 1380
Ash flow temperature FT °C 1390 1320 1410
Source: Consultant
Table 3: Coal Consumption (number of hours in use by 6000 hours) #11 Furnace #12 Furnace
Hourly Coal Consumption (t) 147.33 147.33
Yearly Coal Consumption (t) 883980 883980
Source: Consultant
190. Limestone mineral is rich in the areas surrounding Xuanwei Power Plant. A limestone slurry wet ball mill grinding system is set in the plant. Absorbent of limestone blocks (0-50 mm) is outsourced and pulped in the plant.
Parameters of the Limestone Desulfurization Absorbent Component
Calcium oxide (CaO) 52.25% Magnesium oxide (MgO) 3.00% Silicon dioxide (SiO2) Trace Loss on ignition 44.06% Other 0.83%
Mitigation of Trans-Boundary Air Pollution from Coal-Fired Power Plants in Northeast Asia (TA No. 6371-REG) Final Report
188
Main Technical Indicators
Parameters of the desulfurization device inlet flue gas:
Flue gas volume: 1,191,600 Nm3/h (Standard conditions, wet, and actual O2) Flue gas volume: 1,113,431 Nm3/h (Standard conditions, wet, and actual O2) O2 content in flue gas: 7.39 % (Standard conditions, dry state, and actual O2) Content of SO2 in the flue gas: 937 mg/Nm3 (Standard conditions, dry state, and
actual O2) Flue gas dust content: <300 mg/Nm3 (Standard conditions, dry state, and actual O2) Flue gas temperature: 118°C
Parameters of the desulfurization device outlet flue gas:
Content of SO2 in the flue gas: 93.7 mg/Nm3 (Standard conditions, dry state, and actual O2)
Flue gas dust content: 100 mg/Nm3 (Standard conditions, dry state, and actual O2) Flue gas temperature: 80°C The desulfurization efficiency: 90% Calcium sulfide ratio: 1.03 mol/mol Amount of gypsum: 2.89 t/h
2.4 Parameter Comparison before and after Demonstration Technology Application
191. The sixth and seventh phase FGD project of Xuanwei Power Plant is divided into two periods. The seventh phase project is an expansion project, which started simultaneously with the host and was completed in December 2006. The system design uses the traditional measuring way of setting two pH meters on the pipe. The sixth-phase desulfurization project is a technological transformation project. It was completed in October 2008. The design uses this new technology of optimized absorber pH measurement and control. This two desulfurization projects have been running for more than three years. The two types of pH measurement technologies are applied in the Xuanwei project; such practical application is most persuasive. After on-site follow-up visit, we get the following data as shown in the table below.
Table 4: Performance of The Project
Unit Item Seventh Phase (#11 and #12 unit) Sixth Phase (#9 and #10 unit)
pH measurement Traditional pipeline bypass measurement
Optimized absorber pH measurement and control
method
Number of pH measurement device 2 sets (mutual backup) 1 set
Power provided Gypsum slurry discharge pump (37 kW) Does not require
Maintenance period Replace 1 electrode in 1 to 2 months Automatic periodic flushing, 1
Mitigation of Trans-Boundary Air Pollution from Coal-Fired Power Plants in Northeast Asia (TA No. 6371-REG) Final Report
189
Unit Item Seventh Phase (#11 and #12 unit) Sixth Phase (#9 and #10 unit)
year replacement and maintenance cycle
Ease of maintenance Difficult Easy
Accuracy of PH value measurement
(As sampling verification)
Error 8%, usually two sets of appliance have different data
differences. It is hard to determine which data is accurate
Error rate lower than 5%
Source: Xuanwei Power Plant
Table 5: Technical and Economic Indicators
Unit Item
Seventh phase (#11 and #12 units)
Sixth phase (#9 and #10 units)
Initial unit acquisition cost 30,000 yuan 15,000 yuan
Annual operating costs 15,000 yuan 3,000 yuan
Power consumption 0.1 MW Not need
Source: Xuanwei Power Plant
192. From the above simple comparison, it can be clearly seen that the optimized absorber pH measurement and control method has obvious advantages, and has a very wide application.
3. Case Study II
3.1 Plant Summary
193. Shentou second power plant is located in southwest of Shentou town, Sucheng District, Shuozhou City of Shanxi Province, approximately 1.5 km from the first power plant in Shentou, and about 25 km from Pingshuo opencast mine. Its exact location is in the south of Dawa village, east of Yangjian coal mine railway line, north of Tongpu railway, west of Shentou first power plant.
194. Shentou second power plant has an installed capacity of 4x500 MW, consisting of the Phase I 2x500 MW and the Phase II 2x500 MW. The two phases were put into production in 1991 and 1992, respectively.
Mitigation of Trans-Boundary Air Pollution from Coal-Fired Power Plants in Northeast Asia (TA No. 6371-REG) Final Report
190
Table 6: Parameters of the Power Plant Equipment Equipment
Name Parameter Name Unit Parameter
Boiler
Type Subcritical single medium reheat lower circulating direct tower boiler
Superheater outlet steam temperature (BMCR) °C 540
Reheater evaporation (BMCR) t/h 1481
Reheater inlet pressure (BMCR) MPa.g 4.294
Reheater outlet pressure (BMCR) MPa.g 4.082
Reheater inlet temperature (BMCR) °C 333
Reheater outlet temperature (BMCR) °C 540
Boiler flue gas temperature (BMCR) °C 158
Chimney Height m 270
Material Concrete
Source: Xuanwei Power Plant
Table 7: Main ESP Specifications 1 Model EKG2/70/15/8/4/250/6/1
2 Flue gas volume (for each) 881.3 m3/h
3 Inside flue gas velocity 1.29 m/s
4 Operational flue gas temperature 139°C
5 Proportion of flue gas 0.771 Kg/m3
6 Inlet ash content 30 g/m3
7 Surface area of settlement plate 43581.44 m2
8 Width of settlement plate 1.5 m
9 Height of settlement plate 15 m
10 Operating tension 44~54 KV
11
Efficiency of dust collection 99%
First section efficiency 85~90%
Second section efficiency 11%
Third section efficiency 3%
Forth section efficiency 1%
Mitigation of Trans-Boundary Air Pollution from Coal-Fired Power Plants in Northeast Asia (TA No. 6371-REG) Final Report
191
Source: Xuanwei Power Plant
Table 8: Main Parameters of Draft Fan
Draft fan
Model ARB4500—2A/90
Number 2
Rotor outside diameter 4500 mm
Efficiency 84%
Flow rate 472 m3/S
Total pressure 2028 Pa
Flue gas temperature 139°C
Density 0.771 kg/m3
Pressure loss at back of boiler 538 Pa
Stack draft -190 Pa
Pressure loss of boiler 2160 Pa
Outlet pressure 516 m3/s
Pressure 2,562 Pa
Accommodation mode Inlet control baffle plate
Pressure loss at back of boiler 646 Pa
Highest flue gas temperature 150°C
Motor
Model YKK2200-16
Speed 372 rpm
Power 2,200 kW
Model ARB4500—2A/90
Voltage 6 KV
Current 292 A
Rated power factor 0.76
Source: Xuanwei Power Plant
3.2 Overview of the Desulfurization Process
195. The FGD project of Shentou second power plant uses wet limestone-gypsum method, and the desulfurization equipment adopts the one boiler with one tower scheme. The desulphurization efficiency is not less than 95% when designed coal is burnt. The single unit capacity is 500 MW, the maximum continuous evaporation of each boiler is 1,650 t/h, the volume of flue gas is 1,700,000 Nm3/h (standard condition, dry, designed coal species) and 1802000 Nm3/h (standard condition, wet, designed coal species). The generation of each FGD set is designed on the basis of BMCR boiler. The smallest adjustable capacity is in line with a single furnace without fuel oil and with the lowest stable combustion load (that is 60% MCR condition, flue gas flow of designed coal). FGD can safely operate under the boiler BMCR condition with inlet gas temperature plus 10 degrees. Under accident conditions, the inlet gas temperature of FGD unit shall not exceed 180ºC. When the temperature reaches 180ºC, full-flow of the bypass bezel will immediately open.
Mitigation of Trans-Boundary Air Pollution from Coal-Fired Power Plants in Northeast Asia (TA No. 6371-REG) Final Report
192
196. The FGD process system is mainly composed by limestone slurry preparing system, flue gas system, SO2 absorption system, and oxidation system, gypsum dewatering system, process water system, wastewater dredging system, miscellaneous and metric compressed air system and so on.
3.3 Main Technical Parameters
Table 9: Coal Quality Information Name and Symbol Unit Designed Coal Checked Coal
Industrial analysis
Mar % 7.5
Aar % 35
Var % 24.38
Qnet,ar kJ/kg 18,183
Elementary analysis
Car % 38.74
Nar % 0.86
St,ar % 1.3 1.5
Source: Consultant
Table 10: FGD Inlet Flue Gas Parameters under 100% Load
Item Unit Working Condition of boiler BMCR
Designed coal Checked coal
CO2 Vol%
O2 Vol%
NOx Vol%
SO2 Vol%
H2O Vol%
FGD inlet flue gas volume (dry state) Nm3/h 1,700,000 (BMCR)
FGD inlet flue gas volume (wet state) Nm3/h 1,802,000 (BMCR)
FGD inlet flue gas temperature °C 158 (BMCR)
FGD bypass operating lowest temperature °C ≥180
FGD inlet flue gas pressure Pa 0
Source: Xuanwei Power Plant
Table 11: Flue Gas Pollutants under Boiler BMCR Condition
Item Unit Data
Designed Coal Checked Coal
SO2 mg/Nm3 4116
SO3 mg/Nm3 100
Cl (HCl) mg/Nm3 50
Mitigation of Trans-Boundary Air Pollution from Coal-Fired Power Plants in Northeast Asia (TA No. 6371-REG) Final Report
193
Item Unit Data
Designed Coal Checked Coal
F (HF) mg/Nm3 20
Dust concentration (draft fan outlet) mg/Nm3 350
Source: Xuanwei Power Plant
Table 12: Limestone Analytical Information Item Unit Data Remark
CaCO3 % 97.96
SiO2 % 0.82
CaO % 54.86
MgO % 0.64
Al2O3 % 0.88
P2O3 %
S %
Item Unit Data Remark
Fe2O3 % 0.14
Particle diameter mm ≤50
Source: Xuanwei Power Plant
197. The FGD performance guarantee values are as follows:
1) SO2 removal rate and desulfurization device outlet concentration of SO2
During the acceptance test period (continuous operation for 14 days under the design condition), SO2 removal rate is 95.5%, and desulfurization device outlet concentration is 185.2 mg /Nm3 (designed coal).
2) Calcium and sulfur ration is 1.025 after appliance run for 14 consecutive days.
3) Gypsum quality
CaCO3+MgCO3 content <3% (free water-less gypsum as the basis)
CaSO3﹒1/2H2O content <0.35% (free water-less gypsum as the basis)
Moisture content of Gypsum <10%
4) Under any normal operating condition, the water content of demister outlet gas is less than 75 mg/Nm3 (dry basis).
5) Absorber tower net flue gas temperature is not less than 48°C.
6) Absorber tower net flue gas dust concentration is not greater than 87.5 mg/Nm3 (dry basis).
7) Equipment availability within tender scope: greater than 95% one year after the
Mitigation of Trans-Boundary Air Pollution from Coal-Fired Power Plants in Northeast Asia (TA No. 6371-REG) Final Report
194
formal transfer.
3.4 Parameter Comparison before and after Demonstration Technology Application:
198. Shentou second power plant achieves real-time monitoring of pH value in absorber tower slurry through the absorber tower pH value measurement and control method. Safe and stable operation has been maintained since commissioning. There has never been a pH meter measurement error and other problems that can cause damage to the system, which provides strong guarantee for the system desulfurization efficiency and improves the quality of plaster.
3.5 Technical and Economical Indices
199. With the optimal absorption tower pH value measurement and control method adopted, it is important to ensure the pH values of slurry in the absorber tower of desulfurization system is always maintained between 5~5.5 to achieve the best state of sulfur dioxide absorbing and gypsum crystals, and the system desulfurization efficiency above 95%, so that power plant can smoothly get the millions yuan of return from the environmental protection sector every year and produce good economic benefits.
4. Case study III
4.1 Plant Profile
200. Shenhua Shendong Dianli Xinjiang Miton Thermal Power Plant is located in the northern suburb of Urumqi, Xinjiang, where belongs to the Jinhe industrial park area of Urumqi Dongshan District. The specific location is east longitude 87°40' and north latitude 43°56.5'. West of the plant is Urumqi City Seven-Bay Road, east is Shenhua Xinjiang subsidiary, south is the Thaihua Park, and north is southern suburb of Miquan city. About 1.3 km south of the plant is the railway line to the large factories at the northern suburb of Urumqi City. Wenguang Station of Urumqi is 7.2 km west.
201. The project constructed a 2x300 MW CFB direct air cooling steam extraction unit. The expansion room is prepared. The generated electricity is delivered to Dongshan 220 kV substation by two 220 kV voltage outgoing lines. Two 110 kV voltage outgoing lines are connected to Dongshan substation or Shuguang substation. The produced industrial steam is delivered to the PVC device of Xinjiang Zhongtai Chemistry Co., Ltd. The produced heating steam is delivered to the first station of the heating network in the plant. After heat exchange, the high-temperature water is delivered to Dongshan and Miquan heating area, respectively. The required raw coal and coal gangue of the power plant are provided by Tiechanggou coal mine and Jiangou coal mine. The fuel transportation of the power plant adopts road transportation. The ash removing of the power plant is separate from slag removing, using dry ash handling system.
202. The plant selects the DG1069/17.5-II16 CFB boiler produced by Dongfang Boiler (Group) Company Limited, CZK300-16.67/0.4/538/538 two-cylinder dual exhaust direct air cooling steam turbine produced by Shanghai Electric Group Company Limited, and
Mitigation of Trans-Boundary Air Pollution from Coal-Fired Power Plants in Northeast Asia (TA No. 6371-REG) Final Report
195
QFSN-300-2 type water-hydrogen-hydrogen generator produced by Shanghai Electric Group Company Limited.
Table 13: Boiler and Auxiliary Parameters Equipment Name Parameter Name Unit Data
Boiler
Type Subcritical parameter,
natural circulation, single medium reheat, and national
independent CFB boiler
Maximum Continuous evaporation t/h 1069
Number 2
Actual coal consumption of boiler t/h 252.9 (design coal)
Dust collector
Number (each boiler) 2
Type Electric-bag composite dust collector
Dust collection efficiency % ≥99.91
Draft fan Type Movable vane adjustable
axial stream mode
Number (each fan) 2
Chimney Height m 156 m
Export diameter (inner tube) m 7.0
Source: Xuanwei Power Plant
4.2 Overview of Desulfurization Process
203. This project uses limestone-gypsum wet FGD technology. #1 and #2 units desulphurization project adopts the scheme of one boiler with one tower. Each furnace is equipped with a booster fan. Pressurized flue gas enters into the absorber tower to be decarbolized.
204. The absorbent preparing system of the project uses wet overflow ball mill. A single row provides 75% dosage for the 2x300 MW unit. The absorbent of the desulfurization system, limestone slurry, provides slurry for the absorber tower through the slurry supplying system. Two slurry pumps are set to provide slurry for the absorber tower, one for use and one for backup.
205. The by-product gypsum produced by desulfurization becomes plaster slurry with a solid content of 50% through treatment by Class I hydrocyclone. After plaster slurry flows into the vacuum belt, it is dehydrated into dehydrated gypsum containing 10% of water. The separate vacuum belt dehydration system can produce the amount of gypsum needed by the 2x300 MW unit with 75% load. Comprehensive utilization should be considered for desulfurized gypsum. When the comprehensive utilization is difficult, it will be carried to the ash yard by truck transport.
206. Desulfurization process systems include flue system, absorber tower system, oxidization system, Level I and II gypsum slurry dewatering system, process water system,
Mitigation of Trans-Boundary Air Pollution from Coal-Fired Power Plants in Northeast Asia (TA No. 6371-REG) Final Report
196
industrial water system, drainage system, absorbent preparing system, absorbent supply system and wastewater treatment system.
4.3 Main Technical Parameters
Table 14: Parameter of Coal-fired Boiler
Item Symbol Unit Designed Coal Quality
Checked Coal
Quality (A)
Checked Coal
Quality (B)
Elemental analysis
Received base carbon Car % 34.73 31.77 45.98
Received base hydrogen Har % 1.95 1.78 2.61
Received base oxygen Oar % 9.63 9.88 8.65
Received basic nitrogen Nar % 0.41 0.37 0.54
Received base total sulphur St, ar % 0.91 0.89 0.95
Boiler flue gas pollutant composition under the BMCR condition (standard state, dry basis, 6% O2)
Item Unit Designed coal
SO2 mg/Nm3 347
SO3 mg/Nm3 100
Cl (HCl) mg/Nm3 50
F (HF) mg/Nm3 25
Dust (FGD inlet) mg/Nm3 50
Mitigation of Trans-Boundary Air Pollution from Coal-Fired Power Plants in Northeast Asia (TA No. 6371-REG) Final Report
198
Source: Consultant
Table 16: Limestone Parameters Components Unit Data
SiO2 % 0.44
Al2O3 % 0.61
Fe2O3 % 0.30
CaO % 53.74
MgO % 0.65
Na2O % 0.14
K2O % 0.025
SO3 % 0.021
CaCO3 % 95.91
Particle size mm ≤20
Limestone activity —
According to technical needs, the seller self-testing limestone activity value. Buyer will provide samples of limestone in a federation.
4.4 Main Technical Index
Parameters of desulfurization device inlet flue gas
Flue gas amount: 1,197,687 Nm3/h (standard conditions, wet, actual O2) Flue gas amount: 1,111,057 Nm3/h (standard conditions, dry, actual O2) Flue gas O2 amount: 5.36% (standard conditions, wet, actual O2) Flue gas SO2 amount: 347 mg/ Nm3 (standard conditions, dry, actual O2) Flue gas dust content: 50 mg/Nm3 (standard conditions, dry, actual O2) Flue gas temperature: 128°C
Desulfurization device inlet flue gas parameters
Flue gas SO2 amount: 17.4 mg/Nm3 (standard conditions, dry, actual O2) Flue gas dust content: 12.5 mg/Nm3 (standard conditions, dry, actual O2) Flue gas temperature: 48.3°C Desulfurization efficiency: 95% Calcium sulfur ratio: 1.025 mol/mol Gypsum amount: 2.6 t/h (10% water)
Material consumption index in desulfurization system:
Limestone consumption: 1.5 t/h Desulfurization device power consumption: 5,250 kW Process water: 119 t/h
Mitigation of Trans-Boundary Air Pollution from Coal-Fired Power Plants in Northeast Asia (TA No. 6371-REG) Final Report
199
Industrial water use: 8 t/h
Demonstration project and technology economic indicator
207. The power plant and FGD works were simultaneously constructed and put into operation in December 2010, and have been running to this day. The optimal pH value measurement and control method has been successfully applied in multiple projects with first-hand information collected that proves that this new technology is mature and reliable, and has the technical and economic feasibility. So in the design stage of this desulfurization works to use the optional absorber tower pH value measurement and control method will certainly become an easy and effective management tool of the power plant, to guarantee stability of the desulfurization system, improve the desulfurization efficiency, and reduce maintenance fees and save money.