8/2/2019 Final Spss Output-table
http://slidepdf.com/reader/full/final-spss-output-table 1/35
Frequencies
Statistics
Gender
AgeGroup
Name of your bank
Education
Occupation
Familysize
Incomelevel
BrandLoyaltyof SBI
Brandloyalty of
ICICI
ServicePrefer Of
SBI
ServicePrefer of
ICICI
ServiceQuality of
SBI
Service
Quality
Of ICICI
N Valid104 104 104 104 104 104 104 52 54 51 54 49
54
Missing
0 0 0 0 0 0 0 52 50 53 50 5550
Frequency Table & Bar Chart
Gender
Frequency Percent Valid PercentCumulative Percent
Valid 169 66.3 66.3
66.3
2 35 33.7 33.7 100.0
Total 104 100.0 100.0
8/2/2019 Final Spss Output-table
http://slidepdf.com/reader/full/final-spss-output-table 2/35
Age Group
Frequency Percent Valid PercentCumulative Percent
Valid 150 48.1 48.1
48.1
219 18.3 18.3
66.3
3 19 18.3 18.384.6
4 16 15.4 15.4100.0
Total 104 100.0 100.0
8/2/2019 Final Spss Output-table
http://slidepdf.com/reader/full/final-spss-output-table 3/35
Name of your bank
Frequency Percent Valid Percent Cumulative Percent
Valid 153 51.0 51.0
51.0
251 49.0 49.0
100.0
Total 104 100.0 100.0
8/2/2019 Final Spss Output-table
http://slidepdf.com/reader/full/final-spss-output-table 4/35
Education
Frequency Percent Valid PercentCumulative Percent
Valid 14 3.8 3.8
3.8
216 15.4 15.4
19.2
3 18 17.3 17.336.5
4 53 51.0 51.087.5
5 13 12.5 12.5100.0
Total 104 100.0 100.0
8/2/2019 Final Spss Output-table
http://slidepdf.com/reader/full/final-spss-output-table 5/35
Occupation
Frequency Percent Valid PercentCumulative Percent
Valid 137 35.6 35.6
35.6
2 32 30.8 30.8 66.3
3 23 22.1 22.188.5
4 12 11.5 11.5100.0
Total 104 100.0 100.0
8/2/2019 Final Spss Output-table
http://slidepdf.com/reader/full/final-spss-output-table 6/35
Family size
Frequency Percent Valid PercentCumulative Percent
Valid 153 51.0 51.0
51.0
244 42.3 42.3
93.3
3 7 6.7 6.7100.0
Total 104 100.0 100.0
8/2/2019 Final Spss Output-table
http://slidepdf.com/reader/full/final-spss-output-table 7/35
Income level
Frequency Percent Valid PercentCumulative Percent
Valid 124 23.1 23.1
23.1
230 28.8 28.8
51.9
3 31 29.8 29.881.7
4 19 18.3 18.3100.0
Total 104 100.0 100.0
8/2/2019 Final Spss Output-table
http://slidepdf.com/reader/full/final-spss-output-table 8/35
Brand Loyalty of SBI
Frequency Percent Valid PercentCumulative Percent
Valid 114 13.5 26.9
26.9
29 8.7 17.3
44.2
3 13 12.5 25.069.2
4 4 3.8 7.776.9
5 12 11.5 23.1100.0
Total 52 50.0 100.0
Missing System 52 50.0
Total 104 100.0
8/2/2019 Final Spss Output-table
http://slidepdf.com/reader/full/final-spss-output-table 9/35
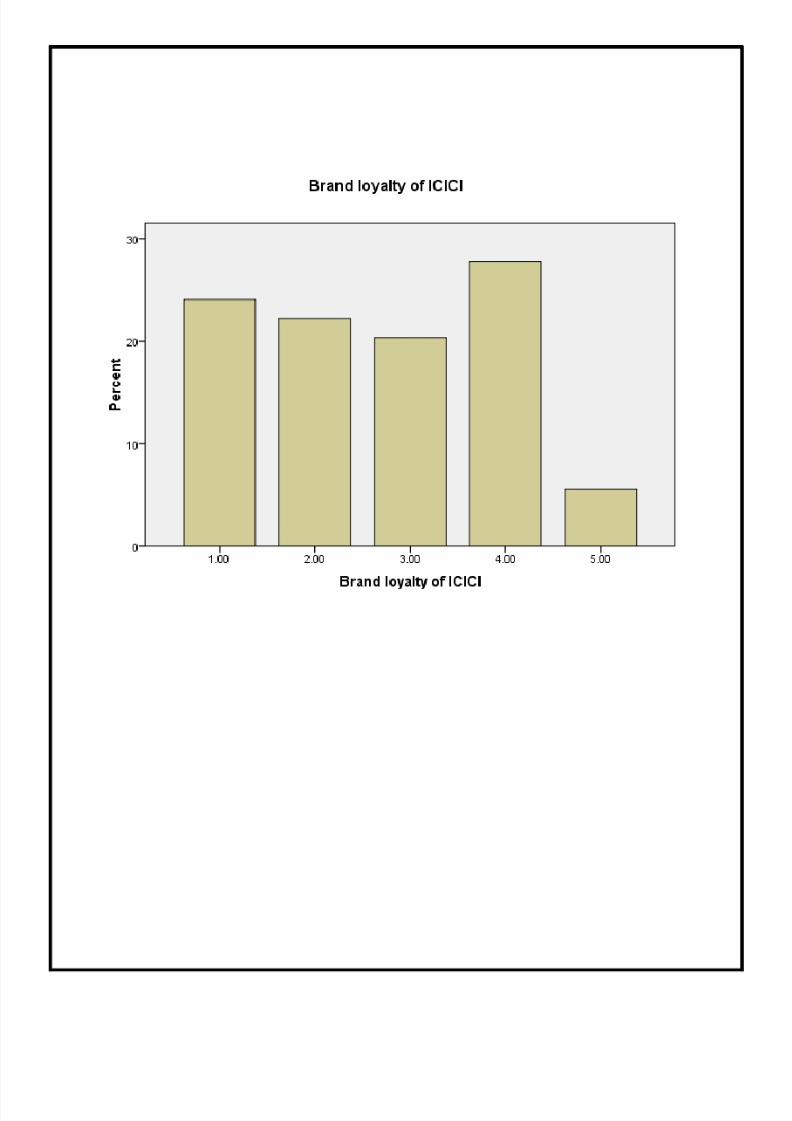
Brand loyalty of ICICI
Frequency Percent Valid PercentCumulative Percent
Valid 113 12.5 24.1
24.1
212 11.5 22.2
46.3
3 11 10.6 20.466.7
4 15 14.4 27.894.4
5 3 2.9 5.6100.0
Total 54 51.9 100.0
Missing System 50 48.1
Total 104 100.0
8/2/2019 Final Spss Output-table
http://slidepdf.com/reader/full/final-spss-output-table 10/35
8/2/2019 Final Spss Output-table
http://slidepdf.com/reader/full/final-spss-output-table 11/35
Service Prefer Of SBI
Frequency Percent Valid PercentCumulative Percent
Valid 129 27.9 56.9
56.9
28 7.7 15.7
72.5
3 4 3.8 7.880.4
4 10 9.6 19.6100.0
Total 51 49.0 100.0
Missing System 53 51.0
Total 104 100.0
8/2/2019 Final Spss Output-table
http://slidepdf.com/reader/full/final-spss-output-table 12/35
Service Prefer of ICICI
Frequency Percent Valid PercentCumulative Percent
Valid 19 8.7 16.7
16.7
220 19.2 37.0
53.7
3 12 11.5 22.275.9
4 13 12.5 24.1
100.0
Total 54 51.9 100.0
Missing System 50 48.1
Total 104 100.0
8/2/2019 Final Spss Output-table
http://slidepdf.com/reader/full/final-spss-output-table 13/35
8/2/2019 Final Spss Output-table
http://slidepdf.com/reader/full/final-spss-output-table 14/35
Service Quality of SBI
Frequency Percent Valid PercentCumulative Percent
Valid 14 3.8 8.2
8.2
213 12.5 26.5
34.7
3 28 26.9 57.191.8
4 4 3.8 8.2100.0
Total 49 47.1 100.0
Missing System 55 52.9
Total 104 100.0
8/2/2019 Final Spss Output-table
http://slidepdf.com/reader/full/final-spss-output-table 15/35
8/2/2019 Final Spss Output-table
http://slidepdf.com/reader/full/final-spss-output-table 16/35
Service Quality Of ICICI
Frequency Percent Valid PercentCumulative Percent
Valid 14 3.8 7.4
7.4
224 23.1 44.4
51.9
3 12 11.5 22.274.1
4 9 8.7 16.790.7
5 5 4.8 9.3100.0
Total 54 51.9 100.0
Missing System 50 48.1
Total 104 100.0
8/2/2019 Final Spss Output-table
http://slidepdf.com/reader/full/final-spss-output-table 17/35
10. Rank Services Provided ( if you've chosen SBI) [Services / Products were well
explained.]
Frequency Percent Valid PercentCumulative Percent
Valid 17 6.7 14.3
14.3
29 8.7 18.4
32.7
3 16 15.4 32.765.3
4 13 12.5 26.591.8
5 4 3.8 8.2100.0
Total 49 47.1 100.0
Missing System55 52.9
Total 104 100.0
8/2/2019 Final Spss Output-table
http://slidepdf.com/reader/full/final-spss-output-table 18/35
8/2/2019 Final Spss Output-table
http://slidepdf.com/reader/full/final-spss-output-table 19/35
10. Rank Services Provided ( if you've chosen SBI) [Service is always provided in a timely
manner.]
Frequency Percent Valid PercentCumulative Percent
Valid 11 1.0 2.0
2.0
215 14.4 30.6
32.7
3 16 15.4 32.7 65.3
4 12 11.5 24.589.8
5 5 4.8 10.2100.0
Total 49 47.1 100.0
Missing System 55 52.9
Total 104 100.0
8/2/2019 Final Spss Output-table
http://slidepdf.com/reader/full/final-spss-output-table 20/35
10. Rank Services Provided ( if you've chosen SBI) [Staff members are helpful.]
Frequency Percent Valid PercentCumulative Percent
Valid 12 1.9 4.1
4.1
213 12.5 26.5
30.6
3 20 19.2 40.871.4
4 11 10.6 22.493.9
5 3 2.9 6.1100.0
Total 49 47.1 100.0
Missing System 55 52.9
Total 104 100.0
8/2/2019 Final Spss Output-table
http://slidepdf.com/reader/full/final-spss-output-table 21/35
8/2/2019 Final Spss Output-table
http://slidepdf.com/reader/full/final-spss-output-table 22/35
...Rank Services Provided ( if you've chosen ICICI) [Services / Products were well
explained.]
Frequency Percent Valid PercentCumulative Percent
Valid 1 5 4.8 9.3 9.3
27 6.7 13.0
22.2
3 20 19.2 37.059.3
4 20 19.2 37.096.3
5 2 1.9 3.7100.0
Total 54 51.9 100.0
Missing System 50 48.1
Total 104 100.0
8/2/2019 Final Spss Output-table
http://slidepdf.com/reader/full/final-spss-output-table 23/35
8/2/2019 Final Spss Output-table
http://slidepdf.com/reader/full/final-spss-output-table 24/35
...Rank Services Provided ( if you've chosen ICICI) [Service is always provided in a timely
manner.]
Frequency Percent Valid PercentCumulative Percent
Valid 1 3 2.9 5.6 5.6
27 6.7 13.0
18.5
3 12 11.5 22.240.7
4 23 22.1 42.683.3
5 9 8.7 16.7100.0
Total 54 51.9 100.0
Missing System 50 48.1
Total 104 100.0
8/2/2019 Final Spss Output-table
http://slidepdf.com/reader/full/final-spss-output-table 25/35
...Rank Services Provided ( if you've chosen ICICI) [Staff members are helpful.]
Frequency Percent Valid PercentCumulative Percent
Valid 15 4.8 9.3
9.3
26 5.8 11.1
20.4
3 14 13.5 25.946.3
4 17 16.3 31.5
77.8
5 12 11.5 22.2100.0
Total 54 51.9 100.0
Missing System 50 48.1
Total 104 100.0
8/2/2019 Final Spss Output-table
http://slidepdf.com/reader/full/final-spss-output-table 26/35
Descriptive
8/2/2019 Final Spss Output-table
http://slidepdf.com/reader/full/final-spss-output-table 27/35
Descriptive Statistics
N MeanStd. Deviation
Age Group104 2.0096
1.13630
Family size104 1.5577
.62047
Income level104 2.4327
1.04058
10. Rank Services Provided ( if you've
chosen SBI) [Services / Products were well
explained.]
49 2.961.172
10. Rank Services Provided ( if you've
chosen SBI) [Service is always provided in
a timely manner.]
49 3.101.026
10. Rank Services Provided ( if you've
chosen SBI) [Staff members are helpful.] 49 3.00.957
...Rank Services Provided ( if you've chosen
ICICI) [Services / Products were well
explained.]
54 3.131.010
...Rank Services Provided ( if you've chosen
ICICI) [Service is always provided in a
timely manner.] 54 3.52
1.094
...Rank Services Provided ( if you've chosen
ICICI) [Staff members are helpful.] 54 3.461.224
Valid N (list wise) 2
8/2/2019 Final Spss Output-table
http://slidepdf.com/reader/full/final-spss-output-table 28/35
Nonparametric Correlations
Correlations
Service Quality of
SBI
Service Quality Of
ICICI
Spearman's rho Service Quality of SBI Correlation Coefficient1.000
-.500
Sig. (2-tailed) . .667
N49
3
Service Quality Of ICICI Correlation Coefficient-.500
1.000
Sig. (2-tailed).667
.
N3
54
Median
Statistics
Service Quality of
SBI
Service Quality Of
ICICI
N Valid 49 54
Missing55
50
Median3.0000
2.0000
8/2/2019 Final Spss Output-table
http://slidepdf.com/reader/full/final-spss-output-table 29/35
8/2/2019 Final Spss Output-table
http://slidepdf.com/reader/full/final-spss-output-table 30/35
Chi-Square Test
Frequencies
Education
Observed N Expected NResidual
14 20.8
-16.8
216 20.8
-4.8
3 18 20.8-2.8
4 53 20.832.2
5 13 20.8-7.8
Total 104
Brand Loyalty of SBI
Observed N Expected NResidual
114 10.4
3.6
29 10.4
-1.4
3 13 10.42.6
4 4 10.4-6.4
5 12 10.41.6
Total 52
Test Statistics
8/2/2019 Final Spss Output-table
http://slidepdf.com/reader/full/final-spss-output-table 31/35
Education
Brand Loyalty of
SBI
Chi-Square67.827a 6.269b
df 4 4
Asymp. Sig..000
.180
a. 0 cells (.0%) have expected frequencies less than 5.
The minimum expected cell frequency is 20.8.
b. 0 cells (.0%) have expected frequencies less than 5.
The minimum expected cell frequency is 10.4.
8/2/2019 Final Spss Output-table
http://slidepdf.com/reader/full/final-spss-output-table 32/35
Chi-Square Tests for SBI Bank
Crosstabs 1
Case Processing Summary
Cases
Valid MissingTotal
N Percent N Percent NPercent
Education * Brand Loyalty of SBI
52 50.0% 52 50.0% 104 100.0%
Education * Brand Loyalty of SBI Cross tabulation
% of TotalBrand Loyalty of SBI
Total
1 2 3 4 5
Education 11.9% 1.9%
3.8%
29.6% 1.9% 1.9%
13.5%
33.8% 1.9% 3.8% 5.8% 1.9%
17.3%
4 7.7% 9.6% 17.3% 1.9% 17.3%53.8%
55.8% 5.8%
11.5%
Total 26.9% 17.3% 25.0% 7.7% 23.1% 100.0%
8/2/2019 Final Spss Output-table
http://slidepdf.com/reader/full/final-spss-output-table 33/35
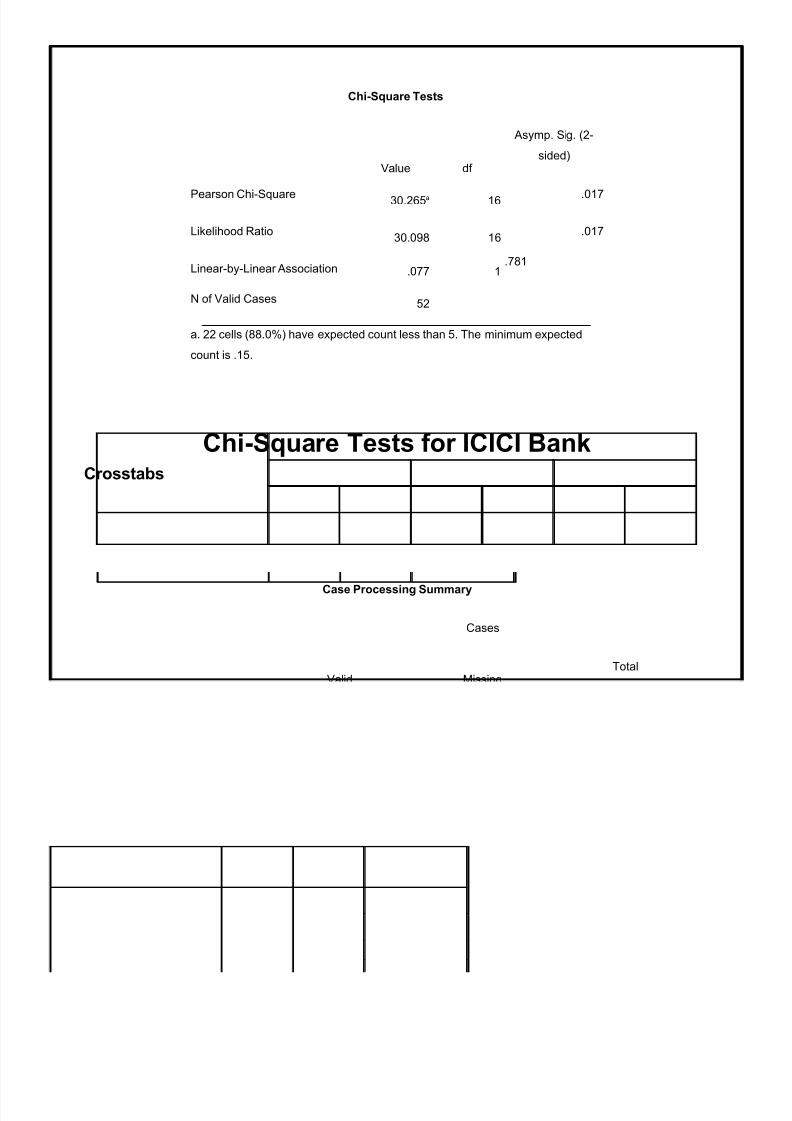
Chi-Square Tests
Value df
Asymp. Sig. (2-
sided)
Pearson Chi-Square 30.265a 16 .017
Likelihood Ratio30.098 16
.017
Linear-by-Linear Association .077 1.781
N of Valid Cases 52
a. 22 cells (88.0%) have expected count less than 5. The minimum expected
count is .15.
Chi-Square Tests for ICICI BankCrosstabs
Case Processing Summary
Cases
Valid MissingTotal
N Percent N Percent NPercent
Occupation * Service Prefer of
ICICI54 51.9% 50 48.1% 104
100.0%
8/2/2019 Final Spss Output-table
http://slidepdf.com/reader/full/final-spss-output-table 34/35
Occupation * Service Prefer of ICICI Cross tabulation
% of TotalService Prefer of ICICI
Total
1 2 3 4
Occupation 17.4% 5.6% 1.9%
14.8%
29.3% 16.7% 3.7% 7.4%
37.0%
3 3.7% 11.1% 7.4% 9.3%31.5%
4 3.7% 1.9% 5.6% 5.6%16.7%
Total16.7% 37.0% 22.2% 24.1%
100.0%
Chi-Square Tests
Value df
Asymp. Sig. (2-
sided)
Pearson Chi-Square8.734a 9
.462
Likelihood Ratio10.729 9
.295
Linear-by-Linear Association .821 1.365
N of Valid Cases 54
a. 14 cells (87.5%) have expected count less than 5. The minimum expected
count is 1.33.
8/2/2019 Final Spss Output-table
http://slidepdf.com/reader/full/final-spss-output-table 35/35
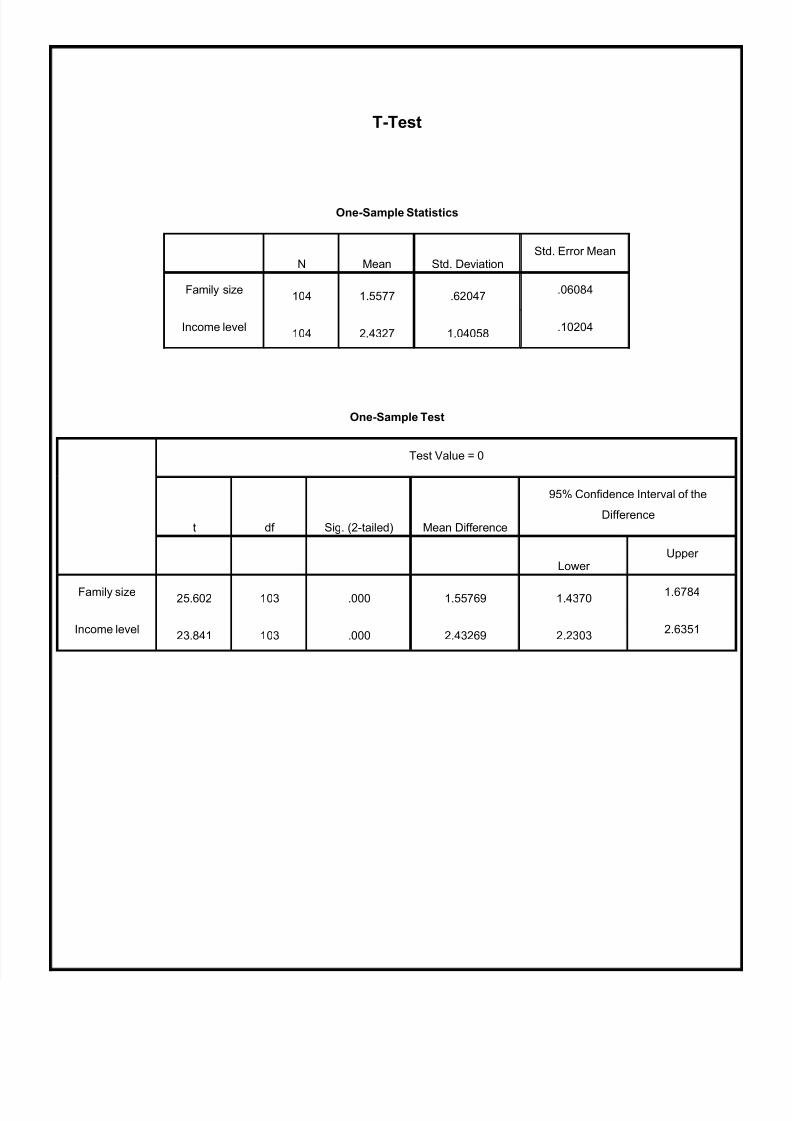
T-Test
One-Sample Statistics
N Mean Std. DeviationStd. Error Mean
Family size104 1.5577 .62047
.06084
Income level104 2.4327 1.04058
.10204
One-Sample Test
Test Value = 0
t df Sig. (2-tailed) Mean Difference
95% Confidence Interval of the
Difference
Lower Upper
Family size 25.602 103 .000 1.55769 1.4370 1.6784
Income level23.841 103 .000 2.43269 2.2303
2.6351


![SPSS output [5 marks] Regression](https://static.documents.pub/doc/80x56/6232d51c3cb13c2ff149242a/spss-output-5-marks-regression.jpg)


