Page 1
International
Academic
Journal
of
Business Management International Academic Journal of Business Management
Vol. 5, No. 1, 2018, pp. 26-47.
ISSN 2454-2768
26
www.iaiest.com
International Academic Institute for Science and Technology
Financial Analysis of Public and Private Sector Banks of
India: A Comparative Study of Punjab National Bank and
HDFC Bank
Dr. Mohd Taqi
b, Maj. S.M. Mustafa
b
a Post-Doctoral Fellow, Department of Commerce, Aigarh Muslim University, Aligarh, India.
b Principal, SHSSS(B), Aligarh Muslim University, Aligarh, India.
Abstract
Banking sector occupies an important role in the economic development of a nation. It is one of the
fastest growing sectors in India as it is featured by a large network of bank branches, serving many kinds
of financial services to its customer. Bank plays an important role to mobilize savings of general public,
remittance of money and other general banking services. The performance of a bank may be evaluated for
several reasons depending upon various objectives. Profit is the main motive for the continued existence
of every commercial organization and profitability depicts the relationship between the absolute amounts
of profit with various other factors. As compared to other business concerns, banks in general have to pay
much more attention for balancing profitability and liquidity. Liquidity is required to meet the prompt
demands of customers whereas profitability is required to meet the expenses of banks. Hence, the present
research is an effort to measure and compare the financial performance of Punjab National Bank and
HDFC Bank as both the banks are big giants in public and private sector respectively. The study focused
on the growth and performance analysis of both the banks for a period of ten years, i.e. from 2006-07 to
2015-16. Quantitative analysis has been undertaken by looking at various financial ratios like
management efficiency, liquidity and profitability which are the reliable indicators of a bank
performance. It is found that PNB is more financially sound than HDFC Bank but in context of deposits
and expenditure HDFC bank has better managing efficiency than PNB.
Keywords: Banking, Financial Analysis, Performance Measurement, Financial Ratios
Page 2
International Academic Journal of Business Management,
Vol. 5, No. 1, pp. 26-47.
27
Introduction
‘It is not by augmenting the capital of the country, but by rendering a greater part of that capital active
and productive than would otherwise be so, that the most judicious operations of banking can increase the
industry of the country’. These words of Adam Smith, a renowned economist emphasis the role of
banking sector in the economic development of a nation. A well developed banking system is a
prerequisite condition for economic development of a modern economy. The main function of
commercial banks is to accept deposit from general public in form of various deposits and then along with
its own funds it advances loans to its customers. The difference in the borrowing and lending interest rate
help banks in carrying out their activities (Singh et al, 2012). As the banking sector is considered an
important segment of a modern economy, its efficiency is of vital importance. In order to ensure healthy
financial system and an efficient economy, the performance of banks must be carefully evaluated and
analyzed. The performance of a commercial bank may be evaluated for several reasons depending on
personal objectives. An entity like a bank regulator helps in identifying those banks which are expressing
chronic financial problems and fix these problems before the situation get out of control. Shareholders, on
the other hand need to assess the banks that are deem suitable to financially invest in. Commercial banks
evaluate their performance for determining their efficacy and also long term viability of management
decisions or goals for taking appropriate and necessary course of action. Without a constant and routine
monitoring of performance, the underlying problems may remain invisible and thus lead to financial
failures down in the line. The overall objectives of the present research is to measure and compare the
performance of two leading commercial banks using five groups of financial ratios that will indicate the
performance developments over the period 2006-07 to 2015-16. Moreover, the study will also make a
comparative assessment of the performance between two banks, one public sector i.e. Punjab National
Bank with other private sector i.e. HDFC Bank.
The present study is divided into five parts. The first part provides the introductory background of the
study; review of literature has been done in the second part of the study. Third section provides the
detailed methodology of the research and fourth section is concerned with data analysis and
interpretation. The fifth part covers the main findings, conclusion and suggestions for further research.
Financial Performance Evaluation: A Brief Review
The words of Nassim Nicholas Taleb, ‘Banking is a very treacherous business because you don't realize it
is risky until it is too late. It is like calm waters that deliver huge storms’; emphasis the importance of
financial analysis of banks. Financial performance evaluation is a process of synthesis and summarization
of financial and operative data to get an insight into the operative activities of a business concern. It
consists of comparisons for the same entity over periods of time or comparisons of different entities either
of same sector or different sectors. It may be done for a variety of purposes, which may range from a
simple analysis of the short term liquidity position to a comprehensive assessment of the strengths and
weaknesses in various areas. It is helpful in assessing corporate excellence, operating efficiency, judging
credit worthiness, forecasting bond ratings, predicting bankruptcy and market risk. There are numbers of
tools and techniques available for the performance evaluation of a bank like Data Envelopment Analysis,
CAMEL model and ratio analysis, etc. Financial analysis of a bank is mainly done with the help of
Page 3
International Academic Journal of Business Management,
Vol. 5, No. 1, pp. 26-47.
28
different ratios which enables the management of banks to identify the causes or reasons for the changes
in their advances, income, deposits, expenditure and profitability over the period of time and thus help in
pinpointing the necessary direction of action required for increased deposits, income, advances and
reducing the expenditure and for altering the profitability prospects of the banks in future.
Punjab National Bank
Punjab National Bank was established on April 12, 1895 at Lahore with an authorized capital of Rs. 2
lakh and working capital of Rs 20,000. Punjab National Bank is an Indian multinational banking and
financial services company and it is a state-owned corporation based in New Delhi, India. The bank has
over 6,968 branches and over 9,656 ATMs across 764 cities and serves over 80 million customers. PNB
has also a representative office in London, Kabul, Shanghai and Dubai. PNB also came into an alliance
with Everest Bank Limited in Nepal that permits migrants to transfer funds easily between India and
Everest Bank's 12 branches in Nepal. Currently, PNB owns 20 per cent shares of Everest Bank. PNB
came up with PNBIL i.e. Punjab National Bank (International) in the UK, having two offices; one in
London other in Southall. PNB established a representative office in Oslo, Norway and hopes to upgrade
this to a branch in due course. In January 2010, PNB established a subsidiary in Bhutan. It owns 51 per
cent of Druk PNB Bank, which has branches in Thimpu, Phuentsholing and Wangdue and rest 49 per cent
shares are owned by local investors (official website of Punjab National Bank, www.pnbindia.in).
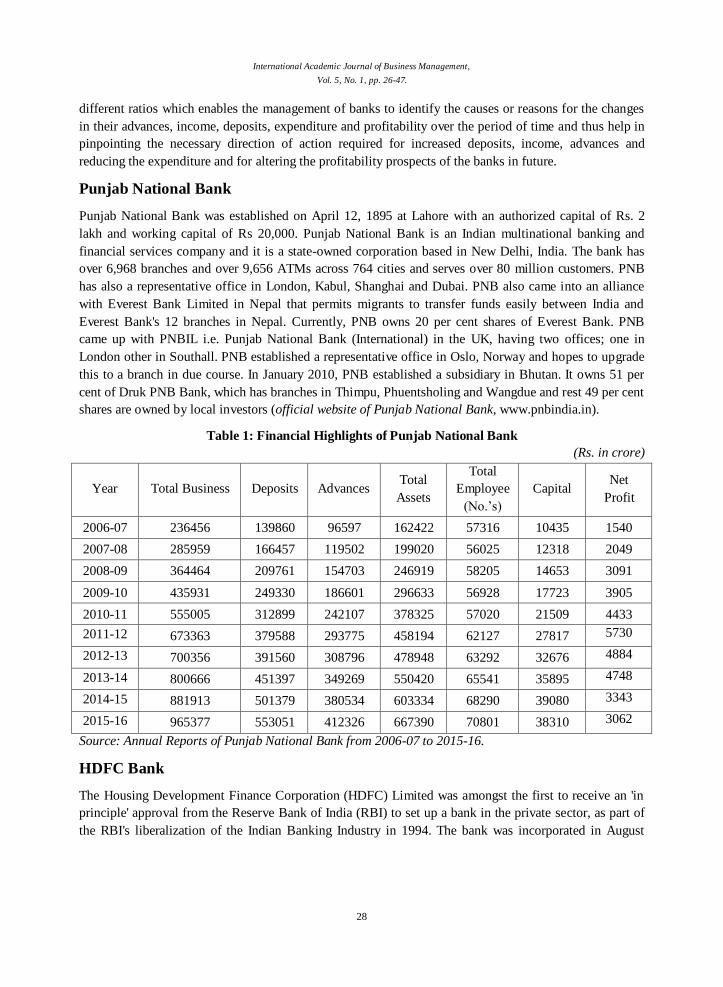
Table 1: Financial Highlights of Punjab National Bank
(Rs. in crore)
Year Total Business Deposits Advances Total
Assets
Total
Employee
(No.’s)
Capital Net
Profit
2006-07 236456 139860 96597 162422 57316 10435 1540
2007-08 285959 166457 119502 199020 56025 12318 2049
2008-09 364464 209761 154703 246919 58205 14653 3091
2009-10 435931 249330 186601 296633 56928 17723 3905
2010-11 555005 312899 242107 378325 57020 21509 4433
2011-12 673363 379588 293775 458194 62127 27817 5730
2012-13 700356 391560 308796 478948 63292 32676 4884
2013-14 800666 451397 349269 550420 65541 35895 4748
2014-15 881913 501379 380534 603334 68290 39080 3343
2015-16 965377 553051 412326 667390 70801 38310 3062
Source: Annual Reports of Punjab National Bank from 2006-07 to 2015-16.
HDFC Bank
The Housing Development Finance Corporation (HDFC) Limited was amongst the first to receive an 'in
principle' approval from the Reserve Bank of India (RBI) to set up a bank in the private sector, as part of
the RBI's liberalization of the Indian Banking Industry in 1994. The bank was incorporated in August
Page 4
International Academic Journal of Business Management,
Vol. 5, No. 1, pp. 26-47.
29
1994, with its registered head office in Mumbai, India. HDFC Bank commenced operations as a
Scheduled Commercial Bank in January 1995 with a simple mission: to be a world class Indian bank.
HDFC has developed significant expertise in retail mortgage loans to different market segments and also
has a large corporate client base for its housing related credit facilities. With its experience in the
financial markets, a strong market reputation, large shareholder base and unique consumer franchise,
HDFC was ideally positioned to promote a bank in the Indian environment. The bank is committed to
maintain the highest level of ethical standards, professional integrity, corporate governance and
regulatory compliance. HDFC Bank's business philosophy is based on four core values operational
excellence, customer focus, product leadership and people.
The Bank at present has an enviable network of 2,544 branches spread in 1,399 cities across India. All
branches are linked through an online real-time basis. Customers across 500 locations are also serviced
through Telephone Banking. The Bank's expansion plans are to have a presence in all major industrial
and commercial centers where its corporate customers are located as well as to build a strong retail
customer base for both deposits and loan products. Being a clearing/settlement bank to various leading
stock exchanges, the Bank has branches in the centers where the NSE/BSE has a strong and active
member base. The Bank also has 8,913 networked ATMs across different cities (official website of HDFC
Bank).
Table 2 : 8 Financial Highlights of HDFC Bank
(Rs. in crore)
Year Total
Business
Total
Deposits
Total
Advances
Total
Assets
Total
Employee
Net
Profit Capital
2006-07 81642 68298 46944 91235 21477 1141 6433
2007-08 123981 100769 63426 133176 37836 1590 11497
2008-09 196228 142811 98883 183270 52687 2245 15045
2009-10 199805 167404 125830 222458 51888 2949 21519
2010-11 242633 208586 159982 277352 55752 3926 25376
2011-12 442126 246706 195420 337909 66076 5167 29924
2012-13 535968 296247 239721 400332 69065 6726 36214
2013-14 670337 367337 303000 491599 68165 8478 43479
2014-15 816291 450796 365495 590503 76286 10216 62009
2015-16 1011018 546424 464594 708845 87555 12296 72678
Source: Annual Reports of HDFC Bank from 2006-07 to 2015-16
Review of Literature
Page 5
International Academic Journal of Business Management,
Vol. 5, No. 1, pp. 26-47.
30
Alamelu (2008) studied profitability of public sector banks of India. He discussed various problems
related to declining profit margins in the Indian Public Sector Banks as compared to their private sector
counterparts. It was observed that in spite of similar social obligations; almost all the private sector banks
have been registering both high profits and high growth rate with respect to deposits, advances and
reserves as compared to the public sector banks. Razor (2009), in his paper Profitability is measured
under the deregulated environment with some financial parameters of the major four bank groups i.e.
public sector banks, old private sector banks, new private sector banks and foreign banks found that
profitability has declined in the deregulated environment. He emphasized to make the banking sector
competitive in the deregulated environment. They should prefer non-interest income sources. Dupit, P.
(2012), in his paper, made an attempt to compare the three categories of banks public, private and foreign
using physical quantities of inputs and outputs, and comparing the revenue maximization efficiency of
banks during 1992-2000. The findings revealed that PSBs performed significantly better than private
sector banks but not differently from foreign banks. Singh and Tandon (2012), affirmed that banking
Sector plays an important role in economic development of a country. Indian banking system is featured
by a large network of bank branches, serving many kinds of financial services of the people. The State
Bank of India, popularly known as SBI is the leading bank of public sector in India whereas ICICI Bank
is second largest and leading bank of private sector in India. He compares the financial performance of
SBI and ICICI Bank on the basis of ratios such as credit deposit, net profit margin etc. The period of
study taken is from the year 2007-08 to 2011-12. The study found that SBI is performing well and
financially sound than ICICI Bank but in context of deposits and expenditure ICICI bank has better
managing efficiency than SBI. Bhatia et al (2015), stated that the banks are backbone of any economy. He
further stated that public sector banks are facing stiff challenges from the private sector banks and are
under tremendous pressure to cope up with the facilities provided by the multinational banks. The study
was aimed at comparing public sector and private sector on the criteria of public perception, basic
amenities customer centric services and there bench strength. For the purpose of the study Indore district
has been selected and 50 public and private sector banks has been taken as sample. The study concluded
that people are more satisfied from the private sector banks due to their better services provided by them
in terms of speedy transactions, fully computerized facilities, more working hours, good investment
advisory services, efficient and co-operative staff, and better approach to customer relationship
management.
Research Gap
There are number of studies have been conducted on financial performance and its evaluation of banks in
India, performance comparison between public and private sector banks and other financial institutions
but analysis in the case of Punjab National Bank and HDFC Bank still remains unexplored on certain
parameters. The researchers try to fill this lack of evidence by extending the issue to the specific context
of the banks. Therefore, the main purpose of this study is to compare and evaluate the financial
performance of Punjab National Bank and HDFC Bank by observing different variables, ratios and
measures, the impact of deposits and advances on the profitability, business per employee and
profitability per employee of PNB and HDFC Bank for last ten years performance results in order to
improve their banking services.
Page 6
International Academic Journal of Business Management,
Vol. 5, No. 1, pp. 26-47.
31
Significance of the Study
The present study is concern to evaluate the financial performance of Punjab National Bank and HDFC
Bank in order to compare and improve the operations, technology and service quality of both the banks.
Since the study revolves around one of the popular issues of current business scenario, the following are
the expected significances of the present research:
The study provides an insight into the evaluation process of the banking sector comparatively.
To initiate the concerned banking organization to reassess existing practices and put a renewed
emphasis on undermined ones.
To initiate interested researchers to carry out more extensive studies in this particular area of
research.
To recognize the importance of financial performance in general and the Indian banking sector in
particular and,
To draw attention towards the financial performance, accounting ratios and contribution for correct
decision making in banking sector.
Objectives of the Study
To make a comparison between the financial performance of PNB and HDFC Bank.
To analyze and compare the operational efficiency of PNB and HDFC Bank.
To identify the impact of operating efficiency on profitability of both banks.
Hypotheses of the Study
H01: There is no significant impact of efficiency ratios on Return on Equity of PNB.
H02: There is no significant impact of efficiency ratios on Return on Assets of PNB.
H03: There is no significant impact of efficiency ratios on Return on Equity of HDFC Bank.
H04: There is no significant impact of efficiency ratios on Return on Assets of HDFC Bank.
H05: There is no significant difference in business per employee of PNB and HDFC Bank.
H06: There is no significant difference in profit per employee of PNB and HDFC Bank.
Research Methodology
In the present study, an attempt has been made to measure, evaluate and compare the financial
performance of PNB and HDFC Bank.
Nature of Study: The study is an exploratory and analytical in nature and compares the financial
performance of PNB and HDFC bank.
Page 7
International Academic Journal of Business Management,
Vol. 5, No. 1, pp. 26-47.
32
Nature of Data: The secondary data has been considered for the purpose of financial performance
analysis of Punjab National Bank.
Source of Data: The study is based on secondary data that has been collected from annual reports of the
respective banks along with magazines, journals, documents and other published information as well as
through internet.
Tenure of the Study: The present study covers ten years period ranging from 2006-07 to 2015-16.
Variables used for analysis: For applying regression technique following variables taken as independent
and dependent variables:
Independent Variables – Credit Deposit Ratio, Capital Deposit Ratio, Business per Employee, Profit per
employee
Dependent Variables –Return on Equity, Return on Assets
Tools used for Analysis: For the analysis of collected secondary data following tools were used to know
financial performance of PNB and HDFC Bank.
Credit Deposit Ratio = Advances / Total Deposit
Capital to Deposits Ratio = Capital / Deposit
Business per employee = Total Business / no. of employees
Profit per employee = net profit / no. of employees
Return on equity = Net profit / total equity *100
Return on asset = Net Profit / total asset * 100
Data Analysis and Interpretation
This section presents the comparative analysis of financial ratios of PNB and HDFC Bank from 2006-07
to 2015-16.
Credit Deposit Ratio
It is the ratio of how much a bank lends out of the deposits it has mobilized. It indicates how much of a
bank’s core funds are being used for lending, the banking main activity. Credit Deposit Ratio is the
proportion of loan assets created by a bank from the deposits received. The ratio gives the first indication
of health of a bank. A higher ratio indicates more reliance on deposits for lending and vice versa. A very
high ratio is considered alarming, indicating pressure on resources. Adequacy ratios force banks to raise
more capital. In India, credit deposit ratio of over 70 per cent indicates pressure on resources.
Table – 1 Credit Deposit Ratio of PNB and HDFC Bank
(in per cent)
Year PNB HDFC
Page 8
International Academic Journal of Business Management,
Vol. 5, No. 1, pp. 26-47.
33
2006-07 69.07 68.73
2007-08 71.79 62.94
2008-09 73.75 69.24
2009-10 74.84 75.17
2010-11 77.38 76.70
2011-12 77.39 79.21
2012-13 78.86 80.92
2013-14 77.38 82.49
2014-15 75.90 81.08
2015-16 74.55 85.02
Source: Annual Reports of PNB and HDFC Bank from 2006-07 to 2015-16
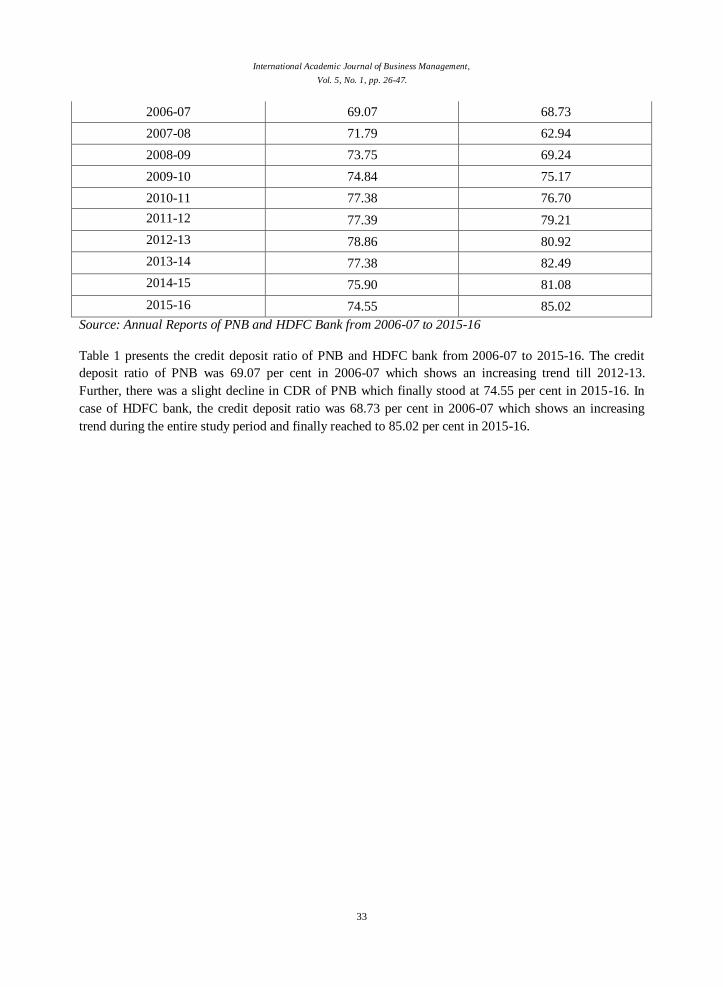
Table 1 presents the credit deposit ratio of PNB and HDFC bank from 2006-07 to 2015-16. The credit
deposit ratio of PNB was 69.07 per cent in 2006-07 which shows an increasing trend till 2012-13.
Further, there was a slight decline in CDR of PNB which finally stood at 74.55 per cent in 2015-16. In
case of HDFC bank, the credit deposit ratio was 68.73 per cent in 2006-07 which shows an increasing
trend during the entire study period and finally reached to 85.02 per cent in 2015-16.
Page 9
International Academic Journal of Business Management,
Vol. 5, No. 1, pp. 26-47.
34
Figure - 1 Credit Deposit Ratio of PNB and HDFC Bank
Source: Drawn from table 1
Graph 1 demonstrate credit deposit ratio of PNB and HDFC bank from 2006-07 to 2015-16. It is clearly
evident from the graph that PNB maintains higher credit deposit ratio as compare to HDFC bank during
the initial period of study whereas after 2011-12 HDFC Bank has high credit deposit ratio. To sum up
credit deposit ratio of both the banks hence well, indicating they both full utilize their deposits to disburse
advances.
Capital Deposit Ratio
This is commonly used statistics for assessing bank liquidity.
Table – 2 Capital Deposit Ratio of PNB and HDFC Bank
(in per cent)
Year PNB HDFC
2006-07 7.46 9.42
2007-08 7.40 11.41
2008-09 6.99 10.53
2009-10 7.11 12.85
2010-11 6.87 12.17
2011-12 7.33 12.13
2012-13 8.35 12.22
2013-14 7.95 11.84
2014-15 7.79 13.76
Page 10
International Academic Journal of Business Management,
Vol. 5, No. 1, pp. 26-47.
35
2015-16 6.93 13.30
Source: Annual Reports of PNB and HDFC Bank from 2011-12 to 2015-16
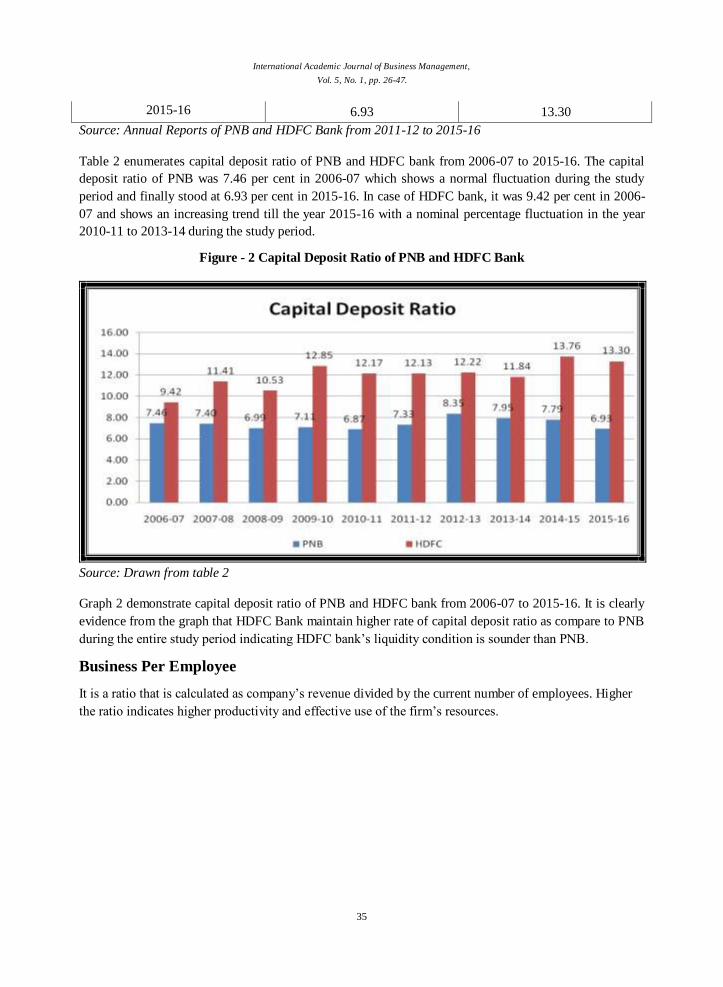
Table 2 enumerates capital deposit ratio of PNB and HDFC bank from 2006-07 to 2015-16. The capital
deposit ratio of PNB was 7.46 per cent in 2006-07 which shows a normal fluctuation during the study
period and finally stood at 6.93 per cent in 2015-16. In case of HDFC bank, it was 9.42 per cent in 2006-
07 and shows an increasing trend till the year 2015-16 with a nominal percentage fluctuation in the year
2010-11 to 2013-14 during the study period.
Figure - 2 Capital Deposit Ratio of PNB and HDFC Bank
Source: Drawn from table 2
Graph 2 demonstrate capital deposit ratio of PNB and HDFC bank from 2006-07 to 2015-16. It is clearly
evidence from the graph that HDFC Bank maintain higher rate of capital deposit ratio as compare to PNB
during the entire study period indicating HDFC bank’s liquidity condition is sounder than PNB.
Business Per Employee
It is a ratio that is calculated as company’s revenue divided by the current number of employees. Higher
the ratio indicates higher productivity and effective use of the firm’s resources.
Page 11
International Academic Journal of Business Management,
Vol. 5, No. 1, pp. 26-47.
36
Table – 3 Business per Employee of PNB and HDFC Bank
(in per cent)
Year PNB HDFC
2006-07 407 4
2007-08 505 3
2008-09 655 4
2009-10 808 4
2010-11 1018 4
2011-12 1084 7
2012-13 1107 8
2013-14 1222 10
2014-15 1291 11
2015-16 1364 12
Source: Annual Reports of PNB and HDFC Bank from 2011-12 to 2015-16
The above table shows business per employee of PNB and HDFC Bank from 2006-07 to 2015-16. The
business of PNB was Rs. 407 per employee in 2006-07 which increased during the study period and
finally it stood at Rs. 1364 in 2015-16. The business per employee of HDFC Bank was very much low as
compare to PNB. It was only Rs. 4 in 2006-07 which increased during the study period and finally
reached to Rs. 12 in 2015-16.
Graph - 3 Business Per Employee of PNB and HDFC Bank
Source: Drawn from table 3
Graph 3 demonstrates business per employee of PNB and HDFC bank from 2006-07 to 2015-16. From
the figure, it is cleared that the business per employee of PNB is much higher than HDFC bank
Page 12
International Academic Journal of Business Management,
Vol. 5, No. 1, pp. 26-47.
37
throughout the study period but the rate of growth of HDFC bank is much higher than PNB. BPE of PNB
was Rs. 407 crore in 2006-07 whereas in HDFC bank it was only Rs. 4 crore as PNB has taken several
initiatives to enhance the level of employees’ motivation, commitment and productivity. The business of
HDFC Bank per employee was not much as increased as compared to PNB which reached to Rs. 1364
crore at the end of the study.
Profit per Employee
The profit per employee indicates the productivity of employees of banks. It shows the operating
performance of banks. Higher the ratio indicates better operating performance of bank.
Table – 4 Profit Per Employee of PNB and HDFC Bank
(in per cent)
Year PNB HDFC
2006-07 2.68 0.05
2007-08 3.66 0.04
2008-09 5.64 0.04
2009-10 7.31 0.06
2010-11 8.34 0.07
2011-12 9.22 0.08
2012-13 7.72 0.10
2013-14 7.24 0.12
2014-15 4.90 0.13
2015-16 4.32 0.14
Source: Annual Reports of PNB and HDFC Bank from 2011-12 to 2015-16
Table 4 shows profit per employee of PNB and HDFC Bank from 2006-07 to 2015-16. The profit per
employee of PNB was Rs. 2.68 in 2006-07 which stood at Rs. 9.22 in 2011-12 indicating a positive
performance of PNB during the study period. Further, it registered a slowdown in profit per employee and
reached to Rs. 4.32 in 2015-16. Whereas HDFC bank has shown a gradual increase in profit per employee
as in 2006-07, it was only 0.04 but in year 2015-16 it increases to 0.14.
Page 13
International Academic Journal of Business Management,
Vol. 5, No. 1, pp. 26-47.
38
Graph - 4 Profit Per Employee of PNB and HDFC Bank
Source: Drawn from table 4
Graph 4 demonstrate profit per employee of PNB and HDFC bank from 2006-07 to 2015-16. It is clearly
evidence from the graph that PNB maintain higher profit per employee than HDFC bank during the entire
study period due to PNB has high CASA ratio owing to extensive branch network.
Return on Equity
Return on equity shows the share received by the holders of equity capital from banks earnings available
after all interest and taxes. It is one of the important profitability metrics, fundamental step to gaining
insight into the economic characteristics and attractiveness of a potential investment.
Table – 5 Return on Equity of HDFC Bank
(in per cent)
Year PNB HDFC
2006-07 15.19 17.74
2007-08 19.00 13.83
2008-09 23.52 14.92
2009-10 24.59 13.70
2010-11 22.13 15.47
2011-12 20.60 17.27
2012-13 14.95 18.57
2013-14 13.23 19.50
2014-15 8.55 16.48
2015-16 7.99 16.92
Source: Annual Reports of PNB and HDFC Bank from 2011-12 to 2015-16
Page 14
International Academic Journal of Business Management,
Vol. 5, No. 1, pp. 26-47.
39
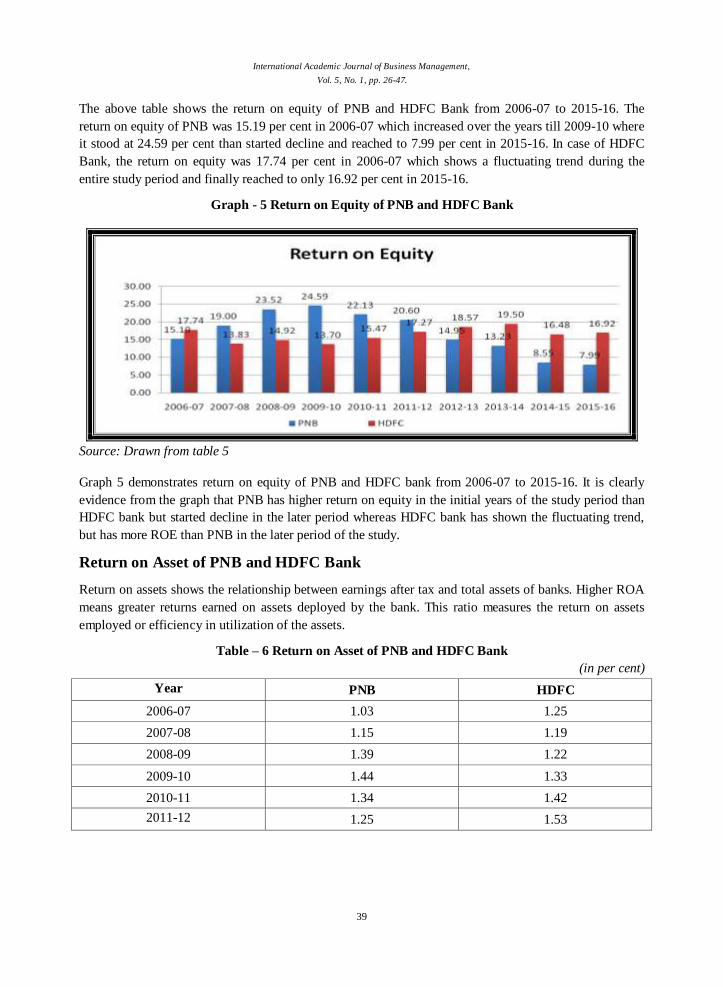
The above table shows the return on equity of PNB and HDFC Bank from 2006-07 to 2015-16. The
return on equity of PNB was 15.19 per cent in 2006-07 which increased over the years till 2009-10 where
it stood at 24.59 per cent than started decline and reached to 7.99 per cent in 2015-16. In case of HDFC
Bank, the return on equity was 17.74 per cent in 2006-07 which shows a fluctuating trend during the
entire study period and finally reached to only 16.92 per cent in 2015-16.
Graph - 5 Return on Equity of PNB and HDFC Bank
Source: Drawn from table 5
Graph 5 demonstrates return on equity of PNB and HDFC bank from 2006-07 to 2015-16. It is clearly
evidence from the graph that PNB has higher return on equity in the initial years of the study period than
HDFC bank but started decline in the later period whereas HDFC bank has shown the fluctuating trend,
but has more ROE than PNB in the later period of the study.
Return on Asset of PNB and HDFC Bank
Return on assets shows the relationship between earnings after tax and total assets of banks. Higher ROA
means greater returns earned on assets deployed by the bank. This ratio measures the return on assets
employed or efficiency in utilization of the assets.
Table – 6 Return on Asset of PNB and HDFC Bank
(in per cent)
Year PNB HDFC
2006-07 1.03 1.25
2007-08 1.15 1.19
2008-09 1.39 1.22
2009-10 1.44 1.33
2010-11 1.34 1.42
2011-12 1.25 1.53
Page 15
International Academic Journal of Business Management,
Vol. 5, No. 1, pp. 26-47.
40
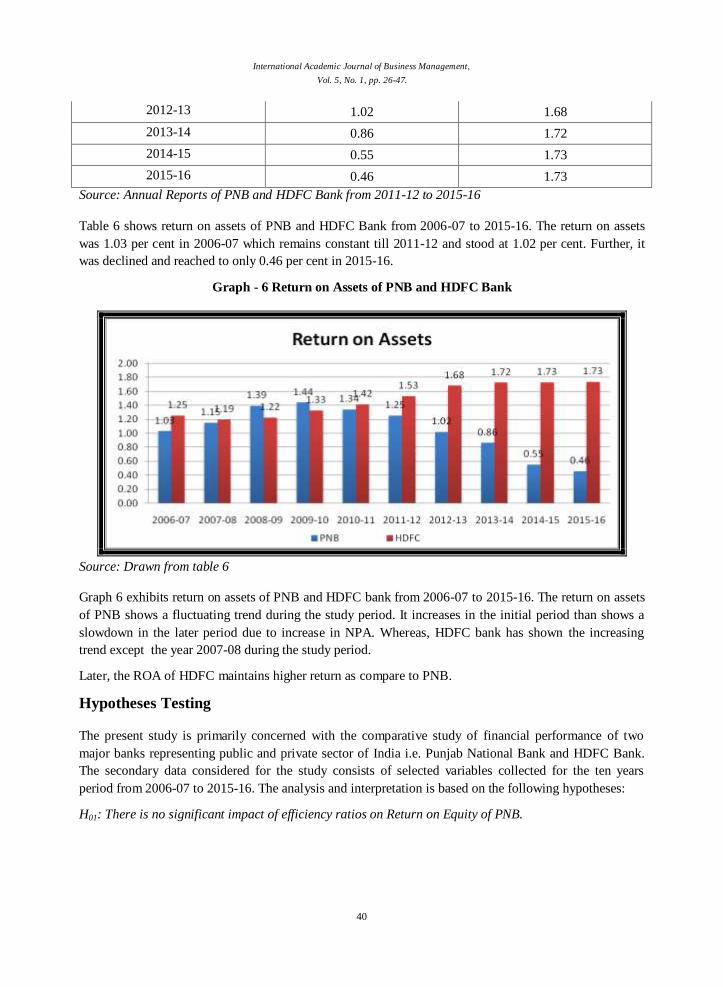
2012-13 1.02 1.68
2013-14 0.86 1.72
2014-15 0.55 1.73
2015-16 0.46 1.73
Source: Annual Reports of PNB and HDFC Bank from 2011-12 to 2015-16
Table 6 shows return on assets of PNB and HDFC Bank from 2006-07 to 2015-16. The return on assets
was 1.03 per cent in 2006-07 which remains constant till 2011-12 and stood at 1.02 per cent. Further, it
was declined and reached to only 0.46 per cent in 2015-16.
Graph - 6 Return on Assets of PNB and HDFC Bank
Source: Drawn from table 6
Graph 6 exhibits return on assets of PNB and HDFC bank from 2006-07 to 2015-16. The return on assets
of PNB shows a fluctuating trend during the study period. It increases in the initial period than shows a
slowdown in the later period due to increase in NPA. Whereas, HDFC bank has shown the increasing
trend except the year 2007-08 during the study period.
Later, the ROA of HDFC maintains higher return as compare to PNB.
Hypotheses Testing
The present study is primarily concerned with the comparative study of financial performance of two
major banks representing public and private sector of India i.e. Punjab National Bank and HDFC Bank.
The secondary data considered for the study consists of selected variables collected for the ten years
period from 2006-07 to 2015-16. The analysis and interpretation is based on the following hypotheses:
H01: There is no significant impact of efficiency ratios on Return on Equity of PNB.
Page 16
International Academic Journal of Business Management,
Vol. 5, No. 1, pp. 26-47.
41
H02: There is no significant impact of efficiency ratios on Return on Assets of PNB.
Table – 7 Descriptive Statistics of PNB
Mean Std. Deviation N
CRDR 75.09 2.98 10
CPDR 7.42 0.48 10
ROE 16.98 5.94 10
ROA 1.05 0.34 10
Source: Annual Reports of PNB from 2011-12 to 2015-16
The above table shows the statistical description of credit deposit ratio, capital deposit ratio, return on
equity and return on assets of PNB from 2006-07 to 2015-16. The Return on equity and return on assets
of PNB was 16.98 and 1.05 per cent respectively. The mean value of credit deposit ratio and capital
deposit ratio was 75.09 per cent and 7.42 per cent during the study period. The standard deviation of
CRDR and CPDR was 2.98 and 0.48 respectively while standard deviation of ROE and ROA was 5.94
and 0.34 for the study period.
Table – 8 Model Summary
Model R R Square Adjusted R Square Std. Error of the
Estimate
1 .441a .195 -.035 6.04441
1 .328a .108 -.147 .36361
Source: Annual Reports of PNB from 2011-12 to 2015-16
a. Predictors: (Constant), CPDR, CRDR
Table 8 shows the correlation (r) between the efficiency ratios and ROE and ROA of PNB. The
coefficient of determination (R2) is at 0.195 and 0.108 respectively which implies that 19.5 and 10.8 per
cent of variance is explained by the relationship between these variables. Above table also examines the
relationship between efficiency ratios and ROE and ROA that gives the coefficient of correlation at 0.441
and 0.328 which indicate a positive moderate degree of correlation.
Table – 9 Coefficients
Model Unstandardized Coefficients
Standardized
Coefficients T Sig.
B Std. Error Beta
1
(Constant) 40.680 52.940 .768 .467
CRDR .249 .716 .125 .348 .738
CPDR -5.718 4.402 -.467 -1.299 .235
2
(Constant) 2.126 3.185 .667 .526
CRDR .010 .043 .084 .223 .830
CPDR -.243 .265 -.346 -.916 .390
Source: Annual Reports of PNB from 2011-12 to 2015-16
a. Dependent Variable: ROE, ROA.
Page 17
International Academic Journal of Business Management,
Vol. 5, No. 1, pp. 26-47.
42
Table 9 presents the regression analysis of efficiency ratios on profitability of Punjab National Bank from
2006-07 to 2015-16. In case of ROE, it is observed that the value of beta coefficient is .125 which
signifies that for every unit change in ROE, there is a 0.125 unit’s change in CRDR. On the other hand,
the intercept is 0.249 which shows that if the value of ROE is zero then the value of CRDR would be
affected by 0.249 units. It point towards that there is other factor that affects ROE of PNB. The significant
value is 0.738 which is more than the critical value i.e. 0.05. It leads to the acceptance of the null
hypothesis that there is a significant impact of CRDR on Return on Equity of PNB from 2006-07 to 2015-
16. Hence the null hypothesis that there is no significant impact of credit deposit ratio on return on equity
is accepted.
The value of beta coefficient of capital deposit ratio is .043 which signifies that for every unit change in
CPDR, there is a 0.043 unit’s change in ROE and the intercept is .010 which shows that if the value of
CPDR is zero then the value of ROE would be affected by 0.010 units. It indicates that there is other
factor that affects ROE of PNB. The significant value is .006 which is less than the critical value i.e. 0.05.
Hence the null hypothesis that there is no significant impact of Proprietary Ratio on Return on Capital
Employed is rejected.
H03: There is no significant impact of efficiency ratios on Return on Equity of HDFC Bank.
H04: There is no significant impact of efficiency ratios on Return on Assets of HDFC Bank.
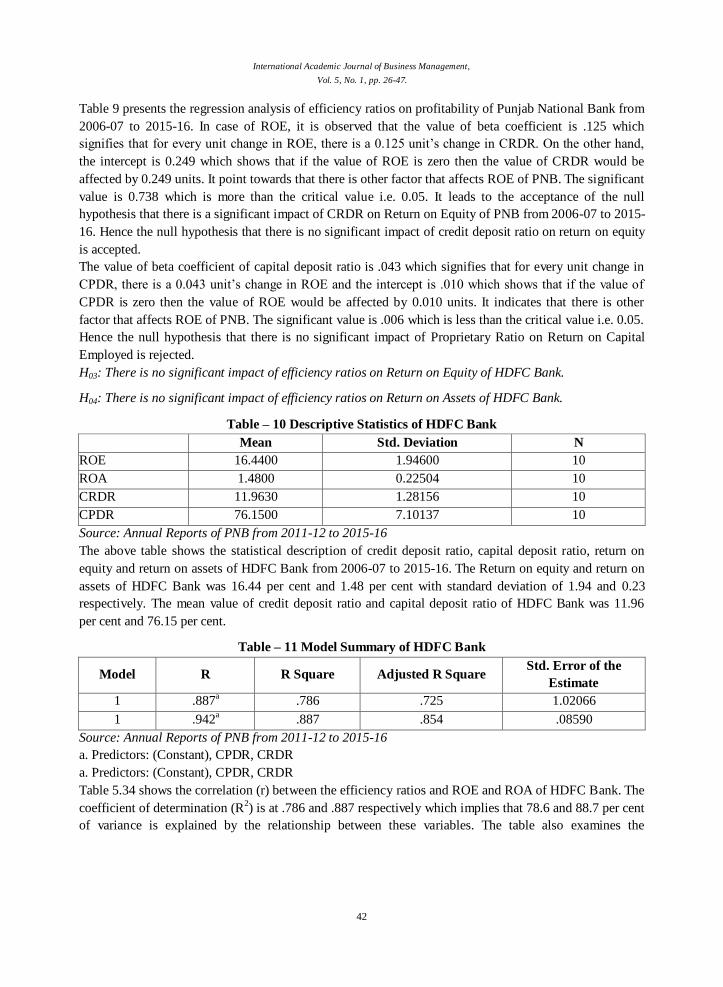
Table – 10 Descriptive Statistics of HDFC Bank
Mean Std. Deviation N
ROE 16.4400 1.94600 10
ROA 1.4800 0.22504 10
CRDR 11.9630 1.28156 10
CPDR 76.1500 7.10137 10
Source: Annual Reports of PNB from 2011-12 to 2015-16
The above table shows the statistical description of credit deposit ratio, capital deposit ratio, return on
equity and return on assets of HDFC Bank from 2006-07 to 2015-16. The Return on equity and return on
assets of HDFC Bank was 16.44 per cent and 1.48 per cent with standard deviation of 1.94 and 0.23
respectively. The mean value of credit deposit ratio and capital deposit ratio of HDFC Bank was 11.96
per cent and 76.15 per cent.
Table – 11 Model Summary of HDFC Bank
Model R R Square Adjusted R Square Std. Error of the
Estimate
1 .887a .786 .725 1.02066
1 .942a .887 .854 .08590
Source: Annual Reports of PNB from 2011-12 to 2015-16
a. Predictors: (Constant), CPDR, CRDR
a. Predictors: (Constant), CPDR, CRDR
Table 5.34 shows the correlation (r) between the efficiency ratios and ROE and ROA of HDFC Bank. The
coefficient of determination (R2) is at .786 and .887 respectively which implies that 78.6 and 88.7 per cent
of variance is explained by the relationship between these variables. The table also examines the
Page 18
International Academic Journal of Business Management,
Vol. 5, No. 1, pp. 26-47.
43
relationship between efficiency ratios and ROE and ROA that gives the coefficient of correlation at 0.887
and 0.942 which indicate a positive high degree of correlation between the two variables.
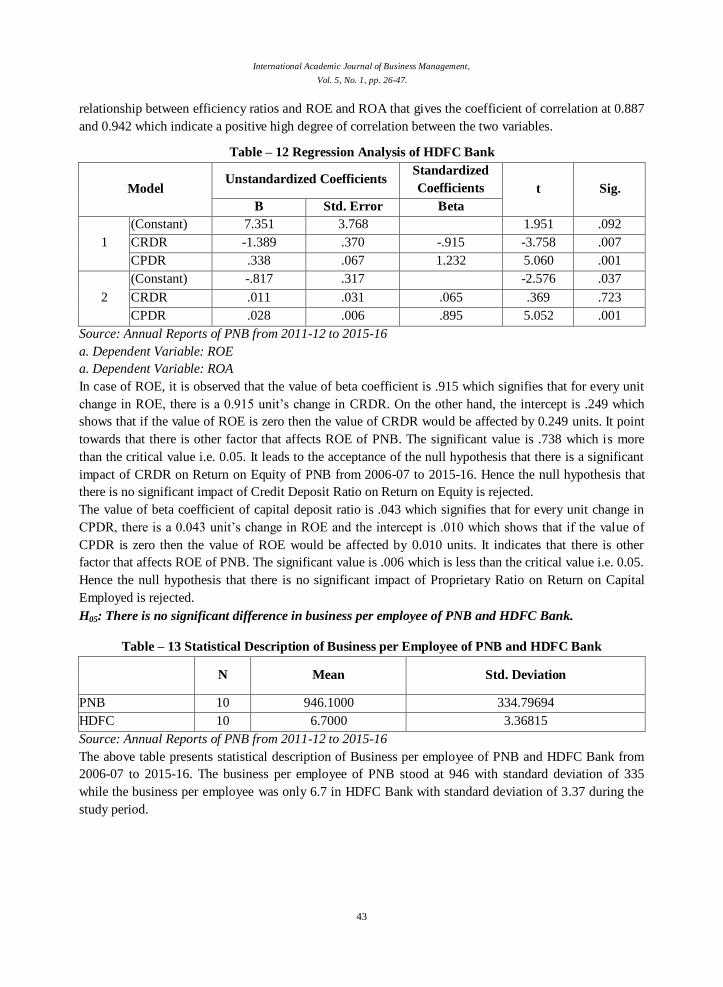
Table – 12 Regression Analysis of HDFC Bank
Model Unstandardized Coefficients
Standardized
Coefficients t Sig.
B Std. Error Beta
1
(Constant) 7.351 3.768 1.951 .092
CRDR -1.389 .370 -.915 -3.758 .007
CPDR .338 .067 1.232 5.060 .001
2
(Constant) -.817 .317 -2.576 .037
CRDR .011 .031 .065 .369 .723
CPDR .028 .006 .895 5.052 .001
Source: Annual Reports of PNB from 2011-12 to 2015-16
a. Dependent Variable: ROE
a. Dependent Variable: ROA
In case of ROE, it is observed that the value of beta coefficient is .915 which signifies that for every unit
change in ROE, there is a 0.915 unit’s change in CRDR. On the other hand, the intercept is .249 which
shows that if the value of ROE is zero then the value of CRDR would be affected by 0.249 units. It point
towards that there is other factor that affects ROE of PNB. The significant value is .738 which is more
than the critical value i.e. 0.05. It leads to the acceptance of the null hypothesis that there is a significant
impact of CRDR on Return on Equity of PNB from 2006-07 to 2015-16. Hence the null hypothesis that
there is no significant impact of Credit Deposit Ratio on Return on Equity is rejected.
The value of beta coefficient of capital deposit ratio is .043 which signifies that for every unit change in
CPDR, there is a 0.043 unit’s change in ROE and the intercept is .010 which shows that if the value of
CPDR is zero then the value of ROE would be affected by 0.010 units. It indicates that there is other
factor that affects ROE of PNB. The significant value is .006 which is less than the critical value i.e. 0.05.
Hence the null hypothesis that there is no significant impact of Proprietary Ratio on Return on Capital
Employed is rejected.
H05: There is no significant difference in business per employee of PNB and HDFC Bank.
Table – 13 Statistical Description of Business per Employee of PNB and HDFC Bank
N Mean Std. Deviation
PNB 10 946.1000 334.79694
HDFC 10 6.7000 3.36815
Source: Annual Reports of PNB from 2011-12 to 2015-16
The above table presents statistical description of Business per employee of PNB and HDFC Bank from
2006-07 to 2015-16. The business per employee of PNB stood at 946 with standard deviation of 335
while the business per employee was only 6.7 in HDFC Bank with standard deviation of 3.37 during the
study period.
Page 19
International Academic Journal of Business Management,
Vol. 5, No. 1, pp. 26-47.
44
Table – 14 ANOVA of Business per Employee of PNB and HDFC Bank
Sum of Squares df Mean Square F Sig.
Between Groups 4412361.800 1 4412361.800 78.722 .000
Within Groups 1008903.000 18 56050.167
Total 5421264.800 19
Source: Annual Reports of PNB from 2011-12 to 2015-16
As it has been clearly seen from table 11 that the P value of F test in ANOVA is 0.000 which is less than
alpha 0.05 which shows statistically significant differences in the mean percentage of business per
employee between PNB and HDFC Bank and therefore null hypothesis is rejected. It reveals that the
business per employee by both the banks differs significantly. From the analysis it has been observed that
PNB is more or less doing business per employee satisfactorily during the study period and a significant
difference exist in business per employee between PNB and HDFC Bank.
H06: There is no significant difference in profit per employee of PNB and HDFC Bank.
Table – 15 Statistical Description of Profit per Employee of PNB and HDFC Bank
N Mean Std. Deviation
PNB 10 6.1030 2.17588
HDFC 10 .0830 .03743
Source: Annual Reports of PNB from 2011-12 to 2015-16
Table 12 shows the statistical description of profit per employee of PNB and HDFC Bank from 2006-07
to 2015-16. In case of PNB, profit per employee stood at Rs. 6.10 which is better than HDFC bank which
earn only 0.08 as profit on per employee.
Table – 16 ANOVA of PPE of PNB and HDFC Bank
Sum of Squares df Mean Square F Sig.
Between Groups 181.202 1 181.202 76.524 .000
Within Groups 42.623 18 2.368
Total 223.825 19
Source: Annual Reports of PNB from 2011-12 to 2015-16
As it has been clearly seen from table 11 that the P value of F test in ANOVA is 0.000 which is less than
0.05 which shows statistically significant differences in the mean percentage of profit per employee
among PNB and HDFC Bank and thus null hypothesis is rejected. It reveals that the profit per employee
by PNB and HDFC differs significantly and according. From the analysis it has been observed that PNB
is comparatively better to earn profit per employee as compare to HDFC Bank during the study period
and a significant difference exist in profit per employee among both the banks.
Concluding Remarks
Bank works in dynamic environment which is affected by many uncontrollable factors. It is difficult to
measure the financial performance of bank in the presence of these factors. There is an attempt made to
Page 20
International Academic Journal of Business Management,
Vol. 5, No. 1, pp. 26-47.
45
evaluate and compare the financial performance of the PNB and HDFC Bank by using different
parameters. From the analysis, it can be concluded that the PNB has performed well as compare to HDFC
Bank on the sources of growth rate and financial efficiency. PNB plays a vital role in marketing of new
type of deposits and advances schemes. However, the bank, by earning at least a nominal profit, have to
serve the economy through extension of advances and safeguard the interest of its investors by providing
the expected return on their investment in bank. Therefore, the bank has to re-orient its strategies in the
light of own strengths and the kind of market in which it operates. Punjab National Bank is the second
largest public sector bank whereas HDFC Bank is the private sector bank. The market expansion of PNB
is more in comparison to HDFC Bank. PNB enter into the rural market and making more and more
customers. PNB also comes up with the new services to attract new customers. Looking at the present
scenario and conditions of public sector banks in India mounting NPA’s, amalgamation, diminishing
operating efficiency, PNB set an example for other public sector banks. But, HDFC has shown the
positive sign of growth and increasing trends in various parameters, it can be gauged that in future HDFC
will outperform the PNB in financial performance. By analysis of the financial performance of PNB and
HDFC bank it can be concluded that the PNB is financially sound as compare to the HDFC bank. PNB is
having more profitability because it enters into the industry as well as in new commercial markets. It is
also regularly improving its service quality level. The HDFC bank is also a leader in the private market
and it is an equal competitor of the PNB but PNB is performing better because of trustworthiness of
people. The study also reveals that HDFC Bank has circulated more advances to the customers as
compare to PNB which is a main reason behind the increase in bad debts of HDFC bank. The present
study aimed to measure and compare the financial performance of Punjab National Bank and HDFC Bank
from 2006-07 to 2015-16. Punjab National Bank is one of the major public sector banks of India which
plays an important role in the development of Indian financial system.
he expected contributions of this study to the management in the field of banking is that the study may
help decision makers to pay more attention on the major banking activities that will help in increasing the
financial performance position and ranking of the public and private sector banks. The financial
information of this study will also help the management in setting up plans and financial strategies. From
an academic point of view, this research provides a new perspective in evaluating the financial
performance of leading commercial banks as well as the finding of this study can be added to the present
literature and it can help researchers in their future studies.
Suggestions of the Study
From the analysis and interpretation, it may be suggested that both the banks should try to retain the
talented workforce and improve customer services which contributes to the profitability goals of the
banks to remain competitive in this kind of environment. The management of the banks should further try
to control over their expenses and disbursement cost in order to increase the profits. The banks should
focus on the risk management while expanding their business internationally. The banks should offer the
products to the customers according to their needs and expectations. The banks should create a customer
friendly environment to satisfy their customers and to retain them. They should have an ability to repeat
and sustain such efforts in future, which are crucial in maintaining their profitability. It can be concluded
that the present study will help the decision makers of Indian public and private Sector Banks and other
Page 21
International Academic Journal of Business Management,
Vol. 5, No. 1, pp. 26-47.
46
categories of Banks in Indian Banking Sector to concentrate on banking activities and thereby to increase
the bank ranking and profitability performance.
Limitations of the Study
The study suffers from certain limitations and some of these are mentioned below so that finding of the
study can be understood in a proper perspective. The limitations of the study are as follows:
The present study is concerned with one public sector and one private sector bank which cannot be
represent the entire banking sector and results of the study are limited to these two particular banks only.
Hence, the results are not applicable to the entire banking sector.
This study is limited to only ten year time period (2006-07 to 2015-16).
The study is based only on secondary data which has been collected from published annual reports of
banks and various relevant internet sources. The data obtained through reports is subject to window
dressing and may not show the actual position of the banks.
References
Bhatia, K., Chauhan, N. & Joshi, N. (2015). Comparative Study of Performance of Public and Private
Sector Bank. International Journal of Core Engineering & Management, 306-317.
Bodla, B.S. and Verma, R. (2006). Evaluating Performance of Banks through CAMEL Model: A Case
Study of SBI and ICICI. The ICFAI Journal of Bank Management, 5(3), 49-63.
Davoudi S M M, Fartash Kiarash, Venera G Zakirova, Asiya M Belyalova, Rashad A Kurbanov, Anna V
Boiarchuk, Zhanna M Sizova (2018). Testing the Mediating Role of Open Innovation on the
Relationship between Intellectual Property Rights and Organizational Performance: A Case of
Science and Technology Park. Eurasia Journal of Mathematics, Science and Technology
Education. 14(4):1359–1369
HDFC Bank (2006-2015). Published Annual Reports from 2006-07 to 2015-16. Website of HDFC Bank.
Ibrahim, M. (2014), A comparative performance of two Banks in United Arab Emirates, Research Journal
of Finance and Accounting, 5(21), 24-29.
Jha, S., Hui, X. (2012), A comparison of financial performance of commercial Banks: A case study of
Nepal. African Journal of Business Management, 6(25), 7601-7611.
Punjab National Bank (2006-2015). Published Annual Reports from 2006-07 to 2015-16. Website of
Punjab National Bank.
Samad, A. (2007). Comparative Analysis of Domestic and Foreign Bank Operations in Bangladesh. The
Global Journal Finance and Economics, 4 (1), 37-46.
Singh, A.B. & Tondon, P. (2012). A Study of Financial Performance: A Comparative Analysis of SBI
and ICICI Bank. International Journal of Marketing, Financial Services & Management
Research, 1(11), 56-71.
Page 22
International Academic Journal of Business Management,
Vol. 5, No. 1, pp. 26-47.
47
Siraj, K.K. and Pillai, P.S. (2012). Comparative study on performance of Islamic banks and conventional
banks in GCC region. Journal of Applied Finance & Banking, 3(2), 123-161.
Taştan SB & Davoudi SMM (2017). The relationship between organisational climate and organisational
innovativeness: testing the moderating effect of individual values of power and achievement.
International Journal of Business Innovation and Research 12 (4), 465-483.
Tarawneh, M. (2006), A comparison of financial performance in the Banking sector: Some evidence from
omani commercial Banks. International Research Journal of Finance and Economics, 3, 101-112.


![Indian Banks - PSU Banks[1]](https://static.documents.pub/doc/80x56/577d36f51a28ab3a6b946f03/indian-banks-psu-banks1.jpg)


