73
Las Vegas, Nevada May 7, 2018 Financial Analyst Day

Las Vegas, NevadaMay 7, 2018
Financial Analyst Day
2 © 2018 ServiceNow, Inc. All Rights Reserved. Confidential.
Safe Harbor and Other InformationThis presentation contains “forward‐looking” statements that are based on our management’s beliefs and assumptions and on information currently available to management. We intend for such forward‐looking statements to be covered by the safe harbor provisions for forward‐looking statements contained in the U.S. Private Securities Litigation Reform Act of 1995. Forward‐looking statements include information concerning our possible or assumed strategy, future operations, financing plans, operating model, financial position, future revenues, projected costs, competitive position, industry environment, potential growth opportunities, potential market opportunities, plans and objectives of management and the effects of competition on our business.
Forward‐looking statements include all statements that are not historical facts and can be identified by terms such as “anticipates,” “believes,” “could,” “seeks,” “estimates” (including, without limitation, financial estimates denoted with an “E,” such as FY18E), “targets,” “guidance,” “expects,” “intends,” “may,” “plans,” “potential,” “predicts,” “prospects,” “projects,” “should,” “will,” “would” or similar expressions and the negatives of those terms, although not all forward‐looking statements contain these identifying words.
Forward‐looking statements involve known and unknown risks, uncertainties and other factors that may cause our actual results, performance or achievements to be materially different from any future results, performance or achievements expressed or implied by the forward‐looking statements. We cannot guarantee that we will achieve the plans, intentions, or expectations disclosed in our forward‐looking statements, and you should not place undue reliance on our forward‐looking statements.
Forward-looking statements represent our management’s beliefs and assumptions only as of the date of this presentation. We undertake no obligation, and do not intend, to update these forward‐looking statements, to review or confirm analysts’ expectations, or to provide interim reports or updates on the progress of thecurrent financial quarter. Further information on these and other factors that could affect our financial results are included in the filings we make with the Securities and Exchange Commission (the “SEC”), including those discussed in our most recent Annual Report on Form 10-K and Quarterly Report on Form 10-Q.
This presentation includes certain non‐GAAP financial measures and the corresponding growth rates as defined by SEC rules. For additional information, see the slide titled “Statement Regarding Use of Non-GAAP Financial Measures.” Terms such as “Annual Contract Value” and “G2K Customer” shall have the meanings set forth in our filings with the SEC.
The information in this presentation on new products, features, or functionality is intended to outline our general product direction and should not be relied upon in making a purchasing decision. The information on new products, features, and functionality is for informational purposes only and shall not be incorporated into any contract. The information on new products, features, and functionality is not a commitment, promise, or legal obligation to deliver any material, code or functionality. The development, release, and timing of any features or functionality described for our products remains at our sole discretion.

3 © 2018 ServiceNow, Inc. All Rights Reserved. Confidential.
Statement Regarding Use of Non-GAAP Financial Measures
We report non-GAAP financial measures in addition to, and not as a substitute for, or superior to, financial measures calculated in accordance with GAAP.
Our non-GAAP presentation of gross profit, income from operations and net income measures exclude stock-based compensation expense, amortization of debt discount and issuance costs related to the convertible senior notes, loss on early note conversions, amortization of purchased intangibles, legal settlements, business combination and other related costs, and the related income tax effect of these adjustments. We believe the presentation of operating results that exclude these non-cash or non-recurring items provides useful supplemental information to investors and facilitates the analysis of our operating results and comparison of operating results across reporting periods.
Free cash flow, which is a non-GAAP financial measure, is calculated as net cash provided by (used in) operating activities plus cash paid for legal settlements and repayments of convertible senior notes attributable to debt discount, reduced by purchases of property and equipment. Free cash flow margin is calculated as free cash flow as a percentage of total revenues. We believe information regarding free cash flow and free cash flow margin provides useful information to investors because it is an indicator of the strength and performance of our business operations. However, our calculation of free cash flow and free cash flow margin may not be comparable to similar measures used by other companies.
We encourage investors to carefully consider our results under GAAP, as well as our supplemental non-GAAP information and the reconciliation between these presentations, to more fully understand our business. Please see the tables included at the end of this presentation for a reconciliation of GAAP and non-GAAP results.
4 © 2018 ServiceNow, Inc. All Rights Reserved. Confidential.
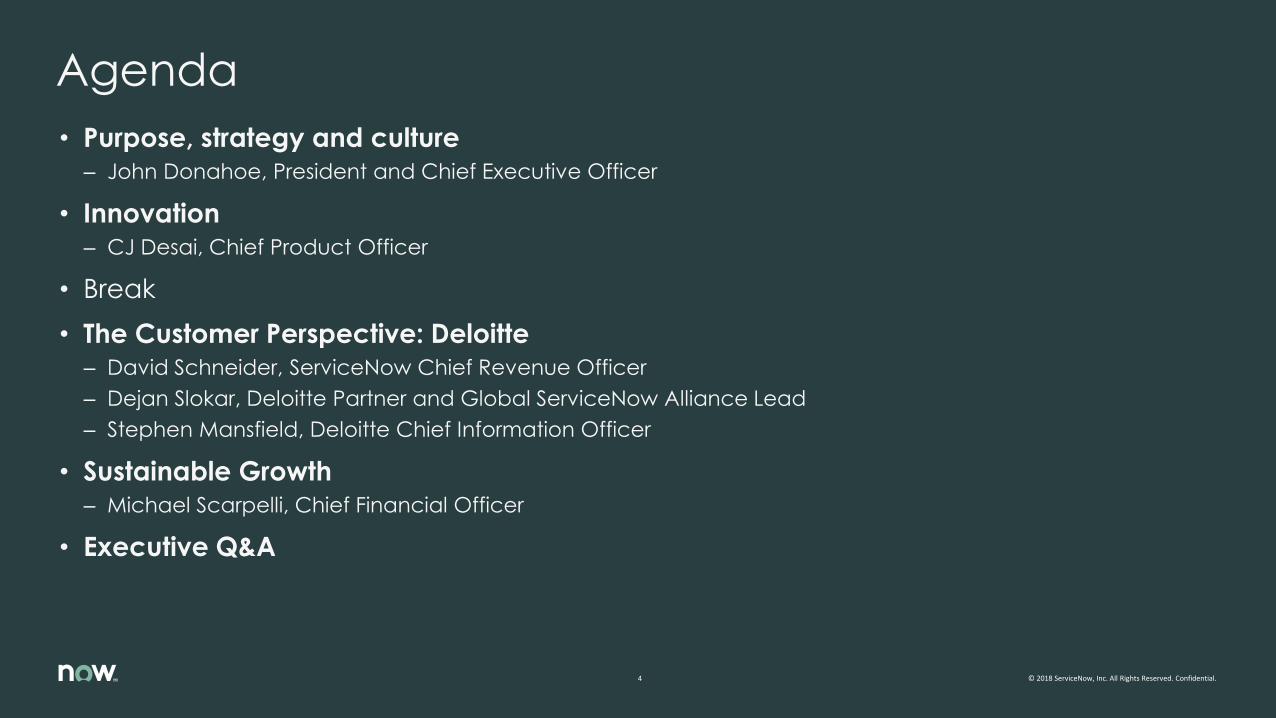
• Purpose, strategy and culture
– John Donahoe, President and Chief Executive Officer
• Innovation– CJ Desai, Chief Product Officer
• Break
• The Customer Perspective: Deloitte
– David Schneider, ServiceNow Chief Revenue Officer
– Dejan Slokar, Deloitte Partner and Global ServiceNow Alliance Lead
– Stephen Mansfield, Deloitte Chief Information Officer
• Sustainable Growth
– Michael Scarpelli, Chief Financial Officer
• Executive Q&A
Agenda

Purpose, Strategy and CultureBuilding An Enduring Company
President and Chief Executive Officer
John Donahoe

6 © 2018 ServiceNow, Inc. All Rights Reserved. Confidential.
Why I joined…to build a great, enduring company
Aspiration
• Build great, enduring company (“Built-to-last”)
• Clear leader in enterprise software
• $1.5B $15B
• $15B $100B
• Most admired and respected company
• Great place to work

7 © 2018 ServiceNow, Inc. All Rights Reserved. Confidential.
What I’m hearing from customers

8 © 2018 ServiceNow, Inc. All Rights Reserved. Confidential.
What I think
1
2
3
Cloud tailwind is still in early days
Our opportunity is enormous
Our focus is building a great, enduring company

9 © 2018 ServiceNow, Inc. All Rights Reserved. Confidential.
Great enduring companies
Pillar 1
Additional content, if necessary
They are purpose driven
Pillar 2
Innovation andexecution
Pillar 3
They invest in talent
Pillar 3
Exhibit “will to fight”
and “will to win”
Additional content, if necessary
Additional content, if necessary
Additional content, if necessary

10 © 2018 ServiceNow, Inc. All Rights Reserved. Confidential.
A simple framework
Why?
What?
How?
Our Purpose
Our Strategy
Our Culture

11 © 2018 ServiceNow, Inc. All Rights Reserved. Confidential.
To bring inspiration andinnovationto every athlete* in the world*If you have a body, you are an athlete

12 © 2018 ServiceNow, Inc. All Rights Reserved. Confidential.
Make people around the world feel like they can “belong anywhere.”

13 © 2018 ServiceNow, Inc. All Rights Reserved. Confidential.
“When I started ServiceNow in 2004, my vision was to build
a cloud-based platform that would enable regular people
to route work effectively through an enterprise.”

14 © 2018 ServiceNow, Inc. All Rights Reserved. Confidential.
Work matters
It’s where we spend a third of our lives.
It shapes who we are, how we feel, and how we interact with the world,
so we must create great work experiences.
Experiences that bring out the best in us.
When we’re at our best, we make everything around us better.
Our jobs, our coworkers and our employers benefit.
And our lives benefit even more.
Because by making the world of work, work better for people,
we make the world work better, too.

15 © 2018 ServiceNow, Inc. All Rights Reserved. Confidential.
Our Purpose
We make the world of work, work better for people.

16 © 2018 ServiceNow, Inc. All Rights Reserved. Confidential.
A simple framework
Why?
What?
How?
Our Purpose
Our Strategy
Our Culture
17 © 2018 ServiceNow, Inc. All Rights Reserved. Confidential.
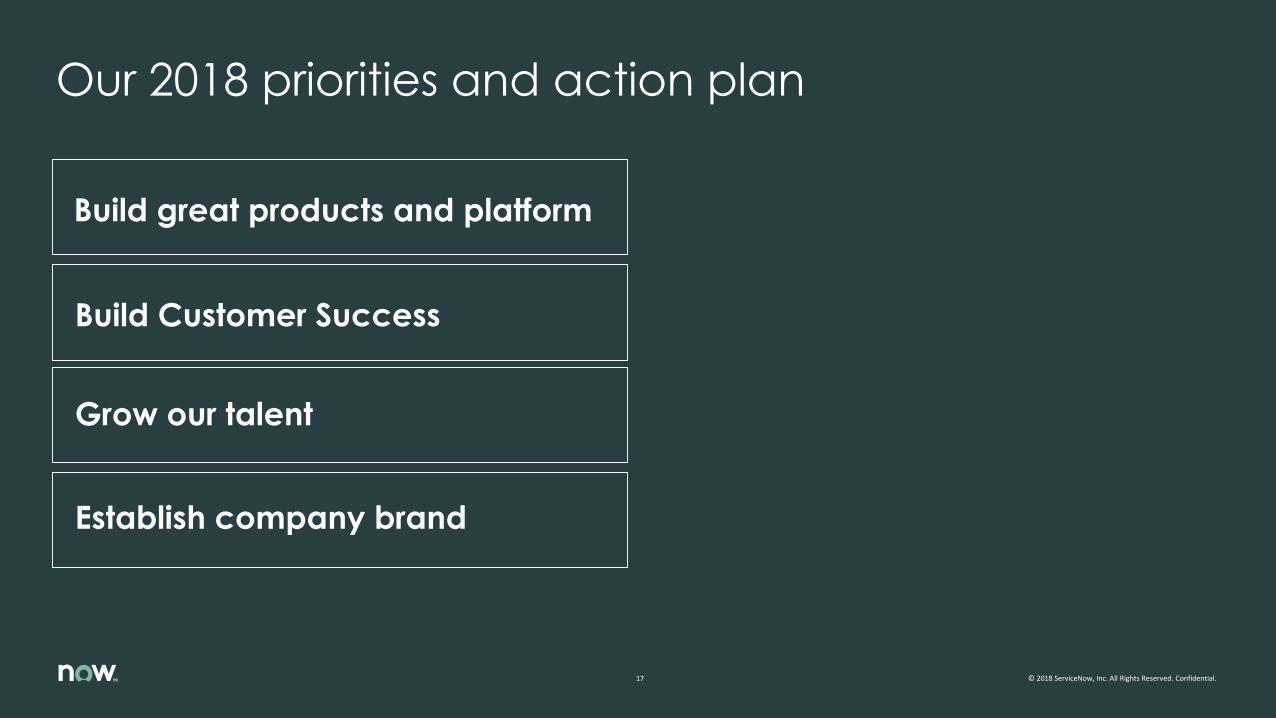
Our 2018 priorities and action plan
Build great products and platform
Build Customer Success
Grow our talent
Establish company brand

18 © 2018 ServiceNow, Inc. All Rights Reserved. Confidential.
We have the products to win
Now Platform™
Emerging products
IT products
Security Customer Service HR
ITSM ITOM ITBM & ITAM
User and Service
ExperienceService Intelligence

19 © 2018 ServiceNow, Inc. All Rights Reserved. Confidential.
We continue to evolve our strategy to drive growth
FY15 FY16 FY17 FY18+
Growth 2.0
Added Med-Sled
Vertical (US only)
Piloting
Customer
Success
Re-constituted
Alliances &
Channels
Expanded PLS
(HR, SEC, CSM)Segmented
Commercial vs.
Enterprise (US only)
Added
Inspire
Added PLS (ITOM, PA)
Added Client Directors
(Top ACV Accts)

20 © 2018 ServiceNow, Inc. All Rights Reserved. Confidential.
Customer
Success
Group
Certified
Partner
Ecosystem
Global
Go-To-Market Team
Expansion requires more world-class teaming

21 © 2018 ServiceNow, Inc. All Rights Reserved. Confidential.
Grow our talent

22 © 2018 ServiceNow, Inc. All Rights Reserved. Confidential.
Establish a company brand

23 © 2018 ServiceNow, Inc. All Rights Reserved. Confidential.
Phase 1 & 2
Get product market fit
Scale product to market
Maintain focus on what
we’re doing
Our long-term vision
$0
$2,000
$4,000
$6,000
$8,000
$10,000
0
2
4
6
8
$10B

24 © 2018 ServiceNow, Inc. All Rights Reserved. Confidential.
Phase 1 & 2
Get product market fit
Scale product to market
Maintain focus on what
we’re doing
Phase 3
Keep building great products
Execute outstanding GTM
Build customer success
Invest in talent
Establish company brand
Our long-term vision
$0
$2,000
$4,000
$6,000
$8,000
$10,000
0
2
4
6
8
$10B

25 © 2018 ServiceNow, Inc. All Rights Reserved. Confidential.
Phase 1 & 2
Get product market fit
Scale product to market
Maintain focus on what
we’re doing
Phase 3
Keep building great products
Execute outstanding GTM
Build customer success
Invest in talent
Establish company brand
Our long-term vision
$0
$2,000
$4,000
$6,000
$8,000
$10,000
0
2
4
6
8
$10BPhase 4
How will customer needs evolve in the future?
How should we innovate and evolve our
product and platform?
What new markets should we expand into?
How should we leverage M&A?
How do we continue to attract the right talent?

InnovationBuilding An Enduring Company
Chief Product Officer
CJ Desai

27 © 2018 ServiceNow, Inc. All Rights Reserved. Confidential.
ServiceNow architecture: One platform, many products
Now Platform™
Emerging products
IT products
Security Customer Service HR
ITSM ITOM ITBM & ITAM
User and Service
ExperienceService Intelligence

28 © 2018 ServiceNow, Inc. All Rights Reserved. Confidential.
Customers are using the Now Platform in creative ways
Workflow Industry
Delivering smart citizen services State & local government
Automated multicurrency expenses and usage
reporting of 150k mobile devicesGlobal industrial manufacturing
Modernization of legacy parcel tracking system Federal mail carrier
Shared Services to optimize complex workflow
across 18 strategic business areasTechnology
Scheduling and automating physician tasks Healthcare
Now Platform
User and Service
ExperienceService Intelligence

29 © 2018 ServiceNow, Inc. All Rights Reserved. Confidential.
Strengths of the Now Platform drive adoption
• Cloud platform that is secure, scalable, and elastic
• Automates unique and complex business processes that span different systems
• Built-in analytics and intelligence
• Comprehensive feature set to build digital experiences
• Provides visibility and health in a multi-cloud IT infrastructure
Now Platform
User and Service
ExperienceService Intelligence

30 © 2018 ServiceNow, Inc. All Rights Reserved. Confidential.
Now Platform
U s e r E x p e r i e n c e s
S e r v i c e E x p e r i e n c e s
S e r v i c e I n t e l l i g e n c e
CommunityServicePortal
ServiceCatalog
StatusNotifications
KnowledgeBase
Integrationand APIs
Low CodeDev Tools
ServiceAware CMDB
VisualTaskboards
Workflow
Time-seriesDatabase
Actionable Analytics
AnomalyDetection
Machine Learning andIntelligent Chatbots
PeerBenchmarks
The Now Platform uniquely serves digital transformation initiatives
Deliver great experiences for customers and employees
Automate and optimize manual workflows
31 © 2018 ServiceNow, Inc. All Rights Reserved. Confidential.
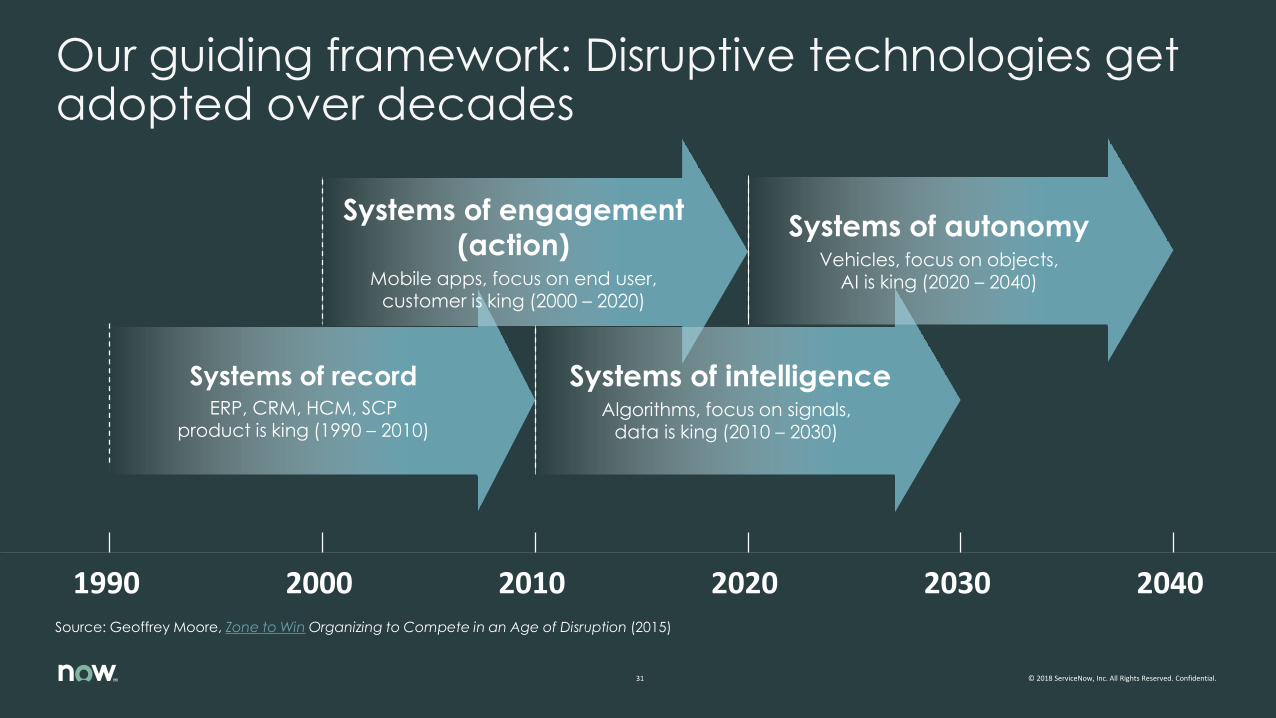
Our guiding framework: Disruptive technologies get adopted over decades
1990 2000 2010 2020 2030 2040
Systems of recordERP, CRM, HCM, SCP
product is king (1990 – 2010)
Systems of engagement
(action)Mobile apps, focus on end user,
customer is king (2000 – 2020)
Systems of intelligenceAlgorithms, focus on signals,
data is king (2010 – 2030)
Systems of autonomyVehicles, focus on objects,
AI is king (2020 – 2040)
Source: Geoffrey Moore, Zone to Win Organizing to Compete in an Age of Disruption (2015)

32 © 2018 ServiceNow, Inc. All Rights Reserved. Confidential.
Break-out categories
Service Management products for Security, HR, and Customer Service
Our guiding framework: Phases of product evolution
Phases 1-4
IT products
Phase 3,4Investments
made in Phase 2
Emerging products
Phase 4Current
investments
New products
Core
IT will always be our
core
Future categories
Develop products for
future growth

33 © 2018 ServiceNow, Inc. All Rights Reserved. Confidential.
Deliverinnovation
Deliver great experiences
Customer success
Platform and product team priorities

34 © 2018 ServiceNow, Inc. All Rights Reserved. Confidential.
Organic innovation, combined with talent-based and technology-oriented M&A
Deliver great experiences Deliver innovation

35 © 2018 ServiceNow, Inc. All Rights Reserved. Confidential.
IT products
36 © 2018 ServiceNow, Inc. All Rights Reserved. Confidential.
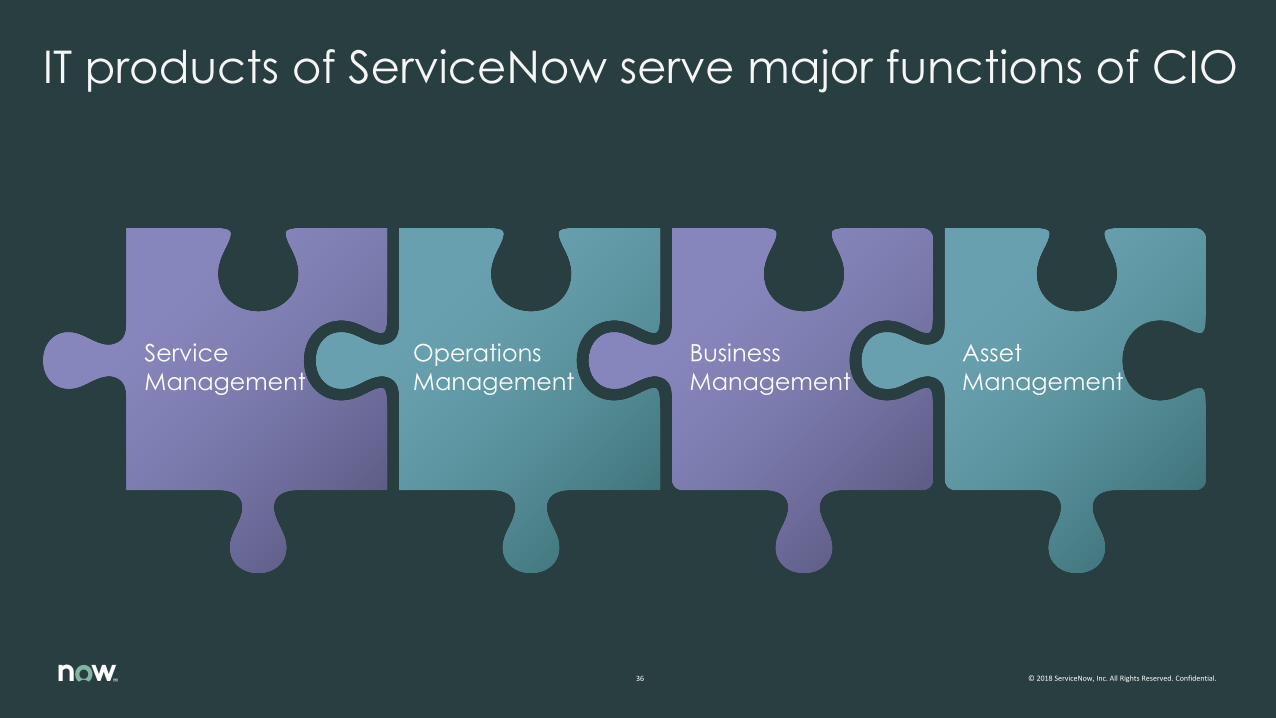
IT products of ServiceNow serve major functions of CIO
Service
Management
Operations
Management
Business
Management
Asset
Management
37 © 2018 ServiceNow, Inc. All Rights Reserved. Confidential.
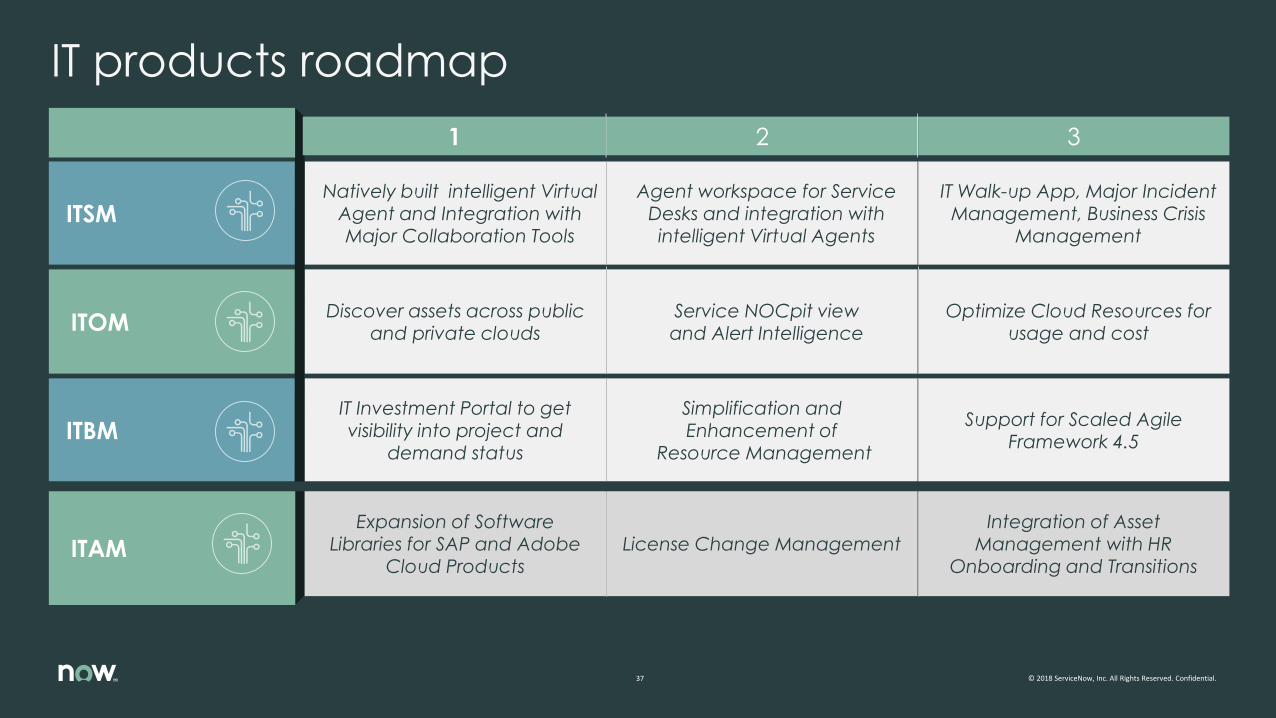
IT products roadmap
ITSM
ITOM
ITBM
Natively built intelligent Virtual Agent and Integration with Major Collaboration Tools
Agent workspace for Service Desks and integration with intelligent Virtual Agents
Discover assets across public and private clouds
Service NOCpit view and Alert Intelligence
IT Investment Portal to get visibility into project and
demand status
Simplification and Enhancement of
Resource Management
21
ITAM
Expansion of Software Libraries for SAP and Adobe
Cloud ProductsLicense Change Management
IT Walk-up App, Major Incident Management, Business Crisis
Management
Optimize Cloud Resources for usage and cost
Support for Scaled Agile Framework 4.5
3
Integration of Asset Management with HR
Onboarding and Transitions

38 © 2018 ServiceNow, Inc. All Rights Reserved. Confidential.
Emerging products

39 © 2018 ServiceNow, Inc. All Rights Reserved. Confidential.
Emerging products roadmap
Security
CSM
HR
Modern UX to enhance productivity of a SOC Analyst
and guided setup
End to End Vulnerability Response
with guided setup
Service Workspace for
Customer Service Agent
Major Issue management and Enhanced
Knowledge management
Targeted Content Automation based on Business Processes
and policies
New Experiences for HR Shared Service Agents
21
Risk Scorecards for Vulnerability Response
Mobile App for
Field Service Agent
Employee Document Management
3

40 © 2018 ServiceNow, Inc. All Rights Reserved. Confidential.
Now Platform

41 © 2018 ServiceNow, Inc. All Rights Reserved. Confidential.
Snapshot of the Now Platform scale
# of Cloud API calls
per month
~18 Billion
# Customer
transactions per month
~12 Billion
# licensed users
~18 Million
# Production
instances
~7,500

42 © 2018 ServiceNow, Inc. All Rights Reserved. Confidential.
Our product
teams at ServiceNow
Platform as a service
for our customers building Intelligent
Applications
Developers, OEMs, and ISVs building on
our platform
The Now Platform has three key stakeholders

43 © 2018 ServiceNow, Inc. All Rights Reserved. Confidential.
Flow designer and integration hub for low code/no code
application development and
3rd party integration
Native mobile experiences and
experience-aaS
The Now Platform roadmap priorities

44 © 2018 ServiceNow, Inc. All Rights Reserved. Confidential.
Platform and product innovation schedule
London
Q3-18
New YorkQ3-19
ParisQ3-20
MadridQ1-19
OrlandoQ1-20
KingstonQ1-18
L
K M
N
O
P
2019 20202018

45 © 2018 ServiceNow, Inc. All Rights Reserved. Confidential.
What’s new

46 © 2018 ServiceNow, Inc. All Rights Reserved. Confidential.
New: Virtual AgentL O N D O N
A v a i l a b l e i n

47 © 2018 ServiceNow, Inc. All Rights Reserved. Confidential.
New: Agent WorkspaceL O N D O N
A v a i l a b l e i n

48 © 2018 ServiceNow, Inc. All Rights Reserved. Confidential.
Incidents
Swipe Actions
Map View
Filter by Time/Location
New: Native mobile interfaces
Incidents Details
Call/Text/GPS
Activity Stream
Add Attachments,
Images, Comments
M A D R I D

49 © 2018 ServiceNow, Inc. All Rights Reserved. Confidential.
DEPLOYRelease code to
production
BUILDAggregate code
from all
developers
• Integration with
Automation and
Build tools
TESTTest code
DEVELOPWrite code
• Integration with
Open Source
Repository tools
PLANDecide what to do
• Scale agile
framework
• Integration with Agile
Planning tools and
Collaboration tools
MONITORMake sure code
works as expected
New: Enterprise DevOps
London
Madrid
Future
50 © 2018 ServiceNow, Inc. All Rights Reserved. Confidential.
NOW
Innovation
Unit

51 © 2018 ServiceNow, Inc. All Rights Reserved. Confidential.
Summary

52 © 2018 ServiceNow, Inc. All Rights Reserved. Confidential.
Deliverinnovation
Deliver great experiences
Customer success
Platform and product team priorities

Break

Dejan Slokar, Partner and Global ServiceNow Alliance LeadStephen Mansfield, Chief Information officerDavid Schneider, ServiceNow Chief Revenue Officer
The Customer Perspective: Deloitte
Sustainable GrowthBuilding An Enduring Company
Chief Financial Officer
Michael Scarpelli

56 © 2018 ServiceNow, Inc. All Rights Reserved. Confidential.
Key takeaways
Additional content, if necessary
Consistent Performance
Market Opportunity
Financial Model
Additional content,if necessary
Additional content, if necessary

57 © 2018 ServiceNow, Inc. All Rights Reserved. Confidential.
Combination of high revenue and free cash flow growth
$425$683
$1,005
$1,391
$1,933
74% 61% 47% 38% 39%
-7
-6
-5
-4
-3
-2
-1
0
1
0
500
100 0
150 0
200 0
250 0
2013 2014 2015 2016 2017
Revenue ($M) and Growth %
$28$87
$230
$322
$492
294%
208%166%
40%53%
-1
-0.5
0
0.5
1
1.5
2
2.5
3
0
100
200
300
400
500
600
2013 2014 2015 2016 2017
Non-GAAP Free Cash Flow ($M) and Growth % (1)
Note: Numbers reported under ASC 605
(1) See the tables included at the end of this presentation for a reconciliation to GAAP.

58 © 2018 ServiceNow, Inc. All Rights Reserved. Confidential.
Unmatched relative to enterprise software peers
64% 63% 62%
58%
51% 49%
48% 48% 46%
45% 42% 42% 41%
39% 37% 37% 37%
33%
29% 28% 27% 27% 26%
22% 20% 19% 18%
14% 14% 14%
5% 4%
(1%)
Median: 37%
2017 Revenue Growth + 2017 Non-GAAP FCF Margin % for Enterprise Software Companies > $1B in Rev.
Note: Numbers reported under ASC 605

59 © 2018 ServiceNow, Inc. All Rights Reserved. Confidential.
Driven by mix shifting to emerging products…
95% 92%88%
78%
66%
2%3%
4%
12%
23%
3% 5% 8% 9% 11%
2013 2014 2015 2016 2017
IT Emerging Products Platform Add-Ons & Other
Note: IT = IT Service Mgmt, IT Operations Mgmt, IT Asset Mgmt, IT Business MgmtEmerging Products = CSM, HR, Security, Intelligent Apps (custom apps, ServiceNow Store)Platform Add-ons & Other = Performance Analytics, Cloud Options, Metric Base, Other

60 © 2018 ServiceNow, Inc. All Rights Reserved. Confidential.
…Expanding relationships with our largest customers…
89158
224
327
454
2
3
9
22
47
91
161
233
349
501
2013 2014 2015 2016 2017
>$1M >$5M
$1M+ Customers Top Customers
74%
16%
10%
82%
11%7%
78%
15%7%
2017
100%
98%
2%
99%
1%
2013
IT Emerging Products Platform Add Ons & Other
~$4M
~$5M
~$20M ~$8M
~$20M
~$15M

61 © 2018 ServiceNow, Inc. All Rights Reserved. Confidential.
… And continued competition from legacy SW and manual workflows
73% 75% 72% 71% 68%
25% 23%25% 26%
25%
2% 2% 3% 3%7%
2013 2014 2015 2016 2017
Legacy Software Manual Workflows Other

62 © 2018 ServiceNow, Inc. All Rights Reserved. Confidential.
Large and growing opportunity to automate enterprise workflows
Administrative Customer Service Finance HR IT Legal Marketing Facilities & Other SalesShipping & Receiving
Scheduling Travel Identity VerificationPurchase Order
ProcessingEmployee Onboarding Incident Management NDA Processing Managing E-mail Lists
Processing Service
RequestsLead Assignment
Receiving
Confirmation
Managing Expense Issue Escalation Invoice ApprovalsEmployee
OffboardingProblem Management Case Management Triggered Emails Equipment Ordering Lead Qualification Order Processing
Room Scheduling Assign Tickets Capex Requests Recruiting & Selection Change Management Patent Processing Sales Rep Notification Office MovesProspect
CommunicationOrder Corrections
Event Planning Integrate History Expense ApprovalsMedical Leave
TrackingAsset Management Client Onboarding
Contact
ManagementSite Inspection Quote Production Warehouse Logistics
Dynamic Logistics Transfer Dept Budget Approvals Time Sheet Processing Service Mapping Contract Review Outsourced Catering Quote Approval Location Tracking
Meeting Scheduling Schedule Employees Audit Preparations Vacation Tracking Event Management GRC Cleaning Tracking Proposal CreationPersonnel
Management
Group NotificationsBilling and Returns
Processing
Governance of
Approvals
Employee Status
ChangeCloud Management Security Tracking Contract Preparation Returns Processing
Upsell Offerings AR – Contracts/Billing Travel Requests Project Management Open/Close Process Contract Signing Delay Communication
Process Payments Vendor OnboardingExpense
Reimbursements
Resource
ManagementVendor Request Marketing Integration Product Picking
Salary Changes
60% of Work is Unstructured Work Today
40%60%
Structured
Unstructured
61% of Work Week Spent on Admin Work(1)
28%
19%14%
Answering Email
Gathering Info
Communicating
$575B spent on
administrative tasks(2)
(1) Based on report by International Data Corporation and McKinsey Global Institute, “The social economy: Unlocking value andproductivity through social technologies,” July 2012
(2) Based on ServiceNow’s 2015 “Today’s State of Work: The Productivity Drain” report

63 © 2018 ServiceNow, Inc. All Rights Reserved. Confidential.
Large market opportunity remains: Customer penetration
2,000 G2K
850 G2K
Customers
or
43%
Note: G2K count as of Q1-18

64 © 2018 ServiceNow, Inc. All Rights Reserved. Confidential.
Large market opportunity remains: Customer penetration
~28,000 Enterprises(1)
~4,400
Customers
or
16%
(1) Based on Capital IQ screen of global companies with more than 1,000 employees and $500M in annual revenue, and global education and government institutions with more than 1,000 employees
Note: Customer count as a Q4-17

65 © 2018 ServiceNow, Inc. All Rights Reserved. Confidential.
Large customer opportunities Outside of G2K
77% 76% 74%68%
63%
23% 24% 26%32%
37%
2013 2014 2015 2016 2017
G2K Non-G2KCustomer Mix >$1M ACV

66 © 2018 ServiceNow, Inc. All Rights Reserved. Confidential.
18M active
fulfillers
or
18%
Large market opportunity remains: Customer expansion
~100M Enterprise Customer Employees

67 © 2018 ServiceNow, Inc. All Rights Reserved. Confidential.
Expansion within existing customers drives majority of new ACV…
63%71% 75%
80% 80%
37%29% 25%
20% 20%
2013 2014 2015 2016 2017
Expansion NNACV New Customer NNACV

68 © 2018 ServiceNow, Inc. All Rights Reserved. Confidential.
…But landing new customers is equally important
2017
2016
2015
2014
2013
2012
2011
2010
2010 2011 2012 2013 2014 2015 2016 2017
Annual Growth of Initial ACV
65%
61%
85%
97%
64%
71%
68%
55%
Note: Data as of Q4-17

69 © 2018 ServiceNow, Inc. All Rights Reserved. Confidential.
Profiling a Fortune 50 customer
2012 2013 2014 2015 2016 2017 TBD
$50k
~$20M
ITIT
$730k IT
Platform
$3MIT
Platform
Analytics
Sec Ops
HR
$5M
IT
Platform
Analytics
Sec Ops
HR
$7M
IT
Platform
Analytics
Sec Ops
HR
CSM
$8M

70 © 2018 ServiceNow, Inc. All Rights Reserved. Confidential.
Investments to build an enduring company
1
2
3
4
Build great products and platform
Build Customer Success
Grow our talent
Establish company brand

71 © 2018 ServiceNow, Inc. All Rights Reserved. Confidential.
Target operating model
2020 Total Revenue >$4B
2020 Non-GAAP Subscription Gross Margin 84-86%
Annual Non-GAAP Operating Margin Expansion >1%
Annual Non-GAAP Free Cash Flow Margin Expansion >0%
2020 Non-GAAP Tax Rate ~20%
Annual Dilution Increase <3%

Q&A

73 © 2018 ServiceNow, Inc. All Rights Reserved. Confidential.
GAAP to Non-GAAP Reconciliation
*Numbers reported under ASC 605.
(1) During the year ended December 31, 2016, we early adopted Accounting Standards Update 2016-09, "Compensation-Stock Compensation (Topic 718): Improvements to Employee Share-Based Payment Accounting." This adoption resulted in an increase in net cash provided by operating activities and a corresponding decrease in net cash provided by financing activities as compared to the amounts previously reported. Net cash provided by operating activities increased $2.7M, $2.0M and $1.7M for the years ended December 31, 2015, 2014 and 2013 respectively.
Note: Numbers are rounded for presentation purpose.
in millions (except %'s) 2013* Margin 2014* Margin 2015* Margin 2016* Margin 2017* Margin
GAAP Net Cash Provided by Operating Activities (1) $ 83 20% $ 141 21% $ 318 32% $ 160 12% $ 643 33%
(-) Purchases of Property and Equipment 55 13% 54 8% 88 9% 106 8% 151 8%
(+) Cash Paid for Legal Settlements - 0% - 0% - 0% 268 19% - 0%
(+) Repayments of Convertible Senior Notes attributable to Debt Discount - 0% - 0% - 0% - 0% - 0%
Non-GAAP Free Cash Flow $ 28 7% $ 87 13% $ 230 23% $ 322 23% $ 492 25%


