Financial Crisis James Barth Powerpoints March 2009 Complete presentation at http:// business.auburn.edu/~barthjr/presentations.htm Follow this link to Barth’s “Leverage and Risk in Financial Institutions” presentation in Amsterdam, February 2009
Transcript
Financial CrisisJames Barth Powerpoints
March 2009
Complete presentation at http://business.auburn.edu/~barthjr/presentations.htm
Follow this link to Barth’s“Leverage and Risk in Financial Institutions”
Home mortgages: Who borrows, how much has been borrowed, and who funds them?
Note: total residential and commercial mortgages = $14.7 trillion; 5 percent = $700 billion
Government-controlled
46%
Privatesector-
controlled54%
Total value of housing stock = $19.3 trillion
Equity in housing stock$8.7 trillion
Mortgage debt $10.6 trillion
Total value of housing stock = $19.3 trillion
Prime 91.6%
Subprime8.4% Securitized
58%
Non-securitized42%
Sources: Federal Reserve, Milken Institute.
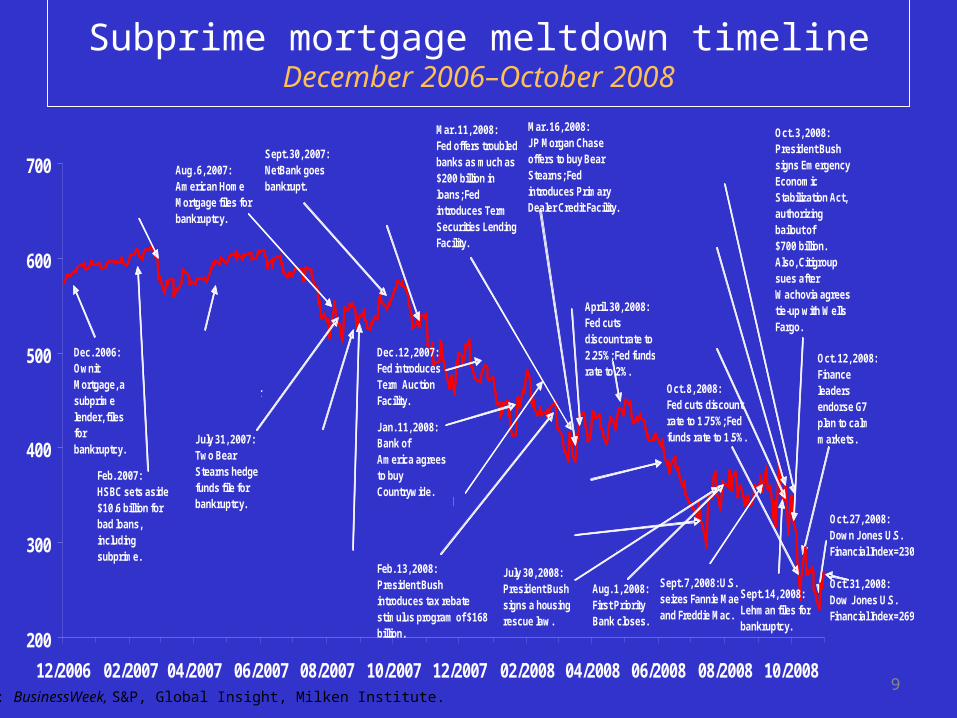
…small events at times have large consequences. A liquidity crisis in a fractional reserve banking system is precisely the kind of event that can trigger – and often has triggered – a chain reaction. And economic collapse often has the character of a cumulative process. Let it go beyond a certain point, and it will tend for a time to gain strength from its own development as its effects spread and return to intensify the process of collapse. Because no great strength would be required to hold back the rock that starts a landslide, it does not follow that the landslide will not be of major proportions.
Friedman and SchwartzA Monetary History of the United
Feburary–March 2007: More than 25 subprime lenders declare bankruptcy.
Aug. 6, 2007: American Home Mortgage files for bankruptcy.
Sept. 30, 2007: NetBank goes bankrupt.
July 30, 2008: President Bush signs a housing rescue law.
Sept. 7, 2008: U.S. seizes Fannie Mae and Freddie Mac.
Dec. 2006: Ownit Mortgage, a subprime lender, files for bankruptcy.
Apr. 2007: New Century, a mortgage broker, files for bankruptcy.
Feb. 2007: HSBC sets aside $10.6 billion for bad loans, including subprime.
July 31, 2007: Two Bear Stearns hedge funds file for bankruptcy.
Aug. 17, 2007: Fed cuts discount rate to 5.75%; Fed introduces Term Discount Window Program.
Jan. 11, 2008: Bank of America agrees to buy Countrywide.Jan. 30, 2008: Fed cuts discount rate to 3.5%.
Dec. 12, 2007: Fed introduces Term Auction Facility.
Feb. 13, 2008: President Bush introduces tax rebate stimulus program of $168 billion.
Aug. 16, 2007: Countrywide gets emergency loan of $11 billion from a group of banks.
Sept. 14, 2008: Lehman files for bankruptcy.
Mar. 18, 2008: Fed cuts discount rate to 2.5%; Fed funds rate to 2.25%.
Mar. 16, 2008: JP Morgan Chase offers to buy Bear Stearns; Fed introduces Primary Dealer Credit Facility.
April. 30, 2008: Fed cuts discount rate to 2.25%; Fed funds rate to 2%.
Oct. 3, 2008: President Bush signs Emergency Economic Stabilization Act, authorizing bailout of $700 billion.Also, Citigroup sues after Wachovia agrees tie-up with Wells Fargo.
Sept. 16, 2008: Fed loans AIG $85 billion.
Sept. 23, 2008: Washington Mutual is seized by FDIC.
Sept. 29, 2008: Citigroup agrees to buy Wachovia.
Oct. 8, 2008: Fed cuts discount rate to 1.75%; Fed funds rate to 1.5%.
-21.4-23.9
-40.1-41.4
-42.9-45.1
-47.9
-54.7-63.7-64.1
-72.3-96.6
-112.9
-169.2-197.9
Bear StearnsCountrywideWells Fargo
Lehman BrothersWashington mutualFreddie Mac
Goldman SachsFannie MaeMorgan Stanley
Merrill LynchJP Morgan & ChaseWachovia
UBS EquityAIGBank of America
US$ billions
Total loss in market value: $1,094 billion, December 2006–January 2009
1010
Financial market capitalization takes big hit
Note: Bear Stearns stock price is to May 2008. Countrywide stock price is to June 2008. Merrill Lynch stock price is to December 2008. Wachovia stock price is to December 2008. Sources: Bloomberg, Milken Institute.
11
Counterparty risk increases
Note: Counterparty Risk index averages the market spreads of the credit default swaps (CDS) of fifteen major credit derivatives dealers, including ABN Amro, Bank of America, BNP Paribas, Barclays Bank, Citigroup, Credit Suisse, Deutsche Bank, Goldman Sachs Group, HSBC, Lehman Brothers, JPMorgan Chase, Merrill Lynch, Morgan Stanley, UBS, and Wachovia. Sources: Datastream, Milken Institute.
Targeted Investment Program and Asset Guaranty Program…
And Still……
23
The U.S. regulatory regime: In need of reform?
Sources: Financial Services Roundtable (2007), Milken Institute.
National banks State commercial and savings banks
Federal savings banks
Insurance companies
Securities brokers/dealers
Other financial companies, including mortgage
companies and brokers
• Fed• OTS
• OCC• FDIC
• State bank regulators• FDIC• Fed--state member commerical banks
• OTS• FDIC
• 50 State insurance regulators plus District of Columbia and Puerto Rico
• FINRA• SEC• CFTC• State securities regulators
• Fed• State licensing (if needed)• U.S. Treasury for some products
• OCC• Host county regulator
• Fed• Host county regulator
• OTS• Host county regulator
Federal branch
Foreign branch
Limited foreign branch
Fed is the umbrella or consolidated regulator
Primary/secondaryfunctionalregulator
Notes:Justice Department: Assesses effects of mergers and acquisitions on competitionFederal Courts: Ultimate decider of banking, securities, and insurance productsCFTC: Commodity Futures Trading CommissionFDIC: Federal Deposit Insurance CorporationFed: Federal ReserveFINRA: Financial Industry Regulatory Authority GSEs: Government Sponsored Enterprises OCC: Comptroller of the CurrencyOTS: Office of Thrift SupervisionSEC: Securities and Exchange Commission
• Federal Housing Finance Agency
Fannie Mae, Freddie Mac, and Federal Home Loan Banks
Financial, bank and thrift holding companies
Justice Department• Assesses effects of mergers and acquisitions on competition
Federal courts• Ultimate decider of banking, securities, and insurance products