52
KOICA-KAIST Scholarship Program Financial Development and Economic growth: The Case of Mongolia Tsolmon Altantulkhuur Finance MBA KAIST 2014

KOICA-KAIST Scholarship Program
Financial Development and Economic growth:
The Case of Mongolia
Tsolmon Altantulkhuur
Finance MBA
KAIST
2014

Financial Development and Economic Growth:
The Case of Mongolia

Financial Development and Economic Growth:
The Case of Mongolia
Advisor : Professor Joo-Hoon Kim
by
Tsolmon Altantulkhuur
KAIST
An Independent Research Paper submitted to the faculty of KAIST in
partial fulfillment of the requirements for the KOICA-KAIST Scholarship
Program. The study was conducted in accordance with Code of Research
Ethics1
March 26th, 2014
Approved by
Professor Joo-Hoon Kim
(Seal or signature)
1Declaration of Ethical Conduct in Research: I, as a graduate student of KAIST, hereby declare that I have not
committed any acts that may damage the credibility of my research. These include, but are not limited to:
falsification, papers written by someone else, distortion of research findings or plagiarism. I affirm that my
research paper contains honest conclusions based on my own careful research under the guidance of my
academic advisor.


i
MBAP
20124596
Tsolmon Altantulkhuur, Financial Development and Economic growth: The Case of
Mongolia
Graduate School of Finance, Finance MBA. 2014. 42 p. Advisor Prof. Joo-Hoon Kim
ABSTRACT
Mongolia went through the transitional stage from centrally planned economic system to liberalized
political and economic system during last two decades. The country is still on the early stage of development of
market economy but one of the fastest growing economies around the world. At a same time, Mongolian
financial sector, especially banking sector, is the fastest growing industry among the others since its economic
and financial reform started. It arises the questions of whether financial sector development leads to economic
growth or otherwise economic growth leads to financial sector development.
Therefore, this thesis aims to analyze the causal relationship between financial sector development and
economic growth in a case of Mongolia. The empirical analysis is performed using Granger Causality test
procedure under Vector Auto Regressive model with quarterly data of economic growth and financial
development proxies which dimensioned into financial depth, access, efficiency and stability in 1995-2012. The
empirical tests provide an evidence that a presence of significant causal relationship from financial development
to economic growth in a case of Mongolia. This unidirectional causality can be explained by the result of
Mongolian Government policies which have liberalized its financial sector since 1990s. The empirical analysis
found that financial indicators causes economic growth in different time horizons. Among the financial
deepening indicators, an increase in broad money drives to economic growth in short term while growth in
private sector credit and capital market lead to economic growth in long term. Improvement in access to the
finance followed by economic growth in short term, while financial sector efficiency causes economic growth in
long term. In summary, Mongolian economic growth strongly follows the financial sector development.
Therefore, macroeconomic policies to strengthen and stimulate financial sector development are highly
recommendable.
Keywords: Mongolia, Financial development, Economic Growth, Banking Sector, Granger Causality

ii
TABLE OF CONTENTS
Abstract ........................................................................................................................................................... i Table of Contents ........................................................................................................................................... ii List of tables .................................................................................................................................................. iii List of Figures ............................................................................................................................................... iii Glossary ........................................................................................................................................................ iv
I. Introduction .............................................................................................................................................. 1 II. Literature survey .................................................................................................................................... 3
2.1 The unidirectional relationship from financial development to economic growth .............................. 3
2.2 The unidirectional relationship from economic growth to financial development .............................. 4
2.3 The Bidirectional relationship between financial development and economic growth ........................ 5
III. Overview of financial sector in Mongolia ............................................................................................ 8 3.1 Economic overview ............................................................................................................................. 8
3.2 Financial sector reform in Mongolia .................................................................................................. 10
3.2.1 Banking sector ......................................................................................................................... 10
3.2.2 Securities market and Non-banking financial sector ................................................................ 12
3.3 Current situation of Mongolian Financial Sector ............................................................................... 13
3.3.1 Banking sector ......................................................................................................................... 13
3.3.2 Securities market ...................................................................................................................... 21
IV. Empirical study .................................................................................................................................... 24 4.1 Model ................................................................................................................................................. 24
4.2 Data .................................................................................................................................................... 24
4.2.1 An indicator of economic growth ............................................................................................ 24
4.2.2 Indicators of financial sector development .............................................................................. 25
4.3 Stationary test .................................................................................................................................... 26
4.4 Causality test ...................................................................................................................................... 27
V. Conclusion .............................................................................................................................................. 31 References ................................................................................................................................................... 33 Appendixes.................................................................................................................................................. 39

iii
LIST OF TABLES
Table 1. The ratios of Main indicators of banking sector to GDP (%) ......................................................... 14
Table 2. Data description and sources .......................................................................................................... 25
Table 3 ADF Unit root test (level, no trend and no intercept)...................................................................... 26
Table 4. ADF Unit root test (1st order) ......................................................................................................... 27
Table 5. Causal relationship between financial depth and economic growth ............................................... 28
Table 6. Causal relationship between financial accessibility and economic growth .................................... 29
Table 7. Causal relationship between financial sector efficiency and economic growth ............................. 29
Table 8. Causal relationship between financial stability and economic growth ........................................... 30
Table 9 Main economic and financial reforms in 1991-1992 ...................................................................... 39
Table 10. Descreptive Statistics ................................................................................................................... 42
Table 11. Correlation Matrix........................................................................................................................ 42
LIST OF FIGURES
Figure 1. GDP growth rate of Mongolia ........................................................................................................ 8
Figure 2. Inflation of Mongolia (CPI, annual %), 1992-2000, 2001-2013 ..................................................... 9
Figure 3. Industrial composition of GDP of Mongolia in 2012 ................................................................... 10
Figure 4. The ratio of M2 to GDP and economic growth rate...................................................................... 15
Figure 5. The ratio of banking sector total asset to GDP ............................................................................. 16
Figure 6. The Ratio of Total Credit to GDP and the ratio of Bank deposit to GDP ..................................... 17
Figure 7. The ratio of NPL to Total loan ...................................................................................................... 17
Figure 8. Financial accessibility of Mongolia .............................................................................................. 18
Figure 9. Interest rate spread ........................................................................................................................ 19
Figure 10. Noninterest income and overhead cost of banks (%) .................................................................. 19
Figure 11. Banking sector profitability ........................................................................................................ 20
Figure 12. Government and corporate bond trade volume ........................................................................... 22
Figure 13. Stock Market Capitalization to GDP (%) ................................................................................... 23
Figure 14. Market Capitalization in current USD ........................................................................................ 23
Figure 15. GDP contribution by some sectors of Mongolia ......................................................................... 39
Figure 16. Mongolia's Banking sector default probability ........................................................................... 40
Figure 17. Bank liquid reserves to bank assets ratio (%) ............................................................................. 40
Figure 18. Risk Weighted Capital Adequacy Ratio of Mongolian Banks .................................................... 41
Figure 19. Number of domestic listed companies ........................................................................................ 41
iv
GLOSSARY
ADB Asian Development Bank
ADF Augmented Dickey-Fuller
BoM Bank of Mongolia
CBB Central Bank Bills
CPI Consumer Price Index
FRC Financial Regulatory Committee
FSC Financial Stability council
GDP Gross Domestic Product
IMF International Monetary Fund
ITI Investment and Technological Innovation
MNT Mongolian togrog (National Currency)
MoF Ministry of Finance
MSE Mongolian Stock Exchange
NBFI Non-banking financial institution
NPL Nonperforming Loan
OECD Organization of Economic Co-operation and Development
SCC Savings and credit cooperatives
SME Small and Medium Enterprises
SOE State Owned Enterprises
TDB Trade and Development Bank
USD U.S Dollar
VAR Vector Auto Regressive

1
I. INTRODUCTION
Mongolia is a country which made economic and political reform at same time in 1990s. This
simultaneous transformations had brought numerous challenges for the country. Generally, in first decade of the
transformations, basic fundamentals of market economy and multi-party political system were set by reform
policies, in second decade, reform policies focused to strengthen prior achievements. In 1990s, structural
reforms including currency reform, price and wage liberalization, privatization of small and medium enterprises
and state owned companies and legal environment reforms introduced successfully. One of the successful
reform policies was the financial liberalization policy which starts from creating two-tier banking system and
encourages private commercial banks. Although, stock market emerged in 1991, it still remains illiquid until
today and Mongolian financial sector is dominated by banking sector. In recent years, Mongolian economy has
grown rapidly due to development in mining industry. In parallel, financial sector, especially banking industry,
relatively strengthened through these years even though it faced several crisis in mid and late of 1990s and mid
and late of 2000s. These crisis also gave chances policymakers to strengthen financial sector policy framework
and financial institutions to empower their capabilities to overcome risks and external threats.
As financial sector plays significant role to allocate resources efficiently to the economy, its effect on the
economic growth is enormous. On the other hand, better and bigger financial sector is required as much as an
economy grows. In Mongolia, financial assets of the financial institutions and broad money (M2) has grown
rapidly hand in hand with GDP. It arises the question of whether financial sector development leads to economic
growth or otherwise economic growth drives financial development. This issue was well studied by many
economists and scholars in terms of cross countries and individual country cases. Thanks to prior scholars’
works, the relationship between economic growth and financial development was analyzed well, but the results
were inclusive. The previous empirical results vary among the countries which have been tested. Some results
show the financial development had caused economic development while others support the opposite case.
Therefore, this thesis aims to investigate the causal relationship between financial sector development and
economic growth in a case of Mongolia. There are two possibilities of the relationship which are unidirectional
or bidirectional.
In 1990s, because Mongolian government put efforts to liberalize private and financial sector in order to
stimulate further economic growth, there is a high probability of financial development causes economic growth.
In contrast, some countries such as China and South Korea implemented financial repression policy which
controls financial sector heavily and allocates resources to prioritized economic sectors until they achieve

2
certain level of economic growth and then they started reforming their financial sector. In this case, there is a
causal relationship from economic growth to financial development.
The remainder of the thesis proceeds as follows: In chapter 2, in order to explore theoretical and empirical
relationship between financial development and economic growth a literature survey is executed. Therefore, in
chapter 3, the empirical analysis is performed using Granger Causality test procedure under Vector Auto
Regressive model with quarterly data of economic growth and financial development proxies which
dimensioned into financial depth, access, efficiency and stability in 1995-2012. In this study, I try to analyze the
financial development by not only financial depth indicators which are widely used by other scholars but also
indicators of efficiency, accessibility and stability compared to other works. The empirical tests provide an
evidence that a presence of significant causal relationship between financial development indicators and
economic growth depends on time horizons. Finally, conclusion is made in the last chapter.

3
II. LITERATURE SURVEY
Early economic growth theory argues that exogenous technological progress provide a driving force for the
long run economic growth rate whereas financial intermediaries were not included explicitly in economic
models.
Thanks to the contributions of pioneers such as Bagehot (1873), Schumpeter (1912), Hicks (1969),
Goldsmith (1969), McKinnon (1973), Shaw (1973) and many others, the relationship between economic growth
and financial development has been attracting many scholars’ interests but still remains one of the popular
research area which has no single explanation.
Schumpeter (1912) viewed that a well functioned financial system would induce technological innovation
by identifying, selecting and funding those entrepreneurs that would be expected to successfully implement their
innovative products and productive processes. Hicks (1969) argued that financial institutions facilitates
economic growth through capital formation. In his perspective, financial institutions affect interest rates by
reallocating financial resources among different capital producing technologies. Therefore, financial institutions
manage their liquidity risks and it is a crucial factor for market developments.
In contrast, Joan Robinson (1952) argues that financial sector follows where enterprise leads. There are
many authors agree with this argument and they argue that economic development demands better financial
services and financial sector adjusts for this demand. Robert Lucas (1988) says that role of financial sector is
over stressed and according to this view many development economists including Noble Laureates Bauer, Colin
Park, Hirshman, Lewis, Myrdal, Prebisch, Rosenstein-Rodan. Rostow, Singer and Tinbergen neglected financial
sector role when they analyzed economic development.
Nowadays economists try to answer what the causality is rather than if financial development is an
important for economic growth. Levine (1998), King and Levine (1993a, 1993b), Rousseau and Wachtel (1998),
Rajan and Zingales (1998), and Okedokun (1998) investigated the issue in more empirical aspect.
2.1 The unidirectional relationship from financial development to economic growth
Levine (1997) argues that financial systems can accomplish five functions to ameliorate information and
transactions frictions and contribute to long-run growth. These five functions are: facilitating risk amelioration,
acquiring information about investments and allocating resources, monitoring managers and exerting corporate
control, mobilizing savings, and facilitating exchange. These functions facilitate investment and hence higher
economic growth. McKinnon (1973), King and Levine (1993), Levine et al. (2000), and, Christopoulos and
Tsionas (2004) argues that there is a causal direction from financial development to economic growth. They say

4
that appropriate financial policies will lead to long run economic growth. Their fundamental objective is to
determine if there is a significant causality from financial development to economic growth. For example, King
and Levine (1993a) found, by studying 80 countries over the period 1960-1989, the level of financial
development to be a good predictor of economic growth. They used real per capita GDP growth, the rate of
physical capital accumulation, and the rate of improvement in economic efficiency as dependent variable and
four financial development indicators which includes financial depth (M2/GDP), magnitude of banking sector
(deposit money/(deposit money + central bank domestic asset)), private sector credit, and other controlling
variable (technology growth and human capital accumulation etc.) as explanatory variables. They found out that
lack of financial development could possibly induce some form of “poverty trap” because of the possible
existence of multiple steady state equilibriums.2
Shan and Morris (2002) examined the relationship for 19 OECD countries using Toda and Yamamoto’s
(1995) model using variables of real GDP, ratio of total credit to GDP, spread of borrowing and lending interest
rates, productivity, ratio of gross investment to GDP, ratio of total trade to GDP, CPI, official interest rate, stock
and market price index etc. They concluded that financial development leads to economic growth.
Evans, Green, and Murinde (2002) examined the relationship for 82 countries using panel regression
including variables as labor, physical capital, human capital, and monetary factors including money and credit.
They show that financial development is important as human capital in the economic growth process.
2.2 The unidirectional relationship from economic growth to financial development
Robinson (1952), Gurley and Shaw (1967), Goldsmith (1969), Jung (1986) and others argue that if the
economy grows, there will be increasing demand for financial services and it will lead to financial sector’s
expansion and development. All these views are generally based on the indicator which is ratio of broad money
to GDP which is standard measure of financial development and on the other hand it is inverse of the velocity of
circulation of the broad money. Therefore, because of a downward trend in the velocity of circulation of money,
positive relationship between the financial sector development and economic growth exists. Hence, then the
positive relationship between financial development and real GDP can reflect an income elasticity of the
demand for money with respect to income, which is greater than one. Consequently, according to this argument
Ghali (1999) argues that the direction of causality will be from real GDP to financial development, and that
through the demand for money.
2 Financial Development and Economic growth: The case of eight Asian countries, Dipendra Sinha and
Joseph Macri

5
These findings can lead us to financial repression policy. In other words, government focus on economic
growth rather than financial development with a financial repression policies by intervening in financial
resource allocation. Financial repression policy can achieve rapid economic growth but after the economic
development reaches certain level the government needs to liberalize the financial sector for further
development.
2.3 The Bidirectional relationship between financial development and economic growth
There are also authors such as Demetriades and Hussein (1996), Blackburn and Huang (1998), Khan
(2001), and Shan, Morris, and Sun (2001) who believe two way causality. They argue that financial
development and economic growth support each other, if financial development helps economic growth,
economic growth helps to develop financial systems. In early period, for example, Patrick (1966) claims that the
causality goes from finance to growth and then switch from growth to finance. In other words, financial sector
development encourages real capital formation per capita, consequently, when the economy is in the growth
stage, an increasing demand for financial services induces an expansion not only in the financial sector but also
in the real sector.
Shan, Morris, and Sun (2001) examined the relationship between financial development and economic
growth for 9 OECD countries and China using VAR model. The result shows that 5 out of 10 countries have a
bilateral Granger causality, 3 of the have reverse causality with economic growth leading to financial
development and other 2 countries do not have a causal effect at all. Arestis, Demetriades and Luintel (2001)
investigated stock market development, credit market development and economic growth using time series
analysis for 5 developed countries. Their result shows that bank based financial system is more likely to
promote long-run growth than capital market based countries.
Sinha and Macri (2001) investigated the relationship between financial development and economic growth
for 8 Asian countries which consist of 7 developing countries and Japan. Their result says that bilateral causal
relationship exists for 3 countries, unidirectional relationship from finance to growth for 2 countries, reverse
causality from growth to finance for 3 countries including South Korea.
In terms of research method, some scholars like Berger, Hassan and Klapper, (2004), Dawson (2003),
Deidda (2001), Khan and Senhadji (2000), King and Levine (1993), Lensink (2001), Odedokun (1996), Rajan
and Zingales (1998), and Sala-i-Martin (1997) applied cross country regressions whereas others such as
Calderon and Liu (2003), Edison, Levine, Ricci and Slok (2002), and Manning (2003) employed panel data
regression. Therefore, some others have used a combination of both cross and panel data regression. There are

6
also studies which used Granger causality tests to examine the relationship by Arestis, Demetriades and Luintel
(2001), Bhattacharya and Sivasubramanian (2003), Chang (2002), Darrat, Abosedra and Aly (2005),
Demetriades and Hussein (1996), Ghirmany (2004), Luintel and Khan (1999), Thangavelu and James (2004),
and Shan and Morris (2002) etc.
Since financial development is not easily measurable, papers attempting to study the link between financial
deepening and growth have chosen a number of proxy measures and subsequently, have come up with different
results (King and Levine, 1992; Savvides, 1995; Khan and Senhadji, 2003; Hassan and Bashir, 2003; Chuah and
Thai, 2004; Al-Awad and Harb, 2005, among others). However, the general consensus of these studies is that
there is a positive correlation between the financial sector and growth and that the development of bank credit
has an important impact on economic growth.
Financial repression policy and financial liberalization
Economists generally argue that financial repression policies prevents the efficient allocation of capital and
in that way harms economic growth. Mckinnon and Shaw (1973) examined the impact of the government
involvement in the financial sector development. They argued that financial repression policy has negative
impact on the development of the financial sector and economic growth as well. Roubini and Sala-i-Martin
(1992) viewed that because financial repression leads to inefficient allocation of capital, high costs of financial
intermediation, and lower rates of return to savers, it is theoretically clear that financial repression inhibits
growth.
Financial repression refers to a set of government regulations, laws, and other non-market restrictions
prevent the financial intermediaries of an economy from functioning at their full capacity. Financial repression
policies also can be government directives for commercial banks to allocate credit at subsidized rates to specific
firms and industries to implement industrial policy. It is also more cost effective than going through the public
sector’s budgetary process. South Korea and Japan are the successful examples of government’s directives
which used financial repression policies to boost their export oriented economies during 20th century. South
Korea is one of the cases of most successful financial reforms which had tight and effective control over interest
rates. In 1960s, higher real interest rates led to rapid growth of bank deposits which enabled government to
finance its industrial policies that promotes export oriented economic growth. Cho (1989) viewed that this
government intervention in the financial market shared the associated risks with the commercial banks and it
enabled commercial banks to get involved long-term activities. In 1980s, interest rates and credit allocation were

7
still under control of the government. However, the government intervention was reduced relatively at that time.
The Japanese financial repression and liberalization policies are also successful example and in the 1950s and
I960s the government actively and successfully intervened in the pricing and allocation of credit. World Bank
(1993) also viewed that in a few economies of North East Asia, government interventions resulted in higher and
more equal growth than it would not have occurred.
Demetriades and Arestis (1997) say that successful reform of the real sector came to be seen as
prerequisite to financial reform. Thus financial repression would have to maintain during the first stage of
economic liberalization. Caprio (1994) argue that managing the reform process rather than adopting a laissez-
faire stance is important, and that sequencing along with the initial conditions in finance and macroeconomic
stability are critical elements in implementing successfully financial reforms.
Kaminsky and Schmukler (2002) argue that financial liberalization can create short-term volatility despite
its long-term gains. Therefore, fully liberalized financial sector does not mean prerequisite condition of further
development and removing all the regulations and controls lead to crises rather than economic growth in a short
run. Some developing countries which liberalized their financial markets experienced crises partially because of
the external shocks that financial liberalization introduces or amplifies.
8
III. OVERVIEW OF FINANCIAL SECTOR IN MONGOLIA
3.1 Economic overview
Mongolia is the one of the countries which shifted from centrally planned economy to a market based
economy in 1990. The country had been came under the political and economic influence of former Soviet
Union until 1990 even though the country declared its independence in 1911. After the collapse of communist
regimes in 1989, Mongolia embarked irrevocably on the transition to a market economy.
At a same time, as the world financial markets had been rapidly evolving and integrating, the transition
economies faced to challenge of reforming their financial and private sectors efficiently and properly. In early
1990s, Mongolian Parliament passed several important legislations for the finance economy such as
Privatization Law, Banking law, and Bankruptcy Law. As a result, privatization program of state enterprises
initiated and Central bank, several commercial banks and Mongolian stock exchange established. Generally,
Mongolian economic and financial institutional framework established during that time.
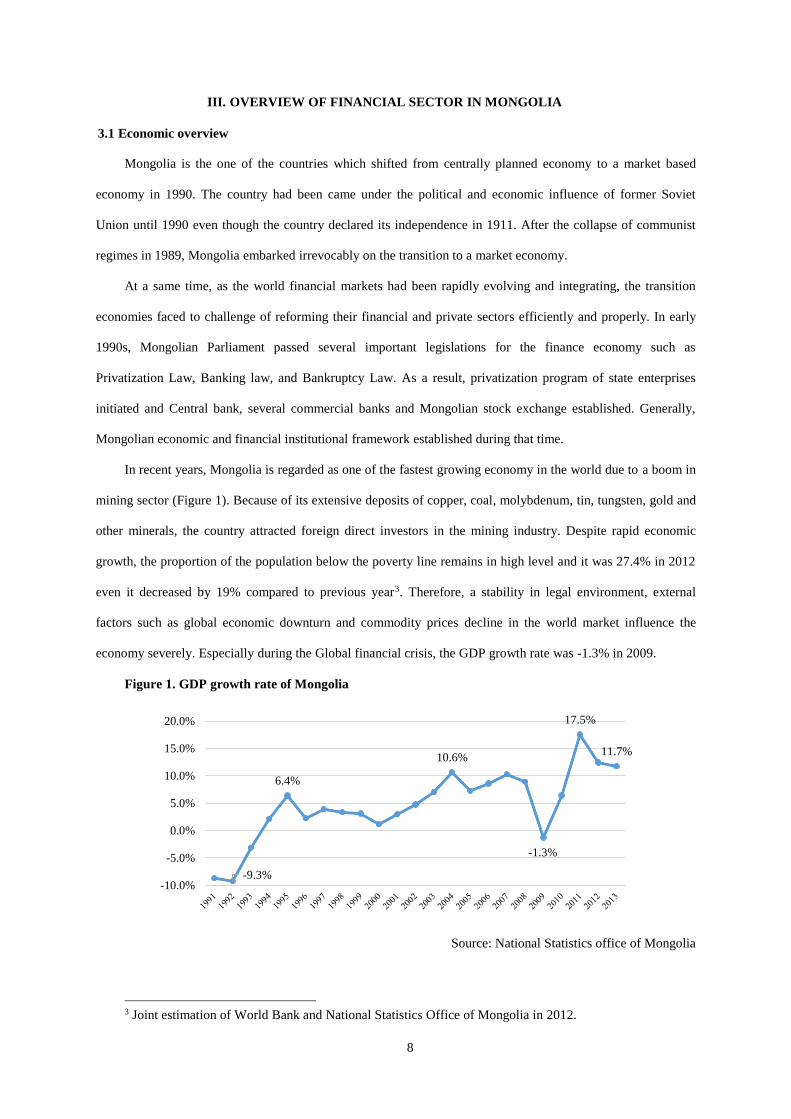
In recent years, Mongolia is regarded as one of the fastest growing economy in the world due to a boom in
mining sector (Figure 1). Because of its extensive deposits of copper, coal, molybdenum, tin, tungsten, gold and
other minerals, the country attracted foreign direct investors in the mining industry. Despite rapid economic
growth, the proportion of the population below the poverty line remains in high level and it was 27.4% in 2012
even it decreased by 19% compared to previous year3. Therefore, a stability in legal environment, external
factors such as global economic downturn and commodity prices decline in the world market influence the
economy severely. Especially during the Global financial crisis, the GDP growth rate was -1.3% in 2009.
Figure 1. GDP growth rate of Mongolia
Source: National Statistics office of Mongolia
3 Joint estimation of World Bank and National Statistics Office of Mongolia in 2012.
-9.3%
6.4%
10.6%
-1.3%
17.5%
11.7%
-10.0%
-5.0%
0.0%
5.0%
10.0%
15.0%
20.0%

9
Due to world market price decline of main exporting commodities, a decrease in net capital inflow caused a
sharp reduction in foreign exchange reserve. Thanks to strong policy response from the Mongolian authorities
with the financial support by IMF, other international financial institutions and donor countries, two years later
Mongolia experienced it’s the highest economic growth rate of 17.5% in 2011. However, keeping the high
economic growth rate sustainably became a major challenge for Mongolian authorities and because of
uncertainty in Mongolian legal environment which resulted a sharp decline in foreign direct investment and
Chinese decreasing demand in imported coal, the economic growth rate fell down to 11.7% in 2013.
Furthermore, high inflation rate tends to erode GDP gains, with an average rate of 12.3% in 2013. In early
years, Mongolia experienced hyperinflation with the rate of 325% in 1992 right after the transition to market
economy. As a result of macroeconomic stabilization policy, financial sector reform which includes
privatization of commercial banks and restructuring, the inflation declined to less than 10% in 2000. However,
Mongolian economic reliance on a few major industries keeps the country vulnerable on external shocks such as
world commodity market prices fluctuations. These external shocks reflects to the higher inflation in Mongolia
and during the global financial crisis, it peaked to 23.2%.
Figure 2. Inflation of Mongolia (CPI, annual %), 1992-2000, 2001-2013
Source: The Bank of Mongolia
In terms of economic activities, besides mining (21%), wholesale and retail (16%) and agriculture (15%)
are the main industries in the composition of GDP of Mongolia by 2012 (Figure 3). Besides impact of world
market prices of main exporting products, a weather condition is still one factor influences the economy
especially on agriculture, which is one of the main industry but still not developed well.
325.5%
183.0%
66.3%53.1%44.6%
20.5%6.0%10.0%8.1%
0.0%
50.0%
100.0%
150.0%
200.0%
250.0%
300.0%
350.0%
8.0%
1.6%
4.7%
11.0%9.5%
6.0%
15.1%
23.2%
1.9%
14.3%
9.4%
14.2%
12.3%
0.0%
5.0%
10.0%
15.0%
20.0%
25.0%

10
Figure 3. Industrial composition of GDP of Mongolia in 2012
Source: National Statistics office of Mongolia
3.2 Financial sector reform in Mongolia
3.2.1 Banking sector
Prior to 1991, Mongolia had the mono banking system administered by the State bank of Mongolia which
carried out functions to transfer government resources to public enterprises and commercial banking functions
as well as. Mongolian banking system was changed from mono banking system to dual-tier banking system
under the new Banking Law enacted by Mongolian parliament in 1991. After the legislation, five banks
established from the former State bank and nine were created later. The banking law enabled the central bank to
manage money and credit using indirect instruments but allocation of resources to the market remained in
market mechanism.
Therefore, Mongolian Government implemented a strategy which intended to stabilize macro economy
and reform financial sector. The main objectives of the reform program was to promote establishment of a
competitive, autonomous, market-based, and sound financial system that could regain public confidence and
efficiently mobilize and allocate resources for economic growth. The objective was to be achieved through a
financial sector reform program designed to:
a) strengthen financial intermediaries,
b) strengthen the legal and regulatory framework for the sector, and
Mining and quarrying
21%
Wholesale and retail
trade
16%
Agriculture,
forestry and
fishing15%
Manufacturing
8%
Transportation and storage
7% Real estate activities
6%
Education
5%Public administration and
defence
4%
Financial and insurance
activities
4%
Information and
communication
3%
Construction
2%
Others
9%Others
27%

11
c) establish a market-based financial intermediation process4.
One of the important element in this reform program was to establish a well-defined operating and
regulatory frameworks for the banking sector which meets international standards and norms. On September 3rd
1996, Mongolian Parliament passed Law on Central banking and the powers and responsibilities of BoM were
enhanced in a range of activities including the supervision of commercial banks.
The reason of this legislature was that banking system confronted several banks’ bankruptcies and
instability in the financial sector. Because of liquidity problem and lack of internal risk management and
external control over the banks, banks did not maintain capital adequacy ratios and issued more loan than they
should had issued with exceeding the amount of total deposits. In September 1994, the government forcibly
merged two small banks with two large banks and provided highly subsidized loans to cover the cost of mergers.
In summer 1996, two additional banks were closed, prompting bank run. The BoM injected large volumes of
liquidity in response, but public confidence in the banking system continued to erode. In December 1996, the
government closed large two insolvent banks. After this banking crisis, the BoM implemented restructuring and
recapitalizing the banks. According to World Bank, the direct cost of the banking crisis in Mongolia in 1996
was 8.7% of GDP.
The reform program also included some actions to eradicate government influence on credit decisions and
to improve banks own autonomy by increasing shareholders and managers responsibilities. As a result of the
reform, all commercial banks implemented appropriate credit policies and procedures, improved risk
management and information systems. In terms of human resources capabilities, necessary trainings were
supported by donor countries. Besides banking sector, the reform program encouraged diversification and
competitiveness of financial institutions. In this regard, legal framework for nonbanking financial institutions
was developed.
In 2000-2005, the Government initiated a Medium-Term Strategy for Financial Sector Development which
also addressed the liquidity and solvency issues of commercial banks. One of the main points of that strategy
was to continue the improvement of a market oriented financial system. The restructuring of the commercial
banks was to be pursued more strongly to reduce the role of the government in allocating financial resources,
through liquidation of non-viable banks, and privatization of the more viable banks. ITI Bank and
Reconstruction Bank were liquidated and state owned TDB, the largest bank, was privatized in 2000.
Subsequently, Agriculture Bank and Savings banks were restructured and privatized. These actions also
4 Asian Development Bank, Evaluation Study: Financial Sector in Mongolia—Transition to a Market Economy Built on
Successful Financial Reforms, Rapid Sector Assessment, 2008

12
encouraged a financial development in rural areas and financial sector diversifications by promoting nonbank
and capital market subsectors. In the result of the reform, corporate governance practices in banks improved,
movable property regarded as loan collateral, the types of immovable properties could be used as collateral
expanded and transaction costs associated with collateral registration reduced. Therefore, the reform
strengthened bank supervision and regulations by establishing minimum capital requirements, asset
classification, an exit policy to facilitate the liquidation of troubled banks, and the foundation for developing a
Government bonds market and an interbank market.
3.2.2 Securities market and Non-banking financial sector
The initial step of Mongolian plan to efficiently functioning market economy through the privatization of
state owned assets was entered when the complex policy measures of restructuring the whole economy,
introducing fair market competition, and the sustainable encouragement of a viable private sector development
were taken by the Government. In order to achieve these objectives in the shortest period, and to provide the
basis for a more efficient allocation of economic resources, regulating the flow of capital and to mobilize
savings into the private sector, the establishment of securities market was at the core of the Mongolian
privatization program.
The Mongolian Stock exchange (MSE) was founded in 1991 with the introduction of the mass voucher
privatization program. It was used to initially distribute and collect vouchers, and to sell state assets through
direct share offerings. At the onset of the privatization program, each citizen of Mongolia were given MNT
3000 worth of “Pink” vouchers, and MNT 7000 of “Blue” vouchers. Pink vouchers were used for the
privatization of small business units, and blue vouchers were used to privatize large scale industrial enterprises.
Secondary trading at MSE started in August 1995 and all of the 419 publicly listed companies were privatized
through the mass voucher privatization program.
The role of securities markets is to facilitate the reallocation of property rights. However, much of the
standard benefits of securities markets, such as compliance with the disclosure requirements the internationally
accepted accounting principles and the improvement of corporate governance by monitoring managers and
trading shares actively, have not yet materialized in Mongolia. While market capitalization is relatively high, the
turnover ratio is extremely low in Mongolia, reflecting a lack of liquidity in the market, investor perceptions that
the market is risky, widespread noncompliance with disclosure requirements, and Government indecision to
further the privatization process by releasing state held shares to the public through the MSE.

13
Establishment of Financial Regulatory Committee (FRC) which replaced Mongolia Securities and
Exchange Commission enabled to oversee nonbank and capital market. FRC introduced prudential norms,
minimum capital and licensing requirement for NBFIs.
A reform strategy promoted capital markets to
(i) strengthen the regulatory body
(ii) accelerate privatization of SOEs to increase the number of stocks listed on MSE; and
(iii) introduce the Law on Trusts and Law on Investment Funds, as part of the effort to establish a legal
framework for promotion of new investment instruments.
The MSE was to be separated into two institutions: the MSE would oversee trading functions, while the Central
Depository System handled clearing, settlement, and depository functions.
Overall, Mongolian financial reform strategies were expected to facilitate resource mobilization and increase the
efficiency of resource allocation, in this manner benefiting the whole population. In addition, the reform
program was expected to facilitate access to credit by private entrepreneurs, which would impact positively on
employment opportunities in the country’s growing private sector. Through these developments, the reform
program was also expected to have a positive impact on poverty reduction. For example, first phase of financial
reform led to an average annual GDP growth rate of 3.9% in 1995–1999. Inflation was reduced from over 50%
in 1996 to less than 10% in 1998, according to ADB.
3.3 Current situation of Mongolian Financial Sector
3.3.1 Banking sector
A. Financial deepening
Mongolian financial sector consists of 13 commercial banks including one state owned bank, 245 non-
banking financial institutions (NBFI) and about 143 savings and credit cooperatives (SCCs) as end of 2013. The
banking sector currently dominates the financial sector. The Financial Regulatory Commission, Bank of
Mongolia (BoM) and Financial Stability Council (jointly established by the Bank of Mongolia, Ministry of
Finance (MoF) and Financial Regulatory Commission (FRC) on May, 2007) are responsible for financial
stability and supervision of the financial sector in Mongolia. As the Central Bank, the BoM ensures the stability
of the national currency. According to its legal mandate, the BoM promotes balanced and sustained
development of the national economy, through maintaining the stability of money, financial markets, and the
banking system. In order to implement its objectives, the BoM conducts activities such as issuing currencies in

14
circulation, formulation and implementation of monetary policy, acting as the Government’s fiscal intermediary,
supervision of banking activities, organization of inter-bank payments and settlements, management of the
official foreign exchange reserves 5 . The BoM is responsible for supervision of banks while the FRC is
responsible for supervision of all other financial institutions including insurance companies, savings and credit
cooperatives and non-banking financial institutions including securities companies. The mission of the Council
is to contribute to a sustainable economic growth by developing a sound and competitive financial infrastructure
along with improving financial services in terms of quality and access6.
Table 1. The ratios of Main indicators of banking sector to GDP (%)
Indicator Name 2003 2004 2005 2006 2007 2008 2009 2010 2011 2012
M2/GDP 38.5 35.9 37.5 38.2 48.4 34.6 43.7 55.6 57.8 54.6
Domestic credit
provided by
banking sector
(% of GDP)
19.9 27.1 26.6 20.0 28.2 31.8 29.8 30.1 40.3 30.8
Banking sector
total asset/ GDP
49.8 51.5 57.0 62.3 73.6 60.6 73.0 74.2 84.5 85.6
Bank deposits
to GDP (%)
25.1 27.2 29.1 29.2 33.7 32.3 34.4 41.3 46.5 41.3
Gross value
added of the
financial sector
to GDP
4.1 4.2 3.7 2.9 3.1 3.6 3.3 2.9 3.4 4.2
NPL/Total loan 4.8 6.4 5.8 4.9 3.3 7.2 17.4 11.5 5.8 4.2
Source: World Bank, National Statistics office of Mongolia, Bank of Mongolia
In 2012, as a factor of financial deepening, the ratio of M2 to GDP reached 54.6% while domestic credit
provided by banking sector was 30.8% of GDP. In 2012, banks deposits to GDP ratio was 41.3% with a
continuous growth trend. In 2000-2012, the average margin between credit and deposit was 4.7% of the GDP.
Banking sector total asset has been increasing steadily since 2000s and reached 85.6% of GDP in 2012.
Therefore nonperforming loans to total loan outstanding was 4.2% in 2012 which fell down from 17.4% during
Global Financial crisis in 2009.
5 The Bank of Mongolia, www.mongolbank.mn 6 Financial Regulatory Commission of Mongolia, http://www.frc.gov.mn

15
Figure 4. The ratio of M2 to GDP and economic growth rate
Source: World Bank, National Statistics office of Mongolia
Although banking sector reform had a limited success in 1990s, with banking crisis in 1996 and 1998-1999,
since 2000 financial reform led to the development in financial sector and an increase public confidence in
banks. Thanks to restructuring and privatization of commercial banks, financial intermediation deepened and
access to the financial services improved significantly. For instance, the ratio of M2 to GDP which was 21.1%
in 2000 increased significantly to 54.6% in 2012. Therefore, this increasing trend aligns with the Mongolian
GDP growth rate (Figure 4).
21.1 23.8 30.3 38.5 35.9 37.5 38.2 48.4 34.6 43.7 55.6 57.8 54.6
1.1%
3.0%
4.7%
7.0%
10.6%
7.3%8.6%
10.2%8.9%
-1.3%
6.4%
17.5%
12.4%
-3.0%
2.0%
7.0%
12.0%
17.0%
22.0%
0
10
20
30
40
50
60
70
2000 2001 2002 2003 2004 2005 2006 2007 2008 2009 2010 2011 2012
%
M2/GDP, LHS GDP growth rate, RHS
Linear (M2/GDP, LHS) Linear (GDP growth rate, RHS)
16
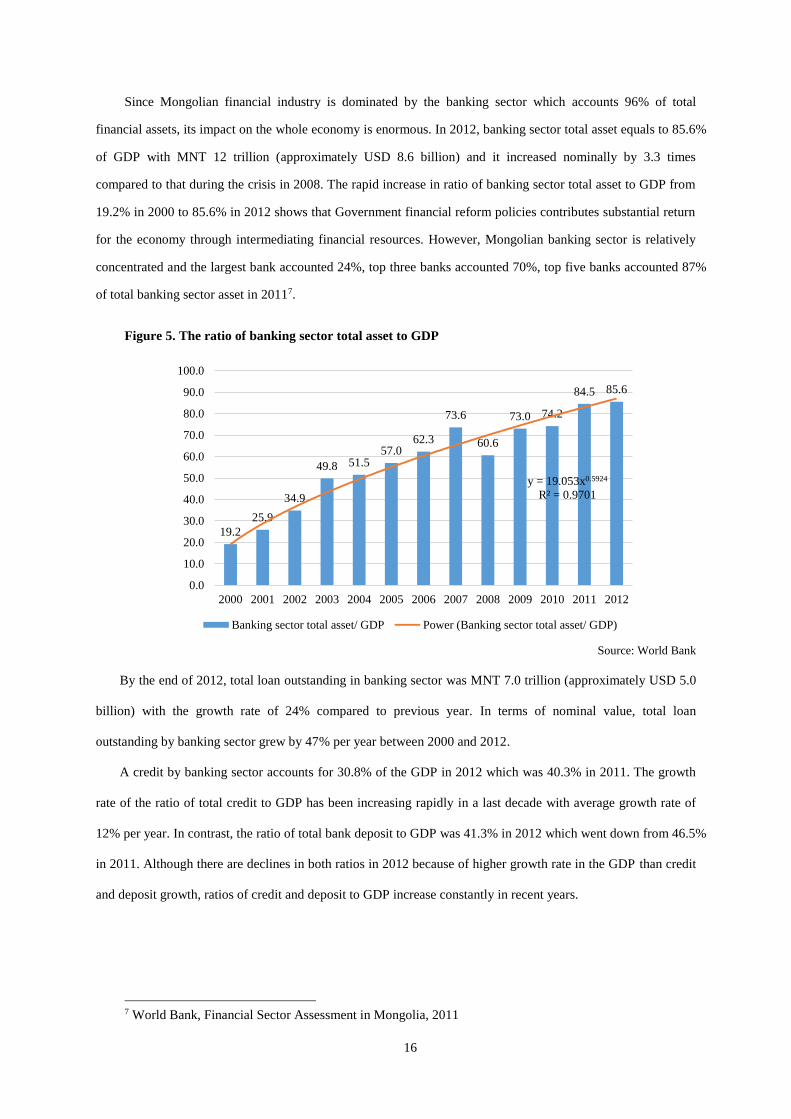
Since Mongolian financial industry is dominated by the banking sector which accounts 96% of total
financial assets, its impact on the whole economy is enormous. In 2012, banking sector total asset equals to 85.6%
of GDP with MNT 12 trillion (approximately USD 8.6 billion) and it increased nominally by 3.3 times
compared to that during the crisis in 2008. The rapid increase in ratio of banking sector total asset to GDP from
19.2% in 2000 to 85.6% in 2012 shows that Government financial reform policies contributes substantial return
for the economy through intermediating financial resources. However, Mongolian banking sector is relatively
concentrated and the largest bank accounted 24%, top three banks accounted 70%, top five banks accounted 87%
of total banking sector asset in 20117.
Figure 5. The ratio of banking sector total asset to GDP
Source: World Bank
By the end of 2012, total loan outstanding in banking sector was MNT 7.0 trillion (approximately USD 5.0
billion) with the growth rate of 24% compared to previous year. In terms of nominal value, total loan
outstanding by banking sector grew by 47% per year between 2000 and 2012.
A credit by banking sector accounts for 30.8% of the GDP in 2012 which was 40.3% in 2011. The growth
rate of the ratio of total credit to GDP has been increasing rapidly in a last decade with average growth rate of
12% per year. In contrast, the ratio of total bank deposit to GDP was 41.3% in 2012 which went down from 46.5%
in 2011. Although there are declines in both ratios in 2012 because of higher growth rate in the GDP than credit
and deposit growth, ratios of credit and deposit to GDP increase constantly in recent years.
7 World Bank, Financial Sector Assessment in Mongolia, 2011
19.2
25.9
34.9
49.8 51.557.0
62.3
73.6
60.6
73.0 74.2
84.5 85.6
y = 19.053x0.5924
R² = 0.9701
0.0
10.0
20.0
30.0
40.0
50.0
60.0
70.0
80.0
90.0
100.0
2000 2001 2002 2003 2004 2005 2006 2007 2008 2009 2010 2011 2012
Banking sector total asset/ GDP Power (Banking sector total asset/ GDP)

17
Figure 6. The Ratio of Total Credit to GDP and the ratio of Bank deposit to GDP
Source: World Bank, Bank of Mongolia
After Mongolian financial sector experienced banking crisis in 1996 and 1999-2000, the authorities
strengthened Central banks supervision capabilities and as a result nonperforming loans decreased significantly
in 2000s. However, during the Global financial crisis, banking sector had a 17.4% of nonperforming loan in
2009. At that time, banks faced liquidity problems. Therefore, two insolvent banks were put into receivership
and government merged two banks by transferring good capitals of insolvent bank (Zoos bank) to the State bank
which had been newly established by the government.
Figure 7. The ratio of NPL to Total loan
Source: World Bank, Bank of Mongolia
B. Financial accessibility
As financial sector deepens, its accessibility for enterprises and individuals increases as well (Figure 8).
According to World Bank, in 2011 bank accounts per 1000 adults were 3183.1 which doubled from previous
year. Furthermore, number of bank branches per 100,000 increases steadily in recent years and it reached 66.4 in
2011.
0.1 0.1 0.2 0.4 0.6 0.9 1.2 2.1 2.6 2.7 3.3 5.6 7.0
9.0 9.813.3
19.9
27.1 26.6
20.0
28.231.8
29.8 30.1
40.3
30.8
11.813.7
18.1
25.127.2
29.1 29.2
33.7 32.334.4
41.3
46.5
41.3
0.0
10.0
20.0
30.0
40.0
50.0
0.0
1.0
2.0
3.0
4.0
5.0
6.0
7.0
8.0
2000 2001 2002 2003 2004 2005 2006 2007 2008 2009 2010 2011 2012
Tri
llio
ns
of
MN
T
Total Loan outstanding Domestic credit provided by banking sector (% of GDP) Bank deposits to GDP (%)
21.9%
6.7%5.1% 4.8%
6.4% 5.8% 4.9%3.3%
7.2%
17.4%
11.5%
5.8%4.2%
0.0%
5.0%
10.0%
15.0%
20.0%
25.0%
0.0
1.0
2.0
3.0
4.0
5.0
6.0
7.0
8.0
2000 2001 2002 2003 2004 2005 2006 2007 2008 2009 2010 2011 2012
Tri
llio
ns
of
MN
T
Total Loan outstanding NPL/Total loan

18
Figure 8. Financial accessibility of Mongolia
Source: World Bank
By 2011, 78% of the adults in Mongolia have an account with a formal financial institutions and 25% of
the adults have a loan from financial institutions and it is higher than some east and central Asian countries
(China, Russia, Malaysia, Kyrgyz Republic, Kazakhstan, and Vietnam etc.) 8 . According to World Bank,
Mongolia has one of the highest bank branch penetration rates in the world, with 66 branches per 100,000 adults
compared to 12 in Korea, 3 in Vietnam and Russia, and 10 in Azerbaijan. However, due to its large territory,
Mongolia’s geographical branch penetration is one of the lowest in the world. It has 0.67 branches per thousand
km square. The low population density makes the provision of traditional banking services outside of the large
cities costly. There are about 1,300 bank branches in Mongolia. Khan Bank and Savings Bank have more than
75 percent of all branches in the country and have the most significant presence in rural areas. Most of their
branches are located outside Ulaanbaatar. In recent year, electronic payment method is evolving fast, but
remains underdeveloped in rural areas.
The World Bank’s Enterprise Survey shows that access to finance is the most important constraint among
the top-10 constraints as reported by firms. More than 30 percent of firms in Mongolia perceive access to
finance as the biggest problem to their operations (higher than the average of 17 percent in the EAP region).
Access to finance is particularly constrained for small and medium enterprises (SMEs), which due to their
nature are more sensitive to an unstable macroeconomic environment, characterized by high inflation and
foreign exchange rate fluctuations. A recent survey by the BoM suggests that SMEs top constraint for their
business operations is the unfavorable macroeconomic and financing environment. In particular, the most
constraining factors are: high interest rates, followed by short maturities of loans that are inadequate to meet
8 Global Findex database, World Bank, Financial Inclusive database, 2011
299.4 348.5 344.6
620.3
1237.71349.6
1564.3
3183.1
0.0
500.0
1000.0
1500.0
2000.0
2500.0
3000.0
3500.0
2004 2005 2006 2007 2008 2009 2010 2011
Bank accounts per 1,000 adults
Expon. (Bank accounts per 1,000 adults )
39.9 41.546.0
52.957.0
54.0 54.3
66.4
0.0
10.0
20.0
30.0
40.0
50.0
60.0
70.0
2004 2005 2006 2007 2008 2009 2010 2011
Bank branches per 100,000 adults
Linear (Bank branches per 100,000 adults)

19
investment needs, followed by small loan amounts, and predominantly immoveable collateral-based lending
requirements9.
C. Financial efficiency
One of the indicator which measures the banking sector efficiency is the interest rate spread. As banking
sector develops, there is a decreasing trend of interest rate spread which is difference between lending and
deposit rate. In Mongolia, the spread shrunk significantly in recent years. For instance, the interest rate spread
was 20.2% in 2000 while it dropped sharply to 6.8% in 2012 because of faster decline in lending rate. In
November 2010, Mongolian Parliament approved the program on configuring market environment to reduce
interest rates which implemented by the Government, BoM, and FRC. According to the program, main
objectives to reduce the interest rates are to (i) keep the inflation in low and stable level, (ii) improve banks
prudential operations, (iv) fasten the capital market development, (v) improve financial sector infrastructure and
legal environment.
Figure 9. Interest rate spread
Figure 10. Noninterest income and overhead cost
of banks (%)
Source: World Bank
Furthermore, noninterest income10 and overhead cost11 are the good indicators to measure banking sector
efficiency. Banks noninterest income to total income bottomed at 17.4% in 2003, since then, it increased
steadily to 37.4% in 2011. In contrast, banks overhead costs to total asset has been decreasing significantly and
it was 1.7% in 2011.
9 World Bank, Financial Sector Assessment in Mongolia, 2011 10 Bank’s income that has been generated by noninterest related activities as a percentage of total income
(net-interest income plus noninterest income). Noninterest related income includes net gains on trading and
derivatives, net gains on other securities, net fees and commissions and other operating income. 11 Operating expenses of a bank as a share of the value of all assets held. Total assets include total earning
assets, cash and due from banks, foreclosed real estate, fixed assets, goodwill, other intangibles, current tax
assets, deferred tax assets, discontinued operations and other assets.
0.0
10.0
20.0
30.0
40.0
Interest rate spread (%)
Deposit interest rate (%)
Lending interest rate (%)
0.0
2.0
4.0
6.0
8.0
0.0
10.0
20.0
30.0
40.0
Bank noninterest income to total income (%), LHS
Bank overhead costs to total assets (%), RHS

20
In terms of profitability, banks return on asset fluctuates in range between 0.5% and 2% while bank return
on equity fluctuates in range between 4.5% and 23%. The profitability of Mongolian banks was higher than
those banks operating in an environment of controlled interest rate regime (World Bank). Mongolian banks’
source of income was limited to interest earning assets, which were basically composed of loans and Central
Bank Bills (CBBs). Interest spread between deposits and loans continued to shrink due to competition pressure.
Meanwhile, BoM’s policy and heated competition between banks for CBBs were putting the yield of the central
bank paper down. On the other hand, rapid rise of operating expenses of the banks had yet to be reversed due to
rapid expansion of branch network and heavy investment in fixed assets. Non-interest incomes were almost
negligible on Mongolian banks income statements, while these incomes, such as those from insurance,
investment, mutual fund and annuity products and services, contribute significantly to commercial banks’
earnings in more developed markets.
Figure 11. Banking sector profitability
Source: World Bank
D. Stability of banking sector
The financial system registered fast recovery and expansion in 2001-2005. Rapid expansion of loan
granting led to the higher default risks. In terms of banking sector stability, Mongolia’s banking sector Z-score12
or the probability of default of a banking system remains higher than 22.3% in 2011 (Appendix 3).
By 2005, Mongolia’s financial sector was on a fast track of expansion in assets, variety of institutions, and
number of customers. Thanks to high commodity prices abroad and rapid economic growth at home, demand
12 It captures the probability of default of a country's commercial banking system. Z-score compares the buffer
of a country's commercial banking system (capitalization and returns) with the volatility of those returns.
0.0
5.0
10.0
15.0
20.0
25.0
0.0
0.5
1.0
1.5
2.0
2.5
2000 2001 2002 2003 2004 2005 2006 2007 2008 2009 2010 2011
Bank return on equity (%, after tax), RHS
Bank return on assets (%, after tax), LHS
Poly. (Bank return on equity (%, after tax), RHS)
Poly. (Bank return on assets (%, after tax), LHS)

21
was rising for financing businesses growth, residential housing and household consumption. There was an
outcry for longer term lending and eased loan terms and conditions. Meanwhile, there were signs of
underestimation of impaired assets and capital, squeezed profit margin and increased operational risk, which
might threaten the stability and soundness of the financial system.
As Figure 17 (Appendix 4) shown, since 2001 a bank liquid reserves to bank asset ratio13 decreased
significantly and bottomed at 13.9% and 14.3% in 2007 and 2008, respectively, since then it increased
dramatically. Because Mongolian economy experienced severe fiscal and current account deficit during the
Global financial crisis, because of price collapse in commodity exports, copper in particular. Generally, during
the crisis time, banks tend to increase the share of liquid reserve to total asset relative to normal economic
condition. Therefore, it is seen that Mongolian banks increased their liquidity ratios in 2009 and 2010
dramatically. As economy started stabilizing in 2011, the banks liquidity ratios fell down from 46.6% to 32.0%.
The adequacy and availability of capital ultimately determine the healthiness of financial institutions to sustain
large losses. The Mongolian banking system’s risk-weighted capital adequacy ratios performed to be adequate
with greater than 10% in 2010-2012. As shown in Figure 18 (Appendix 5), during the global financial crisis,
RWCAR bottomed at 5.5%.
3.3.2 Securities market
The capital market of Mongolia is the one of the smallest market in the world in terms of market
capitalization. Financial market is dominated by banking sector and the nonbank financial sector constitutes less
than 3% of the total asset in the financial sector. In particularly, capital markets contributing less than 1%. This
underdevelopment of the capital market is not able to support the growth momentum of the country in the long
run.
In recent years, Mongolian policymakers’ appreciation about the capital market development grows
rapidly. Main regulatory bodies (MoF, BoM, and the FRC) are vigorously cooperating to reform capital markets
and MoF established a new unit which is in charge of financial sector policy and capital market development.
One of the recent achievement in the Mongolian capital market development is a strategic partnership with the
London Stock Exchange group in 2010 for modernizing Mongolian Stock Exchange. The expected results of
this cooperation are the up-to-date market infrastructure including software, licensing, training, and
maintenances.
13 Ratio of bank liquid reserves to bank assets is the ratio of domestic currency holdings and deposits with
the monetary authorities to claims on other governments, nonfinancial public enterprises, the private sector, and
other banking institutions.

22
For the bond market, government bonds account for 98% of the total bond market. In contrast, corporate
bond market is very small because companies prefer to get financing from banks or abroad. Therefore, more
than 50% of the corporate bonds sold were short-term and institutional investor base is very narrow.
Figure 12. Government and corporate bond trade volume
Source: Mongolian Stock Exchange
Market capitalization, and number of transactions have risen rapidly over the past two years, albeit from a
very low level. By end- 2011, the market capitalization of MSE increased by MNT 794.6 billion or by 58
percent compared to 2010, reaching MNT 2.2 trillion (US$1.6 billion). However, it decreased by 18.1% and
reached USD 1.3 billion in 2012. The price indices and turnover levels of the MSE surged in 2009 and 2010,
with the MSE becoming one of the best-performing emerging stock markets in the world. However, the
Mongolian stock market is still small and illiquid. The ratio of stock market capitalization to GDP peaked at 18%
in 2011. In 2012, the total market capitalization is 12.6% of GDP. Number of listed companies are still few, 329
in 2012, and their sizes are also small. Top 20 companies which compromises MSE Top 20 index account for
more than 80% of the total market capitalization.
2.982.772.66
0.960.85
0.502
0 0
4.39
0.3090
0
0.5
1
1.5
2
2.5
3
3.5
4
4.5
5
200
3
200
4
200
5
200
6
200
7
200
8
200
9
201
0
201
1
201
2
201
3
Bil
lio
ns
of
MN
T
Corporate bond trade volume
21.712.4 6.7 4.4
39.5
1.4 0
30
236.7
0.000525
1.010
50
100
150
200
250
Bil
lio
ns
of
MN
T
Government Bond trade volume

23
Figure 13. Stock Market Capitalization to GDP (%)
Figure 14. Market Capitalization in current USD
Source: World Bank
Turnover ratio of stock traded14 in 2012 was 2.84% (USD 200,000) and generally it is the lowest among
the other emerging market peers. One more problem is that majority of the securities of MSE Top 20 index are
illiquid. In terms of intermediation, in 2012, 88 companies operated as broker-dealer, out of which 22 as
underwriter, 16 investment advisers, and 1 credit rating agency. One of the 88 broker- dealers carries out more
than 50 percent of total transaction volumes on MSE. Therefore, there are no intermediaries for fund
management, no mutual fund in the domestic market, and no derivatives market.
14 World Bank definition: Turnover ratio is the total value of shares traded during the period divided by the
average market capitalization for the period. Average market capitalization is calculated as the average of the
end-of-period values for the current period and the previous period.
2.7 1.2 1.8 3.314.5
7.2 9.417.6 18.0
12.6
0
20
40
60
80
100
120
140
160
180
2003200420052006200720082009201020112012
East Asia & Pacific (developing only)
Lower middle income
Mongolia
World
37 37 32 42 25 46113
612
407430
1,093
1,579
1,293
0
200
400
600
800
1000
1200
1400
1600
1800
200
0
200
1
200
2
200
3
200
4
200
5
200
6
200
7
200
8
200
9
201
0
201
1
201
2
백만

24
IV. EMPIRICAL STUDY
4.1 Model
To analyze the causal relationship between financial sector development and economic growth, I use the
following VAR model.
{𝐺𝐷𝑃 = 𝑓(𝐹𝐷)𝐹𝐷 = 𝑔(𝐺𝐷𝑃)
(1)
Where:
GDP: Growth rate of real GDP per capita
FD: Financial sector development variables including:
{Financial deepening; accessibility; efficiency; stability}
The bivariate VAR model to be tested:
𝑦𝑡 = 𝛼0 + 𝛼1𝑦𝑡−1 +⋯+ 𝛼𝑙𝑦𝑡−𝑙 + 𝛽1𝑥𝑡−1 +⋯+ 𝛽𝑙𝑥−𝑙 + 𝑒𝑡 (2)
𝑥𝑡 = 𝛾0 + 𝛾1𝑥𝑡−1 +⋯+ 𝛾𝑙𝑥𝑡−𝑙 + 𝜃1𝑦𝑡−1 +⋯+ 𝜃𝑙𝑦−𝑙 + 𝑢𝑡 (3)
The model will be tested for possible pairs of (𝑥, 𝑦) series in the group. The reported F-statistics in causality
tests are the Wald statistics for the joint hypothesis for equation (2) and (3), respectively:
𝛽1 = 𝛽2 = ⋯ = 𝛽𝑙 = 0 (4)
𝜃1 = 𝜃2 = ⋯ = 𝜃𝑙 = 0 (5)
4.2 Data
In order to analyze the causal relationship between economic growth and financial sector development, the
indicators or variables should be chosen wisely. Because of data availability and consistency, I analyzed
Mongolian quarterly data between 1995 and 201215. King and Levine (1993) chosen the 4 variables including
ratio of M2 to GDP, ratio of deposit money in the commercial banks to total banking system, ratio of claims on
nonfinancial sector by banks to total domestic credit and ratio of claims on nonfinancial sector by banks to GDP
as proxies of financial sector development. In this research paper, I will follow the general practices to choose
the variables which commonly used in previous studies. Therefore, additional variables which reflect to
financial accessibility, efficiency and stability as financial development indicators.
4.2.1 An indicator of economic growth
The standard measure of economic growth is growth rate of GDP per capita and in this study I used real
GDP per capita (PPP) at constant price in 2005 in U.S dollar terms. Because the quarterly data contains
seasonality, Census X12 is used to make seasonal adjustment on the data.
15 Some data of financial accessibility, efficiency and stability are available since 2000s.

25
4.2.2 Indicators of financial sector development
Financial deepening indicators: Roubini and Sala-i-Martin (1992), King and Levine (1993) and many
other subsequent authors used the ratio of broad money to GDP as financial deepening indicator. In order to
measure banking sector magnitude, I used ratio of domestic bank credit to private sector to nominal GDP as
second indicator of financial sector development. Capital market development is also crucial for financial sector
development, thus, ratio of market capitalization to the GDP is used as one proxy as well.
Table 2. Data description and sources
Classification Variable Name Description Source
Economic growth indicator
Economic growth
indicator
Y (DY) Real GDP per capita by
quarter
National Statistics Office
of Mongolia
Financial development indicators
Financial deepening ASSET Ratio of banking sector
total asset to GDP
Bank of Mongolia
DEPOSIT Banking sector deposit to
GDP
Bank of Mongolia
M2 Ratio of M2 to GDP Bank of Mongolia
National Statistics office
of Mongolia
PRIVATE Ratio of claims on
private sector by banks
to GDP
Bank of Mongolia
National Statistics office
of Mongolia
MKTCAP Ratio of Stock Market
capitalization to GDP
Bank of Mongolia
National Statistics office
of Mongolia
Financial Accessibility ACC Log of Bank accounts
number per 1000 adults
World Bank
BRANCH Log of Banks branches
per 100,000 adults
World Bank
Financial Efficiency SPREAD Loan rate minus deposit
rate
World Bank
ROA Return on asset of banks
(after tax)
World Bank
ROE Return on equity of
banks (after tax)
World Bank
NONINT Bank Non interest
income to total income
World Bank
OVERHD Bank overhead cost to
total asset
World Bank
Financial Stability CAR Capital Adequacy Ratio Bank of Mongolia
NPL Nonperforming loan to
total loan
Bank of Mongolia
LIQGDP Liquid Liabilities to
GDP
World Bank
LIQ1 Liquid assets to total
deposits and short term
funding
World Bank
Z Z-score of banks World Bank

26
Financial accessibility indicators: One of the financial development measure is its accessibility. In this
regard, I included bank accounts number per 1000 adults and bank branches per 100,000 adult. Due to data
limitation, there is no available data to measure the access to finance for enterprises.
Financial efficiency indicators: Efficiency of banking sector refers to its profitability and efficient
operation. Therefore interest rate spread can be a good proxy to measure competition among the commercial
banks. As banking sector grows, interest rate spread tends to shrink and it also reflects to banks’ healthiness.
Although, interest rate can be affected by macroeconomic policies and economic circumstances, generally it
shows the efficient allocation of resources. Therefore, financial sector efficiency is the qualitative measure of
financial development and therefore the quality of financial sector contributes economic growth in the long run.
Economic growth requires not only bigger financial market but also better one. In this study, financial sector
efficiency, particularly banking sector efficiency, is measured by interest rate spread, banking sector’s ROA,
ROE, noninterest income, and overhead cost.
Financial stability indicators: Pierre and Terhi (2010) found that banking sector stability affects real
economic output using panel VAR model for OECD countries. Financial stability reduces the uncertainty and it
has positive impact on output. Therefore, I included financial sector, particularly banking sector, stability as one
measure of financial development. Liquidity measures and probability of bank defaults also included in this
category.
4.3 Stationary test
A series is said to be (weakly or covariance) stationary if the mean and covariance of the series do not
change over the time. If the time series is not stationary or to series is I(d) which means integrated in order of d,
it should be used in the regression as differenced by order of d until it becomes stationary. A difference
stationary series is said to be integrated and is denoted as I(d) where d is the order of integration. Stationary time
series should be checked by unit root test and Augmented Dickey- Fuller (ADF) test is widely used. At first, the
test used in variables on their own level and result shown in Table 4.
As a result of ADF unit root test, all the variables are stationary in the level except variable Y. Accordingly,
the unit root of variable Y is tested again in its first order. Because when time series is stationary its further
orders are also stationary, additional unit tests for stationary series are not required. Moreover, the results of
ADF test with intercept and both of trend and intercept for all variables are same as previous tests result.
Table 3 ADF Unit root test (level, no trend and no intercept)

27
t-stat Probability Unit Root
ACC -5.7446 0.0000 Stationary
ASSET -11.0519 0.0000 Stationary
BRANCH -5.7446 0.0000 Stationary
CAR -5.5978 0.0000 Stationary
DEPOSIT -9.9073 0.0000 Stationary
Y -1.9074 0.0543 Non stationary
LIQ -7.2801 0.0000 Stationary
LIQGDP -9.0000 0.0000 Stationary
LOAN -6.4390 0.0000 Stationary
M2 -11.1558 0.0000 Stationary
MKTCAP -7.6104 0.0000 Stationary
NONINT -7.2801 0.0000 Stationary
NPL -6.3813 0.0000 Stationary
OVERHD -7.0000 0.0000 Stationary
ROA -7.0000 0.0000 Stationary
ROE -7.0000 0.0000 Stationary
SPREAD -7.3559 0.0000 Stationary
Z -7.0000 0.0000 Stationary
Table 4. ADF Unit root test (1st order)
t-stat Probability Unit Root
DY -13.3935 0.0000 Stationary
4.4 Causality test
VAR models have several advantages compared with other models. One of them is all of variables in VAR
model are regarded as endogenous, and OLS method can be applied to each equation separately. When we
estimate unrestricted VAR model, it is required to use same number of lags for all of the variables in all
equations. Using too many lag length will reduce the degrees of freedom while using too few lagged terms can
lead to specification errors. In order to determine the appropriate lag lengths, the multivariate generalization of
Akaike’s information criterion is used16. The lowest values of these criteria gives the appropriate length of the
lag. In doing so, we used VAR lag order selection criteria and focused on AIC and LR criterion. After
determination of the lag order, we estimate bivariate VAR models for possible pair variables of economic
growth and financial development indicators.
16 Introductory Econometrics for Finance 2nd edition, Chris Brooks, 2008

28
The causality analysis is carried out by using the equations (2) and (3). Table 5-8 shows the results of
causality tests between economic growth and financial development indicators. Financial development
indicators can be divided into 4 groups: financial depth, access to finance, efficiency, and stability17.
Table 5 shows that financial depth indicators cause economic growth in unidirectional way. ASSET,
DEPOSIT and M2 cause economic growth in a short term (within 1 year, according to the causality tests with
the lags between 1 and 4 quarters.) at 5% significance level whereas variables of MKTCAP and PRIVATE
cause economic growth in longer term (2 years and 3 years respectively) at 5% significance level.
Table 5. Causal relationship between financial depth and economic growth
No. Null Hypothesis Obser
vation
Order of
the lag
F-Statistic Probability Causality
1. DY does not Granger
Cause ASSET
68 1 0.01757 0.8950 Banking sector
Asset → Growth
ASSET does not Granger
Cause DY
68 1 8.48309 0.0049
2. DY does not Granger
Cause DEPOSIT
68 1 0.18016 0.6726 Deposit → Growth
DEPOSIT does not
Granger Cause DY
68 1 15.3444 0.0002
3. M2 does not Granger
Cause DY
68 1 9.70198 0.0027 M2 → Growth
DY does not Granger
Cause M2
68 1 0.19465 0.6605
4. DY does not Granger
Cause MKTCAP
50 8 0.8504 0.5665 Market
Capitalization →
Growth MKTCAP does not
Granger Cause DY
50 8 2.75183 0.0191
5. DY does not Granger
Cause PRIVATE
61 12 1.51206 0.1650 Private sector credit
→ Growth
PRIVATE does not
Granger Cause DY
61 12 2.15656 0.0374
Table 6 reports that variables of financial accessibility causes economic growth in short term. Because of
banking sector dominated financial market in Mongolia and limited data availability, variables of this group
refers to proxies of an access to banking services. The result concludes that there is unidirectional relationship
from financial accessibility to economic growth.
17 World bank’s Framework of measuring financial development

29
Table 6. Causal relationship between financial accessibility and economic growth
No. Null Hypothesis Observation Order of
the lag
F-Statistic Probability Causality
1. DY does not Granger
Cause ACC
34 1 0.17313 0.6802 Bank Accounts →
Growth
ACC does not
Granger Cause DY
34 1 4.58527 0.0402
2. DY does not Granger
Cause BRANCH
34 1 0.26443 0.6107 Bank Branches →
Growth
BRANCH does not
Granger Cause DY
34 1 6.01393 0.0200
Granger causality tests in Table 7 report that there are unidirectional relationship from financial efficiency
variables to economic growth in lag order of 8-15. It reports that financial sector efficiency causes economic
growth in 2-4 years.
Table 7. Causal relationship between financial sector efficiency and economic growth
No. Null Hypothesis Observation Order of
the lag
F-Statistic Probability Causality
1. DY does not
Granger Cause
SPREAD
51 8 1.20876 0.3234 Interest rate
Spread → Growth
SPREAD does not
Granger Cause DY
51 8 2.32546 0.0414
2. ROA does not
Granger Cause DY
38 13 2.39281 0.0778 ROA → Growth*
DY does not
Granger Cause ROA
38 13 0.28658 0.9821
3. ROE does not
Granger Cause DY
38 13 3.13448 0.0329 ROE → Growth
DY does not
Granger Cause ROE
38 13 0.15963 0.9987
4. DY does not Granger
Cause NONINT
47 15 4.37246 0.0154 Noninterest
income ← Growth
NONINT does not
Granger Cause DY
47 15 0.41692 0.9354
5. OVERHD does not
Granger Cause DY
35 16 3.43506 0.2487 No causality
DY does not
Granger Cause
OVERHD
35 16 0.44762 0.8606
*At 10% significance level
In my point of view, developed financial sector means better financial services and stable environment. In
this regard, CAR and banking sector liquidity measures lead to economic growth in unidirectional way while
bidirectional relationship exists between NPL and economic growth. This bidirectional relationship is obvious
because when economy shrinks, there is high possibility to increase nonperforming loan, when NPL increases,
an economic activity also can slow down.

30
Table 8. Causal relationship between financial stability and economic growth
No. Null Hypothesis Observation Order of
the lag
F-Statistic Probability Causality
1.
DY does not
Granger Cause CAR
26 1 0.41515 0.5257 CAR →Growth
CAR does not
Granger Cause DY
26 1 7.96272 0.0097
2. DY does not
Granger Cause NPL
62 2 3.14107 0.0508 NPL ↔ Growth
NPL does not
Granger Cause DY
62 2 9.13453 0.0004
3. LIQGDP does not
Granger Cause DY
75 8 6.87872 0.0000 LIQGDP →
Growth
DY does not
Granger Cause
LIQGDP
75 8 0.47708 0.8674
4. LIQ1 does not
Granger Cause DY
43 12 3.52669 0.0080 LIQ1 →Growth
DY does not
Granger Cause LIQ1
43 12 0.50694 0.8837
5. DY does not
Granger Cause Z
38 13 0.13763 0.9994 No Causality
Z does not Granger
Cause DY
38 13 1.30135 0.3348

31
V. CONCLUSION
This thesis studied the causal relationship between range of indicators of financial development and
economic growth using Granger Causality test in case of Mongolia for the period of 1995-2012. The main
interest was analyze if there are causalities between various types of financial development indicators and
economic growth and if exist, what the directions will be.
In general, the empirical findings show that financial development indicators drive to economic growth in
case of Mongolia, and relationship is unidirectional. Following main causal relationships between financial
development indicators and economic growth found:
Financial deepening indicators – ratios of banking sector asset to GDP, banking sector deposit (as
a source of credit) to GDP, broad money or M2 to GDP – strongly and promptly causes economic
growth in short term. In contrast, domestic credit provided by banking sector relative to GDP and
market capitalization relative to GDP drive to economic growth in medium term of 2-3 years.
The causal relationship exists from financial accessibility indicators – bank accounts per 1000
adults and bank branches per 100,000 adults – to economic growth in short period. However,
because of data limitation, financial accessibility indicators did not include the accessibility for
enterprises. Therefore, these indicators might not represent the access to finance fully.
Banking sector efficiency indicators – interest rate spread and profitability measures – causes
economic growth in medium term of 2-4 years.
There is a causal relationship from banking sector stability indicators – capital adequacy ratio,
nonperforming loan to total loan, banking sector liquid asset to GDP, banking sector liquid asset
to its total asset – to economic growth.
Because of the presence of relationship from financial development to economic growth, the study
suggests that Mongolian policymakers need to continue to pursue further financial sector development. Since
the financial liberalization policies have significant effect on strengthening Mongolian financial sector, the
government should continue implementation of policies which dedicated to stabilize macro economy and create
suitable macro environment through sound fiscal, monetary, exchange rate and interest rate policies. Therefore,
preserving the stability of banking sector is vital for not only sustainable financial sector development but also
for economic growth. In doing so, strengthening macro and micro supervision framework for financial
institution is a further action to continue. In terms of access to finance, increasing the possibilities to access
32
financial resources for enterprises, especially small and medium ones, will make benefits for the economy and
society in large scale.
In order to improve the efficiency of financial sectors resource allocation function, the further development
of capital market is truly important. Legal and supervisory framework and internationally acknowledged
practices to support modern securities market is needed and it will encourage the efficiency of capital market
operation. The development of capital market will diversify the Mongolian financial sector and reduce the
dependence on only banking sector. Furthermore, because current banking sector is highly concentrated on few
banks, the policies to encourage competition among the banks should be implemented.
Finally, in current situation of Mongolia, the empirical tests suggest that policies aimed to strengthen and
develop the financial sector will lead to economic growth.

33
REFERENCES
[1] Arestis, Philip. & Demetriades, Panicos., & Luintel Kul B., 2001, “Financial Development
and Economic Growth: The Role of Stock Markets”, Journal of Money, Credit and Banking,
Vol. 33, No. 1 (Feb., 2001), pp. 16-41.
[2] Arestis, Philip. & Demetriades, Panicos., 1997, “Financial Development and Economic
Growth: Assessing the Evidence”, The Economic Journal, Vol. 107, No. 442 (May, 1997), pp.
783-799.
[3] Asian Development Bank, 2005, “Government Financial Sector Reform Program (2000 –
2010), Mid-Term Review Report”
[4] Asian Development Bank, 2008, “Evaluation Study: Financial Sector in Mongolia—
Transition to a Market Economy Built on Successful Financial Reforms, Rapid Sector
Assessment”.
[5] Bagehot, Walter. 1873, “Lombard Street: A Description of the Money Market. King, London”,
reprinted Wiley, New York 1999, ISBN 0-471-34499-0
[6] Bank of Mongolia, 2012, “Annual Report”
[7] Barro, Robert J., and Xavier Sala-i-Martin, 1992, “Convergence”, Journal of Political
Economy 100(2): 223-251.
[8] Berger, Allen N. & Hasan, Iftekhar & Klapper, Leora F., 2004, “Further evidence on the link
between finance and growth: An international analysis of community banking and economic
performance”, Bank of Finland Discussion Papers, Aug, 2004.
[9] Berthelemy J. C. & Varoudakis A., 1996, “Economic Growth, Convergence Clubs, and the
Role of Financial Development”, Oxford Economic Papers, New Series, Vol. 48, No. 2, (Apr.,
1996), pp. 300-328.
[10] Bhattacharya, P. C. & M. N. Sivasubramanian, 2003, “Financial Development and Economic
Growth in India: 1970-71 to 1998-1999”, Applied Financial economics, 13(12).
[11] Blackburn, K., & Huang, V., 1998, “A theory of growth, financial development and trade”,
Economica, 65, 107–124.
[12] Brooks, Chris. 2008, “Introductory Econometrics for Finance” 2nd edition, Cambridge
University Press, 648 pages.

34
[13] Calderon, Cesar & Liu, Lin, 2003. "The direction of causality between financial development
and economic growth," Journal of Development Economics, Elsevier, vol. 72(1), pages 321-
334, October.
[14] Caprio, Gerard, Jr & Levine, Ross, 1994. "Reforming Finance in Transitional Socialist
Economies," World Bank Research Observer, World Bank Group, vol. 9(1), pages 1-24,
January.
[15] Chang, Τ., 2002, “Financial Development and Economic Growth in Mainland China: A Note
on Testing Demand-Following or Supply-Leading Hypothesis”, Applied Economics Letters, 9,
869-873.
[16] Cho, Y.J. 1989, "Finance and development: The Korean approach," Oxford Review of
Economic Policy, Vol 5, No. 4, Winter, pp. 88-102
[17] Christopher J. Green, Alun Dwyfor Evans, Victor Murinde, 2002. "Human Capital and
Financial Development in Economic Growth: New Evidence Using the Translog Production
Function," International Journal of Finance & Economics, John Wiley & Sons, Ltd., vol. 7(2),
pages 123-40, April.
[18] Christopoulos D.K. & Tsionas E.G., 2004, “Financial development and economic growth:
evidence from panel unit root and cointegration tests”, Journal of Development Economics 73
(2004) 55 – 74
[19] Cochrane J.H., 2013, “Finance: Function Matters, Not Size”, The Journal of Economic
Perspectives, Vol. 27, No. 2 (Spring 2013), pp. 29-49.
[20] Darrat Ali F., Abosedra Salah S. & Hassan Y. Aly, 2005, “Assessing the Role of Financial
Deepening in Business Cycles: The Experience of the United Arab Emirates”, Applied
Financial Economics, Volume 15, Number 7, 1 April 2005, 17 pages.
[21] Dawson, John W., 2003. "Causality in the freedom-growth relationship," European Journal of
Political Economy, Elsevier, vol. 19(3), pages 479-495, September.
[22] Deidda L., 2001. "Financial Institutions' Expertise and Growth Effects of Financial
Liberalisation," Working Paper CRENoS 200105, Centre for North South Economic Research,
University of Cagliari and Sassari, Sardinia.

35
[23] Demetriades P.O. & Hussein K.A. “Does financial development cause economic growth?
Time-series evidence from 16 countries.” Journal of Development Economics 51, (1996):
387-411.
[24] Tsolmon, 2010, “Mongolia Banking Sector”, ERINA discussion paper No. 1004e.
[25] Edison, Hali J. & Levine, Ross & Ricci, Luca & Slok, Torsten, 2002. "International financial
integration and economic growth," Journal of International Money and Finance, Elsevier, vol.
21(6), pages 749-776, November.
[26] Ghirmay, T., 2004. “Financial Development and Economic Growth in Sub-Saharan African
Countries: Evidence from Time Series Analysis”. African Development Review. 415-432.
[27] Goldsmith R. W., “Financial Structure and Development”, New Haven, CT: Yale University
Press.
[28] Gurley J.G., Shaw E.S, “Financial Structure and Economic Development”, The University of
Chicago Press , Page 257 of 257-268
[29] HahIni, Hongjoo & Yenier, Demir, 1998, “Financial Sector Reforms in Mongolia”, EDI
working papers, World Bank.
[30] Harb, Nasri & Al-Awad, Mouawiya, 2005. "Financial Development and Economic Growth in
the Middle East," MPRA Paper 13605, University Library of Munich, Germany.
[31] Hassan, M.K. & Bashir A-H.M., 2003, “Determinants of Islamic Banking profitability”, Paper
presented at the Economic Research Forum (ERF) 10th Annual Conference, Marrakesh,
Morocco, 16-18 December.
Chuah H. L & Thai V, 2004, “Financial Development and Economic Growth: Evidence from
Causality Tests for the GCC countries”, IMF Working Paper, WP/04/XX (Fall).
[32] Hicks J., 1969, “A Theory of Economic History”. Oxford: Clarendon, 181 pages
[33] IMF, 2011, “Mongolia: Financial System Stability Assessment”, Country Report No. 11/107.
[34] Jung, W. S., 1986. “Financial Development and Economic Growth: International Evidence.
Economic Development and Cultural Change”, 34(2), 333-346.
Ghali, K., 1999, “Financial Development and Economic Growth: The Tynisian Experience”,
Review of Development Economics, 3(3), 310 - 322.
[35] Jung, Woo S., 1986, “Financial Development and Economic Growth: International Evidence”,
Economic Development and Cultural Change, Vol. 34, No. 2 pp. 333-346.

36
[36] Kaminsky, Graciela & Schmukler Sergio L., 2002. "Emerging Market Instability: Do
Sovereign Ratings Affect Country Risk and Stock Returns?," World Bank Economic Review,
World Bank Group, vol. 16(2), pages 171-195, August.
[37] Khan Mohsin S. & Senhadji Abdelhak S, 2001, “Threshold Effects in the Relationship
between Inflation and Growth”, IMF Staff Papers, Vol. 48, No. 1
[38] Khan Mohsin S. & Senhadji Abdelhak S., 2000, “Financial Development and Economic
Growth: An overview”, IMF, Working paper, WP/00/209, 24 pages
[39] Khan Mohsin S. & Senhadji Abdelhak S., 2003. "Financial Development and Economic
Growth: A Review and New Evidence", Journal of African Economies, Centre for the Study
of African Economies (CSAE), vol. 12(Supplement), pages 89-110, September.
[40] Khan, Mohsin S. & Senhadji Abdelhak S., “Financial Development and Economic Growth:
An Overview.” IMF Working Paper, WP/00/209, (December 2000).
[41] King, R.G. & Levine R. “Finance and Growth: Schumpeter Might be Right.” The Quarterly
Journal of Economics 108, no. 3 (August 1993): 717-737.
[42] Lensink, Robert. 2001, “Financial development, uncertainty and economic growth.” De
Economist 149, no. 3 (2001): 299-312
[43] Levine, Ross & Loayza, Norman & Beck, Thorsten, 2000, “Financial intermediation and
growth: Causality and causes”, Journal of Monetary Economics 46 (2000), pp. 31-77.
[44] Levine, Ross, “Financial Development and Economic Growth: Views and Agenda.” Journal of
Economic Literature. Vol. 35, (June 1997): 688-726.
[45] Loayza Norman V. & Romain Rancière, 2006, “Financial Development, Financial Fragility,
and Growth”, Journal of Money, Credit and Banking, Vol. 38, No. 4 (Jun., 2006), pp. 1051-
1076.
[46] Luintel, K. B., Khan, M. 1999. “A quantitative reassessment of the finance-growth nexus,
Evidence from a multivariate VAR”, Journal of Development Economics, 60, 381-405.
Thangavelu Shandre M. & Jiunn Ang Beng & James, 2004. "Financial development and
economic growth in Australia: An empirical analysis", Empirical Economics, Springer, vol.
29(2), pages 247-260, 05.
[47] Manning, M., 2003. “Finance Causes Growth: Can We Be So Sure?” The BE Journal of
Macroeconomics, Contributions 3.

37
[48] McKinnon, Ronald I. 1973, “Money and Capital in Economic Development”, Washington,
DC, Brookings Institution.
[49] Shaw, Edward 1973, “Financial Deepening in Economic Development”, New York: Oxford
University Press.
[50] Mody R. J., 1984, “Financial Mechanism and Economic Growth”, Economic and Political
Weekly, Vol. 19, No. 49 (Dec. 8, 1984), pp. 2095-2096.
[51] Nagaishi, Makoto. 1999, “Stock Market Development and Economic Growth: Dubious
Relationship”, Economic and Political Weekly, Vol. 34, No. 29 (Jul. 17-23, 1999), pp. 2004-
2012.
[52] Odedokun M.O 1998, “Financial Intermediation and Economic Growth in Developing
Countries”, Journal of Economic Studies, 25(3): 203 – 234.
[53] Odedokun, M. O. 1996, “Alternative econometric approaches for analyzing the role of the
financial sector in economic growth: time-series evidence from LDCs”. Journal of
Development Economics 50, 119 -146.
[54] Patrick, H.T. 1966, “Financial Development and Economic Growth in Underdeveloped
Countries”, Economic Development and Cultural Change 14, 174--89.
Sinha, Dipendra & Macri, Joseph, 2001. "Financial development and economic growth: The
case of eight Asian countries," MPRA Paper 18297, University Library of Munich, Germany.
[55] Rajan, R.G. & L. Zingales. “Financial Dependence and Growth.” The American Economic
Review 88, no. 3 (June 1998): 559-586.
[56] Robinson, Joan, 1952, “The generalization of the General Theory, The rate of interest and
other essays”, London, Macmillan, 1952, pp 67-142
Lucas, Robert E., 1988, “On the Mechanics of Economic Development, Journal of Monetary
Economics”, 1988, 3-42.
[57] Rousseau, P. L. & Wachtel, P., 2000. "Equity markets and growth: Cross-country evidence on
timing and outcomes, 1980-1995,"Journal of Banking & Finance, Elsevier, vol. 24(12), pages
1933-1957, December.
[58] Savvides, Andreas. 1995, “Economic Growth in Africa”, World Development, volume 23,
number 3, pp. 449-458.

38
[59] Schumpeter J., 1912, “The theory of Economic Development: An inquiry into Profits, Capital,
Interest, and business cycle”, Cambridge: Harvard University Press, 1934
[60] Shan, Jordan. & Morris, Allan, 2002, “Does Financial Development ‘lead’ Economic Growth?”
International Review of Applied Economics 16, no. 2, (2002): 153-168.
[61] Shan, Jordan. & Morris, Allan. & Sun, Fiona., 2001, “Financial Development and Economic
Growth: An Egg-and-Chicken Problem”, Review of International Economics, 9(3), 443 - 454.
[62] Shen Chung-Hua & Lee Chien-Chiang, 2006, “Same Financial Development Yet Different
Economic Growth: Why?” Journal of Money, Credit and Banking, Vol. 38, No. 7 (Oct., 2006),
pp. 1907-1944.
[63] Townsend Robert M. & Ueda Kenichi, 2006, “Financial Deepening, Inequality, and Growth:
A Model-Based Quantitative Evaluation”, The Review of Economic Studies, Vol. 73, No. 1
(Jan., 2006), pp. 251-280.
[64] World Bank, “The making of the East Asia miracle”, Policy Research Bulletin, August--
October 1993, Volume 4, Number 4.
[65] World Bank, 1992, “Mongolia: Toward Market Economy”, ISSN: 0253-2123, ISBN: 0-8213-
2247-8.
[66] World Bank, 2011, “Financial Sector Assessment in Mongolia”.
[67] World Bank, 2012, Financial sector assessment, “Mongolia Access to Finance”, Technical
Note.
[68] World Bank, 2012, Financial sector assessment, “Mongolia Capital Markets”, Technical Note.
[69] World Bank, 2012, Financial sector assessment, “Mongolia”

39
APPENDIXES
Appendix 1
Table 9 Main economic and financial reforms in 1991-1992
Source: World Bank, Mongolia toward Market Economy, 1992
Appendix 2
Figure 15. GDP contribution by some sectors of Mongolia
Source: National Statistics office of Mongolia
11.3 8.9 9.8 11.716.7 21
28.5 27.420.6 19.8 23.6 24.1 20.2
15.6 16.4 17.3 16.715.9
14
13.1 12.4
13.7 12.215.6 17.6
17.7
27.423 18.9 18.5
2019.8
17.7 18.419.2
17.914.3 12.3
14.2
2.5
3.1 3.3 4.1
4.2 3.72.9 3.1
3.63.3
2.9 3.4 4.2
0.0
10.0
20.0
30.0
40.0
50.0
60.0
70.0
2000 2001 2002 2003 2004 2005 2006 2007 2008 2009 2010 2011 2012
Mining Wholesale and retail Agriculture Financial sector
1991:
Increase in retail prices of most goods
Lengthened maturity structure of term deposits and increased interest rates
Substantial reduction of budgetary subsidy for imported goods and to lose-making enterprises
Devaluation of togrog vis-a-vs US dollar to MNT 40=USD 1
Adjustments to wages, pension benefits, and private savings deposits to soften impact of price increase.
Privatization Law passed and program for small privatization initiated.
Banking Law passed, and bank of Mongolia established as the central bank. Separate commercial
banks established.
Direct export rights granted to selected manufacturers
Foreign trading rights issued on nondiscriminatory basis
Stock market regulation established.
1992
Deregulated all prices (except for public services, utility tariffs, public housing rents, selected
medicines, flour, bread, and rationed vodka).
eliminated mandatory state orders for exports
Passed bankruptcy law.
Issue foreign trading licenses on a nondiscriminatory basis (except for copper scrap, cashmere, timber,
and elk horns).
Eliminated budgetary transfer to public enterprises.
Introduced weekly monitoring of budgetary revenues and expenditures.
In September 1992 first prudential ratios have been enforced by the Bank of Mongolia
Established a stock exchange
Raised central bank lending rate close to inflation level
Simplified interbank clearing and payment arrangements
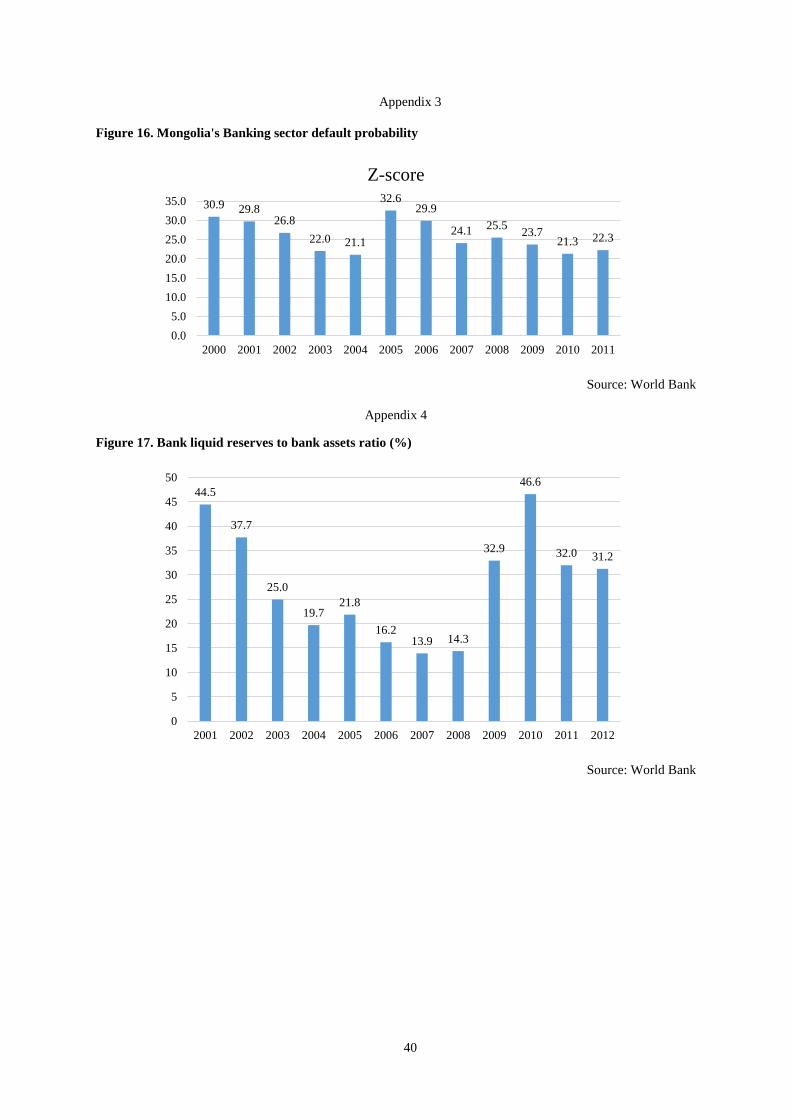
40
Appendix 3
Figure 16. Mongolia's Banking sector default probability
Source: World Bank
Appendix 4
Figure 17. Bank liquid reserves to bank assets ratio (%)
Source: World Bank
30.9 29.826.8
22.0 21.1
32.629.9
24.1 25.523.7
21.3 22.3
0.0
5.0
10.0
15.0
20.0
25.0
30.0
35.0
2000 2001 2002 2003 2004 2005 2006 2007 2008 2009 2010 2011
Z-score
44.5
37.7
25.0
19.721.8
16.213.9 14.3
32.9
46.6
32.0 31.2
0
5
10
15
20
25
30
35
40
45
50
2001 2002 2003 2004 2005 2006 2007 2008 2009 2010 2011 2012

41
Appendix 5
Figure 18. Risk Weighted Capital Adequacy Ratio of Mongolian Banks
Source: Bank of Mongolia
Appendix 6
Figure 19. Number of domestic listed companies
Source: World Bank
18.1%
14.0%
11.6%
5.5%
16.2%
15.0%
16.1%
0%
2%
4%
6%
8%
10%
12%
14%
16%
18%
20%
2006 2007 2008 2009 2010 2011 2012
410 400 403 402 395 392 386 384 376358
336 332 329
0
50
100
150
200
250
300
350
400
450
2000 2001 2002 2003 2004 2005 2006 2007 2008 2009 2010 2011 2012

42
Appendix 7
Table 10. Descreptive Statistics
NPL OVERHD ROA ROE SPREAD Z
Mean -0.006406 -0.020588 0.014314 0.027059 -0.005254 -0.002745
Median -0.040000 0.000000 0.000000 0.000000 -0.010000 0.000000
Maximum 1.590000 0.190000 1.400000 1.670000 0.550000 0.550000
Minimum -0.500000 -0.330000 -0.400000 -0.470000 -0.400000 -0.190000
Std. Dev. 0.269464 0.082642 0.227044 0.278009 0.173119 0.090688
Skewness 3.283864 -1.752604 4.348358 4.227877 0.653657 4.182259
Kurtosis 20.59256 8.464303 28.98455 25.98102 3.849089 28.90097
Jarque-Bera 940.3551 89.55832 1595.513 1274.208 5.973804 1574.254
Probability 0.000000 0.000000 0.000000 0.000000 0.050443 0.000000
Sum -0.410000 -1.050000 0.730000 1.380000 -0.310000 -0.140000
Sum Sq. Dev. 4.574473 0.341482 2.577451 3.864459 1.738271 0.411216
Observations 64 51 51 51 59 51
LIQ1 LIQGDP LOAN M2 MKTCAP NONINT
Mean -0.009091 0.013253 -0.000800 -0.046757 0.062241 0.000364
Median 0.000000 0.000000 0.010000 0.010000 0.020000 0.000000
Maximum 0.240000 0.350000 0.450000 0.340000 2.440000 0.520000
Minimum -0.330000 -0.520000 -1.000000 -1.000000 -0.500000 -0.320000
Std. Dev. 0.095457 0.090340 0.205379 0.275438 0.403498 0.120983
Skewness -1.192984 -1.242644 -2.825182 -2.752080 4.036553 1.407162
Kurtosis 7.693366 19.14997 16.05565 10.07346 23.43989 10.73638
Jarque-Bera 63.52621 923.3684 632.4270 247.6830 1167.163 155.3108
Probability 0.000000 0.000000 0.000000 0.000000 0.000000 0.000000
Sum -0.500000 1.100000 -0.060000 -3.460000 3.610000 0.020000
Sum Sq. Dev. 0.492055 0.669222 3.121352 5.538222 9.280209 0.790393
Observations 55 83 75 74 58 55
ACC ASSET BRANCH CAR DEPOSIT DY
Mean 0.010571 0.026667 0.004000 0.016296 0.026087 0.000556
Median 0.000000 0.030000 0.000000 -0.030000 0.020000 0.000000
Maximum 0.110000 0.350000 0.050000 1.120000 0.310000 0.030000
Minimum 0.000000 -0.240000 -0.010000 -0.270000 -0.230000 -0.030000
Std. Dev. 0.029500 0.089124 0.012175 0.250479 0.101071 0.009405
Skewness 2.774914 0.367468 2.666667 3.359193 0.408502 -0.191998
Kurtosis 9.041620 5.244017 9.268519 15.37192 3.714215 6.225635
Jarque-Bera 98.14841 16.03026 98.78570 222.9763 3.385594 39.57066
Probability 0.000000 0.000330 0.000000 0.000000 0.184004 0.000000
Sum 0.370000 1.840000 0.140000 0.440000 1.800000 0.050000
Sum Sq. Dev. 0.029589 0.540133 0.005040 1.631230 0.694643 0.007872
Observations 35 69 35 27 69 90

42
Appendix 8
Table 11. Correlation Matrix
ACC ASSET BRANCH CAR DEPOSIT DY LIQ1 LIQGDP LOAN M2 MKTCAP NONINT NPL OVERHD ROA ROE SPREAD Z
ACC 1.0000
ASSET -0.2784 1.0000
BRANCH 0.8992 -0.2909 1.0000
CAR -0.1007 0.2350 -0.1244 1.0000
DEPOSIT -0.1792 0.8599 -0.2092 0.2546 1.0000
DY 0.4117 -0.5437 0.5326 -0.0836 -0.3684 1.0000
LIQ1 -0.4088 0.3473 -0.2714 -0.1760 0.4038 -0.2858 1.0000
LIQGDP 0.5176 -0.0077 0.5550 0.1007 0.1225 0.1629 -0.3201 1.0000
LOAN 0.0525 0.7626 0.0470 -0.0210 0.5606 -0.5318 0.1592 0.1719 1.0000
M2 -0.2046 0.8909 -0.1797 0.2592 0.9384 -0.3822 0.2784 0.1008 0.5963 1.0000
MKTCAP 0.2877 -0.0860 0.3823 -0.0137 0.0139 0.3517 -0.0270 0.2120 0.1763 -0.0396 1.0000
NONINT 0.1319 0.4390 0.1195 -0.0794 0.5775 -0.2757 0.4542 0.5273 0.3793 0.4421 -0.0128 1.0000
NPL -0.1459 0.0486 -0.1709 -0.2686 -0.1506 -0.1806 0.2050 -0.0716 -0.0881 -0.1023 -0.1540 0.1434 1.0000
OVERHD -0.7125 -0.0164 -0.5191 0.2363 -0.1120 -0.0713 -0.1351 -0.0454 -0.1661 0.0065 -0.0932 -0.3755 -0.0155 1.0000
ROA 0.5415 0.0816 0.5905 -0.0126 0.1282 0.1749 -0.3669 0.7530 0.2358 0.1850 0.1084 0.5319 -0.0964 -0.2573 1.0000
ROE 0.5675 0.0268 0.5786 0.0312 0.0711 0.1902 -0.5047 0.7908 0.1982 0.1332 0.1042 0.4470 -0.1161 -0.2045 0.9854 1.0000
SPREAD 0.0086 -0.0739 -0.2111 -0.1118 -0.1449 -0.0849 -0.0925 -0.4742 -0.0133 -0.2074 -0.3538 -0.2566 -0.0982 -0.2816 -0.2727 -0.2543 1.0000
Z -0.1765 -0.2948 -0.1494 -0.0754 -0.3524 0.1418 0.2190 -0.7294 -0.2910 -0.3533 0.0628 -0.7107 -0.0109 0.0427 -0.8584 -0.8544 0.2750 1.0000

ACKNOWLEDGEMENTS
Foremost, I would like to express my sincere gratitude to my advisor, Professor Joo-Hoon Kim, for his
continuous and excellent guidance, caring, patience, and providing me with precious advises based on his
immense knowledge and experience. I would never have been able to finish my research paper without the
guidance of my advisor. Besides my advisor, I would also like to thank Professor Hoe Kyung Lee and Professor
Ji Soo Kim for giving me valuable comments and suggestions and helping me to develop my research paper.
Therefore, I would like to thank to my colleagues and friends from the Bank of Mongolia who helped me
to find data set for empirical study. My deep gratitude goes to KAIST-KOICA 2012 fellows for encouraging
and helping each other every time.
Finally, I would like to thank my family and friends who encouraged me to do this research paper.


