Page 1
Volume:01, Number:04, August-2011 Page 57 www.theinternationaljournal.org
Financial Efficiency of Commercial Banks: A Comparative Study of Public
and Private Banks in India in the post-global recession era.
Dr. P.S. Vohra
Head - Department of MBA
Chandigarh Business School, Mohali (Punjab) - India
Abstract
Banks are the main participants of the Indian financial system, because they play a vital role
in the economy of a country. India is one of the most preferred banking destinations as its
economy is not only growing at +8 percent annually, but it is also going through a
transformation to the next level of maturity. After liberalization the banking sector underwent
major changes and it has been totally changed after economic reforms. Always Indian
banking industries were dominated by public sector banks because they play an important
role in development of Indian economy. But now the situations have been changed after
arrival of new generation banks that are known for technical and financial innovation and
their professional management has gained a reasonable position in the banking sector. The
main idea of this research article is to make an assessment of the financial performance of
Indian Public sector banks & Private sector banks. This paper provides empirical evidence
about the impact of financial liberalization and global recession on the performance of Indian
commercial banks. The present study compares the performance of public sector banks with
private banks under various accounting and statistical framework. The data used for the study
were the audited financial results of a sample of 3 public banks and 3 private banks over the
last three financial years.
Key-words – Financial performance, Economic reforms, Liberalizations, Global Recession,
Financial innovation.
Page 2
Volume:01, Number:04, August-2011 Page 58 www.theinternationaljournal.org
Introduction
The Banks are the trusted place of customers. A Banking institution is indispensable in a
modern society. It plays a pivotal role in the economic development of a country and forms
the core of the money market in an advanced country. The Indian Banking industry, which is
governed by the Banking Regulation Act of India, 1949 can be broadly classified into two
major categories, Non-scheduled banks and Scheduled banks. Scheduled banks comprise
commercial banks and the co-operative banks. In terms of ownership, commercial banks can
be further grouped into, Nationalized banks, State Bank of India and its group banks, Regional
Rural banks. These banks have over 67,000 branches spread across the country. In second
phase of financial sector reforms in the early nineties, Central government Issued Banking
Regulation Act (Amendment) 1994 for giving the permission to Private Banks in India. After
their arrival in Indian banking sector they came to be known as New Generation tech-savvy
banks. They have made banking more efficient and customer friendly. In the process they
have rolled public sector banks out of complacency and forced them to become more
competitive. Financial Performance evaluation of a company can be performed through a
close and critical analysis of financial statements. It provides an insight about the behavior of
financial variables for measuring the performances of different units in the industry and to
indicate the trend and tone of improvement or deterioration in the organization. Keeping in
view the afforested facts, in the present study an attempt has been made for Comparative
Analysis of Financial Performance of Selected Public Banks and Private Banks of India.
Objectives of the study –
1) To analyze the financial performance of Public sector banks and Private sector banks
2) To compare the financial performance of Public sector banks and Private sector banks
Data Collection & Methodology –
The present study is mainly based on secondary data. The all required data were collected
from the annual reports of the selected banks through their websites. All the data have been
converted into the lacks for calculation of various indexes of performance and interpretation
of findings also. For comparative study a total of 6 banks have been selected, including 3
from Public sector Banks (Bank of Broada, Canara Bank and Dena Bank) and 3 Private
sector Banks (ICICI, HDFC, AXIS bank).
Hypothesis -
1. H0: There is no significant difference between the Ratios of own funds to total funds of
Public sector Banks and Private sector Banks under study.
2. H0: There is no significant difference between the Debt-Equity Ratio of Public sector
Banks and Private sector Banks under study.
3. H0: There is no significant difference between the Working Capital Fund of Public sector
Banks and Private sector Banks under study.
4. H0: There is no significant difference between the Net Profit Ratio of Public sector Banks
and Private sector Banks under study.
5. H0: There is no significant difference between the Operating Ratio of Public sector Banks
and Private sector Banks under study.
Page 3
Volume:01, Number:04, August-2011 Page 59 www.theinternationaljournal.org
Scope of the study –
This study was mainly planned to evaluate the financial performance of selected Public sector
banks and Private sector Banks during last 3 financial years. This research study surely will
provide a parameter particular for a better understanding of financial performance in banking
sector for various readers or scholars. This attempt covers the extensive research work on
Capital structure, Working capital and Profitability through various accounting ratios and
statistical test on Indian banking sector into two individually category of Public banks and
private banks. The findings of study presents a ground of comparison between selected
variables and it will also reflect as a fundamental research in banking sector during the last
three years after global recession crisis.
Analysis of Financial Performance
Financial performance of a concern has a significant role in its development. The financial
performance can be done through a careful and critical analysis of the financial statement.
The information contained in these statements is considered very useful for every analysis of
performance. Financial analysis can be undertaken by management of the firm or by the
parties outside the firm, viz., owners, creditors, investors and others. All interested parties
have interest in different aspects of financial performance. For example, trade creditors are
interested in that firm who should be able to meet their claims over a very short period of
time. Similarly investors who have invested their money in the firm‟s shares are most
concerned about the firm‟s earning capacity. As such they concentrate on the analysis of the
firm‟s present and future profitability. They are also interested in the firm‟s financial position
to the extent it influences the firm‟s earning ability. Government and local bodies are also
interested in financial performance. Because the firms with sound financial position, play key
role in development of a nation and society and pay taxes.
Study of Capital Structure
Capital structure means the financial plan of a company in which the various sources
of finance are mixed in such a proportion that they provide a distinct financial set up most
suited to the requirements of that particular business concern. To frame a capital structure of
a company is an important task, because each source of finance has its own merit and
demerit. If the financial structure of a company depends on share capital, it may lose the
advantage of trading on equity. On the other hand, if a company has a high capital leverage
mainly depends on borrowed funds it will take a great risk, although this policy is more
profitable for shareholders. Yet it can make a very critical position of the company in lean
years. The following two ratios have been calculated to analyze the capital structure of the
private banks under study:
1. Own funds to total funds ratio
2. Debt-equity ratio.
Own Funds to Total Funds Ratio
This ratio out the extent of shareholders funds in relation to total funds (shares holder‟s funds
plus liabilities) employed in total assets financed by the owners of the company. The high
ratio would suggest that the shareholders themselves have provided funds for the company
and/or sources of funds are through plaguing back of profits. The ratio also indicates that the
Page 4
Volume:01, Number:04, August-2011 Page 60 www.theinternationaljournal.org
company is less dependent on outside sources for assets. The more the ratio the greater will
be the financial soundness of the company. A higher ratio suggests a sound capital structure
of the company for the following two reasons: -
1. Greater margin of shareholders funds against the outside source of finance.
2. Margin of society or security for the creditors is high.
A low ratio on the other hand signifies a smaller amount of shareholders funds in comparison
with outside borrowed funds invested in total assets. It means that the proprietor ship of
owners of total assets is less than that of the creditors. The following formula is used for
determining this ratio.
Own Funds
Total funds
Here, own funds include shareholders equity plus reserves and surplus. The total fund means
the total of shareholders fund and total liabilities.
Ratio of Own Funds to Total Funds of Selected Public Banks During 2008 to 2010
Table no. 1(A) (In Percentage)
Detail 2008 2009 2010 Average
BOB 6.15 5.69 5.43 5.75
CANARA 5.82 5.56 5.55 5.64
DENA 4.6 4.48 4.52 4.53
TOTAL 16.57 15.73 15.5 15.92
Combined Average 5.31
(Source – Annual Reports)
Ratio of Own Funds to Total Funds of Selected Private Banks During 2008 to 2010
Table no. 1(B) (In Percentage)
Detail
2008
2009
2010
Average
HDFC 8.63 8.21 9.67 8.837
ICICI 11.7 13.2 14.2 13.033
AXIS 8 6.9 8.9 7.933
TOTAL 28.33 28.31 32.77 29.803
Combined Average 9.934
(Source – Annual Reports)
Table no 1 shows the Ratio of Own funds to total funds, this ratio was calculated by dividing
total assets in addition of share capital and reserve surplus. In Public banking sector all the
selected banks have shown the decrease trend throughout the study period as compared to the
previous year, even in some cases it slight declined. The calculated reason behind this was
more increase in volume of total assets comparatively the combined figures of share capital
and reserve and surplus. For example in case of BOB in the year 2010 total assets were
increased by 23%, on the other side reserves only by 18% from the year 2009. Due to this
trend the total ratio of selected sector were also reduced every year. The ratios were nearly
close on average in case of BOB and Canara Bank, but Dena Bank was quite low compared
to them.
Page 5
Volume:01, Number:04, August-2011 Page 61 www.theinternationaljournal.org
In Private banking sector all selected variable have shown the mixed trends of increase &
decrease throughout the study period. As in HDFC and Axis bank, it was slapped down in the
mid of the year but again it increased and reached on highest level during the study period.
For example in HDFC bank, in the mid of study period it came down simply behind this
cause was high increase in total assets over the last year with 37%, but on the other side the
reserves were gone high by 28% and equity were increase by 2% only. But in ICICI bank, it
has shown continuously increased trend throughout the study period. The interesting fact was
the ratio reached on the highest level in the end of study period in all the selected variables.
On average point of view the lowest was in Axis banks in whole selected private banks.
On behalf of whole banking sector this ratio was 87% more in Private Banks over the Public
Banks in overall the study, because every year in study they were dominating over the public
banks with 71%, 80% and 111% as a comparison.
Debt Equity Ratio
This ratio establishes relationship between Borrowings and share holder fund. It is
one of the common measure of estimating in adeptness of the concern. It is measurement of
soundness of the long term financial policies of the concern. This ratio is useful for analyzing
the composition of capital structure. It is calculated by dividing additions of share capital
and reserve surplus in the amount of Borrowings. Here amount of borrowing was external
liabilities for banks. And share holders fund refer to owned fund that is equity share capital,
preference share capital and reserves and losses and fictitious assets.
The prime object of calculating the ratio is to measure the relative interested of
owners and creditors. A high ratio shows that the claims of creditors are greater than those of
owners. A very high ratio is unfavorable from the terms amount of view, and introduce in
flexibility in the concerns operation due to imply interference and pressures from creditors. A
low debit equity ratio impresses a greater claim of owners than creditors. From the creditor‟s
point of view, it represents a satisfactory capital structure of the concern since a high
proportion of equity provides a larger margin of safety from them. From the share holder
point of view there is a disadvantage if the firm employs a low amount of debit during period
of good economic activities. Thus, there is a need to make the balance between debt and
equity. The most appropriate debt equity combination would involve a tread off between
return and risk. Hence, neither nor low debt equity ratio is desirable; standard of this ratio is
depend upon the circumstances and privileging practices etc. It may be ideal 1:1 or be ranged
between its 2:1
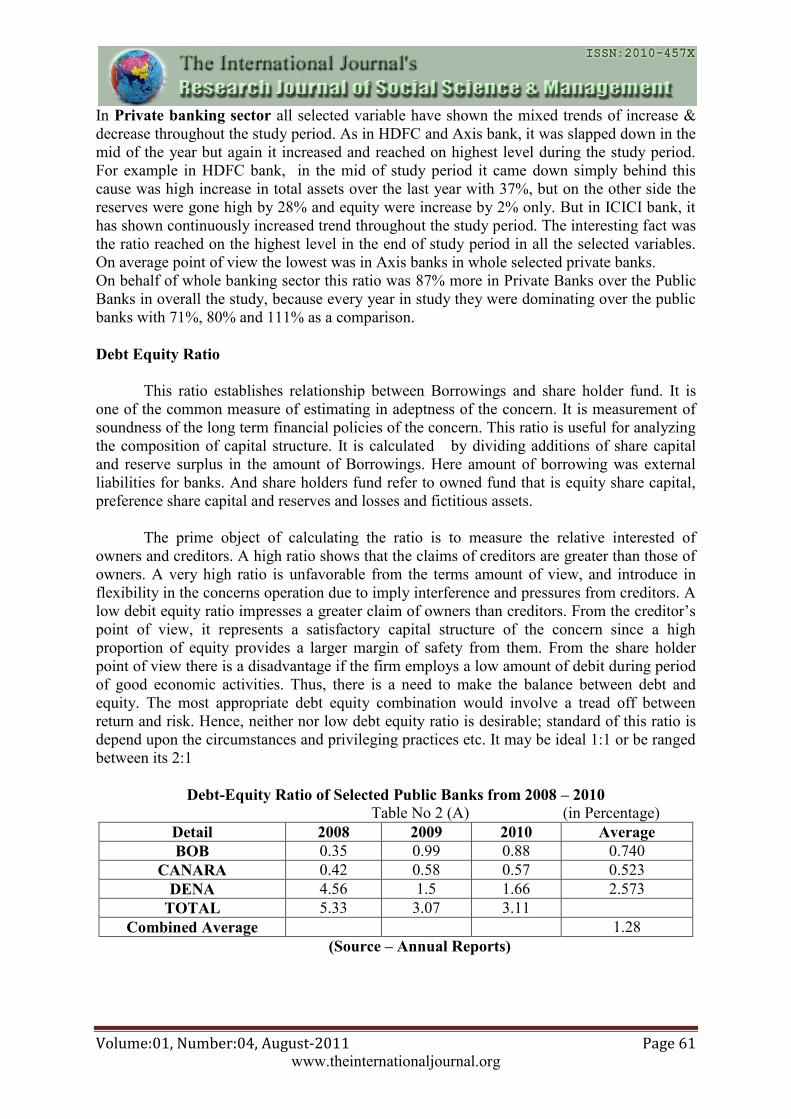
Debt-Equity Ratio of Selected Public Banks from 2008 – 2010
Table No 2 (A) (in Percentage)
Detail 2008 2009 2010 Average
BOB 0.35 0.99 0.88 0.740
CANARA 0.42 0.58 0.57 0.523
DENA 4.56 1.5 1.66 2.573
TOTAL 5.33 3.07 3.11
Combined Average 1.28
(Source – Annual Reports)
Page 6
Volume:01, Number:04, August-2011 Page 62 www.theinternationaljournal.org
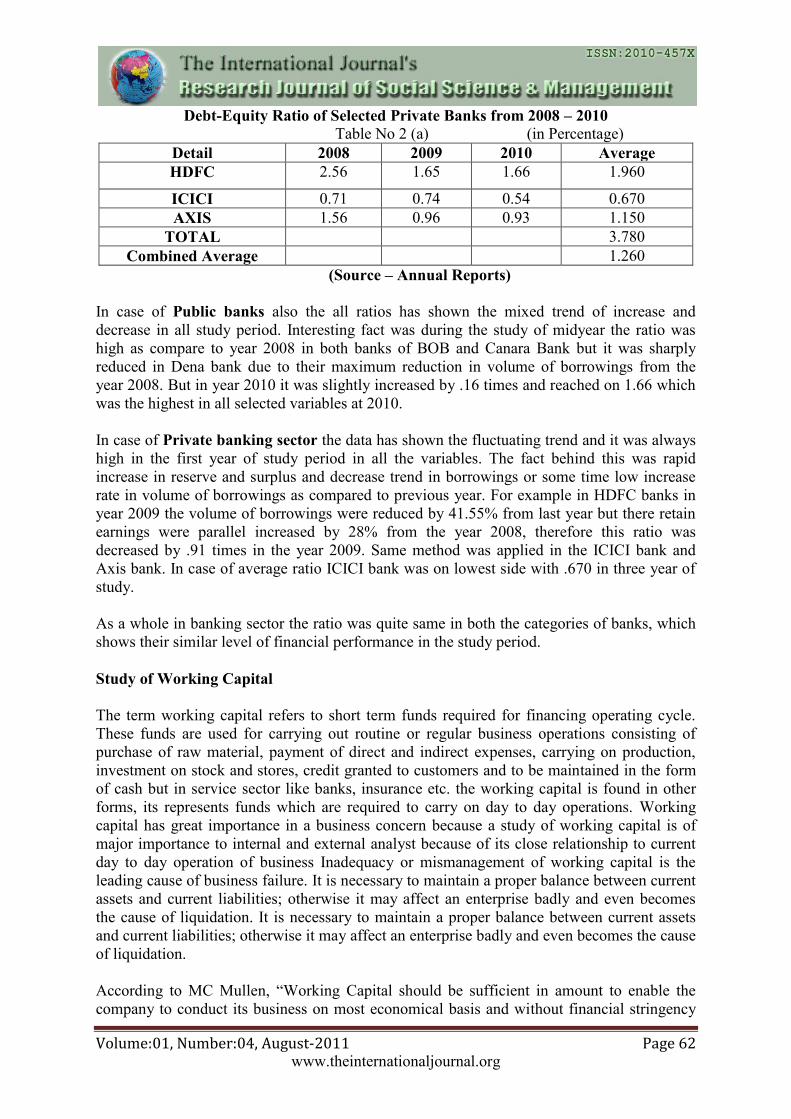
Debt-Equity Ratio of Selected Private Banks from 2008 – 2010
Table No 2 (a) (in Percentage)
Detail 2008 2009 2010 Average
HDFC 2.56 1.65 1.66 1.960
ICICI 0.71 0.74 0.54 0.670
AXIS 1.56 0.96 0.93 1.150
TOTAL 3.780
Combined Average 1.260
(Source – Annual Reports)
In case of Public banks also the all ratios has shown the mixed trend of increase and
decrease in all study period. Interesting fact was during the study of midyear the ratio was
high as compare to year 2008 in both banks of BOB and Canara Bank but it was sharply
reduced in Dena bank due to their maximum reduction in volume of borrowings from the
year 2008. But in year 2010 it was slightly increased by .16 times and reached on 1.66 which
was the highest in all selected variables at 2010.
In case of Private banking sector the data has shown the fluctuating trend and it was always
high in the first year of study period in all the variables. The fact behind this was rapid
increase in reserve and surplus and decrease trend in borrowings or some time low increase
rate in volume of borrowings as compared to previous year. For example in HDFC banks in
year 2009 the volume of borrowings were reduced by 41.55% from last year but there retain
earnings were parallel increased by 28% from the year 2008, therefore this ratio was
decreased by .91 times in the year 2009. Same method was applied in the ICICI bank and
Axis bank. In case of average ratio ICICI bank was on lowest side with .670 in three year of
study.
As a whole in banking sector the ratio was quite same in both the categories of banks, which
shows their similar level of financial performance in the study period.
Study of Working Capital
The term working capital refers to short term funds required for financing operating cycle.
These funds are used for carrying out routine or regular business operations consisting of
purchase of raw material, payment of direct and indirect expenses, carrying on production,
investment on stock and stores, credit granted to customers and to be maintained in the form
of cash but in service sector like banks, insurance etc. the working capital is found in other
forms, its represents funds which are required to carry on day to day operations. Working
capital has great importance in a business concern because a study of working capital is of
major importance to internal and external analyst because of its close relationship to current
day to day operation of business Inadequacy or mismanagement of working capital is the
leading cause of business failure. It is necessary to maintain a proper balance between current
assets and current liabilities; otherwise it may affect an enterprise badly and even becomes
the cause of liquidation. It is necessary to maintain a proper balance between current assets
and current liabilities; otherwise it may affect an enterprise badly and even becomes the cause
of liquidation.
According to MC Mullen, “Working Capital should be sufficient in amount to enable the
company to conduct its business on most economical basis and without financial stringency
Page 7
Volume:01, Number:04, August-2011 Page 63 www.theinternationaljournal.org
and to meet emergencies and losses without danger of financial disaster”.4 The need of
working capital is affected by many factors, viz. nature of business, profit level, taxation,
dividend and reserve policy gestation period, business fluctuation and price level change
availability credit, growth etc.
Working Capital Fund of Selected Public Banks from 2008 – 2010
Table 3 (a) (Rs in Lacks)
Detail 2008 2009 2010 Average
BOB 1400669 2003757 3099828 2168085
CANARA 712365 1417545 1589282 1239731
DENA 241948 351703 394392 329348
TOTAL 2354982 3773005 8633502 4920496
Combined Average 1245721
(Source – Annual Reports)
Working Capital Fund of Selected Private Banks from 2008 – 2010
Table 3 (b) (Rs in Lacks)
Detail 2008 2009 2010 Average
HDFC 286523 114282 1528160 642988
ICICI 1572037 1038375 4258744 2289719
AXIS 773185 881437 1297403 984008
TOTAL 2347971 2034095 7084308 3916716
Combined Average 1305572
(Source – Annual Reports)
In case of Public banking sector all the data has shown consistently increase trend. For
example in BOB it was 43% and 55% in the year 2009 and 2010 respectively from the
previous years. Same story reflected in Canara bank the growth was 98.99% in the mid year
of study period from preceding year, but in last year it was just 12% high from the previous
figure. In case of Dena bank highest growth came into picture in the year 2009 by 45% and in
next year it was 12% high from the figures of previous years. For average point of view in all
selected variables BOB‟s contribution was 44% which was highest and rest banks had 25%
and 6% respectively in Canara Bank and Dena Bank.
The working capital fund of Private banking sector has shown the rapid increase trend in
the year 2010, like it was 248% more from the volume of previous year. The maximum
contributor was HDFC banks, because there working capital was increased more than 1200
times from the year 2009. Secondly it was increased by 310% in ICICI and 48% in Axis
bank. But from average point of view in three year of study period ICICI bank was
dominating with highest volume. It was 71% and 57% more from HDFC and AXIS banks
respectively. The other interesting fact of this table was only in the year 2009 the amount of
working capital fund reduced in both HDFC and ICICI bank. It was 60% down in HDFC and
34% in ICICI bank from the year 2008. On the other side of picture AXIS bank was
consistently gone high but highest growth was 48% in the last year of study period, earlier it
was only 14% from the year 2008.
For whole banking sector point of view the growth were slightly more in Private banks, it
was 4.8% above from Public banks.
Page 8
Volume:01, Number:04, August-2011 Page 64 www.theinternationaljournal.org
Study of Profitability
A company should earn profit to survive and growth a long period of time. Profits are
essential, but it would wrong to assume that every action initiated by management a company
should be aimed at maximizing the profits, of social consequences. It is a fact has sufficient
earned to sustain the operation of the business and able to obtain funds from investors for
expansion and towards the social overheads for the welfare. The word „profitability‟ is
composed of two words profit and ability: on the basis the concept of profitability is defined
as the ability of given investment to earn profit to as earning power or operating performance
of the investment. The dominant motive behind business activities is to earn profit. Lord
Keynes remarked profit is the engine that drives the business enterprises. It is indeed a magic
eye that mirrors all aspects of entire business operations including the quality of output.
Profitability is an important indicator of the efficient management of a business concern. It
reflects the overall efficiency of a concern.
In the present study the following ratios have been used to analyze the profitability of the
private banks under study:
- Net profit ratio
- Operating ratio
Net Profit Ratio
This ratio is an important ratio to judge the profitability of a concern. This ratio establishes a
relationship between net profit and operating revenue and indicates management‟s efficiency.
The ratio is measured by dividing net profit by operating revenue in the present study.
Generally this ratio is expressed in percentage. If the net margin is adequate the firm will fail
to achieve satisfactory return on owner‟s equity. This ratio indicates the firm‟s capacity to
withstand adverse economic conditions. A firm with a high net margin ratio would be in
advantageous position to survive in the fact of falling prices, rising costs or declining demand
for the product or survive. The table shows the net profit of selected variables under study –
Net Profit Ratio of Selected Private Banks from 2008 – 2010
Table No 5 (a) (in Percentage)
Detail 2008 2009 2010 Average
BOB 10.35 12.48 15.68 12.83
CANARA 9.53 10.66 13.98 11.39
DENA 11.41 10.9 11.11 11.14
TOTAL 31.29 34.04 40.77
Combined Average 10.05
(Source – Annual Reports)
Page 9
Volume:01, Number:04, August-2011 Page 65 www.theinternationaljournal.org
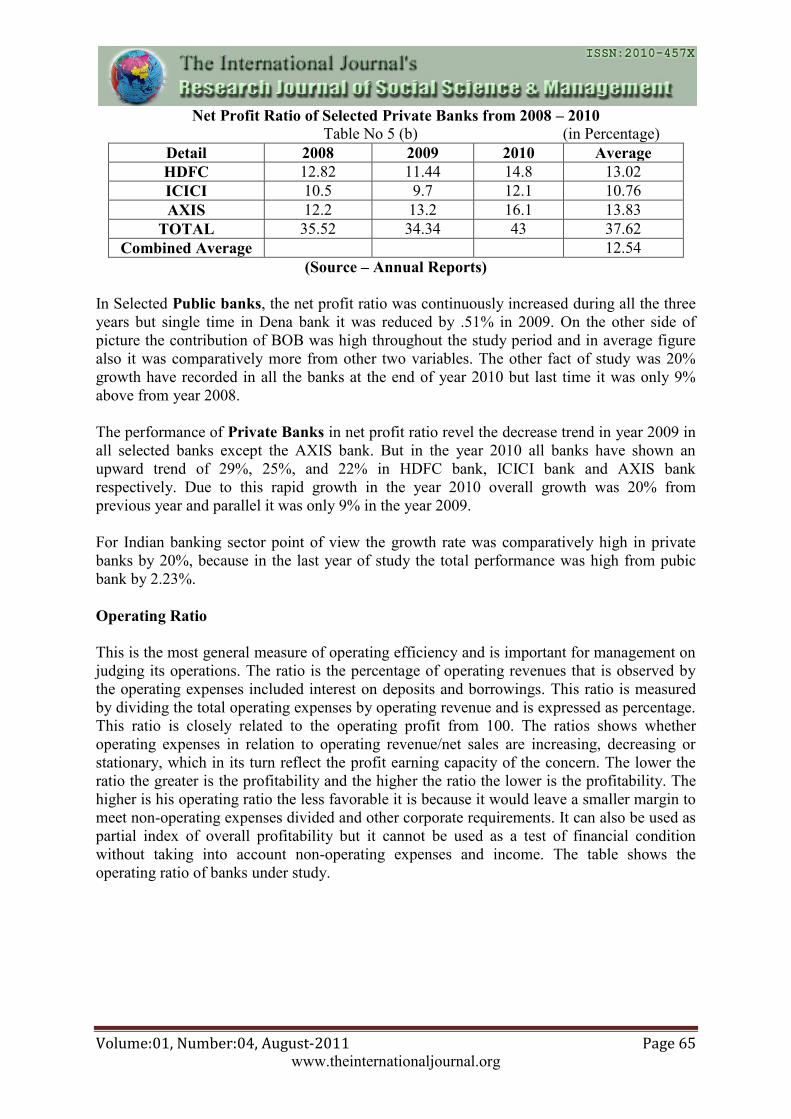
Net Profit Ratio of Selected Private Banks from 2008 – 2010
Table No 5 (b) (in Percentage)
Detail 2008 2009 2010 Average
HDFC 12.82 11.44 14.8 13.02
ICICI 10.5 9.7 12.1 10.76
AXIS 12.2 13.2 16.1 13.83
TOTAL 35.52 34.34 43 37.62
Combined Average 12.54
(Source – Annual Reports)
In Selected Public banks, the net profit ratio was continuously increased during all the three
years but single time in Dena bank it was reduced by .51% in 2009. On the other side of
picture the contribution of BOB was high throughout the study period and in average figure
also it was comparatively more from other two variables. The other fact of study was 20%
growth have recorded in all the banks at the end of year 2010 but last time it was only 9%
above from year 2008.
The performance of Private Banks in net profit ratio revel the decrease trend in year 2009 in
all selected banks except the AXIS bank. But in the year 2010 all banks have shown an
upward trend of 29%, 25%, and 22% in HDFC bank, ICICI bank and AXIS bank
respectively. Due to this rapid growth in the year 2010 overall growth was 20% from
previous year and parallel it was only 9% in the year 2009.
For Indian banking sector point of view the growth rate was comparatively high in private
banks by 20%, because in the last year of study the total performance was high from pubic
bank by 2.23%.
Operating Ratio
This is the most general measure of operating efficiency and is important for management on
judging its operations. The ratio is the percentage of operating revenues that is observed by
the operating expenses included interest on deposits and borrowings. This ratio is measured
by dividing the total operating expenses by operating revenue and is expressed as percentage.
This ratio is closely related to the operating profit from 100. The ratios shows whether
operating expenses in relation to operating revenue/net sales are increasing, decreasing or
stationary, which in its turn reflect the profit earning capacity of the concern. The lower the
ratio the greater is the profitability and the higher the ratio the lower is the profitability. The
higher is his operating ratio the less favorable it is because it would leave a smaller margin to
meet non-operating expenses divided and other corporate requirements. It can also be used as
partial index of overall profitability but it cannot be used as a test of financial condition
without taking into account non-operating expenses and income. The table shows the
operating ratio of banks under study.
Page 10
Volume:01, Number:04, August-2011 Page 66 www.theinternationaljournal.org
Operating Ratio of Selected Public Banks from 2008 – 2010
Table No 5 (a) (in Percentage)
Detail 2008 2009 2010 Average
BOB 21.16 20.03 19.54 20.240
CANARA 17 15.78 16.09 16.290
DENA 20.62 19.8 18.44 19.620
TOTAL 58.78 55.61 54.07 56.15
Combined Average 18.72
(Source – Annual Reports)
Operating Ratio of Selected Private Banks from 2008 – 2010
Table No 5 (b) (in Percentage)
Detail 2008 2009 2010 Average
HDFC 30.2 28.2 28.9 29.100
ICICI 20.6 18.2 17.6 18.800
AXIS 24.5 20.8 23.8 23.033
TOTAL 75.3 67.2 70.3 70.933
Combined Average 23.644
(Source – Annual Reports)
In selected variables of Public banks, the data has shown decline trend in BOB and DENA
Bank, but only one time in year 2010 it was slightly increased by .31% in Canara Bank. The
cause was simply 13% increase in volume of operating expenses in year 2010 from the
previous year. In case of average figures of all variables the ratio of BOB was high as
compared to rest banks; its contribution in overall public banking sector was 36%.
In case of Private Sector banks, the data of operating ratio has shown the fluctuating
trend in all study period, they all were reduced in year 2009 and the highest decrease was
3.7% in AXIS bank from the previous figure. Due to this fact in 2009 the ratio of operating
expenses was also down by 12% in all selected variables. On the other side the figure of
AXIS bank in year 2010 were gone high as compared to other banks because it‟s operating
expenses increased by 30% from the amount of year 2009. For average point of view the
share of HDFC Bank was highest with 29.1% because it was every year more from rest banks
in the study. Parallel in ICICI bank every year it was quite low, therefore in average also it
was 55% and 23% comparatively less from HDFC and AXIS respectively.
As a whole study of banking sector it can be observed that selected variables of public banks
have recorded commendable growth with less operating ratios every year, therefore it was
26% less from private banks in total performance of all study period.
Page 11
Volume:01, Number:04, August-2011 Page 67 www.theinternationaljournal.org
Comparison between Financial Performance of Public Sector Banks and Private Sector
banks through Statistical Analysis –
1. Comparison between Ratios of Own Funds to Total Funds
Levene's
Test for
Equality of
Variances t-test for Equality of Means
F Sig. T df
Sig. (2-
tailed)
Mean
Differen
ce
Std.
Error
Differen
ce
95% Confidence
Interval of the
Difference
Lower Upper
Equal
variances
assumed
1.41
4 .300
-
1.388 4 .237 -2.55467 1.84055
-
7.66486
2.5555
3
Equal
variances not
assumed
-
1.388 3.308 .251 -2.55467 1.84055
-
8.11538
3.0060
5
Since the t value (1.388) is less than the critical value of t (2.132) at 4 degrees of freedom, we
accept our null hypothesis and conclude that there is no significant difference between the
ratios of own funds to total funds of Private Banks and Public Banks for the banks under
study.
2. Comparison between Deb Equity Ratio
Levene's Test for
Equality of
Variances t-test for Equality of Means
F Sig. t df
Sig. (2-
tailed)
Mean
Difference
Std. Error
Difference
Equal
variances
assumed
1.885 .242 .025 4 .981 .01867 .75130
Equal
variances not
assumed
.025 3.205 .982 .01867 .75130
Since the t value (.025) is less than the critical value of t (2.132)( at 4 degrees of freedom, we
accept our null hypothesis and conclude that there is no significant difference between the
Debt-Equity Ratio of Private Banks and Public Banks for the banks under study.
Page 12
Volume:01, Number:04, August-2011 Page 68 www.theinternationaljournal.org
3. Comparison between Working Capital Funds
Levene's
Test for
Equality of
Variances t-test for Equality of Means
F Sig. t df
Sig.
(2-
tailed)
Mean
Differen
ce
Std. Error
Differenc
e
95% Confidence
Interval of the
Difference
Lower Upper
Equal
variances
assumed
10.122 .033 2.411 4 .073 1.26158
E8
5.23203E
7
-
1.91060
E7
2.71423
E8
Equal
variances not
assumed
2.411 2.00
0 .137
1.26158
E8
5.23203E
7
-
9.89132
E7
3.51230
E8
Since the t value (2.411) is more than the critical value of t (2.132) at 4 degrees of freedom,
we reject our null hypothesis and conclude that there is a significant difference between
Working Capital Fund of Private Banks and Public Banks for the banks under study.
4. Comparison between Net Profit Ratio
Levene's
Test for
Equality of
Variances t-test for Equality of Means
F Sig. t df
Sig.
(2-
tailed)
Mean
Differenc
e
Std.
Error
Differenc
e
95% Confidence
Interval of the
Difference
Lower Upper
Equal
variances
assumed
.626 .473 1.633 4 .178 2.49333 1.52660
-
1.7451
9
6.73185
Equal
variances not
assumed
1.633 3.71
2 .183 2.49333 1.52660
-
1.8778
5
6.86451
Since the t value (1.633) is less than the critical value of t (2.132) at 4 degrees of freedom, we
accept our null hypothesis and conclude that there is no significant difference between the
ratios of own funds to total funds of Private Banks and Public Banks for the banks under
study.
Page 13
Volume:01, Number:04, August-2011 Page 69 www.theinternationaljournal.org
5. Comparison between Operating Ratio
Levene's
Test for
Equality of
Variances t-test for Equality of Means
F Sig. t df
Sig.
(2-
tailed)
Mean
Differen
ce
Std. Error
Differenc
e
95% Confidence
Interval of the
Difference
Lower Upper
Equal
variances
assumed
1.621 .272 1.52
5 4 .202 4.92767 3.23086 -4.04265 13.89798
Equal
variances not
assumed
1.52
5 2.655 .236 4.92767 3.23086 -6.15345 16.00879
Since the t value (1.525) is less than the critical value of t (2.132) at 4 degrees of freedom, we
accept our null hypothesis and conclude that there is no significant difference between the
ratios of own funds to total funds of Private Banks and Public Banks for the banks under
study.
Conclusion
Quality of business is always playing a major role in profitability of any sector. Banks
will also have to be more quality conscious in the choice of new assets, particularly in view
of the stricter income-recognition norms. It is necessary to bear in mind that there is no
dearth of loan proposals; the need is only to pragmatically pick-up the viable and profitable
ones. Business that is high-interest yielding and more remunerative will have to be actively
pursued. In view of growing competition in the banking field and limited future prospects in
the current business, it is high time for whole banking sector to diversify into new areas like
leasing and hire-purchase, factoring, consumer financing, merchant banking advisory
services to expand their business and improve their profitability. In highly competitive
environment the role of customer service in improving productivity and profitability in
banking cannot be over-emphasized. To improve customer service up-to-date knowledge and
impeccable commitment to excellence and right communication skills are the pre-requisites
for effective customer services. This has to be supplemented adequately by technology for
improving quality of services to customers.
Productivity of a bank is contingent essentially upon the general attitude of the
employees towards value of work as a fruitful contribution to society needs to be
rediscovered. Only a thorough soul-searching can bring change in the attitude. Developing a
sense of belongingness to the organization, making personnel matter like promotions,
transfers, etc. transparent and introduction of performance based rewards will go a long way
in developing work culture among the employees. Every bank has to develop cost and
profitability consciousness among the employees. Profit should be made the driver and this
message should be spread effectively to the rank and file.
Page 14
Volume:01, Number:04, August-2011 Page 70 www.theinternationaljournal.org
References –
1) Annual reports of all studied banks (2007-08, 2008-09 and 2009-10)
2) Bidani S.N., (2002), “Managing Non-Performing Assets in Banks”, Vision Books
publishers, pp.71-74.
3) Johan E.Mckinley & John. R. Barrickman, (1994), “Strategic Credit Risk Management”,
Robert Morris Association, Philadelphia, pp. 1-12, 20-27, 36-42, 62-68.
4) Timothy W. Koch, (1998), “Bank Management - Overview of credit policy and loan
characteristics”, Third Edition, The Dryden Press, Harcourt Brace College Publishers, pp.
431-440 and 629-630
5) Agarwal P. & Srikanth V (2002), “A question of Reliability”, Economic Times, July 24,
2002.
6) Banking Bureau, (2002), “RBI Reports finds increase in NPAs of Commercial Banks”,
The Financial Express, November 16, 2000.
7) Basel Committee on Banking Supervision, (2003), “Third Quantitative Impact Survey –
An Overview”, IBA Bulletin, February 2003, pp. 6
8) Narasimhan N., (2003), “Banking sledge hammers for NPA Files”, Professional Bankers,
March 2003, pp. 25-27.
9) Murthy E.N., (2002), “Managing Credit Risk”, ICFAI Reader, Vol.2, February 2002, pp.
3