The author(s) shown below used Federal funds provided by the U.S. Department of Justice and prepared the following final report: Document Title: Financial Exploitation of the Elderly in a Consumer Context Author(s): Kristy Holtfreter, Ph.D., Michael D. Reisig, Ph.D., Daniel P. Mears, Ph.D., Scott E. Wolfe, Ph.D. Document No.: 245388 Date Received: March 2014 Award Number: 2010-IJ-CX-0008 This report has not been published by the U.S. Department of Justice. To provide better customer service, NCJRS has made this Federally- funded grant report available electronically. Opinions or points of view expressed are those of the author(s) and do not necessarily reflect the official position or policies of the U.S. Department of Justice.
Transcript
The author(s) shown below used Federal funds provided by the U.S. Department of Justice and prepared the following final report: Document Title: Financial Exploitation of the Elderly in a
Consumer Context Author(s): Kristy Holtfreter, Ph.D., Michael D. Reisig, Ph.D.,
Daniel P. Mears, Ph.D., Scott E. Wolfe, Ph.D. Document No.: 245388 Date Received: March 2014 Award Number: 2010-IJ-CX-0008 This report has not been published by the U.S. Department of Justice. To provide better customer service, NCJRS has made this Federally-funded grant report available electronically.
Opinions or points of view expressed are those of the author(s) and do not necessarily reflect
the official position or policies of the U.S. Department of Justice.
FINAL REPORT:
Financial Exploitation of the Elderly in a Consumer Context*
Kristy Holtfreter, Ph.D.
School of Criminology and Criminal Justice
Arizona State University
Phoenix, Arizona
Michael D. Reisig, Ph.D.
School of Criminology and Criminal Justice
Arizona State University
Phoenix, Arizona
Daniel P. Mears, Ph.D.
College of Criminology and Criminal Justice
Florida State University
Tallahassee, Florida
Scott E. Wolfe, Ph.D.
Department of Criminology and Criminal Justice
University of South Carolina
Columbia, South Carolina
*This project was supported by Award No. 2010-IJ-CX-0008, awarded by the National Institute
of Justice, Office of Justice Programs, U.S. Department of Justice. The opinions, findings,
conclusions, or recommendations expressed in this publication are those of the author(s) and do
not necessarily reflect those of the Department of Justice. The authors thank Jill Turanovic for
her editorial assistance.
This document is a research report submitted to the U.S. Department of Justice. This report has not been published by the Department. Opinions or points of view expressed are those of the author(s)
and do not necessarily reflect the official position or policies of the U.S. Department of Justice.
2
ABSTRACT
Research Goals and Objectives
Statement of Purpose. The goal of this research was to provide researchers, practitioners,
and policy makers with an empirically-based understanding of financial exploitation of elderly
consumers. This study focused on Arizona and Florida, two states with significantly higher
proportions of older residents. This study sought to identify risk and protective factors for fraud
victimization and to evaluate the elderly’s awareness and use of state-based programs.
Research Subjects. This study included telephone interviews of 1000 Arizonians and
1000 Floridians age 60 and over. The study was approved by the
Institutional Review Boards (IRB) of two universities. Informed consent was established during
the interview and first included the completion of a screen for cognitive impairment because
cognitively impaired individuals cannot give consent. The sample is 37% male with an average
age of 72, 94% white, 92% with a high-school diploma or more, and 61% married.
Research Design and Methodology
Methods. During the period of June 27, 2011-July 27, 2011, a CATI survey was
conducted with 1000 Arizona citizens over 60 and 1000 Florida citizens over 60.
Research Results and Conclusions
Data Analyses. Descriptive, bivariate, and multivariate analyses were performed to
address the study’s goals and objectives.
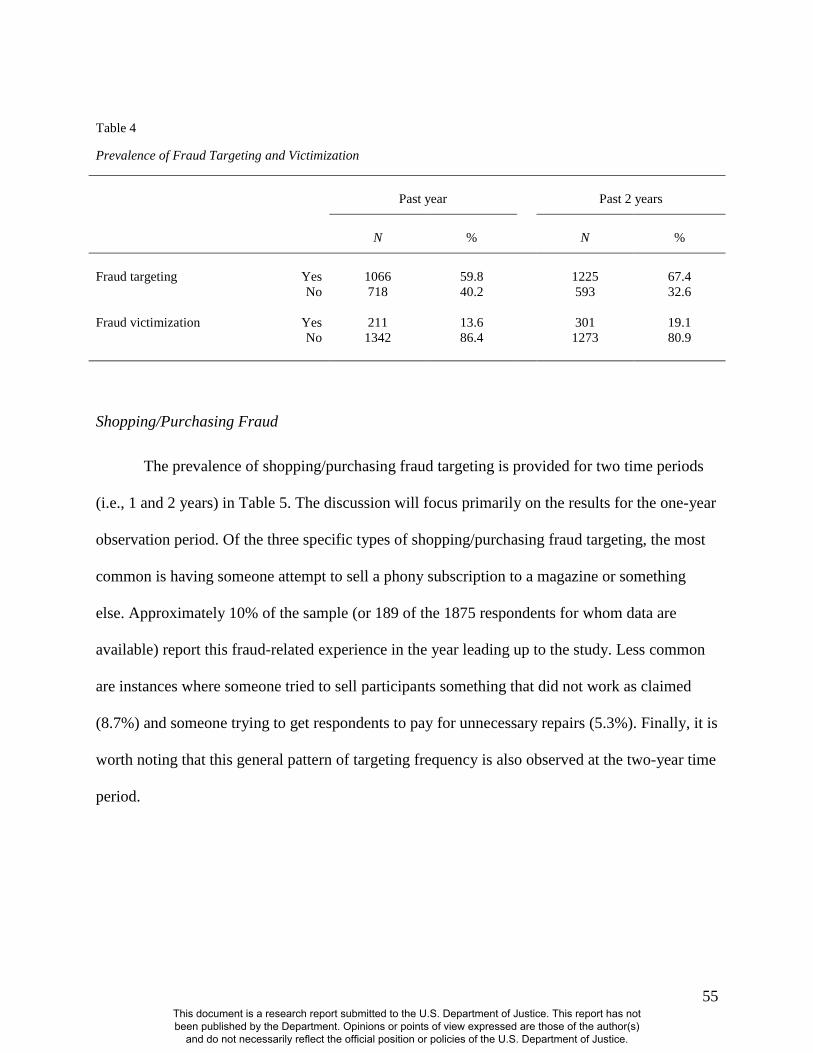
Results. The study revealed that nearly 6 of every 10 participants were targeted by a fraud
attempt in the year prior to the study. Approximately 14% of the full sample was a fraud victim
within the past year. The prevalence of victimization was greater among targeted adults (25%).
The most common form of shopping/purchasing fraud targeting was having someone attempt to
sell a phony subscript to a magazine or something else. The most common type of financial fraud
This document is a research report submitted to the U.S. Department of Justice. This report has not been published by the Department. Opinions or points of view expressed are those of the author(s)
and do not necessarily reflect the official position or policies of the U.S. Department of Justice.
3
targeting in the past year was having someone attempt to trick an individual into providing
personal financial information (16%). Financial fraud victimization of any type was rare (.8%).
The most common types of other consumer fraud targeting involved phony prize scams (24%
past year prevalence) and contributing to phony charities (22%). Past year prevalence of
financial mistreatment was 5.6%, and the most common type of financial mistreatment was
having money or belongings stolen (3.4%). Being male, remote purchasing, low self-control,
education, and telemarketing purchases increased targeting. Remote purchasing, low self-control,
being older, and minority status increased fraud victimization. Routine activities were associated
with financial fraud victimization. Most respondents were not familiar with their state’s
programs. Greater monetary losses were associated with victim reporting.
This document is a research report submitted to the U.S. Department of Justice. This report has not been published by the Department. Opinions or points of view expressed are those of the author(s)
and do not necessarily reflect the official position or policies of the U.S. Department of Justice.
This document is a research report submitted to the U.S. Department of Justice. This report has not been published by the Department. Opinions or points of view expressed are those of the author(s)
and do not necessarily reflect the official position or policies of the U.S. Department of Justice.
5
DISSEMINATION OF RESEARCH FINDINGS.......................................................... 140
APPENDIX A: The Nature and Prevalence Of Physical Mistreatment ........................ 142
APPENDIX B: Fraud Targeting State Subsample Analyses ......................................... 147
This document is a research report submitted to the U.S. Department of Justice. This report has not been published by the Department. Opinions or points of view expressed are those of the author(s)
and do not necessarily reflect the official position or policies of the U.S. Department of Justice.
6
EXECUTIVE SUMMARY
Problem
Despite increased concerns about fraudulent activities that target the elderly—evidenced
in all 50 states having enacted elder abuse statutes in recent decades—little remains known about
the prevalence of such fraud, the factors that give rise to it, or the effectiveness of efforts aimed
at reducing it. Without information along each of these dimensions, it is difficult to develop and
implement evidence-based policies aimed at preventing and reducing elderly fraud victimization.
This problem assumes greater importance given the “graying” of the American population.
Purpose
The study’s goals were to provide policymakers, practitioners, and researchers with a
greater, empirically-based understanding of the distribution and causes of, as well as solutions to,
financial exploitation of the elderly in a consumer context. To achieve this goal, the study
focused on two states, Arizona and Florida, that have significantly higher proportions of citizens
age 60 and older and that, under the leadership of the two states’ attorneys general, have
undertaken elderly crime prevention initiatives. The study’s three specific objectives were: (1)
To determine the nature, incidence, and prevalence of fraud victimization among elderly
consumers in Arizona and Florida; (2) To identify risk and protective factors associated with
fraud victimization in this population; and (3) To evaluate the elderly population’s awareness
and use of state-based programs, including reporting behavior to law enforcement.
Research Design
The 2-year study consisted of a computer-assisted telephone interview (CATI) survey,
conducted from June 27, 2011 to July 27, 2011, of 1,000 Arizonians and 1,000 Floridians over
This document is a research report submitted to the U.S. Department of Justice. This report has not been published by the Department. Opinions or points of view expressed are those of the author(s)
and do not necessarily reflect the official position or policies of the U.S. Department of Justice.
7
the age of 60. This age cut-off was consistent with that used by governmental agencies such as
the Administration on Aging (AOA) and the U.S. Census Bureau to define the senior population,
with the extant literature on elderly victimization, and with the National Institute of Justice’s
(NIJ) focus in its solicitation on elderly abuse and exploitation. Prior to undertaking the study,
the researchers submitted the research protocol to institutional review boards at Arizona State
University (ASU) and Florida State University (FSU), and obtained approval to proceed.
Survey questions focused broadly on shopping/purchasing fraud, financial fraud, and
other types of financial fraud. They also focused on awareness of efforts to increase
understanding about such fraud and steps to prevent it. The survey included a range of other
questions on the social and demographic characteristics of the participants, as well as factors that
might contribute to an increased risk of victimization. Not least, for purposes of comparison
with prior research, the study included a measure of financial mistreatment (e.g., having
someone spend money that is yours or forged your signature) that previously has been used in
studies of financial exploitation.
The sampling and screening procedures resulted in 4,130 total eligible interviewees that
were contacted during data collection. This value includes the total number of people who self-
identified as 60 years or older who completed the interview (N = 2,000), refused to participate (N
= 1,716), or partially completed the interview (N = 414). Individuals who were classified as
impaired or who failed the cognitive screener were excluded from this value because they are not
eligible respondents. The response rate was 48.4%, which is comparable to the response rate in
similar studies, and the completion rate was 82.9%, which is significantly higher than the 67.2%
average in other telephone surveys.
To address the study’s goals and objectives, descriptive, bivariate, and multivariate
analyses were undertaken. Similar response pattern imputation (SRPI) was used to impute
This document is a research report submitted to the U.S. Department of Justice. This report has not been published by the Department. Opinions or points of view expressed are those of the author(s)
and do not necessarily reflect the official position or policies of the U.S. Department of Justice.
8
missing values in the data. Missing values could not be imputed for 90 individuals so they were
excluded from the analysis. Analyses indicated that the social and demographic characteristics
of the sample were largely similar to those of the populations from which they were derived.
Findings
The study analyses generated a wide range of results that reflected the following general
areas of investigation: the nature and prevalence of consumer fraud targeting and victimization;
the nature and prevalence of financial mistreatment; fraud targeting and victimization across
demographic groups; multivariate analyses of fraud targeting; multivariate analyses of financial
mistreatment; crime program familiarity and contact; and reporting of consumer fraud
victimization and financial mistreatment. Select findings from each of these sets of analyses are
presented below. These serve to illustrate the range of analyses undertaken and the types of
findings available in the full report. The salience of any given finding, whether those included
here or in the report, ultimately depends of course on the particular focus or perspective taken for
a given research study or policy discussion.
The Nature and Prevalence of Consumer Fraud Targeting and Victimization
Nearly six out of every 10 respondents were targeted by a fraud attempt during the year
prior to the study, and two-thirds of respondents were targeted by a fraud attempt during the two
years prior to the study. Fraud targeting thus is more common in this sample of elderly people
compared to samples of adults 18 years of age and older where, for example, past-year
prevalence estimates have been shown to range from 15% to 31%.
This document is a research report submitted to the U.S. Department of Justice. This report has not been published by the Department. Opinions or points of view expressed are those of the author(s)
and do not necessarily reflect the official position or policies of the U.S. Department of Justice.
9
Approximately 14% of the sample was a fraud victim during the past year and 19% was
a victim during the two years prior to the survey. These estimates are similar to fraud
victimization prevalence estimates observed in other national samples of adults.
Among individuals who were targeted by fraud attempts, the prevalence of fraud
victimization was greater. For example, among such individuals, the past year prevalence of
fraud victimization was 25 %.
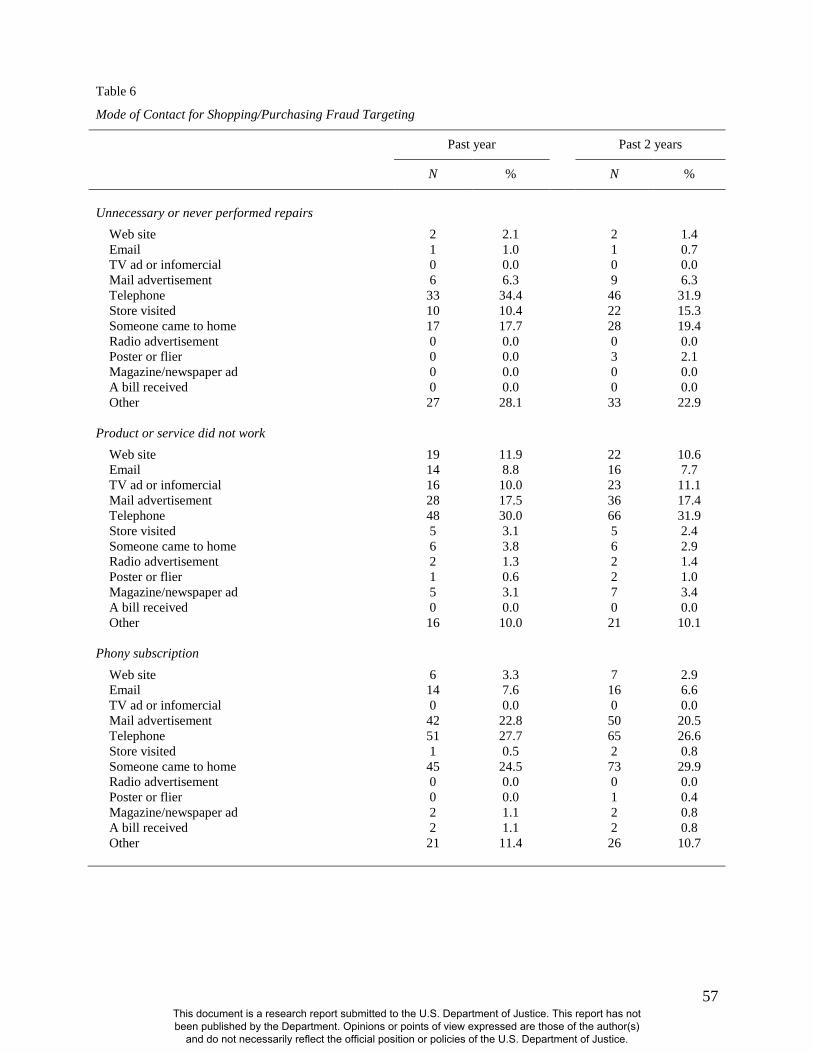
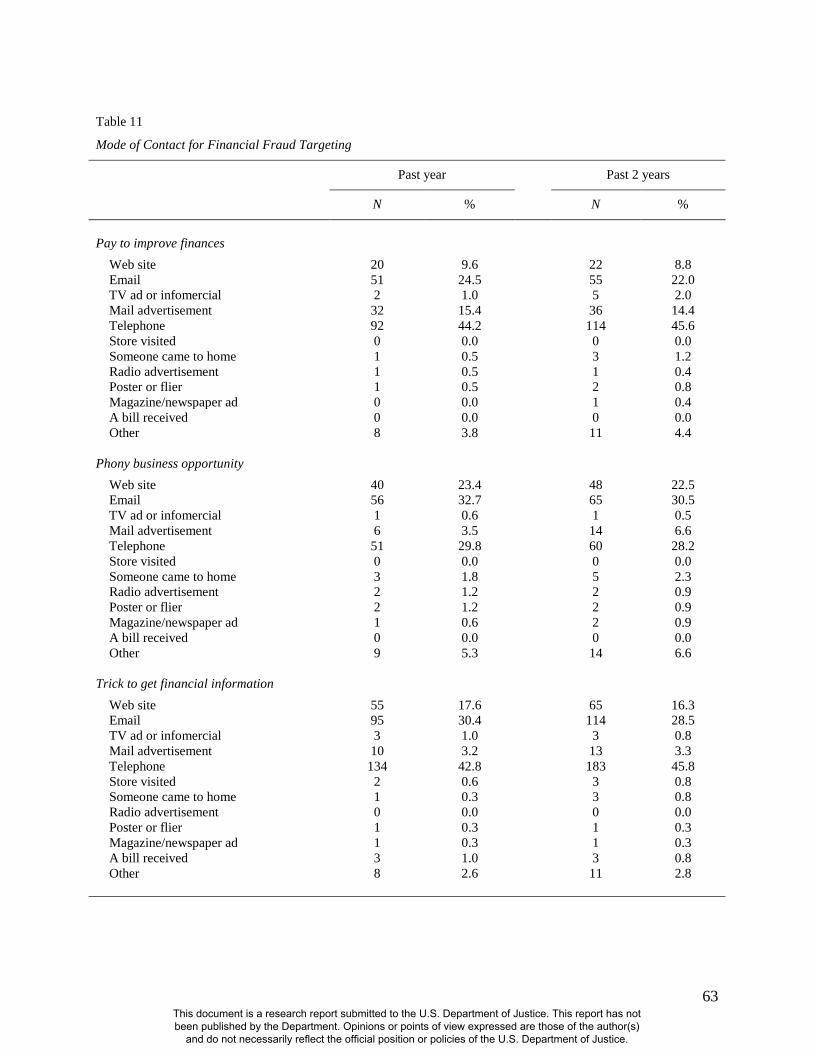
The most common type of shopping/purchasing fraud targeting was having someone
attempt to sell a phony subscription to a magazine or something else. Approximately 10% of the
sample reported such targeting in the year prior to the survey. Telephone contact was the
primary mode through which such targeting occurred, but other modes, such as mail
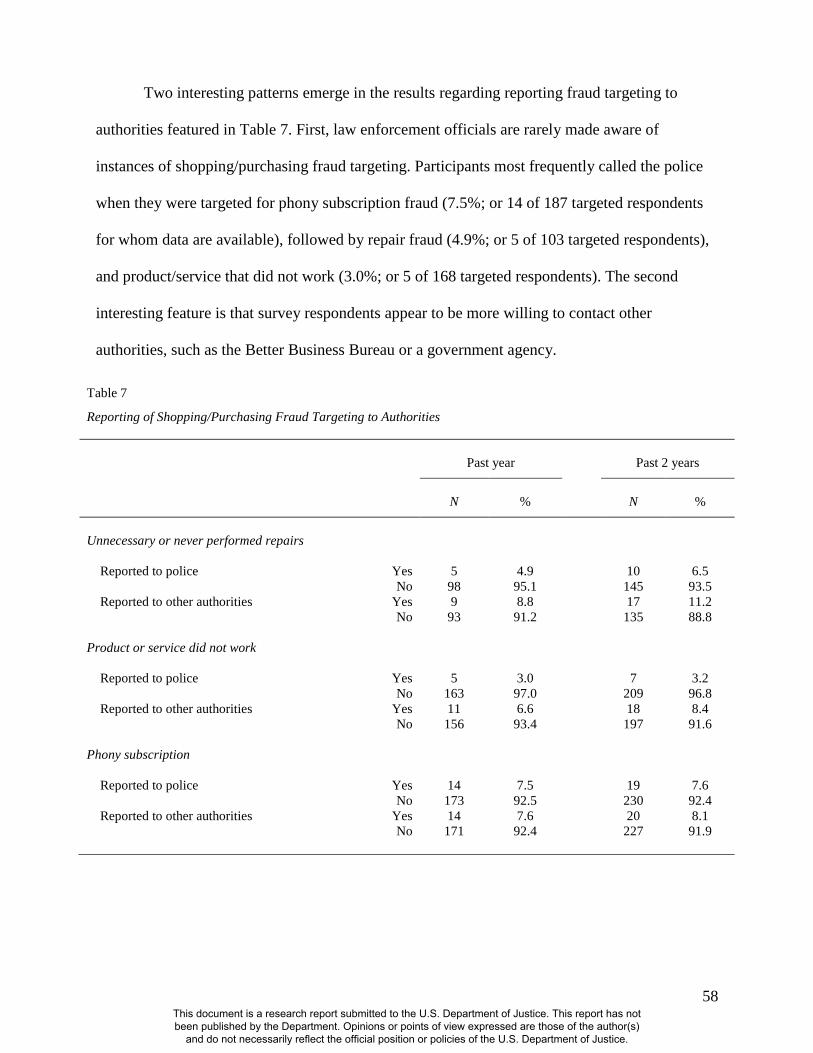
advertisements and in-person solicitations, were common. Law enforcement officials are rarely
made aware of instances of shopping/purchasing fraud targeting. The most common form of
shopping/purchasing fraud involves paying for a product or service that does not work as
promised. Such victimization was reported by 3.5% of the sample. The median dollar loss past-
year fraud victimization was $225 for repair fraud, $67 for product/service fraud, and $30 for
phony subscription fraud.
The most common type of financial fraud targeting was having someone attempt to
trick an individual into providing personal financial information. Over 16% of the sample
reported being targeted in this way during the year prior to the study. Telephone contact again
was the primary mode through which targeting occurred. Contact by way of email (30.4%) and
web sites (17.6%) were also relatively common for attempts to get participants to provide
personal financial information to unknown individuals. Respondents who were targeted for
financial fraud typically did not report the offenses to the police. Financial fraud victimization of
any type was rare. The most frequently reported form of financial fraud victimization was being
This document is a research report submitted to the U.S. Department of Justice. This report has not been published by the Department. Opinions or points of view expressed are those of the author(s)
and do not necessarily reflect the official position or policies of the U.S. Department of Justice.
10
tricked into giving one’s personal financial information to an unknown person (0.8%). The
median dollar loss was highest for investing in a phony business ($6,248), followed by paying
someone to improve finances ($580). The lowest median dollar loss was incurred by victims
who were tricked into providing their financial information ($38). The prevalence of financial
fraud victimization was greater among those who were targeted for such fraud.
The most common types of other consumer fraud targeting were attempts to get
individuals to pay to claim a phony prize (24% past-year prevalence) and contribute money to a
phony charity or religious organization (22% past-year prevalence). Contact by telephone, mail,
and e-mail were the primary modes of targeting. Such instances were, again, rarely reported to
law enforcement. However, when individuals had someone try to steal their personal
information, 25% contacted law enforcement. The median dollar loss, for past-year
victimization, between each type of consumer fraud varied from $20 (contributing to a phony
charity or religious organization) to $700 (paying to reduce mortgage payments). The median
dollar loss associated with being a victim of a phony prize scam was $219, and $200 for
victimization relating to having personal information stolen. As with the other types of fraud,
targeted individuals were more likely to report actual victimization.
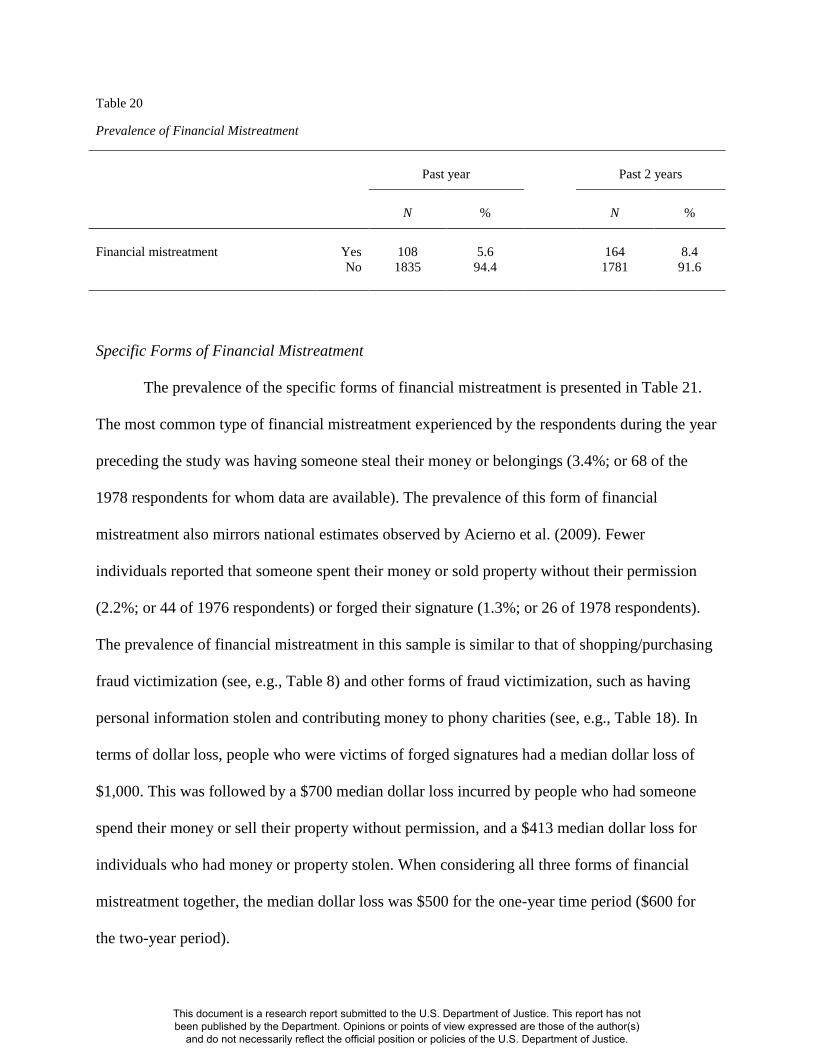
The Nature and Prevalence of Financial Mistreatment
The overall prevalence of financial mistreatment in the sample during the year leading
up to the study was 5.6% and 8.4% during the two years leading up to the study. These findings
are nearly identical to the prevalence of financial mistreatment estimated in other studies.
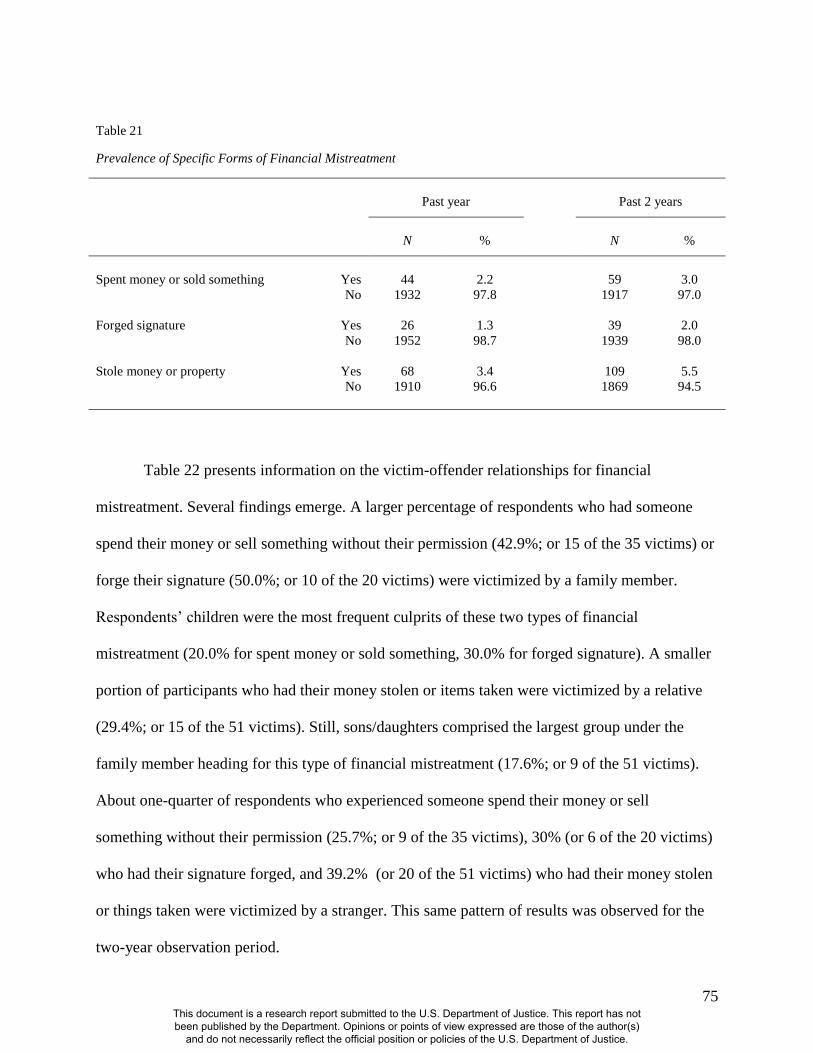
The most common type of financial mistreatment experienced by the respondents
during the year preceding the study was having someone steal their money or belongings (3.4%).
Fewer individuals reported that someone spent their money or sold property without their
This document is a research report submitted to the U.S. Department of Justice. This report has not been published by the Department. Opinions or points of view expressed are those of the author(s)
and do not necessarily reflect the official position or policies of the U.S. Department of Justice.
11
permission (2.2%) or forged their signature (1.3%). These estimates are similar to that of
reported shopping/purchasing and other fraud victimization found in this study.
A larger percentage of respondents who had someone spend their money or sell
something without their permission were victimized by a family member. Respondents’ children
were the most frequent culprits of these two types of financial mistreatment. A smaller portion
of participants who had their money stolen or items taken were victimized by a relative.
About one-quarter of individuals (27%) who indicated someone spent their money or
sold their property without permission reported the offense to the police. A higher percentage of
individuals who had their money or property stolen reported their victimization to law
enforcement (40%).
Fraud Targeting and Victimization across Demographic Groups
Fraud targeting is least common among those who are 80 or more years old. Less than
half of these individuals (49.6%) indicated that they had been targeted. By contrast, over 60
percent of other respondents reported being targeted. Males reported being targeted more
frequently than females (65.4% versus 56.4%, respectively). In general, education was weakly
associated with fraud targeting. No differences in fraud targeting were observed across racial
and ethnic minorities. However, racial minorities and retired individuals were slightly more
likely to report that they had been the victims of consumer fraud during the year leading up to the
study as compared to their counterparts. No differences in fraud victimization were observed
across other demographic groups.
Among individuals who were targeted for fraud, those who were over age 72 or were
racial minorities were more likely to experience fraud victimization. Targeted racial minorities
also were more likely to report victimization (38.6% versus 24.1%, respectively).
This document is a research report submitted to the U.S. Department of Justice. This report has not been published by the Department. Opinions or points of view expressed are those of the author(s)
and do not necessarily reflect the official position or policies of the U.S. Department of Justice.
12
The pattern of results was similar for financial mistreatment.
A Multivariate Assessment of Fraud Targeting
In analyses in which fraud targeting was the outcome being predicted, the results
showed that the following factors were positively associated with targeting: remote purchasing
(including engaging in a greater variety of such purchasing), having low self-control, being male,
and having higher levels of education. Making a telemarketing purchase substantially increased
targeting. Respondents who purchased something in response to a telemarketing call from a
company with whom they had not previously done business during the previous year increased
their risk of becoming a fraud target by over 200% compared to those who had not made such
purchases. Some variation in the effect of some of the predictors varied by type of fraud.
The effect of telemarketing purchases appear limited to two types of targeting—
shopping fraud and financial fraud. Respondents who placed an order for a product after seeing
an infomercial also increased their odds of being targeted for shopping fraud. Participants who
made online purchases had higher odds of targeting for financial fraud, charity scams, and prize
notification fraud.
Some demographic variables were correlated with specific forms of targeting. For
example, younger participants were more likely to report being targeted for financial fraud and
prize notification fraud, and males were more often the targets of financial fraud, charity scams,
and prize notification fraud.
A Multivariate Assessment of Fraud Victimization
In analyses in which fraud victimization was the outcome being predicted, the results
showed that the following factors were positively associated with victimization: remote
This document is a research report submitted to the U.S. Department of Justice. This report has not been published by the Department. Opinions or points of view expressed are those of the author(s)
and do not necessarily reflect the official position or policies of the U.S. Department of Justice.
13
purchasing (including engaging in a greater variety of such purchasing), having low self-control,
being older, and being a member of a racial minority. Here, again, some variation in the effect of
some of the predictors varied by type of fraud.
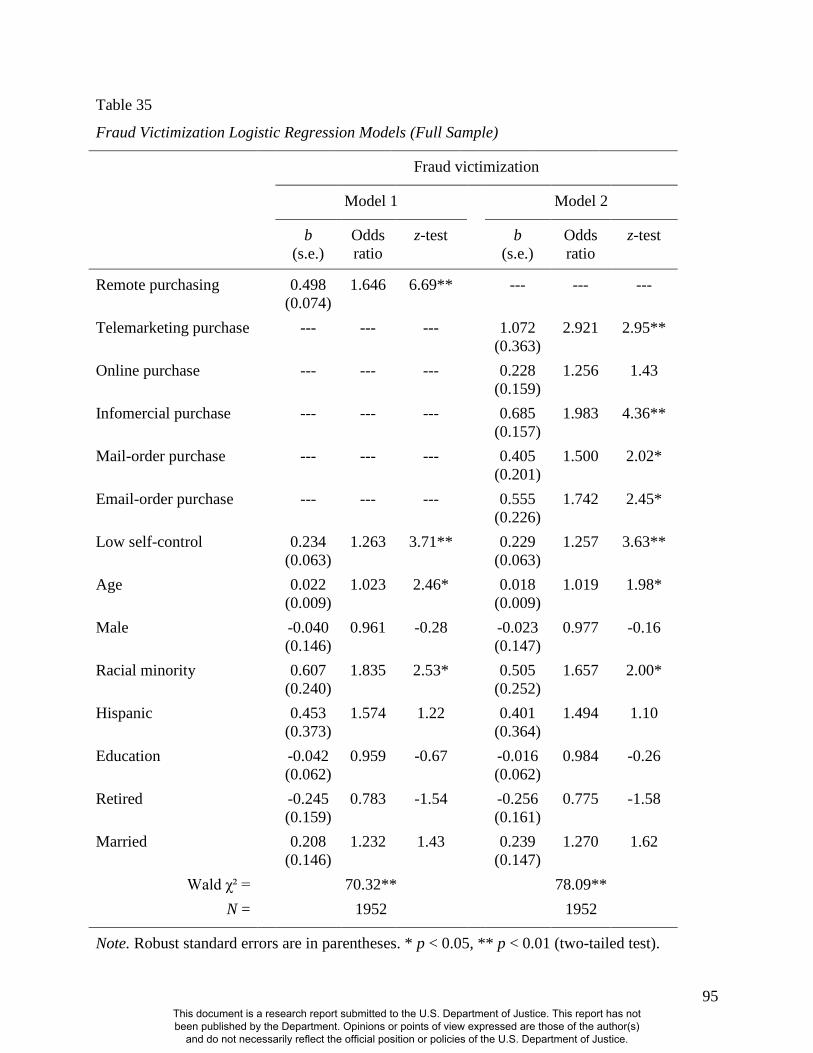
Remote purchasing is significantly associated with each form of fraud victimization,
including shopping/purchasing fraud, financial fraud, charity scam fraud, and identity theft.
The impact of telemarketing purchase is largely restricted to financial fraud
victimization; individuals who made a telemarketing purchase with a company they had not
previously done business with during the past year increased their odds of financial fraud
victimization by over 600 percent.
The risk of shopping fraud victimization was elevated among respondents who
purchased products after viewing infomercials and receiving mail solicitations from companies
with whom they had not previously done business. The risk of identity theft was elevated when
respondents made purchases resulting from unsolicited email.
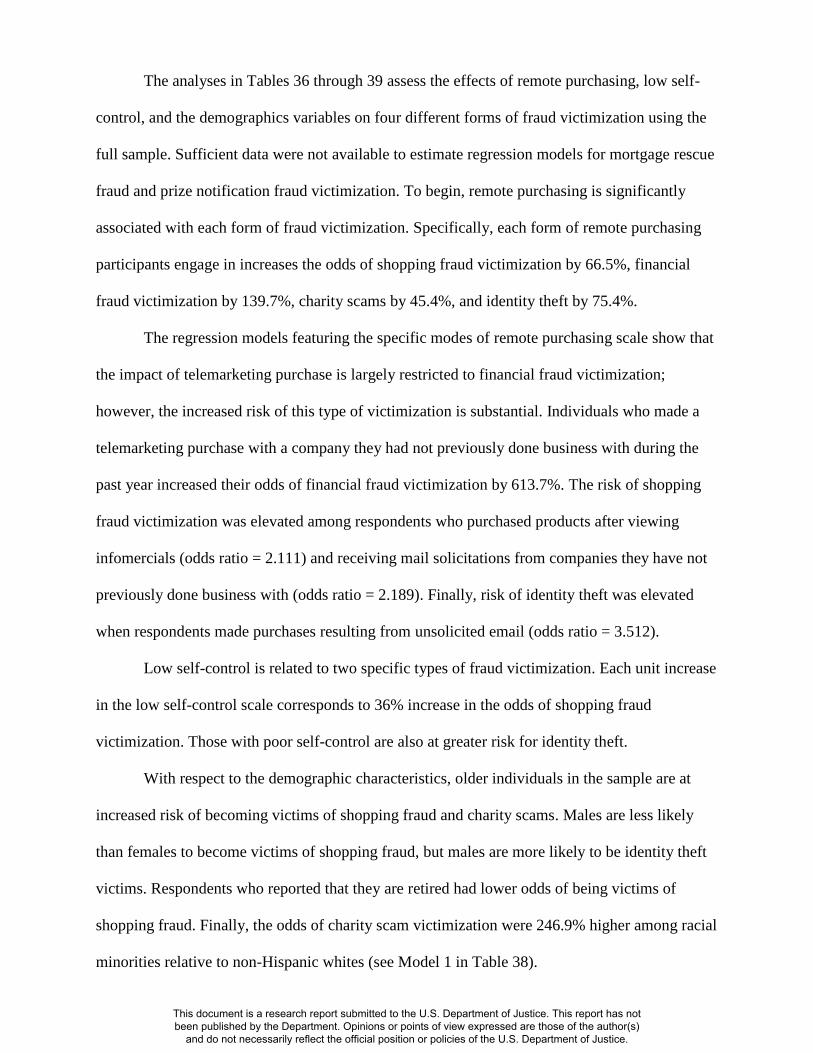
In analyses that focused only on those individuals who were targeted for fraud, similar
analyses showed similar results, with remote purchasing, low self-control, and being older all
associated with an increased likelihood of victimization. The effects of telemarketing and
several other factors varied across type of victimization. Similarly, the effect of low self-control
was only significant in the shopping fraud victimization model. Analyses aimed at addressing
selection effects associated with belonging to the group who was targeted for victimization
identified similar effects.
This document is a research report submitted to the U.S. Department of Justice. This report has not been published by the Department. Opinions or points of view expressed are those of the author(s)
and do not necessarily reflect the official position or policies of the U.S. Department of Justice.
14
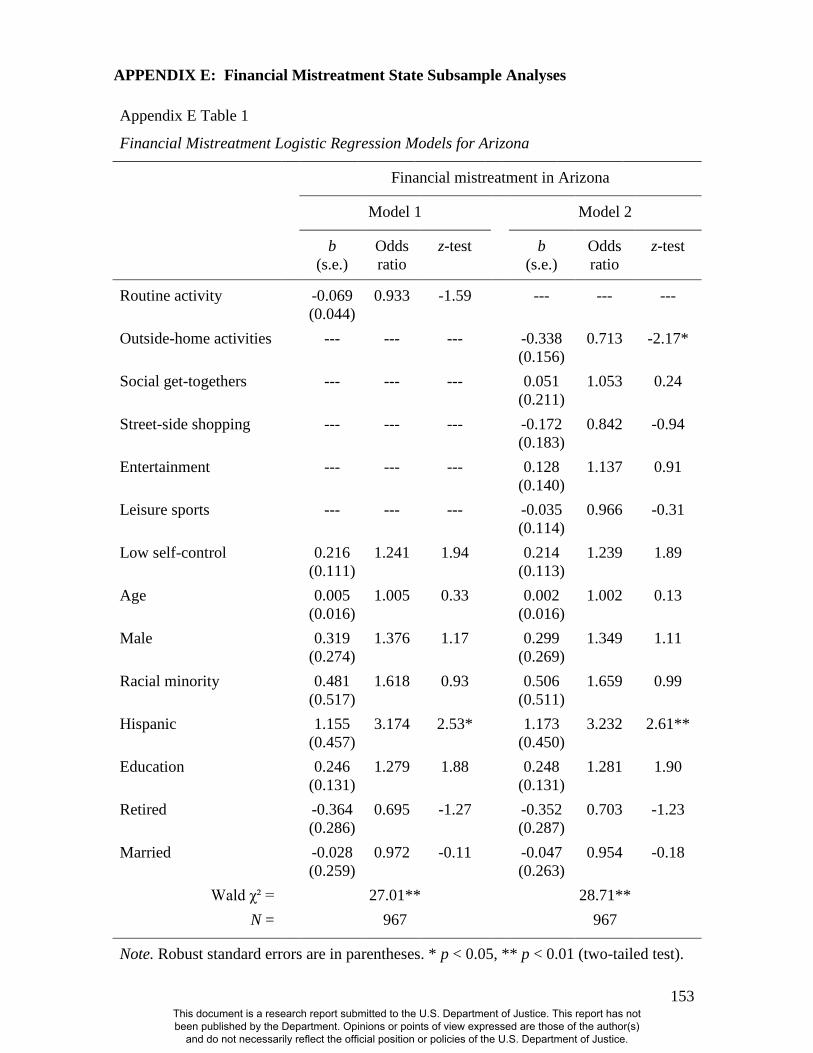
A Multivariate Assessment of Financial Mistreatment
In analyses in which financial mistreatment was the outcome being predicted, the
results showed that the following factors were positively associated with victimization:
adherence to fewer routine activities (e.g., participating in social activities away from home,
getting together with people who do not live with you, going to the movies), low self-control,
being male, and belong to a racial minority. Once, again, some variation in the effect of some of
the predictors varied by type of fraud.
Additional analyses showed that the effect of routine activity is isolated to one type of
financial mistreatment—failing to engage in routine activities increases the likelihood of being
having money or property stolen.
Two specific routine activities contributed to the observed effects: (1) the frequency
with which respondents got together socially with friends, family, and neighbors, and (2)
outside-the-home social activity.
Program Familiarity and Contact
The study examined respondents’ familiarity with Arizona- and Florida-based programs
that have been designed to help elderly citizens prevent and cope with criminal victimization.
Arizona participants were asked how familiar they are (closed-ended responses include “very
familiar,” “somewhat familiar,” and “not familiar”) with the Agency on Aging and the Senior
Sleuths project. Floridians who were interviewed were asked about their level of familiarity with
the Seniors vs. Crime Program and their state’s Senior Sleuths project.
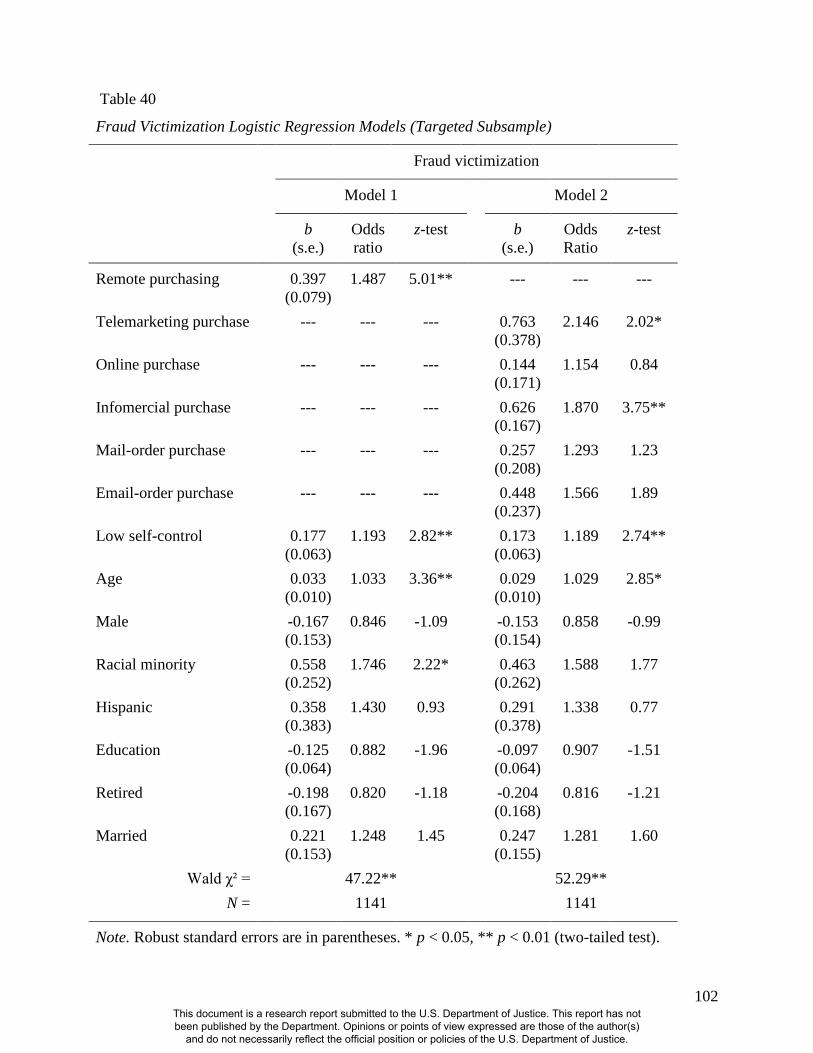
Most respondents were not familiar with their state’s programs. Nearly 70% of Arizona
participants were “not familiar” with the Agency on Aging. In Florida, 87% of respondents
reported they were “not familiar” with the Florida’s Seniors vs. Crime Program.
This document is a research report submitted to the U.S. Department of Justice. This report has not been published by the Department. Opinions or points of view expressed are those of the author(s)
and do not necessarily reflect the official position or policies of the U.S. Department of Justice.
15
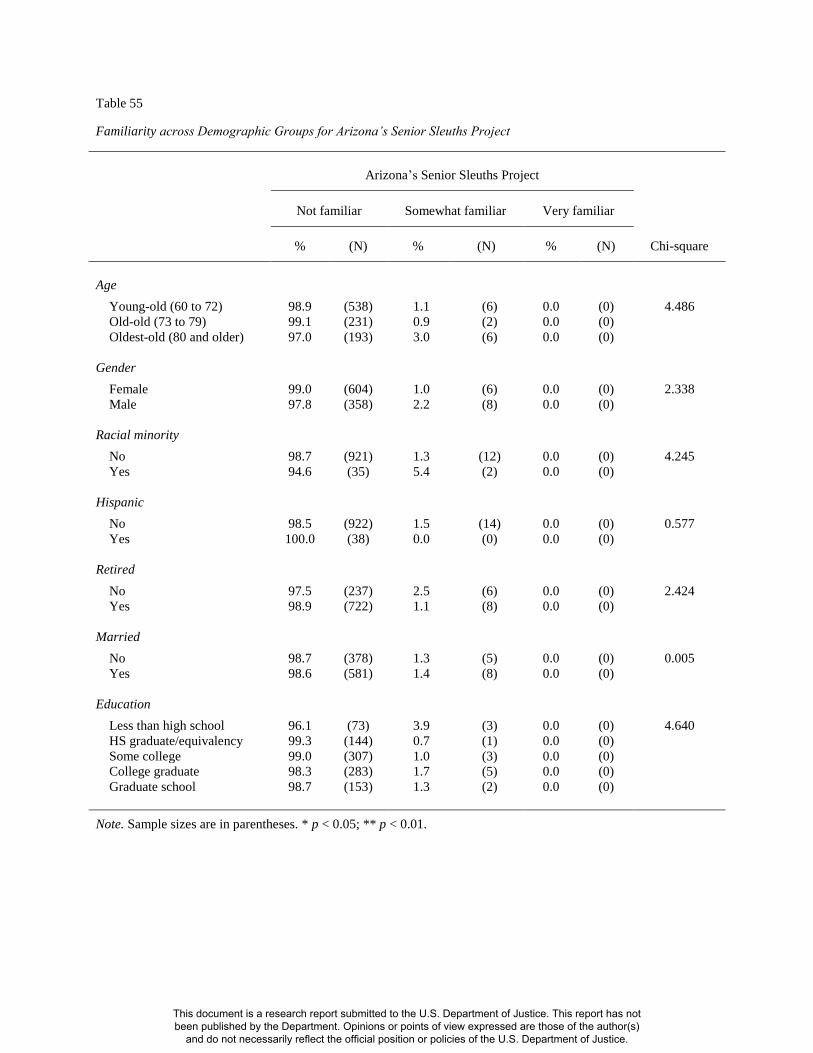
The Senior Sleuths projects in both states were not well known by the survey
respondents. Over 97 percent of respondents in both states reported that they were “not familiar”
with the Seniors Sleuths project.
In analyses that focused on subjects who did express some familiarity with the available
programs, friends or family members, newspapers, television, and “word of mouth” were the
most common sources identified as first teaching the subjects about the programs.
In Arizona, only a small portion of respondents who were aware of the Agency on
Aging contacted them in the year leading up to the interview (8.4%). Only one participant from
Arizona reported contacting the Senior Sleuths project. A similar pattern of results emerged for
Florida.
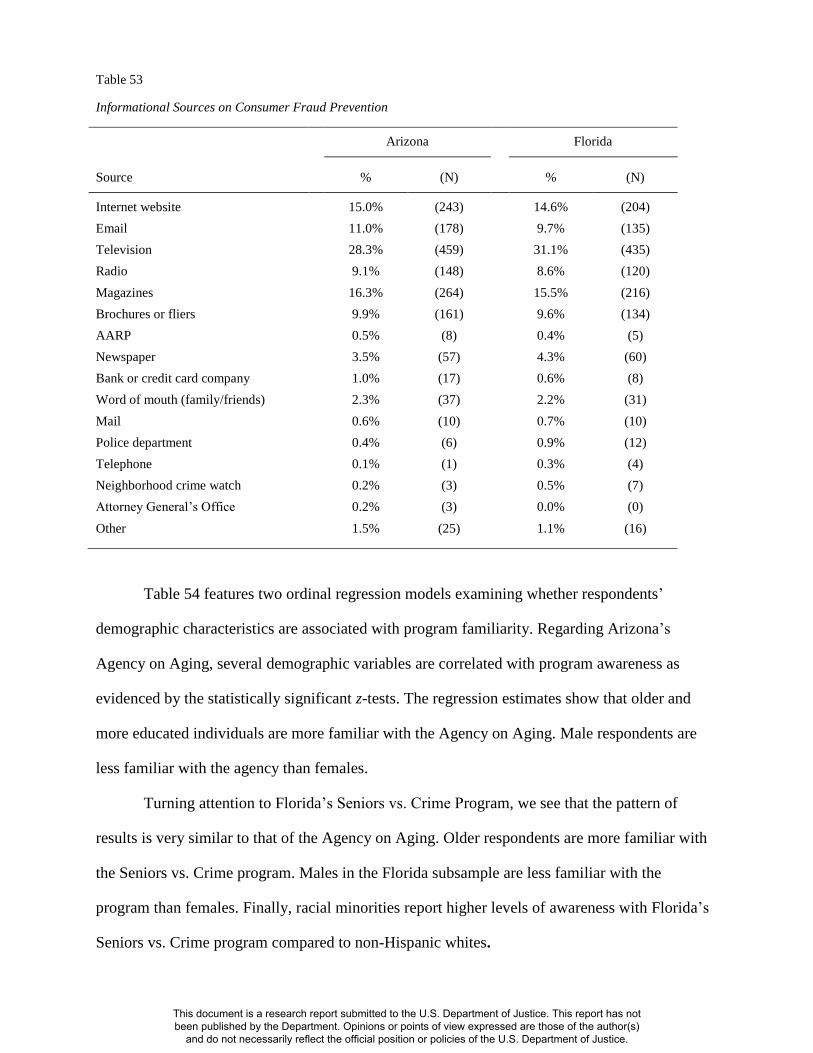
The study also queried respondents about the sources that have provided information on
how to protect themselves from consumer fraud victimization. Study participants reported that
they received prevention information from a variety of sources. Television, however, was the
most commonly reported source of information in both states (28.3% in Arizona, 31.1% in
Florida). Internet websites, emails, magazines, radio, and brochures/fliers were also relatively
common sources of fraud prevention information.
Several demographic variables were correlated with program awareness. Specifically,
older and more educated individuals were more familiar with the Agency on Aging. Male
respondents were less familiar with the agency than females. In analyses that focused on
Florida’s Seniors vs. Crime Program, the pattern of results was similar. Older respondents were
more familiar with the Seniors vs. Crime program. Males in the Florida subsample were less
familiar with the program than females. Finally, racial minorities reported higher levels of
awareness with Florida’s Seniors vs. Crime program compared to non-Hispanic whites.
This document is a research report submitted to the U.S. Department of Justice. This report has not been published by the Department. Opinions or points of view expressed are those of the author(s)
and do not necessarily reflect the official position or policies of the U.S. Department of Justice.
16
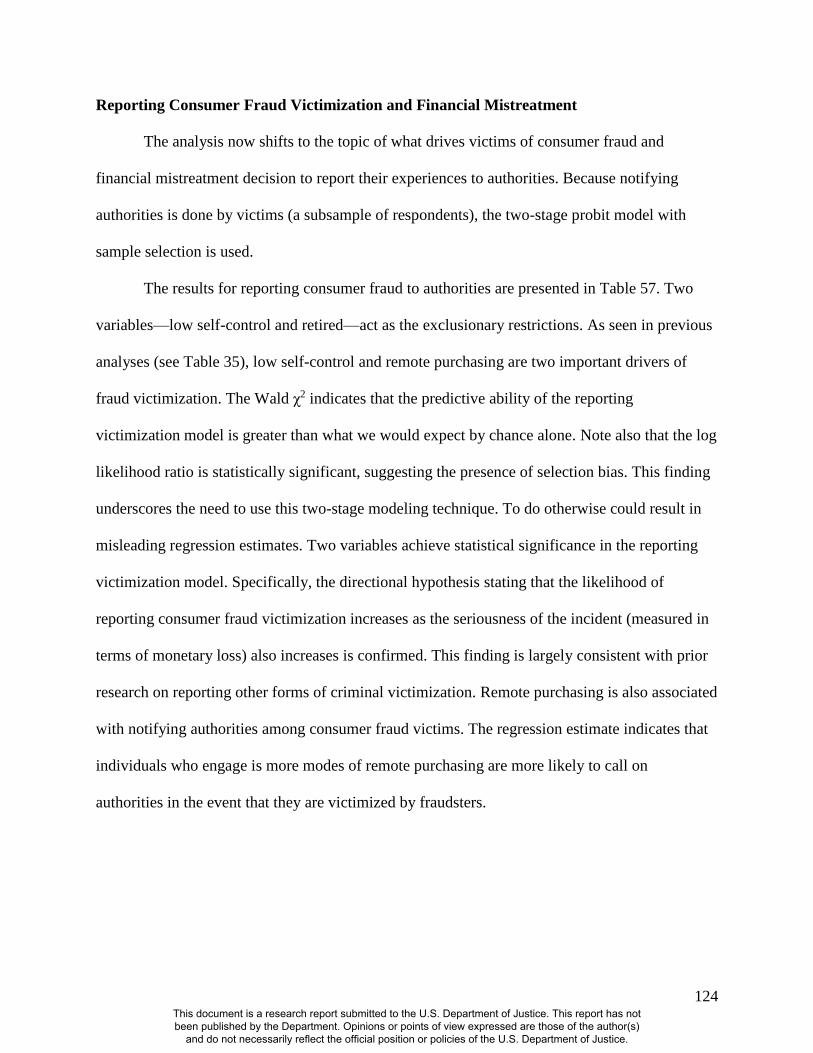
Reporting Consumer Fraud Victimization and Financial Mistreatment
The final set of analyses focused on what drives victims of consumer fraud and
financial mistreatment to report their experiences to authorities. Using a statistical methodology
for addressing potential selection effects associated with focusing on victims only, the analyses
showed, consistent with prior research, that the seriousness of a victimization event (as gauged
by monetary loss) increased the likelihood of reporting the victimization to law enforcement.
The analyses also showed that remote purchasing is also associated with an increased likelihood
of contacting authorities about victimization.
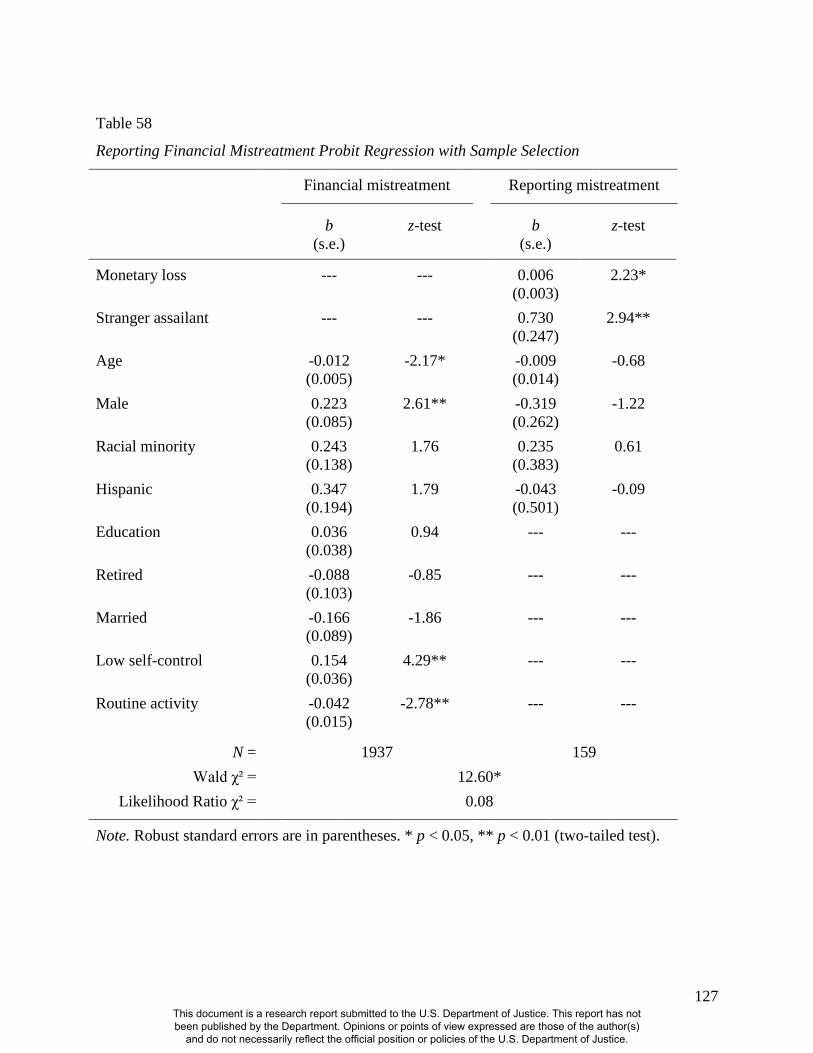
When the focus was on financial mistreatment, the analyses indicated that greater
monetary loss is also associated with an increased likelihood of reporting victimization to law
enforcement authorities. In addition, the analyses indicated that such reporting was more likely
when the assailant was a stranger. The results, too, accord with prior research on reporting other
forms of criminal victimization.
Conclusion
The results of this study are significant for several reasons. In particular, they provide an
empirical foundation on which to understand the distribution and causes of financial exploitation
of the elderly and steps that can be taken to reduce it. The main conclusion to be drawn from the
study is that consumer fraud targeting and fraud victimization of the elderly are common and
result from activities, such as frequent online and telemarketing purchases, that can be curbed or
that can be coupled with simple steps to protect individuals from actual victimization. The study
also highlights that the elderly population is largely unaware of efforts that exist to educate them
about consumer fraud. Accordingly, a considerable opportunity exists to make substantial strides
in educating the elderly about fraud victimization by more aggressively distributing information
This document is a research report submitted to the U.S. Department of Justice. This report has not been published by the Department. Opinions or points of view expressed are those of the author(s)
and do not necessarily reflect the official position or policies of the U.S. Department of Justice.
17
through different media. Several specific recommendations are discussed further below after
discussing implications for further research.
Implications for Further Research
Although this study constitutes an advance over prior research, several limitations bear
mention that point to directions for future research. First, the study examined elderly populations
in Arizona and Florida. Thus, the extent to which the results generalize to the rest of the country
is unknown. That said, the prevalence estimates of victimization largely accord with those found
in prior research, suggesting that the results likely provide a reasonable estimate of what would
be found with studies in other states or the country as a whole. Clearly, however, the prevalence
of fraud targeting and victimization, and the specific causes, may vary from place to place.
Second, there remains a need to undertake studies that employ several sources of
information, including self-report data from offenders on abuse and victimization of the elderly,
official records data from law enforcement agencies, and interviews with policymakers,
practitioners, and advocates involved in efforts to protect the elderly from fraudulent activity. It
is possible, for example, that fraud targeting and victimization are lower in areas where a critical
threshold of awareness about consumer fraud of the elderly exists. The use of multiple sources
of data could aid in the development of measures that gauge such awareness and in turn enable
empirical tests of that possibility.
Third, although this study identified key risk factors that increase the likelihood of fraud
targeting and victimization, the precise causal mechanisms involved warrant further
investigation. For example, individuals who engage in routine activities, such as socializing with
their friends in the community, are less likely to experience financial mistreatment. What
exactly produces this effect bears closer scrutiny. It could be that such activities reduce
This document is a research report submitted to the U.S. Department of Justice. This report has not been published by the Department. Opinions or points of view expressed are those of the author(s)
and do not necessarily reflect the official position or policies of the U.S. Department of Justice.
18
opportunities for fraud targeting and victimization to occur, but they also could expose
individuals to a broader network of individuals who provide informal social support that protects
them against fraudulent activities that family members of relatives might seek to undertake.
Fourth, this study included questions about several state-level efforts in Arizona and
Florida to prevent and combat elderly fraud victimization. A wide range of similar and different
efforts exist in other states and their implementation, the extent to which they target the risk
factors associated with elderly victimization, and their effectiveness remain to be examined.
Implications for Policy and Practice
The diversity of methods through which fraud targeting occurs is considerable, including
telephone, mail, email, web sites, phony prize offers, requests for contributions to phone
charitable causes, and more. The plethora of such methods in turn indicates that any efforts to
reduce victimization likely must be multifaceted and, for example, should target these different
methods as well as educate elderly consumers about the ways in which consumer fraud
victimization can occur.
The fact that few fraud attempts or actual fraud victimization events are reported to law
enforcement suggests the need for education about the importance of reporting such events and,
at the same time, for efforts to ensure that law enforcement respond to such reports in a proactive
and well-publicized manner. Such steps can increase the chances that the elderly will learn about
consumer fraud victimization, that they will report it, and that a potential general deterrent effect
can be created or increased. For example, would-be offenders, such as family members and
solicitors, may be less likely to engage in fraud if they read or hear about law enforcement
aggressively responding to claims of fraudulent activity.
This document is a research report submitted to the U.S. Department of Justice. This report has not been published by the Department. Opinions or points of view expressed are those of the author(s)
and do not necessarily reflect the official position or policies of the U.S. Department of Justice.
19
Given the greater targeting and victimization of them, males and individuals ages 60-72
should be educated about the importance of taking steps to prevent fraud and of reporting
attempted or actual fraud. Similarly, individuals who engage in greater amounts of remote
purchasing or who are low in self-control should be targeted for similar educational efforts since
these two factors emerged as the most robust predictors of various types of fraud targeting and
victimization. Not least, since financial mistreatment was associated with failing to engage in
routine activities, such as social events, outside the home, elderly individuals should be
encouraged to participate in social activities in their community. Doing so may create a social
support network that provides a protective effect against fraud targeting and especially
victimization.
Few respondents in the study were familiar with state-level efforts to educate and help the
elderly in matters related to consumer fraud. Accordingly, there likely is substantial room to
reduce consumer fraud victimization by greater attention to implementing these efforts in ways
that better reach their intended target populations. Such efforts could include flyers, radio and
television advertisements during shows or times when the elderly are more likely to be listening
or watching, and other related activities. These are the primary avenues through which
respondents reported learning about these programs, but, ultimately, the effectiveness of such
efforts depends heavily on whether informational material reaches the intended audience.
This document is a research report submitted to the U.S. Department of Justice. This report has not been published by the Department. Opinions or points of view expressed are those of the author(s)
and do not necessarily reflect the official position or policies of the U.S. Department of Justice.
20
BACKGROUND LITERATURE
Financial exploitation, defined as “the illegal or improper use of an incapacitated or
vulnerable adult or his resources for another’s profit or advantage” (Arizona Elder Abuse
Coalition 2007: 4), is a common form of elder abuse (American Association of Retired Persons
[AARP] 2003; Hall et al. 2005; Muscat et al. 2002). Unlike other forms of elder abuse, financial
exploitation (e.g., consumer fraud) is more likely to take place with the implied consent of the
elder victim (Bonnie and Wallace 2002; Hafemeister 2002), and the majority of victims do not
have a personal relationship with the perpetrator (Laumann, Leitsch, and Waite 2008). Scholars
have suggested that fraud has become the “characteristic crime of the 21st century” (Albanese
2005:8). Before describing the current study, we review prior work on consumer fraud and
elderly victimization.
First, we examine available statistics and legal provisions pertaining to consumer fraud,
followed by an overview of the findings from previous studies on the nature, incidence, and
prevalence of fraud victimization. Next, we discuss research on elderly victim reporting and
studies of consumers’ routine activities, lifestyles, and demographic characteristics that may
serve as risk and protective factors. The bulk of national-level studies have been conducted by
consumer protection or elderly advocacy groups (e.g., the AARP) and these typically have
involved a delimited focus on developing national prevalence estimates of elderly consumer
fraud victimization, while academic researchers addressing this topic have typically used small,
local samples. The lack of state-level research has made it difficult for statewide service
providers, victim assistance programs, and policy makers to reach those members of the elderly
population most at-risk for victimization. Put simply, there is a critical need to conduct state-
level research and to incorporate measures that enable researchers to pin-point more precisely the
correlates of fraud victimization and what can be done to prevent and reduce it.
This document is a research report submitted to the U.S. Department of Justice. This report has not been published by the Department. Opinions or points of view expressed are those of the author(s)
and do not necessarily reflect the official position or policies of the U.S. Department of Justice.
21
Defining Consumer Fraud
Consumer fraud is a form of financial exploitation that involves some form of
communication between victim and offender, and includes the “deliberate deception of the
victim with the promise of goods, services, or other benefits that are non-existent, unnecessary,
were never intended to be provided, or were grossly misrepresented” (Rosoff et al. 2004:48).
Based on such a definition, and as we discuss below, this crime appears to be a growing problem
in the United States, as evidenced by recent estimates provided by the Federal Trade
Commission’s (FTC) Bureau of Economics and Consumer Protection indicating that nearly one-
third of American adults have been targeted by fraudsters (Anderson 2004). Other sources have
identified the elderly as probable targets of fraudsters, and statistics confirm when the elderly are
victimized it often involves property crime and is financial in nature (Hafemeister, 2002;
Johnson 2003; Klaus 2005).
What is Known About the Nature, Incidence, and Prevalence of Victimization?
Knowledge about the nature, incidence, and prevalence of elderly fraud victimization has
been the product of two distinct sources: (1) research conducted or sponsored by consumer-
protection or elderly-advocacy agencies, and (2) social scientists. Three national-level surveys
were conducted by the Federal Trade Commission (FTC) in 2003, 2005, and 2011-2012. The
FTC’s first survey of 2,500 households revealed that one-third of Americans have ever been
targeted by some form of consumer fraud, with 16 percent reporting targeting over the past year
and 11 percent reporting actual victimization in the past year. The most common types of fraud
identified by respondents pertained to advance fee loans, buyer’s club memberships, credit
repair, prize promotions, Internet service provider fraud, and pyramid schemes (Anderson 2004).
This document is a research report submitted to the U.S. Department of Justice. This report has not been published by the Department. Opinions or points of view expressed are those of the author(s)
and do not necessarily reflect the official position or policies of the U.S. Department of Justice.
22
In descriptive analyses, targeting appeared to be relatively evenly distributed across consumer
demographics, suggesting that the elderly may not necessarily be targeted at a higher rate than
their younger counterparts. In 2003, the most common form of targeting occurred through print
media (e.g., mail, newspapers, magazine ads, catalogs, and posters). In the second FTC survey of
3,888 adults, 13.5% of respondents reported victimization. The majority of victims were targeted
through print media (Anderson 2007). Similar to the 2003 FTC survey, the 2005 study revealed
that seniors were not at greater risk of fraud victimization relative to other age groups. The third
FTC survey of 3,638 adults found that nearly 11% of respondents were the victims of consumer
fraud in 2011 (Anderson 2013). The types of frauds varied slightly from previous years, with the
most commonly reported being fraudulent weight-loss products, fraudulent prize promotions,
being billed for buyers’ club memberships that they had not agreed to purchase, being billed for
Internet services they had not agreed to purchase, and fraudulent work-at-home programs. In a
notable change from previous surveys, the Internet was the most frequent way in which victims
were targeted. In this survey, Hispanic and African-American consumers were more likely to be
victimized. Finally, those between the ages of 55-74 had the greatest risk of being victimized by
fraudulent prize promotions.
While the FTC surveys provided important insights into the methods used by fraudsters,
none of these studies included measures derived from victimization theories. However, in the
second and third surveys, level of debt, a characteristic some argue is indicative of low self-
control (see e.g., Romal and Kaplan 1995) increased the likelihood of victimization. Similarly,
the third survey found that engaging in risky purchasing behaviors---a measure consistent with
routine activity/lifestyles perspectives---also increased the likelihood of fraud victimization
(Anderson 2013). These findings underscore the need for additional research informed by
theories of victimization (i.e., routine activity theory).
This document is a research report submitted to the U.S. Department of Justice. This report has not been published by the Department. Opinions or points of view expressed are those of the author(s)
and do not necessarily reflect the official position or policies of the U.S. Department of Justice.
23
Like the FTC, efforts to address consumer fraud by the AARP have focused on the
national level (AARP 1996, 2003). One difference between the two groups is that the AARP’s
studies have been more narrowly focused on specific types of fraud believed to
disproportionately target seniors (e.g., telemarketing fraud), making it more difficult to generate
accurate estimates of consumer fraud prevalence and incidence. In comparison, most social
scientific studies to date have used small, convenience samples, often comprised of the willing
victims of a single fraudulent incident or type of fraud (see e.g., Alves and Wilson, 2008; Jesilow
et al. 1992; Mason and Benson 1996; McGuire and Edelhertz 1980; Van Wyk and Benson 1997;
Van Wyk and Mason 2001). Scholars have argued that such research may be limited in its
generalizability and its implications for public policy (Friedman 1998; Lee and Soberon-Ferrer
1997). One consistency across the national and local studies is that the elderly are less likely to
report fraud victimization, although reasons for underreporting remain largely unexplored in the
literature (Choi and Mayer 2000; Hall et al. 2005; Laumann et al. 2008). Anecdotal evidence
suggests that seniors do not report fraud due to embarrassment or fear of repercussions (Ravenna
2004:9).
Given that the authority for enforcing most consumer protection legislation rests with
State Attorney General’s Offices, the importance of state-level studies bears emphasis. To
illustrate, results from a modified version of the FTC survey administered in 2004-2005 to a
sample of Florida adults revealed several key differences between the nation and Florida
residents. For example, the incidence of consumer fraud attempts in the United States was
estimated at one-third, compared to 16% in Florida (Holtfreter, Reisig, and Pratt 2008). Such
differences underscore the need for more refined state-level studies using samples of resident
populations—and guidance in conducting these types of studies—that can help states develop
more empirically-grounded, context-relevant policies to reduce victimization.
This document is a research report submitted to the U.S. Department of Justice. This report has not been published by the Department. Opinions or points of view expressed are those of the author(s)
and do not necessarily reflect the official position or policies of the U.S. Department of Justice.
24
Risk and Protective Factors
Attempts to develop sociodemographic profiles of elderly fraud victims have been
advanced, but these results have been largely inconclusive, and often involved simple descriptive
analyses relying on a relatively narrow range of potential correlates of victimization. There is
consensus, however, that demographic characteristics reflect consumers’ vulnerability. Overall,
prior studies have found that age is negatively associated with fraud victimization (see generally,
Anderson 2004, 2007; Holtfreter et al., 2008; Titus et al. 1995). Notably, while one study
confirmed a lower rate of victimization among the elderly, it also revealed that older consumer
victims suffered greater monetary losses (Princeton Survey Research Associates 1999).
Unfortunately, these studies have not systematically introduced controls that would allow for
more robust estimation of age effects.
To date, only a few studies have addressed consumer fraud within a broader theoretical
context. Holtfreter et al. (2008) found that remote purchasing behaviors (i.e., mail, telephone,
Internet, television) increased consumers' likelihood of being targeted by fraudsters. In the
language of routine activity theory, these behaviors reflect greater access to unguarded exposure.
Once targeted, consumers who engaged in risky financial practices were significantly more
likely to be victimized than their high self-control counterparts. A follow-up study examined
online consumers' perceived risks of credit card theft victimization and found that socially
vulnerable and financially impulsive respondents perceived higher levels of risk when using their
credit cards on line (Reisig et al., 2009). However, although consumers with higher risk scores
altered their behaviors to reduce victimization risk, financially impulsive individuals failed to
make such behavioral changes.
Building on these two studies, Pratt, Holtfreter, and Reisig (2010) examined the
influence of routine online activities on Internet fraud targeting. Before controlling for time spent
This document is a research report submitted to the U.S. Department of Justice. This report has not been published by the Department. Opinions or points of view expressed are those of the author(s)
and do not necessarily reflect the official position or policies of the U.S. Department of Justice.
25
online and online purchasing behavior, younger consumers and more educated consumers were
significantly more likely to experience Internet fraud targeting. However, these effects
disappeared after controlling for time spent online and online purchasing, and both of these
consumer behaviors significantly increased the odds of Internet fraud targeting, a finding that
lends support to routine activity theory. Similarly, Reyns (2013) found that online banking,
shopping, and instant messaging increased the risk of identity theft victimization. In a recent
study of Dutch consumers, van Wilsem (2013) partially replicated the work of Holtfreter et al.
(2008), finding that low self-control and online shopping elevated the risk of consumer fraud
victimization. Applied to an elderly fraud context, these theory-informed studies suggest that
attention to seniors' daily routines as well as personal traits and attitudes is warranted.
Carcach et al. (2001) have offered important and intriguing insights into the relationship
between victimization and age. They suggest that aging alters the ways individuals distribute
their time across social roles and activities. Put differently, because victimization risk varies
across situations, it is reasonable to expect that elderly consumers’ day-to-day activities and
other lifestyle factors may make them more or less vulnerable to fraud victimization (Akers et al.
1987). This expectation is consistent with routine activity theory explanations of violent and
property crime victimization (Cohen and Felson 1979; Schreck 1999; Stewart et al. 2004).
Coupled with the work of Carcach et al. (2001), the studies conducted by Holtfreter and
colleagues (Holtfreter et al., 2008; Pratt et al. 2010; Reisig and Holtfreter, 2007, 2013; Reisig et
al., 2009) supply a point of departure for exploring factors associated with elderly consumer
fraud victimization. Applying this theoretical perspective to elderly fraud victimization would,
however, require moving beyond analysis of simple demographics to identify other sources of
vulnerability related to consumers’ routine activities (e.g., purchasing, investing, Internet use,
responding to phone solicitations, charitable contributions) and lifestyle factors (e.g., living
This document is a research report submitted to the U.S. Department of Justice. This report has not been published by the Department. Opinions or points of view expressed are those of the author(s)
and do not necessarily reflect the official position or policies of the U.S. Department of Justice.
26
situation, prior victimization). Such an approach would lend itself equally well to systematic
exploration of factors that may influence seniors’ reporting of attempted and actual fraud
victimization, including the extent of financial loss. Given the absence of attention to these
critical risk and protective factors, the current research attempted to fill these gaps in ways that
will lead to important policy changes.
Awareness and Prevention Efforts in Arizona and Florida
Although all 50 states have enacted laws protecting the elderly, virtually no research on
the effectiveness of these laws exists. Against this backdrop, the percentage of persons age 65
and older increased by a factor of 11 during the 20th century; by 2030, this population is
expected to constitute 20 percent of the U.S. population (American Geriatrics Society 2006).
In Arizona, it is projected that residents aged 60 and older will comprise over 25% of the
state's population by 2020 (Arizona Attorney General's Office, 2009). Considerable resources
have been devoted to the needs of this growing population, and the abuse and exploitation of
elderly consumers through fraud remains at the forefront of these efforts. In sum, it is clear that
the needs of elderly Arizonans, particularly those pertaining to financial exploitation and abuse,
are of the utmost concern to state and local officials. In Florida, seniors comprised, as of 2012,
just over 18 percent of the State’s population, a rate considerably above the national average
(United States Census Bureau 2012). Not surprisingly, Florida policymakers, like their
counterparts elsewhere, have expressed concern about victimization of this population and thus
commissioned reports on the issue. Most recently, a legislative Task Force Report on Crimes
Against the Elderly found that seniors had an unrealistic fear of crime and were not being
informed about the most likely fraud scams targeting them (Ravenna 2004). In response to this
report, the Florida Office of the Attorney General established Seniors vs. Crime, a special project
This document is a research report submitted to the U.S. Department of Justice. This report has not been published by the Department. Opinions or points of view expressed are those of the author(s)
and do not necessarily reflect the official position or policies of the U.S. Department of Justice.
27
designed to provide services to Florida’s elderly to help prevent and reduce victimization, and to
assist the Attorney General in consumer-related investigations.
The state-level demographics in Arizona and Florida, coupled with the aggressive
strategies of both state governments, made these two sites a natural venue for systematic
empirical research on elderly consumer fraud victimization. Lessons from Arizona and Florida
should be of interest to other states for several reasons, including: the emphasis on identifying
what likely are a core set of risk and protective factors associated with victimization; the
opportunity to identify lessons that other states can draw in pursuing strategies similar to Seniors
vs. Crime, and, more generally, from an understanding of the risk and protective factors
associated with elderly consumer fraud victimization; and the development of a research protocol
that can assist states in their efforts to develop, monitor, evaluate, and improve efforts to reduce
victimization of the elderly.
Research Gaps and Needs
In short, a paucity of evidence exists that goes beyond establishing nationwide estimates
of elderly consumer fraud victimization. Few studies establish the risks for such victimization or
the protective factors that buffer the elderly from being targeted by offenders. And we know of
no efforts to systematically and empirically evaluate state-level efforts aimed at preventing and
reducing elderly victimization. Juxtaposed against these research gaps is the increasing number
of elderly in the U.S., many of whom live on the margins of poverty and who can ill-afford to
bear additional financial burdens. Despite the aggressive outreach efforts launched by Arizona
and Florida, the extent to which seniors in both states are aware of programs and services was
unknown prior to the current research effort.
This document is a research report submitted to the U.S. Department of Justice. This report has not been published by the Department. Opinions or points of view expressed are those of the author(s)
and do not necessarily reflect the official position or policies of the U.S. Department of Justice.
28
SCOPE AND METHODS
The current study is comprised of data from telephone surveys of 2,000 adults aged 60
years and older in Arizona (N = 1,000) and Florida (N = 1,000). The survey was obtained via
Computer Assisted Telephone Interviewing (CATI) administered by Precision Research which is
a reputable private research firm in Glendale, Arizona with more than 27 years of marketing and
social science research experience. The surveys collected information relating to consumer fraud
targeting and victimization, risk and protective factors related to fraud targeting and
victimization, and respondent awareness and use of state-based fraud programs. Consistent with
prior research, the survey collected information relating to respondents’ experience with being
targeted and victimized by the following types of consumer fraud (Anderson, 2004; Holtfreter,
Reisig, & Blomberg, 2006):
Shopping/purchasing fraud
o Paid for unnecessary repairs to home, appliance, or automobile
o Bought a product that did not work as claimed
o Paid for phony subscriptions to magazines or something else
Financial fraud
o Paid money to improve financial situation
o Invested in phony business opportunity
o Tricked into giving financial information (e.g., credit card number)
Other types of consumer fraud
o Contributed to phony charity or religious organization
o Paid a fee to claim a phony prize
o Paid money in advance to reduce mortgage payment
o Identity was stolen
This document is a research report submitted to the U.S. Department of Justice. This report has not been published by the Department. Opinions or points of view expressed are those of the author(s)
and do not necessarily reflect the official position or policies of the U.S. Department of Justice.
Target Population
The target population for the current study was all people age 60 years and older living in
Arizona and Florida. These states were selected because they have two of the highest proportions
of elderly people (i.e., 60 years or older) in the U.S. About 18% of the U.S. population is 60 or
older. Arizona seniors comprise 19.29% of the total state population and 23.38% of Florida’s
population is 60 or older. Sixty was chosen as the age cut-point to define the elderly target
population for several reasons. First, it is similar to the age used by governmental agencies such
as the Administration on Aging (AOA) and the U.S. Census Bureau to define the senior
population. Second, it is consistent with the extant literature on elderly victimization (Acierno,
Hernandez-Tejada, Muzzy, & Steve 2009; Alves & Wilson, 2008; Conrad et al., 2010; Dietz &
Fields, & Rainey, 2006). Finally, and perhaps most importantly, 60 years and older was the
target population stipulated in the NIJ solicitation for this project.
Sample Construction
The sample was generated using a list-assisted sampling method. Specifically, telephone
numbers come from a White Pages database of directory-listed households in Arizona and
Florida. One concern with this approach to generate the sample is that people who only use cell
phones will be excluded from the sample. While this would certainly affect a sample consisting
of all ages, it is of less concern for the current sample. Cell phone usage has increased among the
elderly population in recent years. According to a recent survey, about 87% of people 57-65
years, 68% of people 66-75 years, and 48% of people 75 or older own a cell phone (Zickuhr,
2011). However, older people are significantly more likely to also use landline telephones
This document is a research report submitted to the U.S. Department of Justice. This report has not been published by the Department. Opinions or points of view expressed are those of the author(s)
and do not necessarily reflect the official position or policies of the U.S. Department of Justice.
30
compared to younger individuals. One survey revealed that only 2% of U.S. respondents age 65
or over uses only a cell phone (Blumberg & Luke, 2007). Accordingly, use of the White Pages is
a reasonable method to generate a sample of elderly people for a telephone survey.
The first stage of the sampling process consisted of Precision Research subjecting the
directory-list to an extensive validation process to ensure that all telephone numbers were
currently valid, assigned to the correct area code, and within an appropriate ZIP code. Working
blocks were used to generate a sample of telephone numbers. A “block” (also known as a
hundreds-block or bank) is a set of 100 contiguous telephone numbers identified by the first two
digits of the last four digits of a telephone number. For the purposes of this study a block was
considered working if one or more listed numbers were found in the block. Precision Research
used an Equal Probability of Selection Method (EPSEM) to produce an equal probability sample
of all possible 10-digit telephone numbers in the working blocks. Specifically, random digit
dialing (RDD) was used to randomly call numbers from the working blocks. All numbers within
the blocks had an equal probability of selection regardless of whether they were listed, unlisted,
residential, business, or fax machine.
Household Screening
The sample construction process yielded a RDD sample of all working telephone
numbers in Arizona and Florida. Inevitably, however, non-working and non-residential numbers
were called during RDD. During the second stage of sample generation Precision Research
interviewers determined whether the randomly dialed number was a working residential
numbers (e.g., businesses and fax machines), and ineligible households (e.g., no adult 60 years or
older in household and language barriers other than Spanish) were replaced by the RDD process.
This document is a research report submitted to the U.S. Department of Justice. This report has not been published by the Department. Opinions or points of view expressed are those of the author(s)
and do not necessarily reflect the official position or policies of the U.S. Department of Justice.
31
Only residential households with at least one adult age 60 years or older were included in the
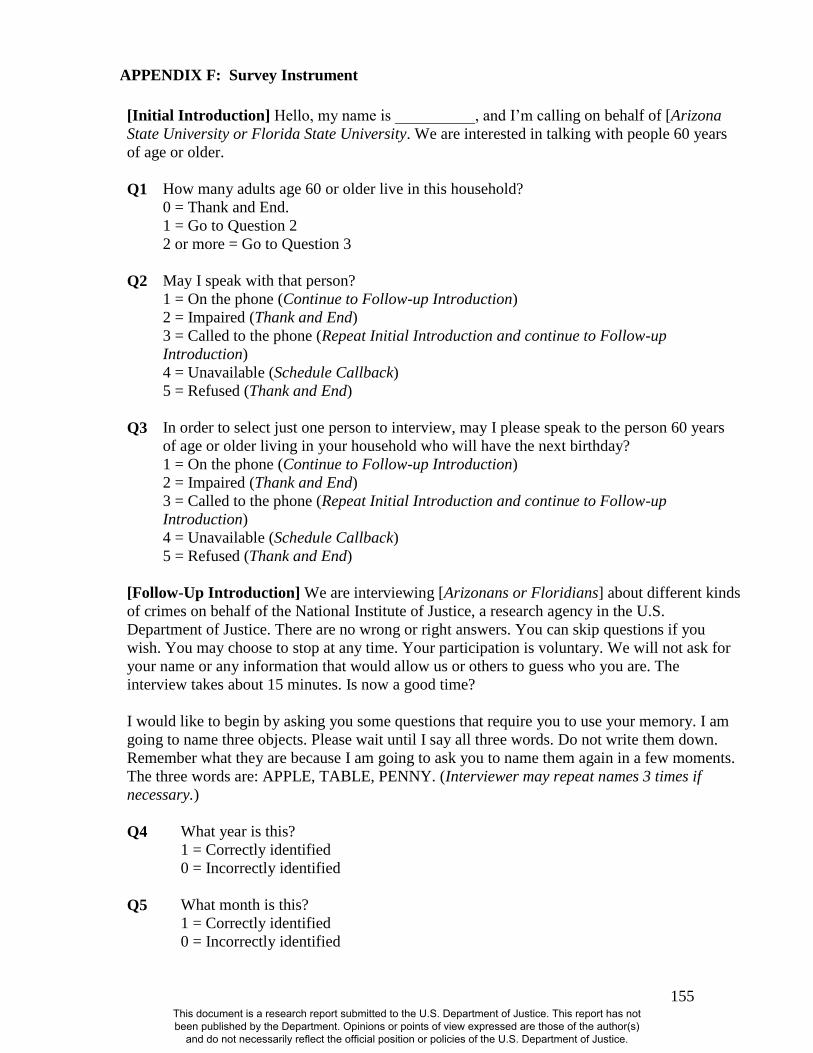
sample. Precision Research interviewers read the following introductory script to a potential
respondent to identify the purpose of survey and determine whether the household had an
eligible participant:
“Hello, my name is________, and I’m calling on behalf of Arizona State
University for Arizona calls or Florida State University for Florida calls). We are
interviewing (Arizonans/Floridians) about different kinds of crimes on behalf of
the National Institute of Justice. We are interested in the experiences of people
over 60.”
The interviewer then asked the individual how many adults age 60 or older lived in the
household. If no person meeting this requirement lived in the household the interview ended and
a new RDD number was contacted. If at least one individual 60 years or older was present in the
household the interview continued.
Respondent Selection
The third stage of sample construction consisted of selecting a respondent to take part in
the survey. If only one individual 60 years or older was present in the household he or she was
designated as the respondent. If the individual speaking with the interviewer indicated that the
person 60 years or older was impaired, unavailable, or refused to contact the person the interview
ended and a new number was contacted through RDD. In many cases there was more than one
individual in a household that was 60 years or older. In these situations the person with the “next
birthday” was designated as the respondent. The incidence rate (i.e., the percentage of calls that
resulted in an eligible respondent) was 69%.
This document is a research report submitted to the U.S. Department of Justice. This report has not been published by the Department. Opinions or points of view expressed are those of the author(s)
and do not necessarily reflect the official position or policies of the U.S. Department of Justice.
32
Cognitive Screener
The possibility of contacting a respondent with a cognitive impairment (e.g., Alzheimer’s
disease or some form of dementia) was greater in the present study compared to studies of the
general population because the target population was much older. Accordingly, the final stage in
the sample construction process consisted of the interviewer administering a cognitive screener
to all eligible and willing participants. The survey instrument used Callahan et al.’s (2002) Six-
Item Screener (SIS). The SIS was used because it is unobtrusive and takes less than one minute
to administer. Additionally, the screener has a high predictive accuracy in community-based
samples for cognitive impairment and dementia. The SIS is comprised of three sections. First,
respondents were read a list of objects (i.e., apple, table, and penny) and asked to remember
them. Second, three orientation questions requested respondents to identify the day, month, and
year. Third, the respondents were asked to repeat the three words they heard at the beginning of
the screener. Each screener item scored one point for a correct response (range = 0 to 6). After a
review of previous literature that has used the SIS and feedback provided by hired expert
consultants, a cut-off of less than 3 was used in the present study. That is, potential respondents
who scored less than 3 on the SIS were excluded from participation in the study. This cognitive
screening strategy is consistent with previous research (Callahan et al., 2002; Woodford &
George, 2007).
Phoning Procedures
Following the creation of the CATI program and interviewer training, interviewing
commenced on June 27, 2011. The sample was completed on July 27, 2011. Data were collected
seven days a week during specific times of the day that had the greatest probability of contacting
a respondent. Specifically, potential respondents were called between 6:00 p.m. and 9:00 p.m.
This document is a research report submitted to the U.S. Department of Justice. This report has not been published by the Department. Opinions or points of view expressed are those of the author(s)
and do not necessarily reflect the official position or policies of the U.S. Department of Justice.
33
Monday through Friday and between 12:00 p.m. and 9:00 p.m. on Saturdays and Sundays. All
telephone interviews were conducted by the research firm based in Arizona which is in Mountain
Standard Time (MST). There was a three-hour time-zone difference during data collection
between Arizona and Florida. Accordingly, interviews were conducted during MST to
correspond with the appropriate Eastern Standard Time (EST) target timeframe. For example,
Precision Research began the weekday Florida interviews around 3:00 p.m. (MST) and ended
them around 6:00 p.m. (MST), which translated into 6:00 p.m. (EST) and 9:00 p.m. (EST).
Contact Attempts
A ten-callback rule was used to contact a respondent. That is, calls that were met with no
answer, an answering machine, or a busy signal were loaded back into the CATI computer
system to be called again later. After a maximum of 10 callbacks with no eligible respondent
talking to an interviewer the telephone number was replaced by the CATI system.
In some instances the respondent agreed to participate in the survey but did not have time
to complete the interview at the time of initial contact. Additionally, on several occasions a
respondent had to stop an interview short due to a time conflict. In both of these situations the
interviewers were trained to schedule a time with the respondent that was most convenient for
him or her to finish the interview.
Spanish Language Interviews
The interviews were primarily conducted in English but a Spanish survey instrument was
constructed and used when necessary. It was vital to have the ability to conduct interviews in
Spanish given the large proportion of residents in Arizona and Florida from Hispanic/Latino
origin. Precision Research staff members are uniquely trained and equipped to interview
This document is a research report submitted to the U.S. Department of Justice. This report has not been published by the Department. Opinions or points of view expressed are those of the author(s)
and do not necessarily reflect the official position or policies of the U.S. Department of Justice.
34
Hispanic/Latino respondents. Trained interviewers were able to administer the surveys in
Spanish but were also capable of ensuring that the text and concepts of the survey were
understandable to a range of potential Hispanic subcultures (e.g., Mexican, Cuban, Puerto Rican,
Dominican, Central American, and South American). The interviewers’ unique expertise in this
regard helped eliminate language and cultural barriers.
Minimizing Survey Administration Error
A number of steps were taken to minimize the risk of survey administration error. Several
supervisors monitored interviewers by walking the call center floor and listening to in-progress
interviews on private phone lines. As an additional precaution, a member of the research team
called a private phone line at the research firm to randomly monitor active interviews.
Interviewers were aware that they could be monitored by supervisors and research team
members but were unaware of the exact interviews that were being observed. Respondents were
unaware that anyone other than the interviewer was listening to the questionnaire. The research
team member monitored interviews several times per week throughout the entire data collection
period. Interviews were monitored during various days, times, and interviewer shifts. Eleven
complete and 10 partial interviews were monitored by the research team member during this
quality control process. Interview monitoring allowed the research team to assess whether the
interviewers were consistently and accurately administering the survey and if particular areas of
the questionnaire were problematic. No problems were detected during interview monitoring.
This document is a research report submitted to the U.S. Department of Justice. This report has not been published by the Department. Opinions or points of view expressed are those of the author(s)
and do not necessarily reflect the official position or policies of the U.S. Department of Justice.
35
Field Outcomes
The above sampling methods resulted in complete interviews with 2,000 Arizona (N =
1,000) and Florida (N = 1,000) residents age 60 years or older. The interviews required an
average of 21 minutes to complete.
Phone Dispositions
A total of 4,247 telephone numbers resulted in contact with a household containing at
least one potential respondent age 60 years or older. Table 1 presents a breakdown of the phone
dispositions. The values reported in Table 1 include each possible disposition after the
interviewer determined that at least one person in the household was 60 years or older.
Table 1
Phone dispositions
Dispositions N
Impaireda 71
Failed cognitive screener 46
Refusals 1716
Partial interviews 414
Completed interviews 2000
Total eligible intervieweesb 4130
aParticipant was impaired and unable to be interviewed.
bTotal number eligible potential participants 60 years of age or older who were not
impaired and passed the cognitive screener.
This document is a research report submitted to the U.S. Department of Justice. This report has not been published by the Department. Opinions or points of view expressed are those of the author(s)
and do not necessarily reflect the official position or policies of the U.S. Department of Justice.
36
Seventy-one people were declared impaired and unable to complete the interview by the
household informant that answered the call. Forty-six individuals failed the cognitive screener
and were not interviewed. There were a total of 1,716 people who refused to participate in the
interview. This value includes all people who refused to answer any survey questions after
eligibility was established. There are 414 people classified as “partial interviews” in Table 1.
This includes eligible respondents that agreed to take part in the survey but ended the survey
short of completion. Interviewers attempted to schedule times to complete the interview with
these individuals. In the event that the respondent refused to complete the remainder of the
interview they were classified as a partial interview. The sampling and screening procedures
described above resulted in 4,130 total eligible interviewees that were contacted during data
collection. This value represents the total number of people who self-identified as 60 years or
older who completed the interview (N = 2,000), refused to participate (N = 1,716), or partially
completed the interview (N = 414). Individuals who were classified as impaired or who failed the
cognitive screener were excluded from this value because they are not eligible respondents.
Response Rate
The response rate is important to the current study because it influences how
representative the sample is of the population from which it was drawn. Low response rates can
result in biased data and misleading results (American Association for Public Opinion Research
[AAPOR], 2011). For example, study results cannot be used to generalize to a larger population
if a low percentage of the sample frame actually participated in the study. Although a systemic
process was used to produce the most random sample as possible, the final sample is determined
by the number of eligible people agreeing to participate in the survey.
This document is a research report submitted to the U.S. Department of Justice. This report has not been published by the Department. Opinions or points of view expressed are those of the author(s)
and do not necessarily reflect the official position or policies of the U.S. Department of Justice.
37
Formulas used to calculate response rates vary in the type of information that is used (see
AAPOR, 2011, p. 44). Some formulas include cases of unknown eligibility in the response rate
calculation. For example, busy signals and answering machines might be included in the
denominator. The present study views this approach as an overly restrictive formula. Cases of
unknown eligibility (e.g., no answer, busy signals, and answering machines), known ineligibility
(e.g., no person in household 60 years of age or older, disconnected numbers, businesses, and fax
machines), impaired respondents, and respondents who failed the cognitive screener were
excluded from the response rate calculation.
The response rate formula for the present study includes the number of completed
interviews (CI), partial interviews (PI), and refusals by eligible participants (REF) (AAPOR,
2011, p. 46). CIs consist of all interviews that were completed by eligible participants. PIs
include interviews that eligible respondents began but failed to finish (e.g., they hung up during
the interview). REF is the number of participants who self-reported to be 60 years or older but
refused to be interviewed. Frequencies for each disposition used in the calculation of the
response rate can be found by referring back to Table 1. The response rate formula used in the
The response rate for the present study was 48.43%, which is comparable to other recent
telephone survey research (Curtin, Presser, & Singer, 2005). Additionally, the completion rate
for this study was 82.90%, which is significantly higher than the 67.20% average for telephone
surveys (Hox & De Leeuw, 1994).
This document is a research report submitted to the U.S. Department of Justice. This report has not been published by the Department. Opinions or points of view expressed are those of the author(s)
and do not necessarily reflect the official position or policies of the U.S. Department of Justice.
38
Missing Data
As is the case in most survey research, not every respondent answered every question on
the survey. Similar response pattern imputation (SRPI) (also known as “hot-deck imputation”)
was used to impute missing values in the data. SRPI has been shown to be a superior imputation
strategy compared to listwise deletion which reduces statistical power (Allison, 2001) and mean
replacement which can distort variances and correlations (Roth, 1994; Schafer & Graham, 2002;
see also, Gmel, 2001). SRPI replaces missing values for particular survey items for specific
respondents based on the values from other respondents that display highly similar response
patterns on other questionnaire items. Specifically, a set of matching variables (e.g., gender, race,
age, education, employment status, and marital status) is used to match a missing case to a donor
case. SRPI is also advantageous because it is able to impute continuous, ordinal, and binary
variables and it produces imputations that are within the range of possible values for the specific
item (Myrtveit, Stensrud, & Olsson, 2001).
This study used PRELIS version 2.30 to complete missing value imputation using SRPI.
Missing values were relatively rare in these data. In fact, less than one percent of cells within the
data file had missing information. After imputation of missing values, complete data for 1,910
respondents were available for analysis. Missing values could not be imputed for 90 individuals
so they were excluded from the analysis.
Sample Characteristic Comparison to U.S. Census Estimates
Table 2 presents split-sample characteristics for Arizona and Florida and the 2010 census
estimates for each of the states. The mean age of the Arizona and Florida samples is 72 and 73,
respectively. For the 60 years and older population in Arizona and Florida, the mean age is 70
and 71, respectively. Accordingly, the Arizona and Florida samples are slightly older than the
This document is a research report submitted to the U.S. Department of Justice. This report has not been published by the Department. Opinions or points of view expressed are those of the author(s)
and do not necessarily reflect the official position or policies of the U.S. Department of Justice.
39
senior populations of the two states. Thirty-seven percent of the Arizona sample is male, whereas
46% of the elderly Arizona population is male. Likewise, males comprise 35% of the Florida
sample but 45% of the population according to the 2010 census. Accordingly, males are
underrepresented in the Arizona and Florida samples.
There are slight differences with respect to racial/ethnic composition of the samples
compared to census estimates. Ninety-four percent of the Arizona sample and 90% of the Florida
sample self-identified as white. This is compared to whites representing 90% of the Arizona
population and 88% of the Florida population. While the percentages are not drastic, both
samples slightly over represent white respondents. With regards to ethnicity, the sample
underrepresents the elderly population of Hispanics in both states. About 85% of Arizonians and
82% of Floridians have a high school degree or higher. Ninety-two percent of the Arizona
sample and 86% of the Florida sample have a high school degree or higher. Therefore, the
sample is slightly more educated.
With respect to marital status, the Arizona and Florida samples approximate the
decennial census estimates. Sixty-one percent of the Arizona sample was married at the time of
the interview whereas 62% of the 60 and older population was married in 2010. About 55% of
the Florida sample self-identified as married compared to 58% of the population. The marital
status percentages vary only slightly between the samples and census estimates. Finally, the
sample is also representative of the Arizona and Florida populations in terms of employment
status. Twenty-one percent of the Arizona sample and 24% of the Florida sample indicated that
they were employed during the interview. Of the 60 years and older population in Arizona and
Florida, 23% and 22% are employed, respectively. In sum, the overall sample includes
respondents that are slightly older, female, white, and educated. These differences are not drastic.
This document is a research report submitted to the U.S. Department of Justice. This report has not been published by the Department. Opinions or points of view expressed are those of the author(s)
and do not necessarily reflect the official position or policies of the U.S. Department of Justice.
40
What is more, the sample is highly representative of the Arizona and Florida populations with
respect to marital and employment status.
Table 2
Sample Characteristics Compared to U.S. Census Estimates
State of Arizona State of Florida
2011 Sample 2010 Census
2011 Sample 2010 Census
Age (mean) 72 70 73 71
Gender
Male 37% 46% 35% 45%
Race/Ethnicity
White 94% 90% 90% 88%
Hispanic 4% 12% 3% 14%
Education
High school + 92% 85% 86% 82%
Marital status
Married 61% 62% 55% 58%
Employment Status
Employed 21% 23% 24% 22%
Note. Gender and race/ethnicity census estimates are derived from the 2010 Decennial Census.
Age, education, marital status, and employment status census percentages are derived from the
2010 American Community Survey one-year estimates.
This document is a research report submitted to the U.S. Department of Justice. This report has not been published by the Department. Opinions or points of view expressed are those of the author(s)
and do not necessarily reflect the official position or policies of the U.S. Department of Justice.
41
Measures
The study includes a variety of measures. The financial exploitation of the elderly in a
consumer context is captured by using various measures that reflect fraud victimization. For
purposes of comparison, a previously used measure of financial exploitation, financial
mistreatment, is also included. Risk factors found to be associated with different forms of
victimization are featured in the analyses. These variables include: daily routine activities,
remote shopping, self-control, trust, health, social support, employment status, among others. A
complete list of measures and their operational definitions are provided below.
Fraud Victimization
The section of the survey that featured the consumer fraud items began with the
following introduction:
Sometimes consumers are misled into giving people money who grossly
misrepresent or never provide goods and services they were promised. The people
who do these things may or may not work for legitimate businesses and may
contact consumers through email, Internet sites, telemarketing, infomercials, and
other ways.
Fraud victimization was captured using a three-step method. First, following the introductory
statement, survey respondents were asked whether anyone had ever tried to defraud them. This
was accomplished by presenting ten different consumer fraud scams to study participants. Each
item representing a specific fraudulent scheme and the appropriate follow-up questions were
administered prior to moving on to the next scam. Previous studies have also used the listing of
specific fraud schemes approach (see, e.g., Titus, Heinzelmann, & Boyle, 1995). This strategy is
helpful in that the exact definition of what constitutes “consumer fraud” is not well understood
This document is a research report submitted to the U.S. Department of Justice. This report has not been published by the Department. Opinions or points of view expressed are those of the author(s)
and do not necessarily reflect the official position or policies of the U.S. Department of Justice.
42
among the general public. The list using in this study was compiled by referencing the web pages
for the Office of the Attorney General in both Arizona and Florida (both released “Top 10”
scams targeting consumers in 2010), and an extensive review of the literature. For organization
purposes, these targeting items in the current project are grouped under six commonly used
headings.
Shopping/Purchasing Fraud. Consumers can be exposed to fraud during the course of
shopping for products and services. For example, a service provider may charge for work that
was promised but not performed. A salesperson may sell a product that does not work as he/she
claimed. Or, someone claiming to represent a legitimate organization may sell a product that is
never delivered. All of these criminal acts fall under the shopping/purchasing fraud heading. The
current study includes three items to determine whether respondents had ever been targeted for
shopping/purchasing fraud:
1. “Has anyone ever tried to get you to pay for repairs to your home, an appliance or
automobile for work that was never performed or was unnecessary?”
2. “Has anyone ever tried to sell you a health, beauty care, weight-loss or other product or
service that did not work as claimed?”
3. “Has anyone ever tried to sell you a phony subscription to magazines or something else?”
Financial Fraud. Fraud perpetrators may target consumers using scams related to credit
repair or business opportunities. Additionally, fraudsters may attempt to trick their potential
victims into providing their credit card and bank account information. The present study includes
three items to determine whether study participants had ever been targeted for financial fraud:
4. “Has anyone tried to trick you into giving them money to improve your financial
situation, like repair credit or get equity out of your home?”
This document is a research report submitted to the U.S. Department of Justice. This report has not been published by the Department. Opinions or points of view expressed are those of the author(s)
and do not necessarily reflect the official position or policies of the U.S. Department of Justice.
43
5. “Has anyone ever tried to get you to invest in a phony business opportunity such as work-
at-home scams?”
6. “Has anyone ever tried to trick you into giving them your financial information, like your
credit card number or bank account information?”
Charity Scam. Another common form of consumer fraud entails the false claim by a
perpetrator that she or he represents a legitimate nonprofit organization and is soliciting
donations on its behalf. One charity scam item was included in the survey to determine whether
respondents were ever targeted for this type of fraud:
7. “Has anyone ever tried to get you to contribute money to a phony charity or religious
organization?”
Prize Notification Fraud. This type of fraud entails informing the target that he or she is
the lucky winner of some type of contest or promotion. The scheme unfolds with the target being
told that he or she needs to pay some type of fee to claim the prize. One prize notification item
was used in the present study to determine whether respondents had been targeted for this type of
fraud:
8. “Has anyone ever tried to get you to pay a fee to claim a phony prize, like a sweepstakes
or vacation?”
Mortgage Rescue Fraud. This type of fraud often targets people who are facing
foreclosure. It comes in a variety of forms, such as charging homeowners high fees for assistance
(which often does not occur) with basic tasks (e.g., making phone calls and filling out
paperwork) that homeowners could easily do themselves. In 2010, the Mortgage Assistance
Relief Services Rule made it illegal to collect fees before homeowners receive and accept a relief
offer from their lenders. To determine whether study participants were targets of mortgage
rescue fraud, the following item was included in the survey:
This document is a research report submitted to the U.S. Department of Justice. This report has not been published by the Department. Opinions or points of view expressed are those of the author(s)
and do not necessarily reflect the official position or policies of the U.S. Department of Justice.
44
9. “Has anyone tried to get you to pay money in advance to reduce your mortgage
payment?”
Identity Theft. Another form of consumer fraud involves the illegally obtaining a target’s
information (e.g., records and identification) and using it to purchase goods and services. One
identity theft survey item was included to determine whether respondents had been targeted in
this way:
10. “Has anyone ever tried to steal your personal information so they could use it to get a
credit card or loan?”
If the respondent answered “yes” to any of these items, a variety of follow-up questions were
asked. Interviewers determined whether the fraud attempt (or most recent attempt if multiple
attempts were reported) took place within the year leading up to the interview, one or two years
prior to the interview, or more than two years before the study. Because of memory decay, data
from two time periods are assessed separately – (1) up to one year prior to the survey; and, (2) up
to two years prior to the survey. If respondents reported that their targeting took place during
these time periods, they are considered a “target” (1 = yes, 0 = no). Finally, if the respondent
indicated that she/he had been targeted during either the one or two year time period, the
interviewer administered questions that were used to determine whether the fraud attempt was
successful (e.g., “How much money did you pay for the repairs?”). Fraud victims are coded 1 (0
= no). Prevalence estimates are provided for all ten types of consumer fraud targeting and
victimization. In the multivariate analysis, however, the fraud targeting and victimization
outcomes reflect whether a respondent responded in the affirmative to any one of the ten items.
Both the targeting and victimization measures are binary coded in the multivariate analysis.
This document is a research report submitted to the U.S. Department of Justice. This report has not been published by the Department. Opinions or points of view expressed are those of the author(s)
and do not necessarily reflect the official position or policies of the U.S. Department of Justice.
45
Financial Mistreatment
The section of the survey that featured the financial mistreatment items began with the
following introduction:
People sometimes illegally use other people’s money or property for their own
benefit. The individuals doing these things could be close to you, like a family
member or friend, or someone you don’t know very well.
Three items that reflect financial mistreatment were included in the survey. Prior research has
Kilpatrick, 2010; Laumann, Leitsch, & Waite, 2008). Much like the consumer fraud items,
follow-up questions were asked to respondents who answered in the affirmative to any of the
three financial exploitation items.
1. “Has anyone ever spent your money or sold something of yours without your
permission?” (spent money or sold something)
2. “Has anyone ever forged your signature without your permission in order to sell your
things or to get money from your accounts?” (forged signature)
3. Has anyone ever stolen your money or taken things for themselves, for their friends, or to
sell?” (stolen money or property)
Self-reports of financial mistreatment are assessed for two different observation periods: (1) the
year prior to the study; and, (2) two years prior to the study. All three of the financial
exploitation items feature a dichotomous response set (1 = yes, 0 = no). The multivariate analysis
will employ an outcome measure where every respondent who answered “yes” one or more of
the three survey items is considered a victim of financial exploitation (coded as 1).1
1 One of the reviewers of the proposal recommended that we include both financial mistreatment
and physical mistreatment measures in the survey. Items similar to Acierno et al. (2010) were
included in the survey. Results for the physical mistreatment items are presented in Appendix A.
This document is a research report submitted to the U.S. Department of Justice. This report has not been published by the Department. Opinions or points of view expressed are those of the author(s)
and do not necessarily reflect the official position or policies of the U.S. Department of Justice.
Reporting Victimization and Mistreatment
The section of the survey that asked about consumer fraud victimization and financial
mistreatment contained two items that asked whether self-reported victims had reported this
experience to authorities. The first item read, “Was the incident reported to the police?” Victims
of consumer fraud and financial mistreatment were also asked whether the incident was
“reported to other authorities.” In the section dealing with consumer fraud, two examples (the
Better Business Bureau and a government agency) of “other authorities” were included in the
wording of the survey item. For financial mistreatment, the provided example of an “other”
authority was “social services.” These individual items featured a binary coded response set (1 =
yes, 0 = no). For the multivariate analyses, the two reporting items (“police” and “other”) are
combined into a single variable that reflects whether victims reported their experience to either
the police, other authorities, or both (1 = yes, 0 = no).
Two additional variables are introduced in the reporting section of the multivariate
analysis. One variable, monetary loss, reflects the approximate amount of money (in dollars) the
victim lost. The original distribution of scores was widely dispersed. As such, scores were
adjusted using the square root transformation. The second variable, stranger assailant, reflects
instances where the perpetrator of financial mistreatment was an unfamiliar person to the victim
(1 = yes, 0 = no).
Program Familiarity
All survey respondents were queried on their familiarity with existing programs that are
designed to help prevent senior citizens from becoming victims of consumer fraud. Floridian
respondents were asked, “How familiar are you with Florida’s Seniors vs. Crime program?”
Floridians were also asked about their state’s Senior Sleuths program. The survey for Arizona
This document is a research report submitted to the U.S. Department of Justice. This report has not been published by the Department. Opinions or points of view expressed are those of the author(s)
and do not necessarily reflect the official position or policies of the U.S. Department of Justice.
47
residents asked about the Agency on Aging and the Senior Sleuths program. The same closed-
ended response set, which ranged from “not familiar” (coded as 1) to “somewhat familiar”
(coded as 2), to “very familiar” (coded as 3), was used for these survey items.
Remote Purchasing
Respondents were queried about the different modes of remote purchasing in the year
leading up to the study. Following the lead of prior researchers (see Holtfreter, Reisig, & Pratt,
2008), participants were asked whether they had done any of the following: (1) purchased
something in response to a telemarketing call from a company with whom they have NOT
previously done business (telemarketing purchase); (2) purchased something from an Internet
web site (online purchase); (3) placed an order for a product by phone, Internet or mail after
seeing a television advertisement or infomercial (infomercial purchase); (4) placed an order for a
product by phone, Internet or mail after receiving an offer in the mail from a company with
whom they have NOT previously done business (mail-order purchase); and (5) placed an order
for a phone, Internet or mail after receiving an email offer from a company with whom they have
NOT previously done business (email-order purchase). Affirmative responses were coded as 1
(0 = otherwise). Next, scores for the five items were summed to create the remote purchasing
routines scale. The scale is coded so that higher scores reflect a greater variety of remote
purchasing activity during the year leading up to the study. The analyses presented below also
assess the impact of individual forms of remote purchasing.
This document is a research report submitted to the U.S. Department of Justice. This report has not been published by the Department. Opinions or points of view expressed are those of the author(s)
and do not necessarily reflect the official position or policies of the U.S. Department of Justice.
48
Routine Activities
This summated scale was constructed using social activity items from the Second
Longitudinal Study on Aging wave 3 survivor survey (Center for Disease Control & Prevention,
2002, p. 18). The items reflect how involved respondents self-reported to be in a number of
activities during the past year.
1. “Participated in social activities away from home?” (outside-home activities)
2. “Got together socially with people who DO NOT live with you, such as friends,
neighbors, and relatives?” (social get-togethers)
3. “Went shopping at grocery, drug, hardware, department or convenience stores?” (street-
side shopping)
4. “Went to a movie, restaurant, club meeting, or other group event?” (entertainment)
5. “Exercised and/or participated in leisure sports?” (leisure sports)
Each item featured a four-point, closed-ended response set that ranged from “never” (coded 1) to
“frequently” (coded 4). This scaled exhibits an adequate level of internal consistency
(Cronbach’s alpha = 0.632; mean inter-item correlation = 0.262). When entered into a principal
components analysis, the five items load on a single latent component (Eigenvalue = 2.103; % of
variance = 42.056; loadings > 0.400).
Low Self-Control
Self-control reflects the ability to regulate one’s behavior. For example, people with self-
control are effectively able to exercise impulse control and delay gratification (Gottfredson &
Hirschi, 1990). Respondents were administered attitudinal self-control items (Tangney,
Baumeister, & Boone, 2004).
This document is a research report submitted to the U.S. Department of Justice. This report has not been published by the Department. Opinions or points of view expressed are those of the author(s)
and do not necessarily reflect the official position or policies of the U.S. Department of Justice.
49
1. “I do certain things that are bad for me, if they are fun.”
2. “I often act without thinking through all the alternatives.”
The closed-ended response sets were anchored from strongly disagree (coded 1) and strongly
agree (coded 4). The correlation coefficient for the two self-control survey items is 0.229 (p <
0.001).
Demographic Variables
Several different demographic variables are included in the current study. Age is the
respondent’s age in years. Five dummy variables are included: Married (1 = yes, 0 = otherwise);
male (1 = yes, 0 = no); racial minority (1 = yes; includes African-Americans, American Indians
and Native Alaskan, Asians, Native Hawaiian and Other Pacific Islander and “other” racial
minorities) and Hispanic (1 = yes) (non-Hispanic whites are coded as 0 and serve as the
reference group); and retired (1 = yes, 0 = otherwise). Finally, education is an ordered
categorical variable: less than high school (coded 1), high school graduate (coded 2), some
college/technical or vocational school (coded 3), college graduate (coded 4), and
graduate/professional school (coded 5).
Statistical Procedures
A variety of univariate, bivariate, and multivariate analyses that reflect the research goals
and objectives will be conducted. The descriptive analyses will focus primarily on nature and
extent of consumer fraud victimization and related outcomes among seniors in Arizona and
Florida. Here, univariate statistics, such as frequencies, will be used to express the prevalence of
different forms of consumer fraud targeting, fraud victimization, financial mistreatment, and
This document is a research report submitted to the U.S. Department of Justice. This report has not been published by the Department. Opinions or points of view expressed are those of the author(s)
and do not necessarily reflect the official position or policies of the U.S. Department of Justice.
50
provide information relating to state programs designed to prevent consumer fraud and assist
victims (e.g., familiarity and contact).
The distribution of consumer fraud-related outcomes will also be assessed across social
groups. These bivariate analyses will provide evidence as to whether socio-demographic
characteristics, such as age, gender, and education, are linked to consumer fraud outcomes. At
this stage in the analysis, cross-tabulations (or contingency tables) will be calculated. The chi-
square test will be used to determine whether any observed differences in the outcomes of
interest between groups are statistically significant. Different measures of association (e.g., phi
and Cramer’s V) will be used to describe the magnitudes of observed relationships (see Miller &
Whitehead, 1996, pp. 355-373). Cross-tabulations will also be used in situations when the
research objective is to understand the relationship between two variables but features of the data
do not allow the reliable estimation of multivariate statistical models.
Multivariate statistical models will be used to evaluate high-order relationships. Put
differently, multiple regression procedures will be used to estimate the relationship between two
key variables while taking into account the effects of other variables, thus helping to control for
spuriousness. Because fraud targeting, fraud victimization, and financial exploitation are binary
response variables (coded 0, 1), logistic regression is used (see Menard, 2002). These analyses
will provide reliable estimates on the factors that amplify or diminish the odds of fraud targeting,
fraud victimization, and financial mistreatment.
Multivariate modeling techniques will also be used to understand the factors associated
with Arizona respondents’ familiarity with the Agency on Aging and Floridian participants’
familiarity with the Seniors vs. Crime program. These analyses will identify which demographic
characteristics are associated with program familiarity. The nature of the program familiarity
This document is a research report submitted to the U.S. Department of Justice. This report has not been published by the Department. Opinions or points of view expressed are those of the author(s)
and do not necessarily reflect the official position or policies of the U.S. Department of Justice.
51
variables (i.e., ordered-categorical and positive skew) necessitates the use of the ordinal
regression model (see Long, 1997).
Finally, in various analyses we estimate multivariate models that make use of nonrandom
subsamples (e.g., victims). This can prove problematic when membership in the subsample is not
independent from the dependent variable. When this is the case, selection bias becomes a
possibility. This statistical problem is commonly dealt with by using two-step modeling
techniques (see, e.g., Berk, 1983). Because the outcome measures (e.g., fraud victimization and
calling the police) are binary response variables (coded 0, 1), the probit regression model with
selection (or “heckprob”) is used. This feature is available in STATA 9.0 (College Station, TX)
(see Miranda & Rabe-Hasketh, 2006).
FINDINGS
Sample Characteristics
Table 3 presents the characteristics for the merged sample (i.e., Arizona and Florida
combined). A majority of the sample is comprised of women (63.7%, n = 1273) and
approximately one-third are men (36.3%, n = 726). The ages of those included in the sample
ranges from 60 to 99 years (average = 72.5 years). Most respondents are married (58.0%, n =
1148), 22.6% (n = 448) are widowed, 14.8% (n = 294) divorced, 1.1% (n = 22) separated, and
3.5% (n = 69) have never been married. With respect to racial composition, a majority of the
sample is White (91.9%, n = 1792). However, the sample contains members from several racial
minority groups: Black/African American (3.5%, n = 69), American Indian or Alaska Native
(1.4%, n = 28), Asian (0.5%, n = 9), Native Hawaiian or Pacific Islander (0.2%, n = 3), and 1.0%
(n = 20) self-identified as “Other.” While interviewers were trained to not list any ethnic groups
as an option when asking respondents about their race, 1.4% (n = 28) of participants self-
This document is a research report submitted to the U.S. Department of Justice. This report has not been published by the Department. Opinions or points of view expressed are those of the author(s)
and do not necessarily reflect the official position or policies of the U.S. Department of Justice.
52
identified their racial category as Hispanic or Latino. Participants were also asked a separate
question about ethnic background. Information from these two survey items show that 3.2% (n =
62) of the sample is of Hispanic or Latino ethnic origin.
As would be expected, most participants are retired (73.3%, n = 1453) but 12.4% (n =
245) are working full-time, 9.6% (n = 191) working part-time, and 3.4% (n = 68) unemployed.
Some respondents self-identified as being “homemakers” when asked about their employment
status (1.2%, n = 24).On the whole, the sample is relatively well educated: 27.2% are college
graduates (n = 536), 28.6% have some college education (n = 565), and 17.7% have graduated
high school (or received an equivalent degree) (n = 350). Additionally, 13.1% of respondents
have a graduate or professional degree (n = 258), and 2.4% attended a technical or vocational
school (n = 48). A small portion of the sample only completed a portion of high school (9.5%, n
= 188) or received some grade school education (1.4%, n = 28). With respect to living
conditions, a majority of respondents self-identify as living in a house (77.2%, n = 1526). Some
respondents live in condominiums (8.2%, n = 162), mobile homes (7.3%, n = 144), apartments
(3.0%, n = 60), and duplexes (1.4%, n =27). A small portion of the sample report residing in
some type of supervised living facility, such as a retirement home (1.2%, n = 24), an assisted
living facility (0.3%, n = 6), a nursing or rest home (0.1%, n = 2), and supervised apartment
(0.1%, n = 1).
This document is a research report submitted to the U.S. Department of Justice. This report has not been published by the Department. Opinions or points of view expressed are those of the author(s)
and do not necessarily reflect the official position or policies of the U.S. Department of Justice.
53
Table 3
Sample Characteristics
Variable Categories or Range N % or Mean
State Arizona 1000 50.0
Florida 1000 50.0
Gender Female 1273 63.7
Male 726 36.3
Age (mean) Min = 60 1891 72.5
Max = 99
Marital Status Married 1148 58.0
Widowed 448 22.6
Divorced 294 14.8
Separated 22 1.1
Never married 69 3.5
Race White 1792 91.9
Black/African American 69 3.5
American Indian/Alaska Native 28 1.4
Asian 9 0.5
Native Hawaiian/Pacific Islander 3 0.2
Other 20 1.0
Hispanic/Latino 28 1.4
Ethnicity (Hispanic/Latino) No 1933 96.8
Yes 63 3.2
Employment Status Working full-time 245 12.4
Working part-time 191 9.6
Retired 1453 73.3
Unemployed 68 3.4
Homemaker 24 1.2
Education Some grade school 28 1.4
Some high school 188 9.5
High school graduate/equivalent 350 17.7
Technical/vocational school 48 2.4
Some college 565 28.6
College graduate 536 27.2
Graduate/professional school 258 13.1
Living conditions House 1526 77.2
Condominium 162 8.2
Apartment 60 3.0
Duplex 27 1.4
Mobile home 144 7.3
Retirement home 24 1.2
Supervised apartment 1 0.1
Assisted living facility 6 0.3
Nursing/rest home 2 0.1
Other 24 1.2
Number of people in household
(mean)
Min = 1
Max = 10
1944 1.86
Children living at home No 1791 90.0
Yes 199 10.0
Respondent lives alone No 1302 67.0
Yes 642 33.0
Note. Percentages may not sum to 100 because of rounding.
This document is a research report submitted to the U.S. Department of Justice. This report has not been published by the Department. Opinions or points of view expressed are those of the author(s)
and do not necessarily reflect the official position or policies of the U.S. Department of Justice.
The Nature and Prevalence of Consumer Fraud Targeting and Victimization
Fraud Targeting and Victimization
We begin with an examination of fraud targeting and victimization prevalence estimates
(see Table 4). The discussion focuses primarily on the one-year observation period. Table 4
reveals that nearly six out of every 10 respondents were targeted by a fraud attempt during the
year prior to the study (59.8%; or 1066 of the 1784 respondents for whom data are available).
Therefore, fraud targeting is more common in this sample of elderly people compared to samples
of adults 18 years of age and older where prevalence estimates have been shown to range from
15% to 31% (Anderson, 2004; Holtfreter et al., 2008; Titus et al., 1995). The results also
demonstrate that 13.6% of the sample was a fraud victim during the past year (or 211 of the 1553
respondents for whom data are available). This result is similar to fraud victimization prevalence
estimates observed in national samples of adults (Anderson, 2004; Titus et al., 1995). Another
way to examine the data is to consider the prevalence of fraud victimization among only those
individuals that were targeted by fraud attempts (not reported in Table 4). The data indicate that
the prevalence of fraud victimization among the targeted subsample is 25.3%. While the same
pattern of results is observed during the two-year observation period, not surprisingly the
prevalence of fraud targeting and victimization is higher during this period. With the prevalence
of fraud targeting and victimization among this sample established, the following sections
explore the specific types of fraud.
This document is a research report submitted to the U.S. Department of Justice. This report has not been published by the Department. Opinions or points of view expressed are those of the author(s)
and do not necessarily reflect the official position or policies of the U.S. Department of Justice.
55
Table 4
Prevalence of Fraud Targeting and Victimization
Past year Past 2 years
N % N %
Fraud targeting Yes 1066 59.8 1225 67.4
No 718 40.2 593 32.6
Fraud victimization Yes 211 13.6 301 19.1
No 1342 86.4 1273 80.9
Shopping/Purchasing Fraud
The prevalence of shopping/purchasing fraud targeting is provided for two time periods
(i.e., 1 and 2 years) in Table 5. The discussion will focus primarily on the results for the one-year
observation period. Of the three specific types of shopping/purchasing fraud targeting, the most
common is having someone attempt to sell a phony subscription to a magazine or something
else. Approximately 10% of the sample (or 189 of the 1875 respondents for whom data are
available) report this fraud-related experience in the year leading up to the study. Less common
are instances where someone tried to sell participants something that did not work as claimed
(8.7%) and someone trying to get respondents to pay for unnecessary repairs (5.3%). Finally, it is
worth noting that this general pattern of targeting frequency is also observed at the two-year time
period.
This document is a research report submitted to the U.S. Department of Justice. This report has not been published by the Department. Opinions or points of view expressed are those of the author(s)
and do not necessarily reflect the official position or policies of the U.S. Department of Justice.
56
Table 5
Prevalence of Shopping/Purchasing Fraud Targeting
Past year Past 2 years
N % N %
Unnecessary or never performed repairs Yes 104 5.3 156 8.0
No 1857 94.7 1805 92.0
Product or service did not work Yes 168 8.7 216 11.2
No 1764 91.3 1716 88.8
Phony subscription Yes 189 10.1 251 13.4
No 1686 89.9 1624 86.6
The distributions for the initial modes of contact for the three types of
shopping/purchasing fraud targeting are presented in Table 6. Note that the same mode of
contact—the telephone—was most prevalent for all three types (33% for unnecessary repairs,
30% for product that did not work, and 27.7% for phony subscription). Regarding unnecessary
repairs, a sizable portion of participants report that they were also targeted after having someone
come to their home (presumably a repair technician of some type) (17.7%). Mail advertisements
were most frequently a mode of targeting for attempting to sell products or services that did not
work as reported (17.5%). Not surprisingly, respondents also reported that having someone come
to their home was a common way of trying to cajole them to pay for a phony subscription
(24.5%).
This document is a research report submitted to the U.S. Department of Justice. This report has not been published by the Department. Opinions or points of view expressed are those of the author(s)
and do not necessarily reflect the official position or policies of the U.S. Department of Justice.
57
Table 6
Mode of Contact for Shopping/Purchasing Fraud Targeting
Past year Past 2 years
N % N %
Unnecessary or never performed repairs
Web site 2 2.1 2 1.4
Email 1 1.0 1 0.7
TV ad or infomercial 0 0.0 0 0.0
Mail advertisement 6 6.3 9 6.3
Telephone 33 34.4 46 31.9
Store visited 10 10.4 22 15.3
Someone came to home 17 17.7 28 19.4
Radio advertisement 0 0.0 0 0.0
Poster or flier 0 0.0 3 2.1
Magazine/newspaper ad 0 0.0 0 0.0
A bill received 0 0.0 0 0.0
Other 27 28.1 33 22.9
Product or service did not work
Web site 19 11.9 22 10.6
Email 14 8.8 16 7.7
TV ad or infomercial 16 10.0 23 11.1
Mail advertisement 28 17.5 36 17.4
Telephone 48 30.0 66 31.9
Store visited 5 3.1 5 2.4
Someone came to home 6 3.8 6 2.9
Radio advertisement 2 1.3 2 1.4
Poster or flier 1 0.6 2 1.0
Magazine/newspaper ad 5 3.1 7 3.4
A bill received 0 0.0 0 0.0
Other 16 10.0 21 10.1
Phony subscription
Web site 6 3.3 7 2.9
Email 14 7.6 16 6.6
TV ad or infomercial 0 0.0 0 0.0
Mail advertisement 42 22.8 50 20.5
Telephone 51 27.7 65 26.6
Store visited 1 0.5 2 0.8
Someone came to home 45 24.5 73 29.9
Radio advertisement 0 0.0 0 0.0
Poster or flier 0 0.0 1 0.4
Magazine/newspaper ad 2 1.1 2 0.8
A bill received 2 1.1 2 0.8
Other 21 11.4 26 10.7
This document is a research report submitted to the U.S. Department of Justice. This report has not been published by the Department. Opinions or points of view expressed are those of the author(s)
and do not necessarily reflect the official position or policies of the U.S. Department of Justice.
58
Two interesting patterns emerge in the results regarding reporting fraud targeting to
authorities featured in Table 7. First, law enforcement officials are rarely made aware of
instances of shopping/purchasing fraud targeting. Participants most frequently called the police
when they were targeted for phony subscription fraud (7.5%; or 14 of 187 targeted respondents
for whom data are available), followed by repair fraud (4.9%; or 5 of 103 targeted respondents),
and product/service that did not work (3.0%; or 5 of 168 targeted respondents). The second
interesting feature is that survey respondents appear to be more willing to contact other
authorities, such as the Better Business Bureau or a government agency.
Table 7
Reporting of Shopping/Purchasing Fraud Targeting to Authorities
Past year Past 2 years
N % N %
Unnecessary or never performed repairs
Reported to police Yes 5 4.9 10 6.5
No 98 95.1 145 93.5
Reported to other authorities Yes 9 8.8 17 11.2
No 93 91.2 135 88.8
Product or service did not work
Reported to police Yes 5 3.0 7 3.2
No 163 97.0 209 96.8
Reported to other authorities Yes 11 6.6 18 8.4
No 156 93.4 197 91.6
Phony subscription
Reported to police Yes 14 7.5 19 7.6
No 173 92.5 230 92.4
Reported to other authorities Yes 14 7.6 20 8.1
No 171 92.4 227 91.9
This document is a research report submitted to the U.S. Department of Justice. This report has not been published by the Department. Opinions or points of view expressed are those of the author(s)
and do not necessarily reflect the official position or policies of the U.S. Department of Justice.
59
The prevalence of shopping/purchasing fraud victimization is provided in Table 8. Two findings
require discussion. First, the most common form of shopping/purchasing fraud involves paying
for a product or service that does not work as promised. This form of victimization was reported
by 3.5% of the sample (or 68 of the 1932 respondents for whom data are available). A smaller
percentage of the sample reported repair fraud victimization (1.2%; or 23 of 1960 respondents)
and phony subscription fraud (1.1%; or 21 of 1875 respondents). Second, the relative frequencies
of consumer fraud victimization are consistent across the two observation periods. The median
dollar loss for each type of fraud victimization (1 year time period) is as follows: $225 for repair
fraud, $67 for product/service fraud, and $30 for phony subscription fraud.
Table 8
Prevalence of Shopping/Purchasing Fraud Victimization
Past year Past 2 years
N % N %
Unnecessary or never performed repairs Yes 23 1.2 40 2.0
No 1937 98.8 1920 98.0
Product or service did not work Yes 68 3.5 92 4.8
No 1864 96.5 1840 95.2
Phony subscription Yes 21 1.1 33 1.8
No 1854 98.9 1842 98.2
Another way to use the victimization data is to consider the percentage of those targeted
for the different forms of shopping/purchasing fraud that ultimately became victims. Those who
were exposed to opportunities to purchase products/services that did not perform as advertised
were most likely to be victimized (40.5%; or 68 of 168 targeted respondents for whom data are
available), followed by unnecessary or never performed repairs (22.1%; or 23 of 104 targeted
respondents), and phony subscription (11.1%; or 21 of 189 targeted respondents).
This document is a research report submitted to the U.S. Department of Justice. This report has not been published by the Department. Opinions or points of view expressed are those of the author(s)
and do not necessarily reflect the official position or policies of the U.S. Department of Justice.
60
In Table 9, the reporting data for shopping/purchasing fraud victimization are presented.
Once again, it is clear that reporting incidents involving fraud-related matters to authorities is not
the norm. However, differences between the types of shopping/purchasing fraud are observed.
Respondents who reported being the victims of phony subscription fraud were most likely to
report their victimization to the police (15%; or 3 of 20 victims for whom data are available).
Individuals on the receiving end of unnecessary repairs or those who paid for repairs that were
never performed most frequently reported their incidence to other authorities, such as the Better
Business Bureau (19%; or 4 of 21 victims). With but one exception (i.e., phony subscription
fraud at the one year time period), the results show that survey respondents more frequently
contacted authorities other than the police to report their victimization.
Table 9
Reporting of Shopping/Purchasing Fraud Victimization to Authorities
Past year Past 2 years
N % N %
Unnecessary or never performed repairs
Reported to police Yes 2 9.5 4 10.0
No 19 90.5 36 90.0
Reported to other authorities Yes 4 19.0 9 22.5
No 17 81.0 31 77.5
Product or service did not work
Reported to police Yes 1 1.5 3 3.3
No 67 98.5 89 96.7
Reported to other authorities Yes 3 4.5 8 8.8
No 64 95.5 83 91.2
Phony subscription
Reported to police Yes 3 15.0 3 9.4
No 17 85.0 29 90.6
Reported to other authorities Yes 3 14.3 4 12.1
No 18 85.7 29 87.9
This document is a research report submitted to the U.S. Department of Justice. This report has not been published by the Department. Opinions or points of view expressed are those of the author(s)
and do not necessarily reflect the official position or policies of the U.S. Department of Justice.
Financial Fraud
Table 10 features the prevalence of financial fraud targeting for one and two year periods.
Having someone attempt to trick an individual into providing personal financial information was
the most common type of financial fraud targeting. More than 16% of the sample (or 319 of the
1944 respondents for whom data are available) reported being targeted in this way during the
year prior to the study. Fewer participants have experienced someone trying to trick them into
giving money to improve their financial situation (10.8%; or 212 of 1970 respondents) or trying
to get them to invest in a phony business opportunity such as a work-at-home scam (8.8%; or
173 of 1969 respondents). Importantly, this pattern of results is mirrored during the two-year
observation period.
Table 10
Prevalence of Financial Fraud Targeting
Past year Past 2 years
N % N %
Pay to improve finances Yes 212 10.8 255 12.9
No 1758 89.2 1715 87.1
Phony business opportunity Yes 173 8.8 217 11.0
No 1796 91.2 1752 89.0
Trick to get financial information Yes 319 16.4 413 21.2
No 1625 83.6 1531 78.8
Table 11 features the distributions of each mode of contact used to target the respondents for the
three types of financial fraud. Telephone was the mode of contact used most often to attempt to
get participants to pay money to improve their financial situations (44.2%) and trick them into
providing financial information (42.8%). With respect to improving finances, approximately
This document is a research report submitted to the U.S. Department of Justice. This report has not been published by the Department. Opinions or points of view expressed are those of the author(s)
and do not necessarily reflect the official position or policies of the U.S. Department of Justice.
62
one-quarter of the targeted sample was contacted via email, 15% by mail advertisements, and
10% by web sites. Contact by way of email (30.4%) and web sites (17.6%) were also relatively
common for attempts to get participants to provide personal financial information to unknown
individuals. Regarding phony business opportunities, email (32.7%), telephone (29.8), and web
sites (23.4%) were the most prevalent modes of targeting. Overall, respondents were targeted by
would-be financial fraudsters most often through telephone, email, and web sites. It is worth
noting that this general pattern of mode of contact was also observed for the two-year time
period.
Information on how frequently instances of financial fraud targeting were reported to
authorities is provided in Table 12. Similar to the pattern of results observed for
shopping/purchasing fraud (see Table 7), an overwhelming majority of respondents who were
targeted for financial fraud did not report the offenses to the police. Notably, individuals who
had someone try to trick them into providing financial information were the most likely to report
the fraud attempt to law enforcement (13.5%; or 43 of 318 targeted respondents for whom data
are available). Of the participants who had someone attempt to get them to pay money to
improve their finances, approximately 9% informed the police about the fraud attempt (or 20 of
212 targeted respondents). Reporting to law enforcement was least common in instances where
someone attempted to get respondents to invest in a phony business venture (7.6%; or 13 of the
172 targeted respondents). Other authorities, such as the Better Business Bureau or a government
agency, were more likely to be made aware of all three types of financial fraud targeting. In fact,
more than 22% of the sample (or 70 of the 314 targeted respondents) who had someone attempt
to obtain their financial information reported that they contacted other authorities.
This document is a research report submitted to the U.S. Department of Justice. This report has not been published by the Department. Opinions or points of view expressed are those of the author(s)
and do not necessarily reflect the official position or policies of the U.S. Department of Justice.
63
Table 11
Mode of Contact for Financial Fraud Targeting
Past year Past 2 years
N % N %
Pay to improve finances
Web site 20 9.6 22 8.8
Email 51 24.5 55 22.0
TV ad or infomercial 2 1.0 5 2.0
Mail advertisement 32 15.4 36 14.4
Telephone 92 44.2 114 45.6
Store visited 0 0.0 0 0.0
Someone came to home 1 0.5 3 1.2
Radio advertisement 1 0.5 1 0.4
Poster or flier 1 0.5 2 0.8
Magazine/newspaper ad 0 0.0 1 0.4
A bill received 0 0.0 0 0.0
Other 8 3.8 11 4.4
Phony business opportunity
Web site 40 23.4 48 22.5
Email 56 32.7 65 30.5
TV ad or infomercial 1 0.6 1 0.5
Mail advertisement 6 3.5 14 6.6
Telephone 51 29.8 60 28.2
Store visited 0 0.0 0 0.0
Someone came to home 3 1.8 5 2.3
Radio advertisement 2 1.2 2 0.9
Poster or flier 2 1.2 2 0.9
Magazine/newspaper ad 1 0.6 2 0.9
A bill received 0 0.0 0 0.0
Other 9 5.3 14 6.6
Trick to get financial information
Web site 55 17.6 65 16.3
Email 95 30.4 114 28.5
TV ad or infomercial 3 1.0 3 0.8
Mail advertisement 10 3.2 13 3.3
Telephone 134 42.8 183 45.8
Store visited 2 0.6 3 0.8
Someone came to home 1 0.3 3 0.8
Radio advertisement 0 0.0 0 0.0
Poster or flier 1 0.3 1 0.3
Magazine/newspaper ad 1 0.3 1 0.3
A bill received 3 1.0 3 0.8
Other 8 2.6 11 2.8
This document is a research report submitted to the U.S. Department of Justice. This report has not been published by the Department. Opinions or points of view expressed are those of the author(s)
and do not necessarily reflect the official position or policies of the U.S. Department of Justice.
64
Table 12
Reporting of Financial Fraud Targeting to Authorities
Past year Past 2 years
N % N %
Pay to improve finances
Reported to police Yes 20 9.4 28 11.0
No 192 90.6 226 89.0
Reported to other authorities Yes 25 12.0 35 14.1
No 183 88.0 214 85.9
Phony business opportunity
Reported to police Yes 13 7.6 15 7.0
No 159 92.4 200 93.0
Reported to other authorities Yes 20 11.7 25 11.6
No 151 88.3 190 88.4
Trick to get financial information
Reported to police Yes 43 13.5 55 13.4
No 275 86.5 354 86.6
Reported to other authorities Yes 70 22.3 93 22.9
No 244 77.7 314 77.1
Findings on the prevalence of financial fraud victimization among study participants are
presented in Table 13. Several observations require discussion. First, all three types of financial
fraud victimization are rare. Second, the most frequently reported form of financial fraud
victimization was being tricked into giving one’s personal financial information to an unknown
person (0.8%; or 15 of the 1943 respondents for whom data are available). A smaller percentage
of participates reported that they invested in a phony business opportunity (0.5%; or 9 of the
1968 respondents) or were tricked into paying money to improve their finances (0.4%; or 8 of
the 1970 respondents). Finally, the median dollar loss was highest for investing in a phony
business ($6,248), followed by paying someone to improve finances ($580). The lowest median
This document is a research report submitted to the U.S. Department of Justice. This report has not been published by the Department. Opinions or points of view expressed are those of the author(s)
and do not necessarily reflect the official position or policies of the U.S. Department of Justice.
65
dollar loss was incurred by victims who were tricked into providing their financial information
($38).
What percentage of respondents targeted for financial fraud were actually victimized?
The data show that financial fraud targets were rarely victims. During the one-year observation
period, people who were presented with the opportunity to invest in a phony business were most
likely to be victimized (5.2%; or 9 of 173 targeted respondents for whom data are available),
followed closely by being tricked into providing financial information (4.7%; or 15 of 319
targeted respondents), and paying to improve one’s financial situation (3.8%; or 8 of 212
targeted respondents).
Table 13
Prevalence of Financial Fraud Victimization
Past year Past 2 years
N % N %
Pay to improve finances Yes 8 0.4 11 0.6
No 1962 99.6 1958 99.4
Phony business opportunity Yes 9 0.5 10 0.5
No 1959 99.5 1958 99.5
Trick to get financial information Yes 15 0.8 22 1.1
No 1928 99.2 1920 98.9
Reporting frequencies among victims of financial fraud are presented in Table 14. As was
the case with financial fraud targeting, victims rarely notify the authorities about their
experiences. At the same time, several observations emerge that require discussion. Of the three
financial fraud offenses, the police were notified most frequently when participants were tricked
into providing their financial information to someone (37.5%; or 3 of 8 victims for whom data
This document is a research report submitted to the U.S. Department of Justice. This report has not been published by the Department. Opinions or points of view expressed are those of the author(s)
and do not necessarily reflect the official position or policies of the U.S. Department of Justice.
66
are available). With respect to investing in phony business opportunities, about 22% (or 2 of 9
victims) contacted law enforcement. Respondents who were tricked into providing their financial
information to someone were least likely to contact the police (13.3%; or 2 of 15 victims).
Interestingly, however, victims of this type of financial fraud were most likely to contact other
authorities, such as the Better Business Bureau (42.9%; or 6 of 14 victims). Along these lines,
the results show that survey respondents who paid to improve their finances or invested in sham
businesses contacted the police and other authorities at relatively similar frequencies. However,
respondents that were tricked into providing their financial information were more likely to
contact authorities other than law enforcement.
Table 14
Reporting of Financial Fraud Victimization to Authorities
Past year Past 2 years
N % N %
Pay to improve finances
Reported to police Yes 3 37.5 3 27.3
No 5 62.5 8 72.7
Reported to other authorities Yes 2 25.0 3 27.3
No 6 75.0 8 72.7
Phony business opportunity
Reported to police Yes 2 22.2 2 20.0
No 7 77.8 8 80.0
Reported to other authorities Yes 2 22.2 2 20.0
No 7 77.8 8 80.0
Trick to get financial information
Reported to police Yes 2 13.3 5 22.7
No 13 86.7 17 77.3
Reported to other authorities Yes 6 42.9 8 38.1
No 8 57.1 13 61.9
This document is a research report submitted to the U.S. Department of Justice. This report has not been published by the Department. Opinions or points of view expressed are those of the author(s)
and do not necessarily reflect the official position or policies of the U.S. Department of Justice.
67
Other Types of Consumer Fraud
Table 15 presents the prevalence of four additional types of consumer fraud targeting.
The discussion of the findings will focus on the one-year observation period. Having someone
attempt to get them to pay to claim a phony prize and contribute money to a phony charity or
religious organization were the two most common types of consumer fraud targeting in Table 15.
Approximately 24% (or 461 of the 1951 respondents for whom data are available) of the sample
had an individual try to get them to pay money in order to claim a phony prize such as a
vacation. Additionally, about 22% (or 386 of the 1781 respondents) of participants reported that
someone tried to get them to contribute money to a phony charity or religious organization.
Fewer respondents experienced an attempt to steal their personal information (7.3%; or 137 of
1881 respondents) or to pay money in advance to reduce mortgage payments (5.8%; or 115 of
1972 respondents). The same general pattern of results was observed for the two-year
observation period.
Table 15
Prevalence of Other Types of Consumer Fraud Targeting
Past year Past 2 years
N % N %
Phony charity or religious organization Yes 386 21.7 458 25.7
No 1395 78.3 1323 74.3
Pay to claim phony prize Yes 461 23.6 556 28.5
No 1490 76.4 1395 71.5
Reduce mortgage payments Yes 115 5.8 130 6.6
No 1857 94.2 1842 93.4
Steal personal information Yes 137 7.3 201 10.7
No 1744 92.4 1680 89.3
This document is a research report submitted to the U.S. Department of Justice. This report has not been published by the Department. Opinions or points of view expressed are those of the author(s)
and do not necessarily reflect the official position or policies of the U.S. Department of Justice.
68
Table 16 features frequencies for the modes of contact used for each of the four types of
consumer fraud. Survey respondents were contacted by would-be fraudsters most frequently by
telephone during the year leading up to the study (59.2% for phony charity or religious
organization, 36.3% for phony prize, 54.4% for reduce mortgage payments, and 35.2% for steal
personal information). Mail advertisements were also used to target a large portion of the sample
for fraud schemes involving a phony charity or religious organization (17.5%), paying to claim a
phony prize (25.1%), and paying money in advance to reduce mortgage payments (20.2%).
Given increased computer usage among the elderly in recent years, it is not surprising that
approximately 24% of the sample were contacted via email by someone attempting to persuade
them to pay money to claim a phony prize. With respect to having someone try to steal personal
information to get a credit card or a loan, about 30% of the sample reported that they were
contacted through some “other” method. The general pattern of results was consistent across the
two observation periods.
Table 17 presents distributions for reporting each of the consumer fraud targeting types to
authorities. Several observations are worth noting. First, consistent with the other forms of
consumer fraud discussed previously, the authorities were rarely notified about these four types
of fraud. Law enforcement was contacted most frequently by individuals who had a person
attempt to steal their personal information (24.8%; or 30 of 121 targeted respondents for whom
data are available). It appears that this type of consumer fraud attempt was viewed as more
serious by respondents because they contacted the police at a much greater frequency than the
other types of consumer fraud. In fact, only 6.6% of respondents who had someone try to
persuade them to contribute money to a phony charity or religious organization, 5.9% of
participants who experienced someone try to entice them into paying to claim a phony prize, and
This document is a research report submitted to the U.S. Department of Justice. This report has not been published by the Department. Opinions or points of view expressed are those of the author(s)
and do not necessarily reflect the official position or policies of the U.S. Department of Justice.
69
3.5% of people who had an individual attempt to swindle them into paying money in advance to
reduce their mortgage payments reported their experiences to the police. Survey respondents
were more likely to contact other authorities, such as the Better Business Bureau, when someone
tried to get them to pay money to claim a prize (9%) or reduce mortgage payments (9.6%).
Additionally, even with people contacting law enforcement officials with relative frequency
when someone attempts to steal their personal information, respondents were still more likely to
contact other authorities (29.6%). However, elderly people are almost equally likely to notify the
police and other authorities when someone tries to coax them into contributing to a phony charity
(6.6% and 6.9%, respectively).
Table 18 provides the prevalence of the other types of consumer fraud victimization. The
most common form of consumer fraud victimization involves having personal information stolen
(2.7%; or 50 of the 1872 respondents for whom data are available). Fraud victimization resulting
from contributing money to phony charities followed closely behind (2.6%; or 47 of the 1777
respondents). A relatively small percentage of survey respondents reported being a victim of
paying money to claim a phony prize (0.5%; or 9 of the 1951 respondents) or reduce mortgage
payments in advance (0.2%; or 3 of the 1972 respondents). This pattern of results is consistent
across the two observation periods. The median dollar loss between each type of consumer fraud
varies from $20 (contributing to a phony charity or religious organization) to $700 (paying to
reduce mortgage payments). The median dollar loss associated with being a victim of a phony
prize scam was $219, and $200 for victimization relating to having personal information stolen.
This document is a research report submitted to the U.S. Department of Justice. This report has not been published by the Department. Opinions or points of view expressed are those of the author(s)
and do not necessarily reflect the official position or policies of the U.S. Department of Justice.
Table 16
Mode of Contact for Other Types of Consumer Fraud Targeting
Past year Past 2 years
N % N %
Phony charity or religious organization
Web site 17 4.5 19 4.3
Email 27 7.2 29 6.5
TV ad or infomercial 6 1.6 7 1.6
Mail advertisement 66 17.5 81 18.2
Telephone 223 59.2 262 58.7
Store visited 3 0.8 4 0.9
Someone came to home 19 5.0 25 5.6
Radio advertisement 0 0.0 0 0.0
Poster or flier 2 0.5 2 0.4
Magazine/newspaper ad 0 0.0 0 0.0
A bill received 1 0.3 1 0.2
Other 13 3.4 16 3.6
Pay to claim phony prize
Web site 52 11.4 56 10.2
Email 108 23.7 125 22.8
TV ad or infomercial 4 0.9 4 0.7
Mail advertisement 114 25.1 146 26.6
Telephone 165 36.3 204 37.2
Store visited 0 0.0 1 0.2
Someone came to home 3 0.7 3 0.5
Radio advertisement 0 0.0 0 0.0
Poster or flier 1 0.2 1 0.2
Magazine/newspaper ad 1 0.2 1 0.2
A bill received 0 0.0 0 0.0
Other 7 1.5 8 1.5
Reduce mortgage payments
Web site 10 8.8 13 10.2
Email 9 7.9 11 8.6
TV ad or infomercial 0 0.0 0 0.0
Mail advertisement 23 20.2 25 19.5
Telephone 62 54.4 68 53.1
Store visited 0 0.0 0 0.0
Someone came to home 2 1.8 2 1.6
Radio advertisement 0 0.0 0 0.0
Poster or flier 1 0.9 1 0.8
Magazine/newspaper ad 0 0.0 0 0.0
A bill received 0 0.0 0 0.0
Other 7 6.1 8 6.3
Steal personal information
Web site 8 7.6 15 9.3
Email 7 6.7 11 6.8
TV ad or infomercial 0 0.0 0 0.0
Mail advertisement 7 6.7 9 5.6
Telephone 37 35.2 51 31.7
Store visited 2 1.9 4 2.5
Someone came to home 3 2.9 5 3.1
Radio advertisement 0 0.0 0 0.0
Poster or flier 1 1.0 1 0.6
Magazine/newspaper ad 2 1.9 2 1.2
A bill received 7 6.7 14 8.7
Other 31 29.5 49 30.4
This document is a research report submitted to the U.S. Department of Justice. This report has not been published by the Department. Opinions or points of view expressed are those of the author(s)
and do not necessarily reflect the official position or policies of the U.S. Department of Justice.
71
Table 17
Reporting of Other Types of Consumer Fraud Targeting to Authorities
Past year Past 2 years
N % N %
Phony charity or religious organization
Reported to police Yes 25 6.6 27 6.0
No 353 93.4 421 94.0
Reported to other authorities Yes 26 6.9 33 7.4
No 350 93.1 413 92.6
Pay to claim a phony prize
Reported to police Yes 27 5.9 41 7.4
No 431 94.1 512 92.6
Reported to other authorities Yes 41 9.0 55 10.0
No 417 91.0 496 90.0
Reduce mortgage payments
Reported to police Yes 4 3.5 5 3.8
No 111 96.5 125 96.2
Reported to other authorities Yes 11 9.6 11 8.5
No 104 90.4 119 91.5
Steal personal information
Reported to police Yes 30 24.8 55 30.7
No 91 75.2 124 69.3
Reported to other authorities Yes 34 29.6 57 33.3
No 81 70.4 114 66.7
Table 18
Prevalence of Other Types of Consumer Fraud Victimization
Past year Past 2 years
N % N %
Phony charity or religious organization Yes 47 2.6 59 3.3
No 1730 97.4 1717 96.7
Pay to claim phony prize Yes 9 0.5 11 0.6
No 1942 99.5 1940 99.4
Reduce mortgage payments Yes 3 0.2 3 0.2
No 1969 99.8 1972 99.8
Steal personal information Yes 50 2.7 78 4.2
No 1822 97.3 1791 95.8
This document is a research report submitted to the U.S. Department of Justice. This report has not been published by the Department. Opinions or points of view expressed are those of the author(s)
and do not necessarily reflect the official position or policies of the U.S. Department of Justice.
72
As for the percentage of targeted respondents who actually became consumer fraud
victims, the highest percentage involved stolen personal information (36.5%; or 50 of 137
targeted respondents for data are available). Clearly, this offense is difficult to protect oneself
against. The second most frequent type of victimization was contributing money to a phony
charity or religious organization (12.2%; or 47 of 386 targeted respondents), followed by paying
money in advance to reduce mortgage payments (2.6%; or 3 of 115 targeted respondents), and
paying to claim a phony prize (0.9%; or 9 of 461 targeted respondents).
The distributions of reporting for the different type of consumer fraud victimization
experiences are provided in Table 19. Four findings emerge. First, respondents who reported
having their personal information stolen were most likely to report their victimization to the
police (29.8%; or 14 of the 47 victims for whom data are available) and other authorities (35.4%;
or 17 of the 48 victims). Second, a majority of the sample who was tricked into paying to claim a
fake prize reported their victimization to other authorities (55.6%; or 5 of the 9 victims). One-
third of victims of this type of consumer fraud notified the police. This same pattern of results is
observed for survey respondents who reported paying money in advance to reduce their
mortgages, with 33.3% informing the police (or 1 of the 3 victims) and 66.7% contacting other
authorities (or 2 of the 3 victims). Finally, participants who were deceived into contributing
money to a bogus charity or religious organization infrequently reported their victimization to
the police (4.5%; or 2 of the 44 victims) or other authorities (6.7%; or 3 of the 45 victims).
This document is a research report submitted to the U.S. Department of Justice. This report has not been published by the Department. Opinions or points of view expressed are those of the author(s)
and do not necessarily reflect the official position or policies of the U.S. Department of Justice.
73
Table 19
Reporting of Other Types of Consumer Fraud Victimization to Authorities
Past year Past 2 years
N % N %
Phony charity or religious organization
Reported to police Yes 2 4.5 3 5.4
No 42 95.5 53 94.6
Reported to other authorities Yes 3 6.7 5 8.8
No 42 93.3 52 91.2
Pay to claim a phony prize
Reported to police Yes 3 33.3 3 27.3
No 6 66.7 8 72.7
Reported to other authorities Yes 5 55.6 5 45.5
No 4 44.4 6 54.5
Reduce mortgage payments
Reported to police Yes 1 33.3 1 33.3
No 2 66.7 2 66.7
Reported to other authorities Yes 2 66.7 2 66.7
No 1 33.3 1 33.3
Steal personal information
Reported to police Yes 14 29.8 30 41.1
No 33 70.2 43 58.9
Reported to other authorities Yes 17 35.4 32 43.2
No 31 64.6 42 56.8
The Nature and Prevalence of Financial Mistreatment
Financial Mistreatment
The overall prevalence of financial mistreatment in the sample during the year leading up
to the study was 5.6% (or 108 of the 1943 respondents for whom data are available). This finding
is nearly identical to the prevalence of financial mistreatment observed by Acierno and
colleagues’ (2009) nationally representative sample of elderly people (5.2%). Not surprisingly,
the prevalence of financial mistreatment for the two-year observation period was higher. During
this period 8.4% of the sample reported being a victim of financial mistreatment (see Table 20).
This document is a research report submitted to the U.S. Department of Justice. This report has not been published by the Department. Opinions or points of view expressed are those of the author(s)
and do not necessarily reflect the official position or policies of the U.S. Department of Justice.
Table 20
Prevalence of Financial Mistreatment
Past year Past 2 years
N % N %
Financial mistreatment Yes 108 5.6 164 8.4
No 1835 94.4 1781 91.6
Specific Forms of Financial Mistreatment
The prevalence of the specific forms of financial mistreatment is presented in Table 21.
The most common type of financial mistreatment experienced by the respondents during the year
preceding the study was having someone steal their money or belongings (3.4%; or 68 of the
1978 respondents for whom data are available). The prevalence of this form of financial
mistreatment also mirrors national estimates observed by Acierno et al. (2009). Fewer
individuals reported that someone spent their money or sold property without their permission
(2.2%; or 44 of 1976 respondents) or forged their signature (1.3%; or 26 of 1978 respondents).
The prevalence of financial mistreatment in this sample is similar to that of shopping/purchasing
fraud victimization (see, e.g., Table 8) and other forms of fraud victimization, such as having
personal information stolen and contributing money to phony charities (see, e.g., Table 18). In
terms of dollar loss, people who were victims of forged signatures had a median dollar loss of
$1,000. This was followed by a $700 median dollar loss incurred by people who had someone
spend their money or sell their property without permission, and a $413 median dollar loss for
individuals who had money or property stolen. When considering all three forms of financial
mistreatment together, the median dollar loss was $500 for the one-year time period ($600 for
the two-year period).
This document is a research report submitted to the U.S. Department of Justice. This report has not been published by the Department. Opinions or points of view expressed are those of the author(s)
and do not necessarily reflect the official position or policies of the U.S. Department of Justice.
75
Table 21
Prevalence of Specific Forms of Financial Mistreatment
Past year Past 2 years
N % N %
Spent money or sold something Yes 44 2.2 59 3.0
No 1932 97.8 1917 97.0
Forged signature Yes 26 1.3 39 2.0
No 1952 98.7 1939 98.0
Stole money or property Yes 68 3.4 109 5.5
No 1910 96.6 1869 94.5
Table 22 presents information on the victim-offender relationships for financial
mistreatment. Several findings emerge. A larger percentage of respondents who had someone
spend their money or sell something without their permission (42.9%; or 15 of the 35 victims) or
forge their signature (50.0%; or 10 of the 20 victims) were victimized by a family member.
Respondents’ children were the most frequent culprits of these two types of financial
mistreatment (20.0% for spent money or sold something, 30.0% for forged signature). A smaller
portion of participants who had their money stolen or items taken were victimized by a relative
(29.4%; or 15 of the 51 victims). Still, sons/daughters comprised the largest group under the
family member heading for this type of financial mistreatment (17.6%; or 9 of the 51 victims).
About one-quarter of respondents who experienced someone spend their money or sell
something without their permission (25.7%; or 9 of the 35 victims), 30% (or 6 of the 20 victims)
who had their signature forged, and 39.2% (or 20 of the 51 victims) who had their money stolen
or things taken were victimized by a stranger. This same pattern of results was observed for the
two-year observation period.
This document is a research report submitted to the U.S. Department of Justice. This report has not been published by the Department. Opinions or points of view expressed are those of the author(s)
and do not necessarily reflect the official position or policies of the U.S. Department of Justice.
76
Table 22
Victim-Offender Relationship for Financial Mistreatment
Past year Past 2 years
N % N %
Spent money or sold something
Spouse or partner 4 11.4 5 10.2
Ex-spouse or partner 1 2.9 1 2.0
Son or daughter 7 20.0 10 20.4
Brother or sister 0 0.0 0 0.0
Niece/nephew 1 2.9 3 6.1
Cousin 0 0.0 0 0.0
Grandchild 0 0.0 0 0.0
Other relative 2 5.7 2 4.1
Friend 6 17.1 10 20.4
Neighbor 2 5.7 2 4.1
Stranger (no relation) 9 25.7 12 24.5
Employee 0 0.0 0 0.0
Other non-relative 3 8.6 4 8.2
Forged signature
Spouse or partner 2 10.0 3 10.3
Ex-spouse or partner 0 0.0 0 0.0
Son or daughter 6 30.0 7 24.1
Brother or sister 1 5.0 1 3.4
Niece/nephew 0 0.0 0 0.0
Cousin 0 0.0 0 0.0
Grandchild 0 0.0 0 0.0
Other relative 1 5.0 2 6.9
Friend 2 10.0 2 6.9
Neighbor 0 0.0 0 0.0
Stranger (no relation) 6 30.0 9 31.0
Employee 0 0.0 0 0.0
Other non-relative 2 10.0 5 17.2
Stolen money or property
Spouse or partner 1 2.0 2 2.4
Ex-spouse or partner 0 0.0 2 2.4
Son or daughter 9 17.6 12 14.5
Brother or sister 1 2.0 2 2.4
Niece/nephew 1 2.0 3 3.6
Cousin 1 2.0 2 2.4
Grandchild 1 2.0 1 1.2
Other relative 1 2.0 1 1.2
Friend 6 11.8 9 10.8
Neighbor 3 5.9 6 7.2
Stranger (no relation) 20 39.2 31 37.3
Employee 3 5.9 3 3.6
Other non-relative 4 7.8 9 10.8
This document is a research report submitted to the U.S. Department of Justice. This report has not been published by the Department. Opinions or points of view expressed are those of the author(s)
and do not necessarily reflect the official position or policies of the U.S. Department of Justice.
77
Information on financial mistreatment reporting practices is provided in Table 23. About
one-quarter of individuals (27%; or 10 of 37 victims) who indicated someone spent their money
or sold their property without permission reported the offense to the police. A higher percentage
of individuals who had their money or property stolen reported their victimization to law
enforcement (40.4%; or 21 of the 52 victims). A similar percentage of respondents who had their
signature forged notified the police (42.1%; or 8 of the 19 victims). The data show that victims
of financial mistreatment are more likely to contact law enforcement agencies regarding their
experience than other authorities such as social services.
Table 23
Reporting of Financial Mistreatment to Authorities
Past year Past 2 years
N % N %
Spent money or sold something
Reported to police Yes 10 27.0 14 28.0
No 27 73.0 36 72.0
Reported to other authorities Yes 3 8.6 4 8.3
No 32 91.4 44 91.7
Forged signature
Reported to police Yes 8 42.1 12 41.4
No 11 57.9 17 58.6
Reported to other authorities Yes 2 11.1 4 14.3
No 16 88.9 24 85.7
Stolen money or property
Reported to police Yes 21 40.4 38 44.7
No 31 59.6 47 55.3
Reported to other authorities Yes 8 15.4 11 13.1
No 44 84.6 73 86.9
This document is a research report submitted to the U.S. Department of Justice. This report has not been published by the Department. Opinions or points of view expressed are those of the author(s)
and do not necessarily reflect the official position or policies of the U.S. Department of Justice.
78
Fraud Targeting and Victimization across Demographic Groups
Fraud Targeting across Demographic Groups
Table 24 features a series of cross-tabulations showing the distribution of fraud targeting
across demographic characteristics. The analyses use data from the one-year observation period.
Chi-square tests (χ²) were estimated to determine whether fraud targeting varies significantly
across groups. With respect to age, the results demonstrate that fraud targeting is least common
among the oldest-old (i.e., 80 years and older).2 Less than half of the oldest-old respondents
(49.6%) indicated that they had been targeted. However, 63% of the young-old and 62.2% of the
old-old reported being targeted. Although significant, the strength of the relationship between
age and fraud targeting is weak (Cramer’s V = 0.11).
With regards to gender, males reported being targeted more frequently than females
(65.4% versus 56.4%, respectively). However, the strength of this relationship is very modest
(phi = 0.09). Retired individuals report being targeted less frequently than their counterparts
(57.4% versus 66.7%, respectively). The association between fraud targeting and being retired is
weak (phi = -0.08). About 69% of survey respondents with graduate-level education report being
fraud targets during the year leading up to the study, making them the most targeted group with
respect to educational attainment. In general, education is weakly associated with fraud targeting
(Cramer’s V = 0.11). No differences in fraud targeting were observed across racial and ethnic
minorities.
2 For this analysis the age variable was collapsed into a three-category variable, ranging from
young-old, to old-old, to oldest-old. This classification scheme is consistent with prior
gerontology research (Suzman, Willis, & Manton, 1992).
This document is a research report submitted to the U.S. Department of Justice. This report has not been published by the Department. Opinions or points of view expressed are those of the author(s)
and do not necessarily reflect the official position or policies of the U.S. Department of Justice.
79
Table 24
Fraud Targeting by Demographics
Fraud targeting
% Yes (N) % No (N) Chi-square
Age
Young-old (60 to 72) 63.0 (585) 37.0 (343) 20.37**
Old-old (73 to 79) 62.2 (258) 37.8 (157)
Oldest-old (80 and older) 49.6 (175) 50.4 (178)
Gender
Female 56.4 (633) 43.6 (489) 13.99**
Male 65.4 (433) 34.6 (229)
Racial minority
No 59.4 (971) 40.6 (663) 1.28
Yes 64.9 (72) 35.1 (39)
Hispanic
No 59.8 (1024) 40.2 (687) 0.16
Yes 62.5 (35) 37.5 (21)
Retired
No 66.7 (311) 33.3 (155) 12.36**
Yes 57.4 (749) 42.6 (555)
Married
No 57.5 (424) 42.5 (313) 2.54
Yes 61.3 (632) 38.7 (399)
Education
Less than high school 58.2 (110) 41.8 (79) 21.90**
High school graduate/equivalency 50.8 (159) 49.2 (154)
Some college/vocational school 58.9 (327) 41.1 (228)
College graduate 63.9 (311) 36.1 (176)
Graduate school 68.9 (151) 31.1 (68)
Note. Sample sizes are in parentheses. * p < 0.05; ** p < 0.01.
This document is a research report submitted to the U.S. Department of Justice. This report has not been published by the Department. Opinions or points of view expressed are those of the author(s)
and do not necessarily reflect the official position or policies of the U.S. Department of Justice.
80
Fraud Victimization across Demographic Groups (Full Sample)
A number of cross-tabulations depicting the distribution of fraud victimization across
various demographic groups using the full sample are presented in Table 25. Statistically
significant differences were observed across two demographic groups. First, racial minorities
were more likely to report that they had been the victims of consumer fraud during the year
leading up to the study. About 23% of racial minorities were fraud victims. However, the
relationship between race and fraud victimization is weak (phi = 0.07). Second, retired
individuals were less likely to report fraud victimization. Twelve-percent of retired participants
reported being a fraud victim compared to 16.6% of their counterparts. The strength of the
association between fraud victimization and being retired is weak (phi = -0.05). No differences in
fraud victimization were observed across the other demographic characteristics (e.g., Hispanic
and education) featured in Table 25.
Fraud Victimization across Demographic Groups (Targeted Subsample)
The distribution of fraud victimization can also be evaluated by looking at the subsample
of study participants who reported being targeted. Table 26 features a series of cross-tabulations
for the targeted subsample. The results reveal that age (Cramer’s V = 0.10) and racial minority
(phi = 0.09) are significantly associated with fraud victimization. With respect to age, the
targeted individuals in young-old (i.e., 60 to 72 years) age group report less frequent
victimization (21%) when compared to the older age groups (29% and 29.7%, respectively).
Additionally, targeted racial minorities more frequently report victimization (38.6% versus
24.1%, respectively). No other significant differences in fraud victimization were observed.
This document is a research report submitted to the U.S. Department of Justice. This report has not been published by the Department. Opinions or points of view expressed are those of the author(s)
and do not necessarily reflect the official position or policies of the U.S. Department of Justice.
81
Table 25
Fraud Victimization across Demographic Groups (Full Sample)
Fraud victimization
% Yes (N) % No (N) Chi-square
Age
Young-old (60 to 72) 12.0 (97) 88.0 (708) 3.34
Old-old (73 to 79) 16.0 (56) 84.0 (294)
Oldest-old (80 and older) 13.0 (41) 87.0 (275)
Gender
Female 13.6 (135) 86.4 (860) 0.00
Male 13.6 (76) 86.4 (482)
Racial minority
No 12.9 (183) 87.1 (1240) 7.79**
Yes 22.9 (22) 77.1 (74)
Hispanic
No 13.5 (201) 86.5 (1287) 0.32
Yes 16.3 (8) 83.7 (41)
Retired
No 16.6 (69) 83.4 (347) 4.45*
Yes 12.4 (140) 87.6 (985)
Married
No 12.5 (80) 87.5 (558) 0.79
Yes 14.1 (127) 85.9 (773)
Education
Less than high school 16.6 (29) 83.4 (146) 2.97
High school graduate/equivalency 11.3 (31) 88.7 (244)
Some college/vocational school 13.1 (63) 86.9 (419)
College graduate 14.5 (61) 85.5 (361)
Graduate school 13.4 (24) 86.6 (155)
Note. Sample sizes are in parentheses. * p < 0.05; ** p < 0.01.
This document is a research report submitted to the U.S. Department of Justice. This report has not been published by the Department. Opinions or points of view expressed are those of the author(s)
and do not necessarily reflect the official position or policies of the U.S. Department of Justice.
Table 26
Fraud Victimization across Demographic Groups (Targeted Subsample)
Fraud victimization
% Yes (N) % No (N) Chi-square
Age
Young-old (60 to 72) 21.0 (97) 79.0 (365) 7.26*
Old-old (73 to 79) 29.0 (56) 71.0 (137)
Oldest-old (80 and older) 29.7 (41) 70.3 (97)
Gender
Female 26.7 (135) 73.3 (371) 1.35
Male 23.1 (76) 76.9 (253)
Racial minority
No 24.1 (183) 75.9 (577) 5.95*
Yes 38.6 (22) 61.4 (35)
Hispanic
No 25.1 (201) 74.9 (600) 0.17
Yes 28.6 (8) 71.4 (20)
Retired
No 26.4 (69) 73.6 (192) 0.33
Yes 24.6 (140) 75.4 (430)
Married
No 24.6 (80) 75.4 (245) 0.06
Yes 25.3 (127) 74.7 (374)
Education
Less than high school 30.2 (29) 69.8 (67) 2.09
High school graduate/equivalency 25.6 (31) 74.4 (90)
Some college/vocational school 24.8 (63) 75.2 (191)
College graduate 24.8 (61) 75.2 (185)
Graduate school 21.6 (24) 78.4 (87)
Note. Sample sizes are in parentheses. * p < 0.05; ** p < 0.01.
Financial Mistreatment across Demographic Groups
Table 27 presents a series of cross-tabulations for the distribution of financial
mistreatment across various demographic groups. This assessment focuses on the two-year
observation period which provides more incidents of financial mistreatment to assess. The results
demonstrate that significant differences exist for two demographic groups. Males were more
likely than females to report being the victims of financial mistreatment during the past two
This document is a research report submitted to the U.S. Department of Justice. This report has not been published by the Department. Opinions or points of view expressed are those of the author(s)
and do not necessarily reflect the official position or policies of the U.S. Department of Justice.
83
years (11.2% versus 6.9%, respectively). Consistent with pattern of findings observed for fraud
victimization, racial minorities more frequently reported being the victims of financial
mistreatment (14% versus 8%, respectively). It is important to note that the strength of the
associations are weak (phi = 0.07 for gender, phi = 0.05 for racial minority).
Table 27
Financial Mistreatment by Demographics
Financial mistreatment
% Yes (N) % No (N) Chi-square
Age
Young-old (60 to 72) 9.8 (98) 90.2 (903) 4.76
Old-old (73 to 79) 7.5 (34) 92.5 (421)
Oldest-old (80 and older) 6.5 (25) 93.5 (360)
Gender
Female 6.9 (86) 93.1 (1159) 10.47**
Male 11.2 (78) 88.8 (621)
Racial minority
No 8.0 (143) 92.0 (1635) 5.30*
Yes 14.0 (17) 86.0 (104)
Hispanic
No 8.4 (156) 91.6 (1711) 1.85
Yes 13.3 (8) 86.7 (52)
Retired
No 10.1 (52) 89.9 (463) 2.42
Yes 7.9 (111) 92.1 (1300)
Married
No 9.4 (76) 90.6 (730) 1.49
Yes 7.9 (88) 92.1 (1032)
Education
Less than high school 11.3 (24) 88.7 (188) 4.97
High school graduate/equivalency 7.9 (27) 92.1 (314)
Some college/vocational school 7.2 (43) 92.8 (554)
College graduate 8.2 (43) 91.8 (480)
Graduate school 10.5 (26) 89.5 (221)
Note. Sample sizes are in parentheses. * p < 0.05; ** p < 0.01.
This document is a research report submitted to the U.S. Department of Justice. This report has not been published by the Department. Opinions or points of view expressed are those of the author(s)
and do not necessarily reflect the official position or policies of the U.S. Department of Justice.
84
A Multivariate Assessment of Fraud Targeting
Table 28 features two logistic regression models that examine the predictors of fraud
targeting (one-year observation period). In Model 1, fraud targeting is regressed on the remote
purchasing, low self-control, and seven demographic variables. The Wald χ² is statistically
significant at the 0.01 level, which indicates that the model accounts for more variation in fraud
targeting than would be expected by chance alone. Consistent with expectations, the results
reveal that remote purchasing is positively associated with fraud targeting as indicated by the
statistically significant z-test. The odds ratio indicates that each additional form of remote
purchasing used by respondents elevates their odds of being targeted by 44.4%. While
participating in a greater variety of remote purchasing is associated with increased fraud
targeting risk, the combined scale may obscure the effects that different forms of remote
purchasing have on fraud targeting. In Model 2, the effects of specific forms of remote
purchasing are examined. The results show that all five forms of remote purchasing increase the
odds of being targeted. However, when evaluating the odds ratios, telemarketing purchase
appears to stand apart from the rest. Respondents who purchased something in response to a
telemarketing call from a company with whom they had not previously done business during the
previous year increased their risk of becoming a fraud target by over 200% compared to those
who had not made such purchases. In comparison, the odds of fraud targeting increased by
35.7% after making an online purchase and by 54.7% after buying items in response to email
solicitations.
The regression models in Table 28 also assess whether low self-control is associated with
fraud targeting. The findings from model 1 demonstrate that low self-control is positively
associated with fraud targeting after controlling for remote purchasing and demographic
This document is a research report submitted to the U.S. Department of Justice. This report has not been published by the Department. Opinions or points of view expressed are those of the author(s)
and do not necessarily reflect the official position or policies of the U.S. Department of Justice.
85
characteristics. Specifically, a one-unit increase in low self-control translates into a 16% increase
in the odds of being a fraud target. The results suggest people with poor self-control engage in
behaviors or activities beyond remote purchasing that increase the odds of fraud targeting. Future
research should focus on identifying which behaviors are related to low self-control and increase
fraud-targeting risk.
Two important findings also emerged with respect to the effect of demographic
characteristics on fraud targeting. Both regression models show that males are more likely to be
targets for fraud than females and higher levels of education increase fraud targeting risk. In
Model 1, for example, the odds of fraud targeting are 31.2% higher for males. As for education, a
one-unit increase in education corresponds with a 13.2% increase in the odds of fraud targeting.
In Tables 29 through 34, the different forms of fraud targeting are regressed on remote
purchasing, low self-control, and the demographic variables. The results show that remote
purchasing increases the odds of all forms of targeting (see Model 1 in each table). Participants
who engage in a greater variety of remote purchasing increase their odds of being the targets of
shopping fraud (odds ratio = 1.358), financial fraud (odds ratio = 1.420), charity scams (odds
ratio = 1.169), prize notification fraud (odds ratio = 1.305), mortgage rescue fraud (odds ratio =
1.244), and identity theft (odds ratio = 1.261).
This document is a research report submitted to the U.S. Department of Justice. This report has not been published by the Department. Opinions or points of view expressed are those of the author(s)
and do not necessarily reflect the official position or policies of the U.S. Department of Justice.
Note. Robust standard errors are in parentheses. * p < 0.05, ** p < 0.01 (two-tailed test).
This document is a research report submitted to the U.S. Department of Justice. This report has not been published by the Department. Opinions or points of view expressed are those of the author(s)
and do not necessarily reflect the official position or policies of the U.S. Department of Justice.
87
Consistent with previous analyses (see Table 28), the effect of specific forms of remote
purchasing are also assessed (see Model 2 in each table). Several findings emerge. The effect of
telemarketing purchase appears limited to two types of targeting—shopping fraud and financial
fraud. Respondents who placed an order for a product after seeing an infomercial also increased
their odds of being targeted for shopping fraud. Participants who made online purchases had
higher odds of targeting for financial fraud, charity scams, and prize notification fraud. The
effect of placing an order after receiving an unsolicited email only increased the odds shopping
fraud targeting. Finally, placing an order after receiving solicited mail increased the odds of
various forms of targeting, including shopping fraud, financial fraud, charity scams, and prize
notification fraud. Interestingly, none of the individual forms of remote purchasing increased the
odds of being targeted for mortgage rescue fraud targeting and identity theft.
The models in Tables 29 through 34 show that the effect of low self-control varies. Poor
self-control increases the odds of being targeted for shopping fraud, charity scams, and identity
theft.
Several demographic variables are correlated with specific forms of targeting. Younger
participants are more likely to report being targeted for financial fraud and prize notification
fraud. Males were more often the targets of financial fraud, charity scams, and prize notification
fraud. No consistent effects for racial minority were observed. Hispanic respondents were more
likely to be targeted for shopping fraud. Higher levels of formal education were linked to
financial fraud targeting and prize notification fraud targeting. Retired participants were less
likely to be targeted for shopping fraud. Finally, married respondents were more likely to be the
targets of mortgage rescue fraud.
This document is a research report submitted to the U.S. Department of Justice. This report has not been published by the Department. Opinions or points of view expressed are those of the author(s)
and do not necessarily reflect the official position or policies of the U.S. Department of Justice.
Note. Robust standard errors are in parentheses. * p < 0.05, ** p < 0.01 (two-tailed test).
This document is a research report submitted to the U.S. Department of Justice. This report has not been published by the Department. Opinions or points of view expressed are those of the author(s)
and do not necessarily reflect the official position or policies of the U.S. Department of Justice.
94
A Multivariate Assessment of Fraud Victimization (Full Sample)
Table 35 presents the fraud victimization regression models estimated using the full
sample. The results in Model 1 show that remote purchasing is positively associated with fraud
victimization. The odds ratio indicates each additional form of remote purchasing used by
respondents increases the odds of fraud victimization by 64.6%. To determine whether the five
individual modes of remote shopping influence consumer fraud victimization differently, Model
2 includes the different types of remote purchasing as independent variables. The results indicate
that four forms of remote purchasing—telemarketing purchase (odds ratio = 2.921), infomercial
purchase (odds ratio = 1.983), mail order purchase (odds ratio = 1.500), and email-order
purchase (odds ratio = 1.742)—significantly increase the odds of victimization. The impact of
telemarketing purchase is noteworthy. Making a purchase after receiving a telephone solicitation
from a company with whom they have not previously done business during the past year
increased the odds of fraud victimization by 192%.
The effect of low self-control on fraud victimization is also assessed in Table 35. The
results show that low self-control is positively associated with consumer fraud victimization. In
Model 1, for example, a one-unit increase in the low self-control scale is associated with a 26.3%
increase in the odds of fraud victimization.
The findings also reveal that two demographic characteristics—age and racial minority—
are positively associated with fraud victimization. Both regression models show older people and
racial minorities are at greater risk for consumer fraud victimization. In Model 1, for example, a
one-year increase in age corresponds with a 2.3% increase in the odds of fraud victimization.
Racial minorities are 83.5% more likely to become victims of fraud compared to non-Hispanic
whites.
This document is a research report submitted to the U.S. Department of Justice. This report has not been published by the Department. Opinions or points of view expressed are those of the author(s)
and do not necessarily reflect the official position or policies of the U.S. Department of Justice.
Note. Robust standard errors are in parentheses. * p < 0.05, ** p < 0.01 (two-tailed test).
This document is a research report submitted to the U.S. Department of Justice. This report has not been published by the Department. Opinions or points of view expressed are those of the author(s)
and do not necessarily reflect the official position or policies of the U.S. Department of Justice.
The analyses in Tables 36 through 39 assess the effects of remote purchasing, low self-
control, and the demographics variables on four different forms of fraud victimization using the
full sample. Sufficient data were not available to estimate regression models for mortgage rescue
fraud and prize notification fraud victimization. To begin, remote purchasing is significantly
associated with each form of fraud victimization. Specifically, each form of remote purchasing
participants engage in increases the odds of shopping fraud victimization by 66.5%, financial
fraud victimization by 139.7%, charity scams by 45.4%, and identity theft by 75.4%.
The regression models featuring the specific modes of remote purchasing scale show that
the impact of telemarketing purchase is largely restricted to financial fraud victimization;
however, the increased risk of this type of victimization is substantial. Individuals who made a
telemarketing purchase with a company they had not previously done business with during the
past year increased their odds of financial fraud victimization by 613.7%. The risk of shopping
fraud victimization was elevated among respondents who purchased products after viewing
infomercials (odds ratio = 2.111) and receiving mail solicitations from companies they have not
previously done business with (odds ratio = 2.189). Finally, risk of identity theft was elevated
when respondents made purchases resulting from unsolicited email (odds ratio = 3.512).
Low self-control is related to two specific types of fraud victimization. Each unit increase
in the low self-control scale corresponds to 36% increase in the odds of shopping fraud
victimization. Those with poor self-control are also at greater risk for identity theft.
With respect to the demographic characteristics, older individuals in the sample are at
increased risk of becoming victims of shopping fraud and charity scams. Males are less likely
than females to become victims of shopping fraud, but males are more likely to be identity theft
victims. Respondents who reported that they are retired had lower odds of being victims of
shopping fraud. Finally, the odds of charity scam victimization were 246.9% higher among racial
minorities relative to non-Hispanic whites (see Model 1 in Table 38).
This document is a research report submitted to the U.S. Department of Justice. This report has not been published by the Department. Opinions or points of view expressed are those of the author(s)
and do not necessarily reflect the official position or policies of the U.S. Department of Justice.
Note. Robust standard errors are in parentheses. * p < 0.05, ** p < 0.01 (two-tailed test).
This document is a research report submitted to the U.S. Department of Justice. This report has not been published by the Department. Opinions or points of view expressed are those of the author(s)
and do not necessarily reflect the official position or policies of the U.S. Department of Justice.
A Multivariate Assessment of Fraud Victimization (Targeted Subsample)
The victimization models are also estimated using data from a subsample of respondents
who reported being targeted by fraudsters during the year before the interview. Results from the
logistics regression analysis shows that remote purchasing is significantly associated with fraud
victimization. According to the odds ratio, each form of remote purchasing that targeted
respondents practices amplifies the odds of fraud victimization by 48.7% (see Model 1 in Table
40). Model 2 shows that two specific types of remote purchasing influence whether targeted
respondents are victimized—telemarketing purchase (odds ratio = 2.146) and infomercial
purchase (odds ratio = 1.293). These two associations were also observed in the model using the
full sample (see Model 2 in Table 35). However, in Table 40 the effects of mail-order and email-
order purchases on fraud victimization fail to achieve statistical significance.
The models in Table 40 also show that low self-control is associated with fraud
victimization among targeted respondents. The odds ratio indicates that a one-unit increase in the
low self-control scale corresponds with a 19% increase in odds of consumer fraud victimization
(see Model 1). Once targeted, participants with poor self-control are less likely to resist
temptation and consider the long-term consequences of their actions.
Only one demographic variable is related to fraud victimization across models in the
targeted subsample. Specifically, older participants are at greater risk for fraud victimization
(odds ratio = 1.033). The age effect was also observed in the analysis using the full sample. The
lack of consistency in the effect of the other demographic variable (i.e., racial minority) across
model specifications suggests it is not terribly robust.
This document is a research report submitted to the U.S. Department of Justice. This report has not been published by the Department. Opinions or points of view expressed are those of the author(s)
and do not necessarily reflect the official position or policies of the U.S. Department of Justice.
Note. Robust standard errors are in parentheses. * p < 0.05, ** p < 0.01 (two-tailed test).
This document is a research report submitted to the U.S. Department of Justice. This report has not been published by the Department. Opinions or points of view expressed are those of the author(s)
and do not necessarily reflect the official position or policies of the U.S. Department of Justice.
103
The four specific types of consumer fraud victimization—shopping, financial, charity
scam, and identity theft—are regressed on remote purchasing, low self-control, and the
demographic variables using the targeted subsample in Tables 41 through 44. The results show
that remote purchasing is positively linked with shopping fraud, financial fraud, and identity
theft victimization. Put differently, each additional form of remote purchasing that targeted
respondents engaged in resulted in a 45% increase in the odds of shopping fraud victimization,
199% increase in the odds of financial fraud victimization, and a 60.1% increase in the odds of
identity theft. The findings from the targeted sample differ from the model using the full sample
(see Table 38) in that remote purchasing does not increase the odds of charity scam victimization
among the former.
When the different modes of remote purchasing are assessed separately, we find that the
effect of telemarketing purchase on financial victimization is quite pronounced. Targeted
participants who have purchased good after an unsolicited telephone call from a company they
had not previously done business with increased their odds of financial fraud victimization by
443%. Buying products from companies that one has not previously done business with after
viewing infomercials or receiving mail solicitations increases the odds of shopping fraud
victimization (odds ratios = 1.944 and 1.916, respectively). Finally, email-order purchase is
associated with identity theft victimization (odds ratio = 3.309).
The effect of low self-control is only significant in the shopping fraud victimization
model. Among the targeted subsample, a one-unit increase in the low self-control scale is
associated with a 29% increase in the odds of being victimized by shopping fraud.
In terms of demographic correlates, age increases the odds of shopping fraud and charity
scam victimization. Males are less likely than females to be victims of shopping fraud. Finally,
racial minorities are significantly more likely to be victims of charity scams than non-Hispanic
whites.
This document is a research report submitted to the U.S. Department of Justice. This report has not been published by the Department. Opinions or points of view expressed are those of the author(s)
and do not necessarily reflect the official position or policies of the U.S. Department of Justice.
Note. Robust standard errors are in parentheses. * p < 0.05, ** p < 0.01 (two-tailed test).
This document is a research report submitted to the U.S. Department of Justice. This report has not been published by the Department. Opinions or points of view expressed are those of the author(s)
and do not necessarily reflect the official position or policies of the U.S. Department of Justice.
108
Assessing Possible Selection Bias
Before proceeding further, it is necessary to assess the robustness of the estimates that
were observed using the targeted subsample (see, e.g., Table 40). As noted previously, statistical
problems can arise when inclusion in a subsample (e.g., being targeted for consumer fraud) is not
independent from the dependent variable (e.g., fraud victimization). When this happens, the
possibility that the observed regression estimates are misleading (termed selection bias) is
possible. The two-stage probit regression presented in Table 45 was designed to deal with such a
situation.
The selection equation is featured on the left-hand side of the table. Here, fraud targeting
is regressed onto the same set of variables that were used in prior fraud targeting models (see
Table 28) and three additional variables (i.e., military service, law violation, and prior fraud
targeting). The latter three variables (termed “exclusionary restrictions”) are included because
each is correlated with fraud targeting at the 0.05 level. These same three variables, however, are
not related to the fraud victimization. This satisfies a statistical requirement of this particular
regression technique.
Importantly, the likelihood ratio test fails to achieve statistical significance, meaning that
the regression estimates are not adversely influenced by selection bias. Put another way, the
estimates for fraud victimization reported in Table 45 should closely mirror the effects of Model
1 in Table 40 in terms of sign (i.e., positive or negative) and significance. A quick inspection
indicates that this is indeed the case. More specifically, both models indicate that the effects of
remote purchasing, low self-control, and age on fraud victimization are positive and statistically
significant. In sum, the results presented in Table 45 increase our confidence that the analyses
using the targeted subsample do not suffer from selection bias.
This document is a research report submitted to the U.S. Department of Justice. This report has not been published by the Department. Opinions or points of view expressed are those of the author(s)
and do not necessarily reflect the official position or policies of the U.S. Department of Justice.
109
Table 45
Fraud Victimization Probit Regression with Sample Selection
Fraud targeting Fraud victimization
b z-test b z-test
(s.e.) (s.e.)
Remote purchasing 0.104 2.39* 0.251 5.20**
(0.043) (0.048)
Low self-control 0.057 1.86 0.102 2.78**
(0.031) (0.037)
Age 0.001 0.16 0.020 3.33**
(0.005) (0.006)
Male -0.269 -2.67** -0.103 -1.13
(0.101) (0.091)
Racial minority 0.216 1.50 0.343 2.12*
(0.144) (0.162)
Hispanic 0.191 1.02 0.248 1.13
(0.189) (0.219)
Education 0.032 1.08 -0.060 -1.61
(0.029) (0.037)
Retired -0.135 -1.65 -0.124 -1.25
(0.082) (0.099)
Married 0.058 0.81 0.129 1.42
(0.072) (0.091)
Military service 0.226 2.07* --- ---
(0.109)
Law violation 0.068 2.75** --- ---
(0.025)
Prior fraud targeting 0.340 19.98** --- ---
(0.017)
N = 1929 1129
Wald χ² = 51.77**
Likelihood Ratio χ² = 0.47
Note. Robust standard errors are in parentheses. * p < 0.05, ** p < 0.01 (two-tailed test).
This document is a research report submitted to the U.S. Department of Justice. This report has not been published by the Department. Opinions or points of view expressed are those of the author(s)
and do not necessarily reflect the official position or policies of the U.S. Department of Justice.
110
A Multivariate Assessment of Financial Mistreatment
Table 46 features two logistic regression models where financial mistreatment (two-year
observation period) as the outcome measure. In Model 1, financial mistreatment is regressed on
the routine activity scale, low self-control scale, and seven demographic variables. The model
has more explanatory power than would be expected by chance alone (Wald χ² = 47.41, p <
0.01). The results show that the routine activity scale is inversely related to financial
mistreatment. According to the odds ratio, each unit increase in the routine activity scale
corresponds to a 7.3% decrease in the odds of experiencing financial mistreatment for the
participants in the study. In short, an active life characterized by high levels of routine activities
appears to act as a protective factor against financial mistreatment. In Model 2 the 5-item routine
activity scale is disaggregated into its component parts. Doing so allows us to determine whether
any of the specific routines influence financial mistreatment. The results reveal that none of the
individual routine activities are significantly associated with financial mistreatment.
The regression models in Table 46 also show that low self-control is significantly
associated with financial mistreatment. The odds of being a financial mistreatment victim
increase by 30% for each unit increase in the low self-control scale. These findings suggest that
individuals with poor self-control place themselves in situations and behave in ways that increase
the risk for financial mistreatment. Future research should focus on identifying these particular
situations and behaviors related to variations in self-control that amplify the odds of financial
mistreatment.
Finally, two demographic effects are observed. Males and racial minorities are more
likely to be victimized by financial mistreatment. The odds of financial mistreatment are 57.5%
higher for males relative to females. For racial minorities, the odds are 71.3% higher when
compared to non-Hispanic whites (see Model 1 in Table 46).
This document is a research report submitted to the U.S. Department of Justice. This report has not been published by the Department. Opinions or points of view expressed are those of the author(s)
and do not necessarily reflect the official position or policies of the U.S. Department of Justice.
Note. Robust standard errors are in parentheses. * p < 0.05, ** p < 0.01 (two-tailed test).
This document is a research report submitted to the U.S. Department of Justice. This report has not been published by the Department. Opinions or points of view expressed are those of the author(s)
and do not necessarily reflect the official position or policies of the U.S. Department of Justice.
112
The analysis now turns to the question of whether general routine activity protects against
the different forms of financial mistreatment. The results of the regression analyses are presented
in Tables 47 through 49. Results show that the inverse effect of routine activity is isolated to one
type of financial mistreatment—stolen money or property (see Model 1 in Table 49). The odds
ratio indicates that each unit increase in the routine activity scale corresponds to an 8.2%
decrease in the odds of having participants’ money stolen or belongings taken. Two specific
routine activities are correlated with the outcome measures. First, the frequency with which
respondents got together socially with friends, family, neighbors, and the like was inversely
associated with having someone forge a signature without permission (see Model 2 in Table 48).
Second, outside-home activity is associated with having money or property stolen (see Model 2
in Table 49).
The results show that the correlation between low self-control and each type of financial
mistreatment is statistically significant at the 0.01 level. Again, as levels of self-control decrease
among study participants, their risk of financial mistreatment increases significantly. As noted
previously, the nature of this relationship is not well understood. Additional research in this area
is certainly warranted.
With regards to the effects of demographic characteristics on specific forms of financial
mistreatment, the results show that males are more likely to have their money spent or things
sold without their permission and have their money and property stolen when compared to
women. Racial minorities are more likely than their counterparts to have money and property
stolen. Finally, Hispanic respondents are more likely to have their signature forged without
permission.
This document is a research report submitted to the U.S. Department of Justice. This report has not been published by the Department. Opinions or points of view expressed are those of the author(s)
and do not necessarily reflect the official position or policies of the U.S. Department of Justice.
113
Table 47
Spent Money or Sold Something Logistic Regression Models
Note. Robust standard errors are in parentheses. * p < 0.05, ** p < 0.01 (two-tailed test).
This document is a research report submitted to the U.S. Department of Justice. This report has not been published by the Department. Opinions or points of view expressed are those of the author(s)
and do not necessarily reflect the official position or policies of the U.S. Department of Justice.
114
Table 48
Forged Signature without Permission Logistic Regression Models
Note. Robust standard errors are in parentheses. * p < 0.05, ** p < 0.01 (two-tailed test).
This document is a research report submitted to the U.S. Department of Justice. This report has not been published by the Department. Opinions or points of view expressed are those of the author(s)
and do not necessarily reflect the official position or policies of the U.S. Department of Justice.
115
Table 49
Stolen Money or Property Logistic Regression Models
Note. Robust standard errors are in parentheses. * p < 0.05, ** p < 0.01 (two-tailed test).
This document is a research report submitted to the U.S. Department of Justice. This report has not been published by the Department. Opinions or points of view expressed are those of the author(s)
and do not necessarily reflect the official position or policies of the U.S. Department of Justice.
116
Program Familiarity and Contact
Table 50 presents data on respondents’ familiarity with Arizona- and Florida-based
programs that are designed to help elderly citizens prevent and cope with criminal victimization.
Arizona participants were asked how familiar they are (closed-ended responses include “very
familiar,” “somewhat familiar,” and “not familiar”) with the Agency on Aging and the Senior
Sleuths project. Floridians who were interviewed were asked about their level of familiarity with
the Seniors vs. Crime Program and their state’s Senior Sleuths project.
Several findings emerge from this analysis. For starters, a vast majority of respondents
are not familiar with their state’s programs. Nearly 70% of Arizona participants (or 693 of the
992 respondents for whom data are available) are “not familiar” with the Agency on Aging.
Approximately 25% (or 250 of the 992 respondents) are “somewhat familiar” with the agency,
and less than 5% report being “very familiar” with the Agency on Aging. In Florida, 86.5% of
respondents reported they are “not familiar” the Florida’s Seniors vs. Crime Program (855 or the
988 respondents). Approximately 11% (or 113 of the 988 respondents) indicated that they are
“somewhat familiar” with the program, and only 2% (or 20 of the 988 respondents) are “very
familiar” with the Seniors vs. Crime program.
The Senior Sleuths projects in both states are not well known by the survey respondents.
Indeed, 98.6% of Arizona participants (or 962 of the 976 respondents) and 97.5% of Florida
respondents (or 953 of the 977 respondents) reported they are “not familiar” with the Seniors
Sleuths project.
This document is a research report submitted to the U.S. Department of Justice. This report has not been published by the Department. Opinions or points of view expressed are those of the author(s)
and do not necessarily reflect the official position or policies of the U.S. Department of Justice.
117
Table 50
Program Familiarity in Arizona and Florida
Arizona
Agency on Aging Senior Sleuths Project
% N % N
Very familiar 4.9% 49 0.0% 0
Somewhat familiar 25.2% 250 1.4% 14
Not familiar 69.9% 693 98.6% 962
Florida
Seniors vs. Crime Program Senior Sleuths Project
% N % N
Very familiar 2.0% 20 0.5% 5
Somewhat familiar 11.4% 113 1.9% 19
Not familiar 86.5% 855 97.5% 953
Table 51 presents survey results showing where respondents who reported some level of
familiarity with available programs first learned about them. “Friends or family members” were
the most commonly reported for Agency on Aging (28.5%; or 77 of the 270 respondents). Other
relatively common sources include “newspapers” (17.8%) and “word of mouth” (11.9%).
About an even number of Florida respondents learned about the Seniors vs. Crime
Program from “friends or family members” (19.8%; or 24 of the 121 respondents), “television”
(19.8%), and “newspapers” (20.7%).
With respect to the Senior Sleuths project, familiarity among respondents in both states
was so sparse that none of the sources included in the survey (including an open-ended response)
proved beneficial as a mode to disseminate program information.
This document is a research report submitted to the U.S. Department of Justice. This report has not been published by the Department. Opinions or points of view expressed are those of the author(s)
and do not necessarily reflect the official position or policies of the U.S. Department of Justice.
118
Table 51
Informational Sources for Programs
Arizona
Agency on Aging Senior Sleuths Project
Source % (N) % (N)
Friend or family member 28.5% (77) 23.1% (3)
Television 6.7% (18) 15.4% (2)
Radio 1.5% (4) 0.0% (0)
Newspaper 17.8% (48) 15.4% (2)
Web page or email 5.2% (14) 0.0% (0)
Mail 6.3% (17) 15.4% (2)
Church 3.3% (9) 15.4% (2)
Work 1.9% (5) 7.7% (1)
Previous experience 7.8% (21) 0.0% (0)
Police department/crime watch 0.0% (1) 0.0% (0)
Magazine 0.1% (2) 0.0% (0)
Word of mouth 11.9% (32) 0.0% (0)
Phone call 2.2% (6) 0.0% (0)
Hospital 1.1% (3) 0.0% (0)
Other 4.8% (13) 7.7% (1)
Florida
Seniors vs. Crime Program Senior Sleuths Project
Source % (N) % (N)
Friend or family member 19.8% (24) 26.1% (6)
Television 19.8% (24) 17.4% (4)
Radio 0.8% (1) 0.0% (0)
Newspaper 20.7% (25) 17.4% (4)
Web page or email 3.3% (4) 0.0% (0)
Mail 6.6% (8) 4.3% (1)
Church 1.7% (2) 4.3% (1)
Work 4.1% (5) 8.7% (2)
Previous experience 2.5% (3) 0.0% (0)
Police department/crime watch 6.6% (8) 0.0% (0)
Magazine 1.7% (2) 0.0% (0)
Word of mouth 6.6% (8) 0.0% (0)
Phone call 0.0% (0) 0.0% (0)
Hospital 0.0% (0) 0.0% (0)
Other 5.8% (7) 21.7% (5)
This document is a research report submitted to the U.S. Department of Justice. This report has not been published by the Department. Opinions or points of view expressed are those of the author(s)
and do not necessarily reflect the official position or policies of the U.S. Department of Justice.
119
Table 52 shows whether respondents who are either “somewhat” or “very familiar” with
the programs of interest have actually contacted them. In Arizona, only a small portion of
respondents who are aware of the Agency on Aging contacted them in the year leading up to the
interview (8.4%; or 25 of the 277 respondents). Only one participant from Arizona reported
contacting the Senior Sleuths project.
A similar pattern of results emerged for Florida. Approximately 5.3% (or 7 of the 133
respondents) of participants contacted the Seniors vs. Crime Program. Only 3 respondents in
Florida said they contacted the Senior Sleuths project during the year prior to the study.
Table 52
Contact with Programs
Arizona
Agency on Aging Senior Sleuths Project
% N % N
No 91.6% 272 92.9% 13
Yes 8.4% 25 7.1% 1
Florida
Seniors vs. Crime Program Senior Sleuths Project
% N % N
No 94.7% 126 87.5% 21
Yes 5.3% 7 12.5% 3
The survey also queried respondents about the sources that have provided information on
how to protect themselves from consumer fraud victimization. These results are featured in Table
53. Study participants report that they received prevention information from a variety of sources.
Television, however, was the most commonly reported source of information in both states
(28.3% in Arizona, 31.1% in Florida). Internet websites, emails, magazines, radio, and
brochures/fliers were also relatively common sources of fraud prevention information.
This document is a research report submitted to the U.S. Department of Justice. This report has not been published by the Department. Opinions or points of view expressed are those of the author(s)
and do not necessarily reflect the official position or policies of the U.S. Department of Justice.
Table 53
Informational Sources on Consumer Fraud Prevention
Arizona Florida
Source % (N) % (N)
Internet website 15.0% (243) 14.6% (204)
Email 11.0% (178) 9.7% (135)
Television 28.3% (459) 31.1% (435)
Radio 9.1% (148) 8.6% (120)
Magazines 16.3% (264) 15.5% (216)
Brochures or fliers 9.9% (161) 9.6% (134)
AARP 0.5% (8) 0.4% (5)
Newspaper 3.5% (57) 4.3% (60)
Bank or credit card company 1.0% (17) 0.6% (8)
Word of mouth (family/friends) 2.3% (37) 2.2% (31)
Mail 0.6% (10) 0.7% (10)
Police department 0.4% (6) 0.9% (12)
Telephone 0.1% (1) 0.3% (4)
Neighborhood crime watch 0.2% (3) 0.5% (7)
Attorney General’s Office 0.2% (3) 0.0% (0)
Other 1.5% (25) 1.1% (16)
Table 54 features two ordinal regression models examining whether respondents’
demographic characteristics are associated with program familiarity. Regarding Arizona’s
Agency on Aging, several demographic variables are correlated with program awareness as
evidenced by the statistically significant z-tests. The regression estimates show that older and
more educated individuals are more familiar with the Agency on Aging. Male respondents are
less familiar with the agency than females.
Turning attention to Florida’s Seniors vs. Crime Program, we see that the pattern of
results is very similar to that of the Agency on Aging. Older respondents are more familiar with
the Seniors vs. Crime program. Males in the Florida subsample are less familiar with the
program than females. Finally, racial minorities report higher levels of awareness with Florida’s
Seniors vs. Crime program compared to non-Hispanic whites.
This document is a research report submitted to the U.S. Department of Justice. This report has not been published by the Department. Opinions or points of view expressed are those of the author(s)
and do not necessarily reflect the official position or policies of the U.S. Department of Justice.
Note. Robust standard errors are in parentheses. * p < 0.05, ** p < 0.01 (two-tailed test).
The final set of program familiarity analyses assess whether respondent demographic
characteristics are related to familiarity with the Senior Sleuths project in both states. Too few
respondents reported that they were familiar with the Senior Sleuths to conduct multivariate
analyses. Accordingly, a series of cross-tabulations are presented for Arizona (see Table 55) and
Florida (see Table 56). Two observations emerge from these analyses. First, an overwhelming
majority of respondents in every demographic group included in the analysis reported they were
“not familiar” with the Senior Sleuth project. The pattern of findings is observed in both Florida
and Arizona. Second, no statistically significant differences in levels of awareness are detected.
In sum, the evidence shows that survey respondents from all walks of life are not too familiar
with their state’s Senior Sleuths project.
This document is a research report submitted to the U.S. Department of Justice. This report has not been published by the Department. Opinions or points of view expressed are those of the author(s)
and do not necessarily reflect the official position or policies of the U.S. Department of Justice.
Table 55
Familiarity across Demographic Groups for Arizona’s Senior Sleuths Project
Note. Sample sizes are in parentheses. * p < 0.05; ** p < 0.01.
This document is a research report submitted to the U.S. Department of Justice. This report has not been published by the Department. Opinions or points of view expressed are those of the author(s)
and do not necessarily reflect the official position or policies of the U.S. Department of Justice.
123
Table 56
Familiarity across Demographic Groups for Florida’s Senior Sleuths Project
Note. Sample sizes are in parentheses. * p < 0.05; ** p < 0.01.
This document is a research report submitted to the U.S. Department of Justice. This report has not been published by the Department. Opinions or points of view expressed are those of the author(s)
and do not necessarily reflect the official position or policies of the U.S. Department of Justice.
124
Reporting Consumer Fraud Victimization and Financial Mistreatment
The analysis now shifts to the topic of what drives victims of consumer fraud and
financial mistreatment decision to report their experiences to authorities. Because notifying
authorities is done by victims (a subsample of respondents), the two-stage probit model with
sample selection is used.
The results for reporting consumer fraud to authorities are presented in Table 57. Two
variables—low self-control and retired—act as the exclusionary restrictions. As seen in previous
analyses (see Table 35), low self-control and remote purchasing are two important drivers of
fraud victimization. The Wald χ2 indicates that the predictive ability of the reporting
victimization model is greater than what we would expect by chance alone. Note also that the log
likelihood ratio is statistically significant, suggesting the presence of selection bias. This finding
underscores the need to use this two-stage modeling technique. To do otherwise could result in
misleading regression estimates. Two variables achieve statistical significance in the reporting
victimization model. Specifically, the directional hypothesis stating that the likelihood of
reporting consumer fraud victimization increases as the seriousness of the incident (measured in
terms of monetary loss) also increases is confirmed. This finding is largely consistent with prior
research on reporting other forms of criminal victimization. Remote purchasing is also associated
with notifying authorities among consumer fraud victims. The regression estimate indicates that
individuals who engage is more modes of remote purchasing are more likely to call on
authorities in the event that they are victimized by fraudsters.
This document is a research report submitted to the U.S. Department of Justice. This report has not been published by the Department. Opinions or points of view expressed are those of the author(s)
and do not necessarily reflect the official position or policies of the U.S. Department of Justice.
125
Table 57
Reporting Fraud Victimization Probit Regression with Sample Selection
Fraud victimization Reporting victimization
b z-test b z-test
(s.e.) (s.e.)
Monetary loss --- --- 0.004 1.84†
(0.002)
Remote purchasing 0.325 7.86** 0.160 2.35*
(0.0414) (0.068)
Age 0.005 1.01 -0.003 -0.42
(0.005) (0.008)
Male -0.064 -0.83 -0.049 -0.40
(0.077) (0.122)
Racial minority 0.204 1.44 0.147 0.67
(0.142) (0.220)
Hispanic 0.141 0.71 -0.433 -1.01
(0.200) (0.428)
Education -0.044 -1.50 --- ---
(0.029)
Retired -0.192 -2.50* --- ---
(0.076)
Married 0.254 0.37 --- ---
(0.069)
Low self-control 0.116 3.74** --- ---
(0.031)
N = 1857 290
Wald χ² = 14.40*
Likelihood Ratio χ² = 5.61*
Note. Robust standard errors are in parentheses. * p < 0.05, ** p < 0.01 (two-tailed test);
† p < 0.05 (one-tailed test).
This document is a research report submitted to the U.S. Department of Justice. This report has not been published by the Department. Opinions or points of view expressed are those of the author(s)
and do not necessarily reflect the official position or policies of the U.S. Department of Justice.
126
In Table 58, the two-stage probit regression for reporting incidents of financial
mistreatment is presented. In terms of sign and significance, the estimates observed in the
selection equation are very similar to those reported in the financial mistreatment model featured
in Table 46 (Model 1). For example, the odds of financial mistreatment are greater among
individuals with poor self-control. Those living busy lives (as indicated by the routine activity
scale), however, are protected against mistreatment. These two measures—low self-control and
routine activity—serve as exclusionary restrictions. Two variables achieve statistical significance
in the reporting mistreatment equation. Much like consumer fraud victims, the likelihood that
financial mistreatment victims will notify authorities increases substantially as the monetary loss
also increases. The second important factor, stranger assailant, indicates that reporting is much
more likely if the perpetrator is someone who the victim does not know personally. These two
findings are very consistent with prior research investigating the determinants of reporting other
forms of criminal victimization.
This document is a research report submitted to the U.S. Department of Justice. This report has not been published by the Department. Opinions or points of view expressed are those of the author(s)
and do not necessarily reflect the official position or policies of the U.S. Department of Justice.
127
Table 58
Reporting Financial Mistreatment Probit Regression with Sample Selection
Financial mistreatment Reporting mistreatment
b z-test b z-test
(s.e.) (s.e.)
Monetary loss --- --- 0.006 2.23*
(0.003)
Stranger assailant --- --- 0.730 2.94**
(0.247)
Age -0.012 -2.17* -0.009 -0.68
(0.005) (0.014)
Male 0.223 2.61** -0.319 -1.22
(0.085) (0.262)
Racial minority 0.243 1.76 0.235 0.61
(0.138) (0.383)
Hispanic 0.347 1.79 -0.043 -0.09
(0.194) (0.501)
Education 0.036 0.94 --- ---
(0.038)
Retired -0.088 -0.85 --- ---
(0.103)
Married -0.166 -1.86 --- ---
(0.089)
Low self-control 0.154 4.29** --- ---
(0.036)
Routine activity -0.042 -2.78** --- ---
(0.015)
N = 1937 159
Wald χ² = 12.60*
Likelihood Ratio χ² = 0.08
Note. Robust standard errors are in parentheses. * p < 0.05, ** p < 0.01 (two-tailed test).
This document is a research report submitted to the U.S. Department of Justice. This report has not been published by the Department. Opinions or points of view expressed are those of the author(s)
and do not necessarily reflect the official position or policies of the U.S. Department of Justice.
128
CONCLUSION
Discussion of Findings
This study supports the findings of prior research in demonstrating that elderly
populations are significantly targeted for various types of fraud, including shopping/purchasing
fraud, financial fraud, and other consumer fraud. It revealed, for example, that over two-thirds of
individuals ages 60 and over in Arizona and Florida were subjected to attempted fraud in the two
years prior to the survey. It also revealed that victimization is relatively common—in this same
time period, 1 in 5 respondents reported being the victim of fraud. Financial mistreatment, such
as having someone spend your money or forge your signature, occurred among 8.4% of the
respondents during the two years leading up to the study. Such incidents typically resulted from
victimization by family members, especially children. Notably, the study found that few
individuals who are targeted for fraud, and only slightly more who experience fraud
victimization, contact law enforcement authorities.
Those who engage in consumer fraud victimization of the elderly tend to be “equal
opportunity” offenders. For example, there were few demographic or social groups who were
substantially more likely to be targeted for fraud or to be the victims of fraud. That said,
individuals who were ages 60-72 and who were male were more likely to experience fraud
targeting and victimization. Racial minorities who were targeted for fraud were more likely to
report victimization or financial mistreatment. Notably, the most robust individual
characteristics predictive of fraud targeting and victimization were remote purchasing (e.g.,
making many purchases online of via telephone) and being low in self-control. Financial
mistreatment was less likely among individuals who adhered to such routine activities as
This document is a research report submitted to the U.S. Department of Justice. This report has not been published by the Department. Opinions or points of view expressed are those of the author(s)
and do not necessarily reflect the official position or policies of the U.S. Department of Justice.
129
participating in social activities away from home and, more generally, socializing with
individuals outside the home.
Results from the study show that respondents were unfamiliar with the state-level efforts,
in Arizona and Florida, to educate the elderly about consumer fraud. Over 70% of Arizona
participants and 87% of Florida participants were “not familiar” with the efforts. Almost none of
the respondents were familiar with the Seniors Sleuths project. Those who were familiar with
these different efforts learned about them primarily from friends and family members,
newspapers, television, and “word of mouth.”
The results of this study are significant for several reasons. In particular, they provide an
empirical foundation on which to understand the distribution and causes of financial exploitation
of the elderly and steps that can be taken to reduce it. The main conclusion to be drawn from the
study is that consumer fraud targeting and fraud victimization of the elderly are common and
result from activities, such as frequent online and telemarketing purchases, that can be curbed or
that can be coupled with simple steps to protect individuals from actual victimization. The study
also highlights that the elderly population is largely unaware of efforts that exist to educate them
about consumer fraud. Accordingly, a considerable opportunity exists to make substantial strides
in educating the elderly about fraud victimization by more aggressively distributing information
through different media. Several specific recommendations are discussed further below after
discussing implications for further research.
Implications for Further Research
Although this study constitutes an advance over prior research, several limitations bear
mention that point to directions for future research. First, the study examined elderly populations
in Arizona and Florida. Thus, the extent to which the results generalize to the rest of the country
This document is a research report submitted to the U.S. Department of Justice. This report has not been published by the Department. Opinions or points of view expressed are those of the author(s)
and do not necessarily reflect the official position or policies of the U.S. Department of Justice.
130
is unknown. That said, the prevalence estimates of victimization largely accord with those found
in prior research, suggesting that the results likely provide a reasonable estimate of what would
be found with studies in other states or the country as a whole. Clearly, however, the prevalence
of fraud targeting and victimization, and the specific causes, may vary from place to place.
Second, there remains a need to undertake studies that employ several sources of
information, including self-report data from offenders on abuse and victimization of the elderly,
official records data from law enforcement agencies, and interviews with policymakers,
practitioners, and advocates involved in efforts to protect the elderly from fraudulent activity. It
is possible, for example, that fraud targeting and victimization are lower in areas where a critical
threshold of awareness about consumer fraud of the elderly exists. The use of multiple sources
of data could aid in the development of measures that gauge such awareness and in turn enable
empirical tests of that possibility.
Third, although this study identified key risk factors that increase the likelihood of fraud
targeting and victimization, the precise causal mechanisms involved warrant further
investigation. For example, individuals who engage in routine activities, such as socializing with
their friends in the community, are less likely to experience financial mistreatment. What
exactly produces this effect bears closer scrutiny. It could be that such activities reduce
opportunities for fraud targeting and victimization to occur, but they also could expose
individuals to a broader network of individuals who provide informal social support that protects
them against fraudulent activities that family members of relatives might seek to undertake.
Fourth, this study included questions about several state-level efforts in Arizona and
Florida to prevent and combat elderly fraud victimization. A wide range of similar and different
This document is a research report submitted to the U.S. Department of Justice. This report has not been published by the Department. Opinions or points of view expressed are those of the author(s)
and do not necessarily reflect the official position or policies of the U.S. Department of Justice.
131
efforts exist in other states and their implementation, the extent to which they target the risk
factors associated with elderly victimization, and their effectiveness remain to be examined.
Implications for Policy and Practice
The diversity of methods through which fraud targeting occurs is considerable, including
telephone, mail, email, web sites, phony prize offers, requests for contributions to phone
charitable causes, and more. The plethora of such methods in turn indicates that any efforts to
reduce victimization likely must be multifaceted and, for example, should target these different
methods as well as educate elderly consumers about the ways in which consumer fraud
victimization can occur.
The fact that few fraud attempts or actual fraud victimization events are reported to law
enforcement suggests the need for education about the importance of reporting such events and,
at the same time, for efforts to ensure that law enforcement respond to such reports in a proactive
and well-publicized manner. Such steps can increase the chances that the elderly will learn about
consumer fraud victimization, that they will report it, and that a potential general deterrent effect
can be created or increased. For example, would-be offenders, such as family members and
solicitors, may be less likely to engage in fraud if they read or hear about law enforcement
aggressively responding to claims of fraudulent activity.
Given the greater targeting and victimization of them, males and individuals ages 60-72
should be educated about the importance of taking steps to prevent fraud and of reporting
attempted or actual fraud. Similarly, individuals who engage in greater amounts of remote
purchasing or who are low in self-control should be targeted for similar educational efforts since
these two factors emerged as the most robust predictors of various types of fraud targeting and
victimization. Not least, since financial mistreatment was associated with failing to engage in
This document is a research report submitted to the U.S. Department of Justice. This report has not been published by the Department. Opinions or points of view expressed are those of the author(s)
and do not necessarily reflect the official position or policies of the U.S. Department of Justice.
132
routine activities, such as social events, outside the home, elderly individuals should be
encouraged to participate in social activities in their community. Doing so may create a social
support network that provides a protective effect against fraud targeting and especially
victimization.
Few respondents in the study were familiar with state-level efforts to educate and help the
elderly in matters related to consumer fraud. Accordingly, there likely is substantial room to
reduce consumer fraud victimization by greater attention to implementing these efforts in ways
that better reach their intended target populations. Such efforts could include flyers, radio and
television advertisements during shows or times when the elderly are more likely to be listening
or watching, and other related activities. These are the primary avenues through which
respondents reported learning about these programs, but, ultimately, the effectiveness of such
efforts depends heavily on whether informational material reaches the intended audience.
This document is a research report submitted to the U.S. Department of Justice. This report has not been published by the Department. Opinions or points of view expressed are those of the author(s)
and do not necessarily reflect the official position or policies of the U.S. Department of Justice.
133
REFERENCES
Acierno, Ron, Melba Hernandez-Tejada, Wendy Muzzy, and Kenneth Steve. 2009. National
Elder Mistreatment Study. Washington, DC: U. S. Department of Justice.
Acierno, Ron, Melba A. Hernandez, Ananda B. Amstadter, Heidi S. Resnick, Kenneth Steve,
Wendy Muzzy, and Dean G. Kilpatrick. 2010. Prevalence and Correlates of Emotional,
Physical, Sexual, and Financial Abuse and Potential Neglect in the United States: The
National Elder Mistreatment Study. American Journal of Public Health, 100, 292-297.
Administration on Aging (AOA). 2010. Statistics on Aging. Retrieved from the AOA website:
www.aoa.gov/aoaroot/aging_statistics.
Akers, Ronald L., Anthony L. LaGreca, Christine Sellers, and John Cochran. 1987. Fear of
Crime and Victimization Among the Elderly in Different Types of Communities.
Criminology, 25, 487-505.
Albanese, Jay S. 2005. Fraud: The Characteristic Crime of the 21st Century. Trends in Organized
American Association of Retired Persons. 1996. Telemarketing Fraud and Older Americans: An
AARP Survey. Washington, D.C.: AARP.
American Geriatrics Society. 2006. Trends in the Elderly Population. New York: American
Geriatrics Foundation for Health in Aging.
This document is a research report submitted to the U.S. Department of Justice. This report has not been published by the Department. Opinions or points of view expressed are those of the author(s)
and do not necessarily reflect the official position or policies of the U.S. Department of Justice.
Bonnie, Richard J., and Robert B. Wallace (Eds). 2002. Elder Mistreatment: Abuse, Neglect, and
Exploitation in an Aging America. National Academies Press.
Callahan, Christopher M., Unverzagt, Frederick W., Hui, Siu L., Perkins, Anthony J., and Hugh
C. Hendrie. 2002. Six-Item Screener to Identify Cognitive Impairment among Potential
Subjects for Clinical Research. Medical Care, 40, 771-781.
Carach, Carlos, Adam Graycar, and Glenn Muscat. 2001. The Victimization of Older Americans.
Canberra: Australian Institute of Criminology.
This document is a research report submitted to the U.S. Department of Justice. This report has not been published by the Department. Opinions or points of view expressed are those of the author(s)
and do not necessarily reflect the official position or policies of the U.S. Department of Justice.
Center for Disease Control and Prevention. 2002. Second Longitudinal Study of Aging Wave 3:
Survivor Questionnaire (Version SF 2.1). Atlanta, GA: Author.
Choi, Namkee G., and James Mayer. 2000. Elder Abuse, Neglect, and Exploitation: Risk Factors
and Prevention Strategies. Journal of Gerontological Social Work, 33, 5-25.
Cohen, Lawrence E., and Marcus Felson. 1979. Social change and Crime Rate Trends: A
Routine Activity Approach. American Sociological Review, 52, 170-183.
Conrad, Kendon J., Iris, Madelyn, Ridings, John W., Langley, Kate, and Kathleen Wilber. 2010.
Self-Report Measure of Financial Exploitation of Older Adults. The Gerontologist, 50,
758-773.
Curtin, Richard, Presser, Stanley, and Eleanor Singer. 2005. Changes in Telephone Survey
Nonresponse over the Past Quarter Century. Public Opinion Quarterly, 69, 87-98.
Dietz, Tracy L., and James D. Wright. 2005. Age and gender differences and predictors of
victimization of the older homeless. Journal of Elder Abuse and Neglect, 17, 37-60.
Feldmeyer, Ben, and Darrell Steffensmeier. 2007. Elder crime: Patterns and current trends, 1980-
2004. Research on Aging, 29, 297-322.
Friedman, Monroe. 1998. Coping With Consumer Fraud: The Need for a Paradigm Shift.
Journal of Consumer Affairs, 32, 1-12.
Gmel, Gerhard. 2001. Imputation of Missing Values in the Case of Multiple Item Instrument
Measuring Alcohol Consumption. Statistics in Medicine, 20, 2369-2381.
Gottfredson, Michael R., and Travis Hirschi. 1990. A general theory of crime. Stanford, CA:
Stanford University Press.
Hafemeister, Thomas L. 2002. Financial Abuse of the Elderly in Domestic Settings. Pp. 382-445
in Richard J. Bonnie and Robert B. Wallace (Eds.), Elder Mistreatment: Abuse, Neglect,
and Exploitation in an Aging America. National Academies Press.
This document is a research report submitted to the U.S. Department of Justice. This report has not been published by the Department. Opinions or points of view expressed are those of the author(s)
and do not necessarily reflect the official position or policies of the U.S. Department of Justice.
136
Hall, Ryan, C., Richard C.W. Hall, and Marcia J. Chapman. 2005. Exploitation of the Elderly:
Undue Influence as a Form of Elder Abuse. Clinical Geriatrics, 13, 28-36.
Holtfreter, Kristy, Michael D. Reisig, and Thomas G. Blomberg. 2006. Consumer Fraud
Victimization in Florida: An Empirical Study. St. Thomas Law Review, 18, 761-789.
Holtfreter, Kristy, Michael D. Reisig, and Travis Pratt. 2008. Low Self-Control, Routine
Activities, and Fraud Victimization. Criminology, 46, 189-220.
Hox, Joop J., and Edith D. De Leeuw. 1994. A Comparison of Nonresponse in Mail, Telephone,
and Face-to-Face Surveys: Applying Multilevel Modeling in Meta-Analysis. Quality and
Quantity, 28, 329-344.
Jesilow, Paul, Esther Klemper, and Victoria Chao. 1992. Reporting Consumer and Major Fraud:
A Survey of Complainants. Pp. 149-168 in White-Collar Crime Reconsidered, edited by
Kip Schlegel and David Weisburd. Boston: Northeastern University Press.
Johnson, Kelly D. 2003. Financial Crimes Against the Elderly. Washington, D.C.: Office of
Community Oriented Policing Services.
Klaus, Patsy. 2005. Crimes Against Persons Age 65 or Older, 1993-2002. Washington,
D.C.: Bureau of Justice Statistics.
Laumann Edward O., Sara A. Leitsch, and Linda J. Waite. 2008. Elder Mistreatment in the
United States: Prevalence Estimates from a Nationally Representative Study. Journals of
Gerontology: Social Sciences, 63B, S248–S254.
Lee, Jinkook, and Horacio Soberon-Ferrer. 1997. Consumer Vulnerability to Fraud: Influencing
Factors. Journal of Consumer Affairs, 31, 70-89.
Lewis, Catherine F., Cynthia Fields, and Elizabeth Rainey. 2006. A Study of Geriatric Forensic
Evaluees: Who Are the Violent Elderly? Journal of the American Academy of Psychiatry
and the Law, 34, 324-332.
This document is a research report submitted to the U.S. Department of Justice. This report has not been published by the Department. Opinions or points of view expressed are those of the author(s)
and do not necessarily reflect the official position or policies of the U.S. Department of Justice.
137
Long, J. Scott. 1997. Regression Models for Categorical and Limited Dependent Variables.
Thousand Oaks, CA: Sage.
Mason, Karen, and Michael Benson. 1996. The Effect of Social Support on Fraud Victims’
Reporting Behavior: A Research Note. Justice Quarterly, 12, 511-523.
McGuire, Mary V., and Herbert Elderhertz. 1980. Consumer Abuse of Older Americans:
Victimization and Remedial Action in Two Metropolitan Areas. Pp. 266-292 in White-
Collar Crime: Theory and Research, edited by Gilbert Geis and Ezra Stotland. Beverly
Miller, Larry S. and John T. Whitehead. 1996. Introduction to Criminal Justice Research and
Statistics. Cincinnati, OH: Anderson.
Miranda, Alfonso and Sophia Rabe-Hesketh. 2006. Maximum Likelihood of Endogenous
Switching and Sample Selection Models for Binary, Ordinal, and Count Variables. The
Stata Journal, 6, 285-308.
Muscat, Glenn, Marianne James, and Adam Graycar. 2002. Older People and Consumer Fraud.
Canberra: Australian Institute of Criminology.
Myrtveit, Ingunn, Stensrud, Erik, and Ulf Olsson. 2001. Analyzing Data Sets with Missing Data:
An Empirical Evaluation of Imputation Methods and Likelihood-based Methods. IEEE
Transactions on Software Engineering, 27, 999-1013.
Pratt, Travis C., Kristy Holtfreter, and Michael D. Reisig. 2010. Routine Online Activity and
Internet Fraud Targeting: Extending the Generality of Routine Activity Theory. Journal
of Research in Crime and Delinquency, 47, 267-296.
Princeton Survey Research Associates. 1999. Consumer Behavior, Experiences, and Attitudes: A
Comparison by Age Groups. Washington, D.C.: AARP.
This document is a research report submitted to the U.S. Department of Justice. This report has not been published by the Department. Opinions or points of view expressed are those of the author(s)
and do not necessarily reflect the official position or policies of the U.S. Department of Justice.
138
Ravenna, Donald. 2004. Seniors vs. Crime Annual Report. Tallahassee, FL: Office of the
Attorney General.
Reisig, Michael D., and Kristy Holtfreter. 2013. Shopping Fraud Victimization Among the
Elderly. Journal of Financial Crime, 20, 324-337.
Reisig, Michael D., and Kristy Holtfreter. 2007. Fraud Victimization and Confidence in Florida’s
Legal Authorities. Journal of Financial Crime, 14, 113-126.
Reisig, Michael D., Travis C. Pratt, and Kristy Holtfreter. 2009. Perceived Risk of Internet Theft
Victimization: Examining the Effects of Social Vulnerability and Impulsivity. Criminal
Justice and Behavior, 36, 369-384.
Reyns, Bradford W. 2013. Online Routines and Identity Theft: Further Expanding Routine
Activity Theory Beyond Direct-Contact Offenses. Journal of Research in Crime and
Delinquency, 50, 216-238.
Romal, Jane B., and Barbara J. Kaplan. 1995. Differences in Self-Control Among Spenders and
Savers. Psychology: A Journal of Human Behavior, 32, 8-17.
Rosoff, Stephen M., Henry N. Pontell, and Robert H. Tillman. 2004. Profit Without Honor:
White-Collar Crime and the Looting of America (3rd ed). Upper Saddle River, NJ:
Prentice-Hall.
Roth, Philip L. 1994. Missing Data: A Conceptual Review for Applied Psychologists. Personnel
Psychology, 47, 537-560.
Schafer, Joseph L., and John W. Graham. 2002. Missing Data: Our View of the State of the Art.
Psychological Methods, 7, 147-177.
Schreck, Christopher J. 1999. Criminal Victimization and Low Self-Control: An Extension and
Test of a General Theory of Crime. Justice Quarterly, 16, 633-654.
This document is a research report submitted to the U.S. Department of Justice. This report has not been published by the Department. Opinions or points of view expressed are those of the author(s)
and do not necessarily reflect the official position or policies of the U.S. Department of Justice.
139
Stewart, Eric A., Kirk W. Elifson, and Claire E. Sterk. 2004. Integrating the General Theory of
Crime into an Explanation of Violent Victimization Among Female Offenders. Justice
Quarterly, 21, 159-181.
Suzman, Richard M., David P. Willis, and Kenneth G. Manton. 1992. The Oldest Old. New
York, NY: Oxford University Press.
Tangney, June P., Roy F. Baumeister, and Angie Luzio Boone. 2004. High Self-Control Predicts
Good Adjustment, Less Pathology, Better Grades, and Interpersonal Success. Journal of
Personality, 72, 271-324.
Titus, Richard, Fred Heinzelmann, and John M. Boyle. 1995. Victimization of Persons by Fraud.
Crime and Delinquency, 41, 54-72.
United States Bureau of the Census. 2012. Florida Quick Facts: Persons 65 Years and Over,
Percent, 2012. Washington, D.C.: United States Bureau of the Census.
United States Bureau of the Census. 2000. Census Data for the State of Florida. Washington,
D.C.: United States Bureau of the Census.
Van Wilsem, Johan A. 2013. ‘Bought It, but Never Got It’: Assessing Risk Factors for Online
Consumer Fraud Victimization. European Sociological Review, 29, 168-178.
Van Wyk, Judy, and Michael Benson. 1997. Fraud Victimization: Risky Business or Just Bad
Luck? American Journal of Criminal Justice, 21, 163-179.
Van Wyk, Judy, and Karen Mason. 2001. Investigating Vulnerability and Reporting Behavior for
Consumer Fraud Victimization. Journal of Contemporary Criminal Justice, 17, 328-345.
Woodford, H. J., and J. George. 2007. Cognitive Assessment in the Elderly: A Review of
Clinical Methods. Quarterly Journal of Medicine, 100, 469-484.
Zickuhr, Kathryn. 2011. Generations and their gadgets. Retrieved from Pew Research Center
This document is a research report submitted to the U.S. Department of Justice. This report has not been published by the Department. Opinions or points of view expressed are those of the author(s)
and do not necessarily reflect the official position or policies of the U.S. Department of Justice.
Holtfreter, Kristy, and Michael D. Reisig (2013). Routine activities and identity theft
victimization in late adulthood. The 65th Annual Meeting of the American Society
of Criminology, Atlanta, GA.
Mears, Daniel P., Michael D. Reisig, Samuel Scaggs, and Kristy Holtfreter (2013).
Awareness among the elderly of efforts to reduce fraud victimization. The 65th
Annual Meeting of the American Society of Criminology, Atlanta, GA.
Wolfe, Scott E., Michael D. Reisig, and Kristy Holtfreter (2013). Opportunity, offending,
and crime analogous outcomes in late life: General routines or domain-specific
opportunities? The 65th Annual Meeting of the American Society of Criminology,
Atlanta, GA.
Reisig, Michael D., and Kristy Holtfreter (2012). Explaining elderly victimization:
Assault, theft, and consumer fraud. The 64th Annual Meeting of the American
Society of Criminology, Chicago, IL.
Wolfe, Scott E. (2012). Gender, race, self-control, and offending in late life: A test of
self-control theory and the invariance thesis. The 64th Annual Meeting of the
American Society of Criminology, Chicago, IL.
Wolfe, Scott E. (2011). Routine activity, low self-control, and offending late in the life
course. The 63rd Annual Meeting of the American Society of Criminology,
Washington, D.C.
Reisig, Michael D., Kristy Holtfreter, Daniel P. Mears, and Scott E. Wolfe (2011).
Financial exploitation of the elderly in a consumer context: Some preliminary
findings. The 63rd Annual Meeting of the American Society of Criminology,
Washington, D.C.
Completed Dissertation
Wolfe, Scott E. (2012). Crime in late life. Arizona State University, School of
Criminology and Criminal Justice.
Published Articles
Reisig, Michael D., and Kristy Holtfreter (2013). Shopping fraud victimization among
the elderly. Journal of Financial Crime 20 (3): 324-337.
This document is a research report submitted to the U.S. Department of Justice. This report has not been published by the Department. Opinions or points of view expressed are those of the author(s)
and do not necessarily reflect the official position or policies of the U.S. Department of Justice.
141
Articles under Review and In Progress
Mears, Daniel P., Michael D. Reisig, Samuel Scaggs, and Kristy Holtfreter. Efforts to
reduce consumer fraud victimization among the elderly: The effect of information
access on program awareness and contact. Under review.
Wolfe, Scott E. (2012). Gender, race, self-control, and offending in late life: Support and
challenges for the generality of self-control theory. Under review.
Wolfe, Scott E., Michael D. Reisig, and Kristy Holtfreter. Crime in late life: Implications
for the generality of low self-control theory. In progress.
Holtfreter, Kristy, and Michael D. Reisig. Routine activities and identity theft
victimization in late adulthood. In progress.
Holtfreter, Kristy, Michael D. Reisig, and Jillian J. Turanovic. Victimization, depression,
and negative coping in late adulthood: A test of General Strain Theory. In
progress.
This document is a research report submitted to the U.S. Department of Justice. This report has not been published by the Department. Opinions or points of view expressed are those of the author(s)
and do not necessarily reflect the official position or policies of the U.S. Department of Justice.
142
APPENDIX A: The Nature and Prevalence Of Physical Mistreatment
The portion of the survey that featured the physical mistreatment items began with the
following introduction:
People are sometimes physically hurt by other people. The person doing
these things could be someone close to you, like a family member or
friend, or someone you don’t know very well.
The following three items are used to capture incidents of physical mistreatment. These
items are very similar to those used in previous studies (see, e.g., Acierno et al., 2010;
Laumann, Leitsch, & Waite, 2008). Much like the consumer fraud and financial
mistreatment items, these items also included a number of follow-up questions that were
presented to those who answered in the affirmative to any of the three following items.
1. “Has anyone ever hit you with their hand or object, slapped you, kicked you, or
threatened you with a weapon?” (hit, kicked or threatened)
2. “Has anyone ever held you down, tied you up, or locked you in your room or house
or some other place against your will?” (forcibly restrained)
3. “Has anyone ever physically hurt you so that you suffered some degree of injury,
including cuts, bruises, or other marks?” (physically injured)
Self-reported incidents of physical mistreatment are assessed from two time periods: (1)
the year prior to the study; and, (2) two years prior to the study. Each of the three
physical mistreatment items feature a binary response set (1 = yes, 0 = no). For the
multivariate analysis, respondents are considered a victim of mistreatment (coded as 1) if
the answered in the affirmative to one or more of the three survey items.
The overall prevalence of physical mistreatment was 0.6% (or 12 of the 1982
respondents for whom data are available) during the one-year observation period. This is
This document is a research report submitted to the U.S. Department of Justice. This report has not been published by the Department. Opinions or points of view expressed are those of the author(s)
and do not necessarily reflect the official position or policies of the U.S. Department of Justice.
143
lower than recent national prevalence estimates of 1.6% (Acierno et al., 2009). For the
two years leading up to this study the prevalence of physical mistreatment was 1.4% (or
28 of the 1982 respondents). In terms of seriousness, a majority of individuals did not
receive medical treatment as a result of their physical victimization. However, physical
mistreatment still led to 27.3% of victims receiving medical treatment during the one-
year observation period (see Appendix Table 1).
The frequency distributions clearly show that all three types of physical
mistreatment are rare. Only seven participants reported that someone had hit, slapped,
kicked, or threatened them with a weapon in the year prior to the study (0.4%). Similarly,
five people indicated that someone had physically injured them (0.3%) and two
individuals reporting that someone had held them down, tied them up, or locked them in
a room or house against their will (0.1%). This general pattern of findings was also
observed during the two-year observation.
Appendix A Table 1
Prevalence of Physical Mistreatment
Past year Past 2 years
N % N %
Physical mistreatment Yes 12 0.6 28 1.4
No 1970 99.4 1954 98.6
Hit, kicked or threatened Yes 7 0.4 22 1.1
No 1985 99.6 1970 98.9
Forcibly restrained Yes 2 0.1 3 0.2
No 1994 99.9 1993 99.8
Physically injured Yes 5 0.3 7 0.4
No 1984 99.7 1982 99.6
This document is a research report submitted to the U.S. Department of Justice. This report has not been published by the Department. Opinions or points of view expressed are those of the author(s)
and do not necessarily reflect the official position or policies of the U.S. Department of Justice.
144
Appendix Table 2 features information regarding the victim-offender
relationships for physical mistreatment. Similar to financial mistreatment (see, e.g., Table
22), strangers (36.4%; or 4 of the 11 victims) and family members (i.e., spouse/partner
and son/daughter) (36.4%; or 4 of the 11 victims) were the most common offenders.
Within the family member category, spouses/partners were the most common group of
offenders. The two-year observation period yielded a similar pattern of results.
Appendix A Table 2
Victim-Offender Relationship for Physical Mistreatment
Past year Past 2 years
N % N %
Physical mistreatment
Spouse or partner 3 27.3 6 26.1
Ex-spouse or partner 0 0.0 2 8.7
Son or daughter 1 9.1 1 4.3
Friend 1 9.1 1 4.3
Neighbor 1 9.1 1 4.3
Stranger (no relation) 4 36.4 9 39.1
Other non-relative 1 9.1 3 13.0
Hit, kicked or threatened
Spouse or partner 1 16.7 4 25.0
Ex-spouse or partner 0 0.0 2 12.5
Son or daughter 1 16.7 1 6.3
Neighbor 1 16.7 1 6.3
Stranger (no relation) 3 50.0 7 43.8
Other non-relative 0 0.0 1 6.3
Forcibly restrained
Spouse or partner 2 100.0 2 66.7
Ex-spouse or partner 0 0.0 1 33.3
Physically injured
Spouse or partner 1 25.0 1 16.7
Friend 1 25.0 1 16.7
Neighbor 1 25.0 2 33.3
Stranger (no relation) 1 25.0 2 33.3
This document is a research report submitted to the U.S. Department of Justice. This report has not been published by the Department. Opinions or points of view expressed are those of the author(s)
and do not necessarily reflect the official position or policies of the U.S. Department of Justice.
145
These results are consistent across each type of physical mistreatment. Victims
were most frequently hit, slapped, kicked, or threatened by a stranger (50.0%; or 3 of the
6 victims). About one-third of victims of hitting were victimized by a family member
(i.e., spouse/partner and son/daughter) (33.3%; or 2 of the 6 victims). Respondents who
indicated that they had been restrained against their will were victimized by a relative
(i.e., spouse/partner and ex-spouse/partner). Of the four victims of physical injury the
offenders were equally distributed between a spouse/partner, friend, neighbor, and
stranger (25.0%; or 1 of the 4 victims for each offender type).
Victims of physical mistreatment reporting practices are featured in Appendix
Table 3. The results for overall physical mistreatment show that over half of victims
called the police (54.5%; or 6 of the 11 victims). The data also show that other authorities
such as social services were contacted less frequently than the police (36.4%; or 4 of the
11 victims). Victims of physical mistreatment are more likely to contact the police and
social services when compared to victims of financial mistreatment (see, e.g., Table 23).
The small cell counts for reporting practices across specific forms of physical
mistreatment make it difficult to reliably interpret the findings.
This document is a research report submitted to the U.S. Department of Justice. This report has not been published by the Department. Opinions or points of view expressed are those of the author(s)
and do not necessarily reflect the official position or policies of the U.S. Department of Justice.
146
Appendix A Table 3
Reporting of Physical Mistreatment to Authorities
Past year Past 2 years
N % N %
Physical mistreatment
Reported to police Yes 6 54.5 11 47.8
No 5 45.5 12 52.2
Reported to other authorities Yes 4 36.4 4 18.2
No 7 63.6 18 81.8
Hit, kicked or threatened
Reported to police Yes 3 50.0 8 47.1
No 3 50.0 9 52.9
Reported to other authorities Yes 3 50.0 3 18.8
No 3 50.0 13 81.3
Forcibly restrained
Reported to police Yes 1 50.0 1 33.3
No 1 50.0 2 66.7
Reported to other authorities Yes 1 50.0 1 50.0
No 1 50.0 1 50.0
Physically injured
Reported to police Yes 3 75.0 3 50.0
No 1 25.0 3 50.0
Reported to other authorities Yes 0 0.0 0 0.0
No 5 100.0 7 100.0
This document is a research report submitted to the U.S. Department of Justice. This report has not been published by the Department. Opinions or points of view expressed are those of the author(s)
and do not necessarily reflect the official position or policies of the U.S. Department of Justice.
APPENDIX B: Fraud Targeting State Subsample Analyses
Appendix B Table 1
Fraud Targeting Logistic Regression Models for Arizona
Note. Robust standard errors are in parentheses. * p < 0.05, ** p < 0.01 (two-tailed test).
This document is a research report submitted to the U.S. Department of Justice. This report has not been published by the Department. Opinions or points of view expressed are those of the author(s)
and do not necessarily reflect the official position or policies of the U.S. Department of Justice.
148
Appendix B Table 2
Fraud Targeting Logistic Regression Models for Florida
Note. Robust standard errors are in parentheses. * p < 0.05, ** p < 0.01 (two-tailed test).
This document is a research report submitted to the U.S. Department of Justice. This report has not been published by the Department. Opinions or points of view expressed are those of the author(s)
and do not necessarily reflect the official position or policies of the U.S. Department of Justice.
149
APPENDIX C: Fraud Victimization (Full Sample) State Subsample Analyses
Appendix C Table 1
Fraud Victimization Logistic Regression Models (Full Sample) for Arizona
Note. Robust standard errors are in parentheses. * p < 0.05,** p < 0.01 (two-tailed test).
This document is a research report submitted to the U.S. Department of Justice. This report has not been published by the Department. Opinions or points of view expressed are those of the author(s)
and do not necessarily reflect the official position or policies of the U.S. Department of Justice.
150
Appendix C Table 2
Fraud Victimization Logistic Regression Models (Full Sample) for Florida
Note. Robust standard errors are in parentheses. * p < 0.05, ** p < 0.01 (two-tailed test).
This document is a research report submitted to the U.S. Department of Justice. This report has not been published by the Department. Opinions or points of view expressed are those of the author(s)
and do not necessarily reflect the official position or policies of the U.S. Department of Justice.
APPENDIX D: Fraud Victimization (Targeted Sample) State Subsample Analyses
Appendix D Table 1
Fraud Victimization Logistic Regression Models (Targeted Sample) for Arizona
Note. Robust standard errors are in parentheses. * p < 0.05, ** p < 0.01 (two-tailed test).
This document is a research report submitted to the U.S. Department of Justice. This report has not been published by the Department. Opinions or points of view expressed are those of the author(s)
and do not necessarily reflect the official position or policies of the U.S. Department of Justice.
152
Appendix D Table 2
Fraud Victimization Logistic Regression Models (Targeted Sample) for Florida
Note. Robust standard errors are in parentheses. * p < 0.05, ** p < 0.01 (two-tailed test).
This document is a research report submitted to the U.S. Department of Justice. This report has not been published by the Department. Opinions or points of view expressed are those of the author(s)
and do not necessarily reflect the official position or policies of the U.S. Department of Justice.
153
APPENDIX E: Financial Mistreatment State Subsample Analyses
Appendix E Table 1
Financial Mistreatment Logistic Regression Models for Arizona
Note. Robust standard errors are in parentheses. * p < 0.05, ** p < 0.01 (two-tailed test).
This document is a research report submitted to the U.S. Department of Justice. This report has not been published by the Department. Opinions or points of view expressed are those of the author(s)
and do not necessarily reflect the official position or policies of the U.S. Department of Justice.
154
Appendix E Table 2
Financial Mistreatment Logistic Regression Models for Florida
Note. Robust standard errors are in parentheses. * p < 0.05, ** p < 0.01 (two-tailed test).
This document is a research report submitted to the U.S. Department of Justice. This report has not been published by the Department. Opinions or points of view expressed are those of the author(s)
and do not necessarily reflect the official position or policies of the U.S. Department of Justice.
155
APPENDIX F: Survey Instrument
[Initial Introduction] Hello, my name is __________, and I’m calling on behalf of [Arizona
State University or Florida State University. We are interested in talking with people 60 years
of age or older.
Q1 How many adults age 60 or older live in this household?
0 = Thank and End.
1 = Go to Question 2
2 or more = Go to Question 3
Q2 May I speak with that person?
1 = On the phone (Continue to Follow-up Introduction)
2 = Impaired (Thank and End)
3 = Called to the phone (Repeat Initial Introduction and continue to Follow-up
Introduction)
4 = Unavailable (Schedule Callback)
5 = Refused (Thank and End)
Q3 In order to select just one person to interview, may I please speak to the person 60 years
of age or older living in your household who will have the next birthday?
1 = On the phone (Continue to Follow-up Introduction)
2 = Impaired (Thank and End)
3 = Called to the phone (Repeat Initial Introduction and continue to Follow-up
Introduction)
4 = Unavailable (Schedule Callback)
5 = Refused (Thank and End)
[Follow-Up Introduction] We are interviewing [Arizonans or Floridians] about different kinds
of crimes on behalf of the National Institute of Justice, a research agency in the U.S.
Department of Justice. There are no wrong or right answers. You can skip questions if you
wish. You may choose to stop at any time. Your participation is voluntary. We will not ask for
your name or any information that would allow us or others to guess who you are. The
interview takes about 15 minutes. Is now a good time?
I would like to begin by asking you some questions that require you to use your memory. I am
going to name three objects. Please wait until I say all three words. Do not write them down.
Remember what they are because I am going to ask you to name them again in a few moments.
The three words are: APPLE, TABLE, PENNY. (Interviewer may repeat names 3 times if
necessary.)
Q4 What year is this?
1 = Correctly identified
0 = Incorrectly identified
Q5 What month is this?
1 = Correctly identified
0 = Incorrectly identified
This document is a research report submitted to the U.S. Department of Justice. This report has not been published by the Department. Opinions or points of view expressed are those of the author(s)
and do not necessarily reflect the official position or policies of the U.S. Department of Justice.
156
Q6 What is the day of the week?
1 = Correctly identified
0 = Incorrectly identified
Q7 What were the three objects I asked you to remember? (Record # remembered; Order
of recall is not important.)
0 = Zero Correct
1 = One Correct
2 = Two Correct
3 = Three Correct
[Sum response codes for Q4 – Q7. If score is 3 or higher, continue with interview. If score is 0,
1, or 2, then thank and end interview.]
Now, please tell me whether, yes or no, you have done any of the following in the past YEAR.
(RANDOMIZE Q8 – Q12 STATEMENTS)
Q8 Have you purchased something in response to a telemarketing call from a company
with whom you have NOT previously done business?
1 = Yes (go to Q8a)
0 = No (go to Q9)
99 = Don’t Know/Refused (go to Q9)
Q8a How many purchases have you made in the last year? (RECORD EXACT
NUMBER; -999 Don’t Know/Refused) (go to Q8b)
Q8b How much money did you spend on all such purchases last year? (RECORD
EXACT AMOUNT IN DOLLARS; -999 Don’t Know/Refused)
Q9 Have you purchased something from an Internet web site?
1 = Yes (go to Q9a)
0 = No (go to Q10)
99 = Don’t Know/Refused (go to Q10)
Q9a How many purchases have you made in the last year? (RECORD EXACT
NUMBER; -999 Don’t Know/Refused) (go to Q9b)
Q9b How much money did you spend on all such purchases last year? (RECORD
EXACT AMOUNT IN DOLLARS; -999 Don’t Know/Refused)
Q10 Have you placed an order for a product by phone, Internet or mail after seeing a
television advertisement or infomercial?
1 = Yes (go to Q10a)
0 = No (go to Q11)
99 = Don’t Know/Refused (go to Q11)
Q10a How many purchases have you made in the last year? (RECORD EXACT
NUMBER; -999 Don’t Know/Refused) (go to Q10b)
This document is a research report submitted to the U.S. Department of Justice. This report has not been published by the Department. Opinions or points of view expressed are those of the author(s)
and do not necessarily reflect the official position or policies of the U.S. Department of Justice.
157
Q10b How much money did you spend on all such purchases last year? (RECORD
EXACT AMOUNT IN DOLLARS; -999 Don’t Know/Refused)
Q11 Have you placed an order for a product by phone, Internet or mail after receiving an
offer in the mail from a company with whom you have NOT previously done business?
1 = Yes (go to Q11a)
0 = No (go to Q12)
99 = Don’t Know/Refused (go to Q12)
Q11a How many purchases have you made in the last year? (RECORD EXACT
NUMBER; -999 Don’t Know/Refused) (go to Q11b)
Q11b How much money did you spend on all such purchases last year? (RECORD
EXACT AMOUNT IN DOLLARS; -999 Don’t Know/Refused)
Q12 Have you placed an order for a product by phone, Internet or mail after receiving an
email offer from a company with whom you have NOT previously done business?
1 = Yes (go to Q12a)
0 = No (go to Q13)
99 = Don’t Know/Refused (go to Q13)
Q12a How many purchases have you made in the last year? (RECORD EXACT
NUMBER; -999 Don’t Know/Refused) (go to Q12b)
Q12b How much money did you spend on all such purchases last year? (RECORD
EXACT AMOUNT IN DOLLARS; -999 Don’t Know/Refused)
Thank you. That is helpful.
Q13 Do you ever go online to access the Internet?
1 = Yes (go to Q13a)
0 = No (go to Q14)
99 = Don’t Know/Refused (go to Q14)
Q13a How many hours each week would you say you spend on the Internet?
(RECORD EXACT NUMBER OF HOURS; -999 for Don’t know/Refused)
Q14 Do you manage your own money, like a checking account?
1 = Yes
0 = No
99 = Don’t Know/Refused
Q15 How much difficulty do you have managing your money, such as keeping track of
expenses or paying bills? (READ RESPONSES)
0 = No difficulty
1 = Some difficulty
2 = A lot of difficulty
3 = Unable to do it
99 = Don’t Know/Refused
This document is a research report submitted to the U.S. Department of Justice. This report has not been published by the Department. Opinions or points of view expressed are those of the author(s)
and do not necessarily reflect the official position or policies of the U.S. Department of Justice.
158
Q16 Do you receive help from another person in managing your money?
1 = Yes (go to Q16a)
0 = No (go to Q17)
99 = Don’t Know/Refused (go to Q17)
Q16a What is that person’s relationship to you?
1 = A spouse or partner
2 = An EX-spouse or partner
3 = A son or daughter
4 = A brother or sister
5 = A parent or step-parent
6 = Another relative (Specify)
7 = A friend
8 = A neighbor
9 = Some other non-relative (Specify)
99 = Don’t know/Refused
Please indicate whether you strongly agree, agree, disagree, or strongly disagree with the
following statements. (RANDOMIZE Q17 – Q35 STATEMENTS)
Q17 I am basically satisfied with my life.
1 = Strongly agree
2 = Agree
3 = Disagree
4 = Strongly disagree
99 = Don’t know/Refused
Q18 It is easy for me to trust someone.
1 = Strongly agree
2 = Agree
3 = Disagree
4 = Strongly disagree
99 = Don’t know/Refused
Q19 I often feel isolated from others.
1 = Strongly agree
2 = Agree
3 = Disagree
4 = Strongly disagree
99 = Don’t know/Refused
Q20 I often get bored.
1 = Strongly agree
2 = Agree
3 = Disagree
4 = Strongly disagree
99 = Don’t know/Refused
This document is a research report submitted to the U.S. Department of Justice. This report has not been published by the Department. Opinions or points of view expressed are those of the author(s)
and do not necessarily reflect the official position or policies of the U.S. Department of Justice.
159
Q21 My tendency to trust people is high.
1 = Strongly agree
2 = Agree
3 = Disagree
4 = Strongly disagree
99 = Don’t know/Refused
Q22 I do certain things that are bad for me, if they are fun.
1 = Strongly agree
2 = Agree
3 = Disagree
4 = Strongly disagree
99 = Don’t know/Refused
Q23 I often feel helpless.
1 = Strongly agree
2 = Agree
3 = Disagree
4 = Strongly disagree
99 = Don’t know/Refused
Q24 Trusting someone is NOT difficult for me.
1 = Strongly agree
2 = Agree
3 = Disagree
4 = Strongly disagree
99 = Don’t know/Refused
Q25 I am good at resisting temptation.
1 = Strongly agree
2 = Agree
3 = Disagree
4 = Strongly disagree
99 = Don’t know/Refused
Q26 I know people who would help me if I were confined to bed.
1 = Strongly agree
2 = Agree
3 = Disagree
4 = Strongly disagree
99 = Don’t know/Refused
Q27 I often feel that I lack companionship.
1 = Strongly agree
2 = Agree
3 = Disagree
4 = Strongly disagree
99 = Don’t know/Refused
This document is a research report submitted to the U.S. Department of Justice. This report has not been published by the Department. Opinions or points of view expressed are those of the author(s)
and do not necessarily reflect the official position or policies of the U.S. Department of Justice.
160
Q28 I prefer staying at home rather than going out and doing things.
1 = Strongly agree
2 = Agree
3 = Disagree
4 = Strongly disagree
99 = Don’t know/Refused
Q29 I have people who I can talk to about my problems.
1 = Strongly agree
2 = Agree
3 = Disagree
4 = Strongly disagree
99 = Don’t know/Refused
Q30 I often act without thinking through all the alternatives.
1 = Strongly agree
2 = Agree
3 = Disagree
4 = Strongly disagree
99 = Don’t know/Refused
Q31 I know people who I can turn to if I need good advice about a crisis.
1 = Strongly agree
2 = Agree
3 = Disagree
4 = Strongly disagree
99 = Don’t know/Refused
Q32 I feel pretty worthless right now.
1 = Strongly agree
2 = Agree
3 = Disagree
4 = Strongly disagree
99 = Don’t know/Refused
Q33 The police in my community can be trusted to make good decisions.
1 = Strongly agree
2 = Agree
3 = Disagree
4 = Strongly disagree
99 = Don’t know/Refused
Q34 I believe you should accept decisions made by the police even if you think they are
wrong.
1 = Strongly agree
2 = Agree
3 = Disagree
4 = Strongly disagree
99 = Don’t know/Refused
This document is a research report submitted to the U.S. Department of Justice. This report has not been published by the Department. Opinions or points of view expressed are those of the author(s)
and do not necessarily reflect the official position or policies of the U.S. Department of Justice.
161
Q35 In my community the criminal justice system does a good job making sure criminals
get what they deserve, no more, no less.
1 = Strongly agree
2 = Agree
3 = Disagree
4 = Strongly disagree
99 = Don’t know/Refused
Now I’d like to ask you about some things that people do from time to time. Remember that
your answers are anonymous, so please report honestly. Thinking about the PAST YEAR,
please tell me whether you frequently, sometimes, rarely or never did each of the following:
(RANDOMIZE Q36 – Q52 STATEMENTS)
Q36 Participated in social activities away from home?
1 = Frequently
2 = Sometimes
3 = Rarely
4 = Never
99 = Don’t know/Refused
Q37 Bought something on the spur of the moment that you really did not need?
1 = Frequently
2 = Sometimes
3 = Rarely
4 = Never
99 = Don’t know/Refused
Q38 Took an inexpensive item from a store without paying for it?
1 = Frequently
2 = Sometimes
3 = Rarely
4 = Never
99 = Don’t know/Refused
Q39 Got together socially with people who DO NOT live with you, such as friends,
neighbors, and relatives?
1 = Frequently
2 = Sometimes
3 = Rarely
4 = Never
99 = Don’t know/Refused
Q40 Took a higher dosage of medicine than recommended by the doctor or the package
insert?
1 = Frequently
2 = Sometimes
3 = Rarely
4 = Never
99 = Don’t know/Refused
This document is a research report submitted to the U.S. Department of Justice. This report has not been published by the Department. Opinions or points of view expressed are those of the author(s)
and do not necessarily reflect the official position or policies of the U.S. Department of Justice.
162
Q41 Deliberately wrote a bad check?
1 = Frequently
2 = Sometimes
3 = Rarely
4 = Never
99 = Don’t know/Refused
Q42 Went shopping at grocery, drug, hardware, department or convenience stores?
1 = Frequently
2 = Sometimes
3 = Rarely
4 = Never
99 = Don’t know/Refused
Q43 Borrowed something and DID NOT return it?
1 = Frequently
2 = Sometimes
3 = Rarely
4 = Never
99 = Don’t know/Refused
Q44 Slapped, kicked, or punched another person?
1 = Frequently
2 = Sometimes
3 = Rarely
4 = Never
99 = Don’t know/Refused
Q45 Went to church, temple, or another place of worship for services or other activities?
1 = Frequently
2 = Sometimes
3 = Rarely
4 = Never
99 = Don’t know/Refused
Q46 Took medication that was NOT prescribed to you?
1 = Frequently
2 = Sometimes
3 = Rarely
4 = Never
99 = Don’t know/Refused
Q47 Went to a movie, restaurant, club meeting, or other group event?
1 = Frequently
2 = Sometimes
3 = Rarely
4 = Never
99 = Don’t know/Refused
This document is a research report submitted to the U.S. Department of Justice. This report has not been published by the Department. Opinions or points of view expressed are those of the author(s)
and do not necessarily reflect the official position or policies of the U.S. Department of Justice.
163
Q48 Drove a motor vehicle while under the influence of alcohol?
1 = Frequently
2 = Sometimes
3 = Rarely
4 = Never
99 = Don’t know/Refused
Q49 Went to a drinking establishment, like a bar, tavern, or lounge?
1 = Frequently
2 = Sometimes
3 = Rarely
4 = Never
99 = Don’t know/Refused
Q50 Broke traffic laws while driving a motor vehicle?
1 = Frequently
2 = Sometimes
3 = Rarely
4 = Never
99 = Don’t know/Refused
Q51 Exercised and/or participated in leisure sports?
1 = Frequently
2 = Sometimes
3 = Rarely
4 = Never
99 = Don’t know/Refused
Q52 Parked a car in a place that you were NOT supposed to?
1 = Frequently
2 = Sometimes
3 = Rarely
4 = Never
99 = Don’t know/Refused
Sometimes consumers are misled into giving people money who grossly misrepresent or never
provide goods and services they promised. The people who do these things may or may not
work for legitimate businesses and may contact consumers through email, Internet sites,
telemarketing, infomercials, and other ways. (RANDOMIZE Q53 – Q62 STATEMENTS)
Q53 Has anyone ever tried to get you to pay for repairs to your home, an appliance, or
automobile for work that was never performed or was unnecessary?
1 = Yes (go to Q53a)
0 = No (go to Q54)
99 = Don’t Know (go to Q54)
Q53a About how many times has this happened to you in your lifetime? (RECORD
EXACT NUMBER; -999 Don’t Know/Refused) (go to Q53b)
This document is a research report submitted to the U.S. Department of Justice. This report has not been published by the Department. Opinions or points of view expressed are those of the author(s)
and do not necessarily reflect the official position or policies of the U.S. Department of Justice.
164
Q53b When was the last time this happened?
1 = Within the last year (go to Q53c)
2 = One to two years ago (go to Q53c)
3 = More than two years ago (go to Q54)
99 = Don’t know/Refused (go to Q54)
Q53c Did you pay for the repairs?
1 = Yes (go to Q53d)
0 = No (go to Q53e)
99 = Don’t know/Refused (go to Q54)
Q53d How much did you pay for the repairs? (RECORD EXACT AMOUNT IN
DOLLARS; -999 Don’t Know/Refused)
Q53e How did the person or company first contact you? (Read if necessary)
1 = Internet web site
2 = Email
3 = Television advertisement or infomercial
4 = Mail advertisement, including a catalog
5 = Telephone
6 = At a store you visited
7 = Someone came to your home
8 = A radio advertisement
9 = A poster or flier
10 = A magazine or newspaper advertisement
11 = A bill you received
12 = Other (SPECIFY)_________________ (example: word of mouth)
99 = Don’t Know/Refused
Q53f Was the incident reported to the police?
1 = Yes
0 = No
99 = Don’t Know/Refused
Q53g Was the incident reported to other authorities, like the Better Business Bureau
or a government agency?
1 = Yes
0 = No
99 = Don’t Know/Refused
Q54 Has anyone ever tried to sell you a health care, beauty care, weight-loss or other
product or service that did not work as claimed?
1 = Yes (go to Q54a)
0 = No (go to Q55)
99 = Don’t Know (go to Q55)
Q54a About how many times has this happened to you in your lifetime? (RECORD
EXACT NUMBER; -999 Don’t Know/Refused) (go to Q54b)
This document is a research report submitted to the U.S. Department of Justice. This report has not been published by the Department. Opinions or points of view expressed are those of the author(s)
and do not necessarily reflect the official position or policies of the U.S. Department of Justice.
165
Q54b When was the last time this happened?
1 = Within the last year (go to Q54c)
2 = One to two years ago (go to Q54c)
3 = More than two years ago (go to Q55)
99 = Don’t know/Refused (go to Q55)
Q54c Did you pay for the product or service?
1 = Yes (go to Q54d)
0 = No (go to Q54e)
99 = Don’t know/Refused (go to Q55)
Q54d How much did you pay for the product or service? (RECORD EXACT
AMOUNT IN DOLLARS; -999 Don’t Know/Refused)
Q54e How did the person or company first contact you? (Read if necessary)
1 = Internet web site
2 = Email
3 = Television advertisement or infomercial
4 = Mail advertisement, including a catalog
5 = Telephone
6 = At a store you visited
7 = Someone came to your home
8 = A radio advertisement
9 = A poster or flier
10 = A magazine or newspaper advertisement
11 = A bill you received
12 = Other (SPECIFY)_________________ (example: word of mouth)
99 = Don’t Know/Refused
Q54f Was the incident reported to the police?
1 = Yes
0 = No
99 = Don’t Know/Refused
Q54g Was the incident reported to other authorities, like the Better Business Bureau
or a government agency?
1 = Yes
0 = No
99 = Don’t Know/Refused
Q55 Has anyone ever tried to sell you a phony subscription to magazines or something else?
1 = Yes (go to Q55a)
0 = No (go to Q56)
99 = Don’t Know/Refused (go to Q56)
Q55a About how many times has this happened to you in your lifetime? (RECORD
EXACT NUMBER; -999 Don’t Know/Refused) (go to Q55b)
This document is a research report submitted to the U.S. Department of Justice. This report has not been published by the Department. Opinions or points of view expressed are those of the author(s)
and do not necessarily reflect the official position or policies of the U.S. Department of Justice.
166
Q55b When was the last time this happened?
1 = Within the last year (go to Q55c)
2 = One to two years ago (go to Q55c)
3 = More than two years ago (go to Q56)
99 = Don’t know/Refused (go to Q56)
Q55c Did you pay for the subscription?
1 = Yes (go to Q55d)
0 = No (go to Q55e)
99 = Don’t know/Refused (go to Q56)
Q55d How much did you pay for the subscription? (RECORD EXACT AMOUNT IN
DOLLARS; -999 Don’t Know/Refused)
Q55e How did the person or company first contact you? (Read if necessary)
1 = Internet web site
2 = Email
3 = Television advertisement or infomercial
4 = Mail advertisement, including a catalog
5 = Telephone
6 = At a store you visited
7 = Someone came to your home
8 = A radio advertisement
9 = A poster or flier
10 = A magazine or newspaper advertisement
11 = A bill you received
12 = Other (SPECIFY)_________________ (example: word of mouth)
99 = Don’t Know/Refused
Q55f Was the incident reported to the police?
1 = Yes
0 = No
99 = Don’t Know/Refused
Q55g Was the incident reported to other authorities, like the Better Business Bureau
or a government agency?
1 = Yes
0 = No
99 = Don’t Know/Refused
Q56 Has anyone ever tried to trick you into giving them money to improve your financial
situation, like repair credit or get equity out of your home?
1 = Yes (go to Q56a)
0 = No (go to Q57)
99 = Don’t Know/Refused (go to Q57)
Q56a About how many times has this happened to you in your lifetime? (RECORD
EXACT NUMBER; -999 Don’t Know/Refused) (go to Q56b)
This document is a research report submitted to the U.S. Department of Justice. This report has not been published by the Department. Opinions or points of view expressed are those of the author(s)
and do not necessarily reflect the official position or policies of the U.S. Department of Justice.
167
Q56b When was the last time this happened?
1 = Within the last year (go to Q56c)
2 = One to two years ago (go to Q56c)
3 = More than two years ago (go to Q57)
99 = Don’t know/Refused (go to Q57)
Q56c Did you pay for this service?
1 = Yes (go to Q56d)
0 = No (go to Q56e)
99 = Don’t know/Refused (go to Q57)
Q56d How much did you pay the person or company? (RECORD EXACT AMOUNT
IN DOLLARS; -999 Don’t Know/Refused)
Q56e How did the person or company first contact you? (Read if necessary)
1 = Internet web site
2 = Email
3 = Television advertisement or infomercial
4 = Mail advertisement, including a catalog
5 = Telephone
6 = At a store you visited
7 = Someone came to your home
8 = A radio advertisement
9 = A poster or flier
10 = A magazine or newspaper advertisement
11 = A bill you received
12 = Other (SPECIFY)_________________ (example: word of mouth)
99 = Don’t Know/Refused
Q56f Was the incident reported to the police?
1 = Yes
0 = No
99 = Don’t Know/Refused
Q56g Was the incident reported to other authorities, like the Better Business Bureau
or a government agency?
1 = Yes
0 = No
99 = Don’t Know/Refused
Q57 Has anyone ever tried to get you to invest in a phony business opportunity such as
work-at-home scams?
1 = Yes (go to Q57a)
0 = No (go to Q58)
99 = Don’t Know (go to Q58)
Q57a About how many times has this happened to you in your lifetime? (RECORD
EXACT NUMBER; -999 Don’t Know/Refused) (go to Q57b)
This document is a research report submitted to the U.S. Department of Justice. This report has not been published by the Department. Opinions or points of view expressed are those of the author(s)
and do not necessarily reflect the official position or policies of the U.S. Department of Justice.
168
Q57b When was the last time this happened?
1 = Within the last year (go to Q57c)
2 = One to two years ago (go to Q57c)
3 = More than two years ago (go to Q58)
99 = Don’t know/Refused (go to Q58)
Q57c Did you invest in the business opportunity?
1 = Yes (go to Q57d)
0 = No (go to Q57e)
99 = Don’t know/Refused (go to Q58)
Q57d How much money did you invest? (RECORD EXACT AMOUNT IN
DOLLARS; -999 Don’t Know/Refused)
Q57e How did the person or company first contact you? (Read if necessary)
1 = Internet web site
2 = Email
3 = Television advertisement or infomercial
4 = Mail advertisement, including a catalog
5 = Telephone
6 = At a store you visited
7 = Someone came to your home
8 = A radio advertisement
9 = A poster or flier
10 = A magazine or newspaper advertisement
11 = A bill you received
12 = Other (SPECIFY)_________________ (example: word of mouth)
99 = Don’t Know/Refused
Q57f Was the incident reported to the police?
1 = Yes
0 = No
99 = Don’t Know/Refused
Q57g Was the incident reported to other authorities, like the Better Business Bureau
or a government agency?
1 = Yes
0 = No
99 = Don’t Know/Refused
Q58 Has anyone ever tried to trick you into giving them your financial information, like
your credit card number or bank account information?
1 = Yes (go to Q58a)
0 = No (go to Q59)
99 = Don’t Know (go to Q59)
Q58a About how many times has this happened to you in your lifetime? (RECORD
EXACT NUMBER; -999 Don’t Know/Refused) (go to Q58b)
This document is a research report submitted to the U.S. Department of Justice. This report has not been published by the Department. Opinions or points of view expressed are those of the author(s)
and do not necessarily reflect the official position or policies of the U.S. Department of Justice.
169
Q58b When was the last time this happened?
1 = Within the last year (go to Q58c)
2 = One to two years ago (go to Q58c)
3 = More than two years ago (go to Q59)
99 = Don’t know/Refused (go to Q59)
Q58c Did the person your financial information?
1 = Yes (go to Q58d)
0 = No (go to Q58e)
99 = Don’t know/Refused (go to Q59)
Q58d How much money did you lose as a result of this incident? (RECORD EXACT
AMOUNT IN DOLLARS; -999 Don’t Know/Refused)
Q58e How did the person or company first contact you? (Read if necessary)
1 = Internet web site
2 = Email
3 = Television advertisement or infomercial
4 = Mail advertisement, including a catalog
5 = Telephone
6 = At a store you visited
7 = Someone came to your home
8 = A radio advertisement
9 = A poster or flier
10 = A magazine or newspaper advertisement
11 = A bill you received
12 = Other (SPECIFY)_________________ (example: word of mouth)
99 = Don’t Know/Refused
Q58f Was the incident reported to the police?
1 = Yes
0 = No
99 = Don’t Know/Refused
Q58g Was the incident reported to other authorities, like the Better Business Bureau
or a government agency?
1 = Yes
0 = No
99 = Don’t Know/Refused
12 = Other (SPECIFY)_________________ (example: word of mouth)
99 = Don’t Know/Refused
Q59 Has anyone ever tried to get you to contribute money to a phony charity or religious
organization?
1 = Yes (go to Q59a)
0 = No (go to Q60)
99 = Don’t Know (go to Q60)
Q59a About how many times has this happened to you in your lifetime? (RECORD
EXACT NUMBER; -999 Don’t Know/Refused) (go to Q59b)
This document is a research report submitted to the U.S. Department of Justice. This report has not been published by the Department. Opinions or points of view expressed are those of the author(s)
and do not necessarily reflect the official position or policies of the U.S. Department of Justice.
170
Q59b When was the last time this happened?
1 = Within the last year (go to Q59c)
2 = One to two years ago (go to Q59c)
3 = More than two years ago (go to Q60)
99 = Don’t know/Refused (go to Q60)
Q59c Did contribute money to the charity or organization?
1 = Yes (go to Q59d)
0 = No (go to Q59e)
99 = Don’t know/Refused (go to Q60)
Q59d How much money did you contribute? (RECORD EXACT AMOUNT IN
DOLLARS; -999 Don’t Know/Refused)
Q59e How did the person or company first contact you? (Read if necessary)
1 = Internet web site
2 = Email
3 = Television advertisement or infomercial
4 = Mail advertisement, including a catalog
5 = Telephone
6 = At a store you visited
7 = Someone came to your home
8 = A radio advertisement
9 = A poster or flier
10 = A magazine or newspaper advertisement
11 = A bill you received
12 = Other (SPECIFY)_________________ (example: word of mouth)
99 = Don’t Know/Refused
Q59f Was the incident reported to the police?
1 = Yes
0 = No
99 = Don’t Know/Refused
Q59g Was the incident reported to other authorities, like the Better Business Bureau
or a government agency?
1 = Yes
0 = No
99 = Don’t Know/Refused
Q60 Has anyone ever tried to get you to pay a fee to claim a phony prize, like a sweepstakes
or vacation?
1 = Yes (go to Q60a)
0 = No (go to Q61)
99 = Don’t Know (go to Q61)
Q60a About how many times has this happened to you in your lifetime? (RECORD
EXACT NUMBER; -999 Don’t Know/Refused) (go to Q60b)
This document is a research report submitted to the U.S. Department of Justice. This report has not been published by the Department. Opinions or points of view expressed are those of the author(s)
and do not necessarily reflect the official position or policies of the U.S. Department of Justice.
171
Q60b When was the last time this happened?
1 = Within the last year (go to Q60c)
2 = One to two years ago (go to Q60c)
3 = More than two years ago (go to Q61)
99 = Don’t know/Refused (go to Q61)
Q60c Did you end up paying money for the prize?
1 = Yes (go to Q60d)
0 = No (go to Q60e)
99 = Don’t know/Refused (go to Q61)
Q60d How much money did you pay to claim the prize? (RECORD EXACT
AMOUNT IN DOLLARS; -999 Don’t Know/Refused)
Q60e How did the person or company first contact you? (Read if necessary)
1 = Internet web site
2 = Email
3 = Television advertisement or infomercial
4 = Mail advertisement, including a catalog
5 = Telephone
6 = At a store you visited
7 = Someone came to your home
8 = A radio advertisement
9 = A poster or flier
10 = A magazine or newspaper advertisement
11 = A bill you received
12 = Other (SPECIFY)_________________ (example: word of mouth)
99 = Don’t Know/Refused
Q60f Was the incident reported to the police?
1 = Yes
0 = No
99 = Don’t Know/Refused
Q60g Was the incident reported to other authorities, like the Better Business Bureau
or a government agency?
1 = Yes
0 = No
99 = Don’t Know/Refused
Q61 Has anyone ever tried to get you to pay money in advance to reduce your mortgage
payments?
1 = Yes (go to Q61a)
0 = No (go to Q62)
99 = Don’t Know (go to Q62)
Q61a About how many times has this happened to you in your lifetime? (RECORD
EXACT NUMBER; -999 Don’t Know/Refused) (go to Q61b)
This document is a research report submitted to the U.S. Department of Justice. This report has not been published by the Department. Opinions or points of view expressed are those of the author(s)
and do not necessarily reflect the official position or policies of the U.S. Department of Justice.
172
Q61b When was the last time this happened?
1 = Within the last year (go to Q61c)
2 = One to two years ago (go to Q61c)
3 = More than two years ago (go to Q62)
99 = Don’t know/Refused (go to Q62)
Q61c Did you end up paying money in advance?
1 = Yes (go to Q61d)
0 = No (go to Q61e)
99 = Don’t know/Refused (go to Q62)
Q61d How much did you pay in advance to have your mortgage reduced? (RECORD
EXACT AMOUNT IN DOLLARS; -999 Don’t Know/Refused)
Q61e How did the person or company first contact you? (Read if necessary)
1 = Internet web site
2 = Email
3 = Television advertisement or infomercial
4 = Mail advertisement, including a catalog
5 = Telephone
6 = At a store you visited
7 = Someone came to your home
8 = A radio advertisement
9 = A poster or flier
10 = A magazine or newspaper advertisement
11 = A bill you received
12 = Other (SPECIFY)_________________ (example: word of mouth)
99 = Don’t Know/Refused
Q61f Was the incident reported to the police?
1 = Yes
0 = No
99 = Don’t Know/Refused
Q61g Was the incident reported to other authorities, like the Better Business Bureau
or a government agency?
1 = Yes
0 = No
99 = Don’t Know/Refused
Q62 Has anyone ever tried to steal your personal information so they could use it to get a
credit card or a loan?
1 = Yes (go to Q62a)
0 = No (go to Q63)
99 = Don’t Know (go to Q63)
Q62a About how many times has this happened to you in your lifetime? (RECORD
EXACT NUMBER; -999 Don’t Know/Refused) (go to Q62b)
This document is a research report submitted to the U.S. Department of Justice. This report has not been published by the Department. Opinions or points of view expressed are those of the author(s)
and do not necessarily reflect the official position or policies of the U.S. Department of Justice.
173
Q62b When was the last time this happened?
1 = Within the last year (go to Q62c)
2 = One to two years ago (go to Q62c)
3 = More than two years ago (go to Q63)
99 = Don’t know/Refused (go to Q63)
Q62c Did the person steal your personal information?
1 = Yes (go to Q62d)
0 = No (go to Q62e)
99 = Don’t know/Refused (go to Q63)
Q62d How much did you lose as a result of this incident? (RECORD EXACT
AMOUNT IN DOLLARS; -999 Don’t Know/Refused)
Q62e How did the person or company first contact you? (Read if necessary)
1 = Internet web site
2 = Email
3 = Television advertisement or infomercial
4 = Mail advertisement, including a catalog
5 = Telephone
6 = At a store you visited
7 = Someone came to your home
8 = A radio advertisement
9 = A poster or flier
10 = A magazine or newspaper advertisement
11 = A bill you received
12 = Other (SPECIFY)_________________ (example: word of mouth)
99 = Don’t Know/Refused
Q62f Was the incident reported to the police?
1 = Yes
0 = No
99 = Don’t Know/Refused
Q62g Was the incident reported to other authorities, like the Better Business Bureau
or a government agency?
1 = Yes
0 = No
99 = Don’t Know/Refused
Now I want to ask you about statewide agencies and programs that help seniors protect
themselves.
Q63 How familiar are you with the [Arizona Agency on Aging or Florida’s Senior vs. Crime
program]?
1 = Very familiar (go to Q63a)
2 = Somewhat familiar (go to Q63a)
3 = Not familiar (go to Q64)
99 = Don’t know/Refused (go to Q64)
This document is a research report submitted to the U.S. Department of Justice. This report has not been published by the Department. Opinions or points of view expressed are those of the author(s)
and do not necessarily reflect the official position or policies of the U.S. Department of Justice.
174
Q63a How did you first hear about [Arizona Agency on Aging or Florida’s Senior vs.
Crime program]?
1 = From a friend or family member
2 = From watching television
3 = From the radio
4 = From the newspaper
5 = From an Internet web page or email
6 = From something I received in the mail
7 = Other (Specify)
99 = Don’t know/Refused
Q63b In the past year, have you contacted [Arizona Agency on Aging or Florida’s
Senior vs. Crime program]?
1 = Yes (go to Q63c)
0 = No (go to Q64)
99 = Don’t know/Refused (go to Q64)
Q63c How satisfied were you with your experience with [Arizona Agency on Aging
or Florida’s Senior vs. Crime program]?
1 = Very satisfied
2 = Satisfied
3 = Dissatisfied
4 = Very dissatisfied
99 = Don’t know/Refused
Q63d Did you learn anything that led you to take precautions to prevent
victimization?
1 = Yes (go to Q63e)
0 = No (go to Q64)
99 = Don’t know/Refused (go to Q64)
Q63e Did you talk with others about what you learned?
1 = Yes
0 = No
99 = Don’t know/Refused
Now I want to ask you about another program.
Q64 How familiar are you with the Senior Sleuths program?
1 = Very familiar (go to Q64a)
2 = Somewhat familiar (go to Q64a)
3 = Not familiar (go to Q65)
99 = Don’t know/Refused (go to Q65)
This document is a research report submitted to the U.S. Department of Justice. This report has not been published by the Department. Opinions or points of view expressed are those of the author(s)
and do not necessarily reflect the official position or policies of the U.S. Department of Justice.
175
Q64a How did you first hear about The Senior Sleuths program?
1 = From a friend or family member
2 = From watching television
3 = From the radio
4 = From the newspaper
5 = From an Internet web page or email
6 = From something I received in the mail
7 = Other (Specify)
99 = Don’t know/Refused
Q64b In the past year, have you contacted The Senior Sleuths program?
1 = Yes (go to Q64c)
0 = No (go to Q65)
99 = Don’t know/Refused (go to Q65)
Q64c How satisfied were your with your experience with The Senior Sleuths
program?
1 = Very satisfied
2 = Satisfied
3 = Dissatisfied
4 = Very dissatisfied
99 = Don’t know/Refused
Q64d Did you learn anything that led you to take precautions to prevent
victimization?
1 = Yes (go to Q64e)
0 = No (go to Q65)
99 = Don’t know/Refused (go to Q65)
Q64e Did you talk with others about what you learned?
1 = Yes
0 = No
99 = Don’t know/Refused
Q65 In the past year, which of the following sources have provided you with information
about how to protect yourself against consumer fraud? (CHECK ALL THAT APPLY)
1 = Internet websites
2 = Email
3 = Television
4 = Radio
5 = Magazines
6 = Brochure or Flier
7 = Other (Specify)
8 = None of these sources
99 = Don’t know/Refused
This document is a research report submitted to the U.S. Department of Justice. This report has not been published by the Department. Opinions or points of view expressed are those of the author(s)
and do not necessarily reflect the official position or policies of the U.S. Department of Justice.
176
People sometimes illegally use other people’s money or property for their own benefit. The
individuals doing these things could be close to you, like a family member or friend, or
someone you don’t know very well. (RANDOMIZE Q66 – Q69 STATEMENTS)
Q66 Has anyone ever spent your money or sold something of yours without your
permission?
1 = Yes (go to Q66a)
0 = No (go to Q67)
99 = Don’t Know (go to Q67)
Q66a About how many times has this happened to you in your lifetime? (RECORD
EXACT NUMBER; -999 Don’t Know/Refused) (go to Q66b)
Q66b When was the last time this happened?
1 = Within the last year (go to Q66c)
2 = One to two years ago (go to Q66c)
3 = More than two years ago (go to Q67)
99 = Don’t know/Refused (go to Q67)
Q66c Thinking about the most recent incident, how were you related to the person?
1 = A spouse or partner
2 = An EX-spouse or partner
3 = A son or daughter
4 = A brother or sister
5 = A parent or step-parent
6 = Another relative (Specify)
7 = A friend
8 = A neighbor
9 = Some other non-relative (Specify)
99 = Don’t know/Refused (go to Q67)
Q66d What was the approximate value of the property or amount of money that was
involved? (RECORD EXACT AMOUNT IN DOLLARS; -999 Don’t
Know/Refused)
Q66e Was the incident reported to the police?
1 = Yes
0 = No
99 = Don’t Know/Refused
Q66f Was the incident reported to other authorities, such as social services?
1 = Yes
0 = No
99 = Don’t Know/Refused
This document is a research report submitted to the U.S. Department of Justice. This report has not been published by the Department. Opinions or points of view expressed are those of the author(s)
and do not necessarily reflect the official position or policies of the U.S. Department of Justice.
177
Q67 Has anyone ever forged your signature without your permission in order to sell your
things or to get money from your accounts?
1 = Yes (go to Q67a)
0 = No (go to Q68)
99 = Don’t Know/Refused (go to Q68)
Q67a About how many times has this happened to you in your lifetime? (RECORD
EXACT NUMBER; -999 Don’t Know/Refused) (go to Q67b)
Q67b When was the last time this happened?
1 = Within the last year (go to Q67c)
2 = One to two years ago (go to Q67c)
3 = More than two years ago (go to Q68)
99 = Don’t know/Refused (go to Q68)
Q67c Thinking about the most recent incident, how were you related to the person?
1 = A spouse or partner
2 = An EX-spouse or partner
3 = A son or daughter
4 = A brother or sister
5 = A parent or step-parent
6 = Another relative (Specify)
7 = A friend
8 = A neighbor
9 = Some other non-relative (Specify)
99 = Don’t know/Refused (go to Q68)
Q67d What was the approximate value of the property or amount of money that was
involved? (RECORD EXACT AMOUNT IN DOLLARS; -999 Don’t
Know/Refused)
Q67e Was the incident reported to the police?
1 = Yes
0 = No
99 = Don’t Know/Refused
Q67f Was the incident reported to other authorities, such as social services?
1 = Yes
0 = No
99 = Don’t Know/Refused
Q68 Has anyone ever stolen your money or taken your things for themselves, for their
friends, or to sell?
1 = Yes (go to Q68a)
0 = No (go to Q69)
99 = Don’t Know (go to Q69)
This document is a research report submitted to the U.S. Department of Justice. This report has not been published by the Department. Opinions or points of view expressed are those of the author(s)
and do not necessarily reflect the official position or policies of the U.S. Department of Justice.
178
Q68a About how many times has this happened to you in your lifetime? (RECORD
EXACT NUMBER; -999 Don’t Know/Refused) (go to Q68b)
Q68b When was the last time this happened?
1 = Within the last year (go to Q68c)
2 = One to two years ago (go to Q68c)
3 = More than two years ago (go to Q69)
99 = Don’t know/Refused (go to Q69)
Q68c Thinking about the most recent incident, how were you related to the person?
1 = A spouse or partner
2 = An EX-spouse or partner
3 = A son or daughter
4 = A brother or sister
5 = A parent or step-parent
6 = Another relative (Specify)
7 = A friend
8 = A neighbor
9 = Some other non-relative (Specify)
99 = Don’t know/Refused (go to Q69)
Q68d What was the approximate value of the property or amount of money that was
involved? (RECORD EXACT AMOUNT IN DOLLARS; -999 Don’t
Know/Refused)
Q68e Was the incident reported to the police?
1 = Yes
0 = No
99 = Don’t Know/Refused
Q68f Was the incident reported to other authorities, such as social services?
1 = Yes
0 = No
99 = Don’t Know/Refused
Q69 Has anyone ever forced you to give them money or something else of yours?
1 = Yes (go to Q69a)
0 = No (go to Q70)
99 = Don’t Know (go to Q70)
Q69a About how many times has this happened to you in your lifetime? (RECORD
EXACT NUMBER; -999 Don’t Know/Refused) (go to Q69b)
Q69b When was the last time this happened?
1 = Within the last year (go to Q69c)
2 = One to two years ago (go to Q69c)
3 = More than two years ago (go to Q70)
99 = Don’t know/Refused (go to Q70)
This document is a research report submitted to the U.S. Department of Justice. This report has not been published by the Department. Opinions or points of view expressed are those of the author(s)
and do not necessarily reflect the official position or policies of the U.S. Department of Justice.
179
Q69c Thinking about the most recent incident, how were you related to the person?
1 = A spouse or partner
2 = An EX-spouse or partner
3 = A son or daughter
4 = A brother or sister
5 = A parent or step-parent
6 = Another relative (Specify)
7 = A friend
8 = A neighbor
9 = Some other non-relative (Specify)
99 = Don’t know/Refused (go to Q70)
Q69d What was the approximate value of the property or amount of money that was
involved? (RECORD EXACT AMOUNT IN DOLLARS; -999 Don’t
Know/Refused)
Q69e Was the incident reported to the police?
1 = Yes
0 = No
99 = Don’t Know/Refused
Q69f Was the incident reported to other authorities, such as social services?
1 = Yes
0 = No
99 = Don’t Know/Refused
People are sometimes physically hurt by other people. The person doing these things could be
someone close to you, like a family member or friend, or someone you don’t know very well.
(RANDOMIZE Q70 – Q72 STATEMENTS)
Q70 Has anyone ever hit you with their hand or object, slapped you, kicked you, or
threatened you with a weapon?
1 = Yes (go to Q70a)
0 = No (go to Q71)
99 = Don’t Know (go to Q71)
Q70a About how many times has this happened to you in your lifetime? (RECORD
EXACT NUMBER; -999 Don’t Know/Refused) (go to Q70b)
Q70b When was the last time this happened?
1 = Within the last year (go to Q70c)
2 = One to two years ago (go to Q70c)
3 = More than two years ago (go to Q71)
99 = Don’t know/Refused (go to Q71)
This document is a research report submitted to the U.S. Department of Justice. This report has not been published by the Department. Opinions or points of view expressed are those of the author(s)
and do not necessarily reflect the official position or policies of the U.S. Department of Justice.
180
Q70c Thinking about the most recent incident, how were you related to the person?
1 = A spouse or partner
2 = An EX-spouse or partner
3 = A son or daughter
4 = A brother or sister
5 = A parent or step-parent
6 = Another relative (Specify)
7 = A friend
8 = A neighbor
9 = Some other non-relative (Specify)
99 = Don’t know/Refused (go to Q71)
Q70d Did you receive medical attention as a result of the most recent incident?
1 = Yes
0 = No
99 = Don’t Know/Refused
Q70e Was the incident reported to the police?
1 = Yes
0 = No
99 = Don’t Know/Refused
Q70f Was the incident reported to other authorities, such as social services?
1 = Yes
0 = No
99 = Don’t Know/Refused
Q71 Has anyone ever held you down, tied you up, or locked you in your room or house or
some other place against your will?
1 = Yes (go to Q71a)
0 = No (go to Q72)
99 = Don’t Know (go to Q72)
Q71a About how many times has this happened to you in your lifetime? (RECORD
EXACT NUMBER; -999 Don’t Know/Refused) (go to Q71b)
Q71b When was the last time this happened?
1 = Within the last year (go to Q71c)
2 = One to two years ago (go to Q71c)
3 = More than two years ago (go to Q72)
99 = Don’t know/Refused (go to Q72)
This document is a research report submitted to the U.S. Department of Justice. This report has not been published by the Department. Opinions or points of view expressed are those of the author(s)
and do not necessarily reflect the official position or policies of the U.S. Department of Justice.
181
Q71c Thinking about the most recent incident, how were you related to the person?
1 = A spouse or partner
2 = An EX-spouse or partner
3 = A son or daughter
4 = A brother or sister
5 = A parent or step-parent
6 = Another relative (Specify)
7 = A friend
8 = A neighbor
9 = Some other non-relative (Specify)
99 = Don’t know/Refused (go to Q72)
Q71d Did you receive medical attention as a result of the most recent incident?
1 = Yes
0 = No
99 = Don’t Know/Refused
Q71e Was the incident reported to the police?
1 = Yes
0 = No
99 = Don’t Know/Refused
Q71f Was the incident reported to other authorities, such as social services?
1 = Yes
0 = No
99 = Don’t Know/Refused
Q72 Has anyone ever physically hurt you so that you suffered some degree of injury,
including cuts, bruises, or other marks?
1 = Yes (go to Q72a)
0 = No (go to Q73)
99 = Don’t Know (go to Q73)
Q72a About how many times has this happened to you in your lifetime? (RECORD
EXACT NUMBER; -999 Don’t Know/Refused) (go to Q72b)
Q72b When was the last time this happened?
1 = Within the last year (go to Q72c)
2 = One to two years ago (go to Q72c)
3 = More than two years ago (go to Q73)
99 = Don’t know/Refused (go to Q73)
This document is a research report submitted to the U.S. Department of Justice. This report has not been published by the Department. Opinions or points of view expressed are those of the author(s)
and do not necessarily reflect the official position or policies of the U.S. Department of Justice.
182
Q72c Thinking about the most recent incident, how were you related to the person?
1 = A spouse or partner
2 = An EX-spouse or partner
3 = A son or daughter
4 = A brother or sister
5 = A parent or step-parent
6 = Another relative (Specify)
7 = A friend
8 = A neighbor
9 = Some other non-relative (Specify)
99 = Don’t know/Refused (go to Q73)
Q72d Did you receive medical attention as a result of the most recent incident?
1 = Yes
0 = No
99 = Don’t Know/Refused
Q72e Was the incident reported to the police?
1 = Yes
0 = No
99 = Don’t Know/Refused
Q72f Was the incident reported to other authorities, such as social services?
1 = Yes
0 = No
99 = Don’t Know/Refused
Thanks. That is helpful. We have just a few more questions.
Q73 Considering all types of alcoholic beverages, how many times during the past month
did you have [five or more drinks for men, four or more drinks for women] on a single
Q74 Overall, how would you rate your health during the past month? Would you say it has
been … (READ LIST)
1 = Excellent
2 = Good
3 = Fair
4 = Poor
5 = Very poor
99 = Don’t know/refused
Q75 Are you now working full-time, working part-time, retired, or unemployed?
1 = Working full-time (go to Q75a)
2 = Working part-time (go to Q75a)
3 = Retired (go to Q76)
4 = Unemployed (go to Q76)
5 = Homemaker (go to Q76)
99 = Don’t know/Refused (go to Q76)
This document is a research report submitted to the U.S. Department of Justice. This report has not been published by the Department. Opinions or points of view expressed are those of the author(s)
and do not necessarily reflect the official position or policies of the U.S. Department of Justice.
183
Q75a All things considered, how satisfied are you with your current job? (READ
OPTIONS)
1 = Very satisfied
2 = Satisfied
3 = Dissatisfied
4 = Very dissatisfied
99 = Don’t know/Refused
Q76 Are you now married, widowed, divorced, separated, or have you never been married?
1 = Married (go to Q76a)
2 = Widowed (go to Q77)
3 = Divorced (go to Q77)
4 = Separated (go to Q77)
5 = Never Married (go to Q77)
99 = Don’t Know/Refused (go to Q77)
Q76a Overall, how happy do you feel about your marriage? Would you say that you
are (READ OPTIONS)
1 = Extremely happy
2 = Fairly happy
3 = Fairly unhappy
4 = Extremely unhappy
99 = Don’t know/Refused
Q77 How many children do you have? (RECORD EXACT NUMBER; -999 Don’t
Know/Refused) (If ‘0’, go to Q78)
Q77a Overall, how happy do you feel about your relationship with your child(ren)?
Would you say that you are (READ OPTIONS)
1 = Extremely happy
2 = Fairly happy
3 = Fairly unhappy
4 = Extremely unhappy
99 = Don’t know/Refused
Q78 Including you, how many people live in your household? (RECORD EXACT
NUMBER; -999 Don’t Know/Refused) (If ‘0’, go to Q79)
Q78a What is (are) their relationship to you? (Mark all that apply)
1 = Spouse
2 = Child(ren)
3 = Parent(s)
4 = Brother or sister
5 = Other relative (Specify)
6 = Nonrelative (Specify)
99 = Don’t know/Refused
This document is a research report submitted to the U.S. Department of Justice. This report has not been published by the Department. Opinions or points of view expressed are those of the author(s)
and do not necessarily reflect the official position or policies of the U.S. Department of Justice.
184
Now, I have a few questions about you and your family to ensure that people from all walks of
life are included in the study.
Q79 How would you describe the place you currently live? (Read if necessary)
1 = House
2 = A condominium
3 = Regular apartment
4 = A duplex
5 = A mobile home
6 = Retirement home
7 = Supervised apartment
8 = Assisted living facility
9 = Nursing or rest home
10 = Something else (Specify)
99 = Don’t know/Refused
Q80 What was the last grade you completed in school? (DO NOT READ CATEGORIES)
1 = Some grade school (1-8)
2 = Some high school (9-12)
3 = High school graduate (or equivalency) (completed 12)
4 = Technical or Vocational School
5 = Some college (13-15)
6 = Graduated college (16)
7 = Graduate/professional school
99 = Don’t know/Refused
Q81 Are you of Hispanic or Latino origin?
1 = Yes
0 = No
99 = Don’t know/Refused
Q82 Which of the following racial categories best describes you? (READ OPTIONS; You
may mark more than one)
1 = White
2 = Black or African American
3 = American Indian or Alaska Native
4 = Asian
5 = Native Hawaiian or Other Pacific Islander
6 = Other (Specify)
7 = Hispanic / Latino (Do Not Read)
99 = Don’t know/Refused
Q83 In what year were you born? (RECORD YEAR; -999 Don’t Know/Refused)
Q84 Gender (BY OBSERVATION, BUT ASK EVERYONE)
1 = Male
0 = Female
99 =Don’t know/Refused
This document is a research report submitted to the U.S. Department of Justice. This report has not been published by the Department. Opinions or points of view expressed are those of the author(s)
and do not necessarily reflect the official position or policies of the U.S. Department of Justice.
185
Q85 Have you ever served in the United States Military?
1 = Yes (go to Q85a)
0 = No (go to Q86)
99 =Don’t know/Refused
Q85a How many years did you serve? (RECORD EXACT NUMBER; -999 Don’t
Know/Refused)
Q86 Do you own or have access to a motor vehicle?
1 = Yes
0 = No
99 = Don’t know/Refused
Q87 What is your 5-digit zip code? (RECORD CODE; -999 Don’t Know/Refused)
Thank you very much for participating in this study.
If you have any questions about the study or your participation in the study, please call Dr.
Kristy Holtfreter at 602-496-2344.
If you have questions about your rights as a participant in this research, or if you feel you have
been placed at risk, you can call the ASU Research Compliance Office at 480-965-6788.
This document is a research report submitted to the U.S. Department of Justice. This report has not been published by the Department. Opinions or points of view expressed are those of the author(s)
and do not necessarily reflect the official position or policies of the U.S. Department of Justice.