99
Financial Management Paper-20 M Com (Final) Directorate of Distance Education Maharshi Dayanand University ROHTAK – 124 001

Financial Management
Paper-20
M Com (Final)
Directorate of Distance EducationMaharshi Dayanand University
ROHTAK – 124 001

jktuhfr foKku4
FINANCIAL MANAGEMENTMCom (Final)
Paper-20
M. Marks : 100Time : 3 Hrs.
Note: There will be three sections of the question paper. In section A there will be 10 short answer questionsof 2 marks each. All questions of this section are compulsory. Section B will comprise of 10 questionsof 5 marks each out of which candidates are required to attempt any seven questions. Section C will behaving 5 questions of 15 marks each out of which candidates are required to attempt any three question.The examiner will set the questions in all the three sections by covering the entire syllabus of theconcerned subject.
Course Inputs
UNIT–I Evaluation of Finance, Objectives of the Firm-Profit Max, And Wealth Max, Functions of FinancialManagement, Organisation of the Finance Function, Cost of Capital: Definition and Concepts,Measurement, the weighted average cost of Capital; Leverage: Operating and Financial, CombinedLeverage.
UNIT–II Capital Budgeting, Meaning, Importance, Rational of Capital Budget, Nature of InvestmentDecision, The Administrative framwork, methods of appraisal, Capital Rationing, Inflation andCapital Budgeting; Capital budgeting underRisk and Uncertainties.
UNIT–III Working Capital Management, Concept, Need, Determinants, Finance mix for working capital,Estimating working capiktal needs, Cash management; The Cash Budget, Techniques of cashmanagement and marketable securities; Management of reseivables; Objectives, Factors affectingpolicies for managing accounts receivables; Inventory Management; Objectives, InventoryManagement techniques.
UNIT–IV Financing Decisions: Capital Structure Theories, taxation and capital structure; Planning thecapital structure, Factors affecting capital structure, E.B.I.T.-E.P.S. anslysis, ROI-ROE analysis,Assessment of Debt Capacity, Capital Structure Policies in Practice.
Dividend Decision: Theories of Dividends-traditional position, Gordon Model, Walter model, M.M.Model, Radical Model, Factors affecting dividend policy, stock dividends and stock splits,Repurchase of stock procedural and legal aspects of dividends.
UNIT–V Sources of Working Capital Funds: Accurals, trade, credit, commercial banks advances, publicdeposits, Inter corporate deposits, short term loans from financial institution, right debentures forworking capital, commercial papers and factoring.
Regulation of Bank Finance:-Recommendations of Latest Committee.

5Introduction to Financial Management
Chapter-1Introduction to Financial Management
Companies do not work in a vacuum, isolated from everything else. It interacts andtransacts with the other entities present in the economic environment. These entitiesinclude Government, Suppliers, Lenders, Banks, Customers, Shareholders, etc. whodeal with the organisation in several ways. Most of these dealings result in either moneyflowing in or flowing out from the company. This flow of money (or funds) has to bemanaged so as to result in maximum gains to the company.
Managing this flow of funds efficiently is the purview of finance. So we can definefinance as the study of the methods which help us plan, raise and use funds in anefficient manner to achieve corporate objectives. Finance grew out of economics as aspecial discipline to deal with a special set of common problems.
The corporate financial objectives could be to:
1. Provide the link between the business and the other entities in the environmentand
2. Investment and financial decision making
Let us first look at what we mean by investment and financial decision making.
1. Investment Decision: The investment decision, also referred to as the capitalbudgeting decision, simply means the decisions to acquire assets or to invest in aproject. Assets are defined as economic resources that are expected to generatefuture benefits.
2. Financing Decision: The second financial decision is the financing decision,which basically addresses two questions:
a. How much capital should be raised to fund the firm's operations (both existing& proposed)
b. What is the best mix of financing these assets?
Financing could be through two ways: debt (loans from various sources like banks,financial institutions, public, etc.) and equity (capital put in by the investors who are alsoknown as owners/ shareholders). Shareholders are owners because the shares representthe ownership in the company.

Financial Management6
Funds are raised from financial markets. Financial markets is a generic term used todenote markets where financial securities are teat. These markets include moneymarkets, debt market and capital markets. We will understand them in detail later in the3rd chapter.
Financing and investing decisions are closely related because the company is going toraise money to invest in a project or assets. Those who are going to give money to thecompany (whether lenders or investors) need to understand where the company isinvesting their money and what it hopes to earn from the investments so that they canassure themselves of the safety of their money.
The questions that you may thinking about right now are "Why do we need to learnfinance? Shall we not leave it to the people who are going to specialise in finance?Finance won't help me in the area that I am going to work in, so why learn?" This is tosay that the knowledge of finance does not add any value to you. Is it so? Think aboutit. When you get your pocket money from your parents, you do not go out and blow thewhole lot in one day because if you do, your parents are not going to give you moremoney to last through that month. You quickly learn that you need to plan your expenditureso that the money lasts throughout the month and you may actually plan to save someof it. Those who do not get enough to meet their requirements, think about some clevermeans to raise more money (like falling sick!). Alternatively if they need more moneyfor the month because of certain special events (like Valentine's day) they can plan toborrow money for a month and repay in the next month.
So you plan, raise and efficiently utilise funds that are your disposal (or at least try to).That a business organisation also needs to do the same can hardly be overemphasised.The scale of operations is much bigger and to efficiently manage funds at this scale,decisions cannot be taken without sound methodology. Finance teaches you thisterminology.
For managing these funds the first thing you would need is information. Externalinformation has to be collected from the environment and accounting provides internalinformation about the firm's operations. Accounting can be defined as an informationand measurement system that identifies, records, and communicates relevant informationabout a company's economic activities to people to help them make better decisions.
You would now agree that a company needs to manage its own funds efficiently butyour question still remains "Why am I concerned with it?" Further arguing, you say that,"I am going to specialise in Marketing/ Information Technology/ Human ResourceManagement/ Operations Management and there is no need for me to learn finance.Also Finance is a separate function in my organisation (or the organisation that I amgoing to work for) and I am hardly going to use finance to work in my respectivedepartment."

7Introduction to Financial Management
Think again. Everything that you do has an impact on the profitability of the company(including drinking ten cups of coffee in a day!). So if you want to grow up to be theCEO of the company in a few years from now (which I undoubtedly think that youwould love to) you should take the advice of the top CEOs.
79 per cent of the top CEOs rate Finance skills, as the most required forthe CEO of the future.
KPMG survey
Better take the CEOs advice. But don't get the feeling that only the CEOs require theFinance Skills, all other functions of management also cannot do without finance andthe financial information.
Fields of Finance
The academic discipline of financial management may be viewed as made up of fivespecialized fields. In each field, the financial manager is dealing with the managementof money and claims against money. Distinctions arise because different organizationspursue different objectives and do not face the same basic set of problems. There arefive generally recognized areas of finance.
1. Public Finance. Central, state and local governments handle large sums ofmoney, which are received from many sources and must be utilized in accordancewith detailed policies and procedures. Governments have the authority to taxand otherwise raise funds, and must dispense funds according to legislative andother limitations. Also, government do not conduct their activities to achieve thesame goals as private organizations. Businesses try to make profits, whereas agovernment will attempt to accomplish social or economic objectives. As aresult of these and other differences, a specialized field of public finance hasemerged to deal with government financial matters.
2. Securities and Investment Analysis. Purchase of stocks, bonds, and othersecurities involve analysis and techniques that are highly specialized. An investormust study the legal and investment characteristics of each type of security,measure the degree of risk involved with each investment, and forecast probableperformance in the market. Usually this analysis occurs without the investorhaving any direct control over the firm or institution represented by the form ofsecurity. The field of investment analysis deals with these matters and attemptsto develop techniques to help the investor reduce the risk and increase the likelyreturn from the purchase of selected securities.
3. International Finance. When money crosses international boundaries individuals,businesses, and governments must deal with special kinds of problems. Eachcountry has its own national currency; thus a citizen of the United States mustconvert dollars to French francs before being able to purchase goods or servicesin Paris. Most governments have imposed restrictions on the exchange ofcurrencies, and these may affect business transactions. Governments may be

Financial Management8
facing financial difficulties, such as balance-of-payments deficits, or may bedealing with economic problems, such as inflation or high levels of unemployment.In these cases, they may require detailed accounting for the flows of funds ormay allow only certain types of international transactions. The study of flowsof funds between individuals and organizations across national borders and thedevelopment of methods of handling the flows more efficiency are properlywithin the scope of international finance.
4. Institutional Finance. A nation’s economic structure contains a number offinancial institutions, such as banks, insurance companies, pension funds, creditunions. These institutions gather money from individual savers and accumulatesufficient amounts for efficient investment. Without these institutions, fundswould not be readily available to finance business transactions, the purchase ofprivate homes and commercial facilities, and the variety of other activities thatrequire organizations that perform the financing function of the economy.
5. Financial Management. Individual businesses face problems dealing with theacquisition of funds to carryon their activities and with the determination ofoptimum methods of employing the funds. In a competitive marketplace,businesses and actively manage their funds to achieve their goals. Many toolsand techniques have been developed to assist financial managers to recommendproper courses of action.
These tools help the manager determine which sources offer the lowest cost offunds and which activities will provide the greatest return on invested capital.Financial management is the field of greatest concern to the corporatefinancial officers and will be the major thrust of the approach we shall use in studyingfinance.
An overview of the five fields of finance is given in Figure 1.1.
Figure 1.1 Various Fields of Finance
Public Financel Used in central, state and local
government.
l Examines taxes and other revenues.
l Pursues nonprofit goals.
Institutional Financel Examines banks, insurances
companies and pension funds.
l Studies saving and capital formation.
Financial Managementl Studies financial problems in
individual firms.
l Seeks sources of low-cost funds.
l Seeks profitable business activities.
Securities and Investment Analysisl Used by individual and institutional
investors.
l Measures risk in securities transactions.
l Measures likely return.
International Financel Studies economic transactions among
nations.
l Concerned with flows among countries.

9Introduction to Financial Management
Objectives of the Firm - Profit Maximisationand Wealth Maximisation
To put it simply, we might say that the goal of any business is to maximise the returns tothe owners of the business. So the goal of finance is to help the business in maximisingreturns. But if you talk to the companies, you also hear about many other goals thatthey are pursuing at the same time. These goals could include maximisation of sales,maximisation of market share, maximisation of growth rates of sales, maximisation ofthe market price of the share (whether real or specifically pushed up to benefit theowners), etc. Individually speaking, managers would be more concerned with themoney that they are making from the organisation and the benefits that they are receivingrather than care about what the owners are making!
As there could be many goals for the organisation, we should try and summarise theorganisational goals in financial terms so that we can call them the financial goals. Theyboil down to two:
1. Maximise profits or
2. Maximise wealth
Maximise Profits
Let us first look at profit maximisation. Profit (also called net income or earnings) canbe defined as the amount a business earns after subtracting all expenses necessary forits sales. To put it in an equation form:
Sales - Expenses = Profit
If you want to maximise profits, there are only two ways to do it. Either you reduceyour expenses (also called costs) or you increase the sales (also called revenues).Both of these are not easy to achieve. Sales can be increased by selling more productsor by increasing the price of the products. Selling more products is difficult because ofthe competition in the market and you cannot increase the price of the products withoutadding more features or value to it (assuming a competitive market). If you are acompetitive company, reducing expenses beyond a certain level is possible only byreducing the investments in advertising, research and development, etc. which ultimatelyleads to reduction in sales in the long term and threatens the survival of the company.Profit maximisation goal assumes that many of the complexities of the real world do notexist and is, therefore, not acceptable.
Still, profit maximisation remains one of the key goals for the managers of the companybecause many managers' compensations are linked to the profits that the company isgenerating. Owners need to be aware of these goals and understand that it is the long-term viability of their companies that add value to them and not the short-term profitability.

Financial Management10
Therefore, the long-term survival of the company should not be sacrificed for the short-term benefits.
Wealth Maximisation
Shareholders' wealth can be defined as the total market value of all the equity shares ofthe company. So when we talk about maximising wealth we talk about maximising thevalue of each share. How the decisions taken by the organisation affects the value ofthe organisation is reflected in the figure 1.1.
Figure 1.1: How Financial Decisions affect the Value of the Organisation
The shareholders' wealth maximisation goal gives us the best results because effectsof all the decisions taken by the company and its managers are reflected in it. In orderto employee use this goal, we do not have to consider every price change of our sharesin the market as an interpretation of the worth of the decisions that the company hastaken. What the company needs to focus on is the affect that its decision should haveon the share price if everything else was held constant. This conflict of the decisions bythe managers and the decisions required by the owners is known as the agency problem.How are companies solving this problem will be discussed later.
Scope of Financial Management
The approach to the scope and functions of financial management is divided, forpurposes of exposition, into two broad categories: (a) The Traditional Approach, and(b) The Modern Approach.

11Introduction to Financial Management
Traditional Approach
The traditional approach to the scope of financial management refers to its subject-matter, in academic literature in the initial stages of its evolution, as a separate branchof academic study. The term ‘corporation finance’ was used to describe what is nowknown in the academic world as ‘financial management’. As the name suggests, theconcern of corporation finance was with the financing of corporate enterprises. Inother words, the scope of the finance function was treated by the traditional approachin the narrow sense of procurement of funds by corporate enterprise to meet theirfinancing needs. The term ‘procurement’ was used in a broad sense so as to includethe whole gamut of raising funds externally. Thus defined, the field of study dealingwith finance was treated as encompassing three interrelated aspects of raising andadministering resources from outside: (i) the institutional arrangement in the form offinancial institutions which comprise the organization of the capital market; (ii) thefinancial instruments through which funds are raised from the capital markets and therelated aspects of practices and the procedural, aspects of capital markets; and (iii) thelegal and accounting relationships between a firm and its sources of funds. The coverageof corporation finance was, therefore, conceived to describe the rapidly evolvingcomplex of capital market institutions, instruments and practices. A related aspect wasthat firms require funds at certain episodic events such as merger, liquidation,reorganization and soon. A detailed description of these major events constituted thesecond element of the scope of this field of academic study. That these were the broadfeatures of the subject-matter of corporation finance is eloquently reflected in theacademic writings around the period during which the traditional approach dominatedacademic thinking. Thus, the issue to which literature on finance addressed itself washow resources could best be raised from the combination of the available sources.
The traditional approach to the scope of the finance function evolved during the 1920sand 1930s and dominated academic during the forties and through the early fifties. Ithas now been discarded as it suffers from serious limitations. The weaknesses of thetraditional approach fall into two broad categories: (i) those relating to the treatmentof various topics and the emphasis attached to them; and (ii) those relating to the basicconceptual and analytical framework of the definitions and scope of the finance function.
The first argument against the traditional approach was based on its emphasis on issuesrelating to the procurement of funds by corporate enterprises. This approach waschallenged during the period when the approach dominated the scene itself. Further,the traditional treatment of finance was criticised because the finance function wasequated with the issues involved in raising and administering funds, the theme waswoven around the viewpoint of the suppliers of funds such as investors, investmentbankers and so on, that is, the outsiders. It implies that no consideration was given tothe viewpoint of those who had to take internal financial decisions. The traditionaltreatment was, in other words, the outsider-looking-in approach. The limitation wasthat internal decision making (i.e. insider-looking out) was completely ignored.
The second ground of criticism of the traditional treatment was that the focus was onfinancing problems of corporate enterprises. To that extent the scope of financialmanagement was confined only to a segment of the industrial enterprises, as non-corporate organisations lay outside its scope.

Financial Management12
Yet another basis on which the traditional approach was challenged was that thetreatment was built too closely around episodic events, such as promotion, incorporation,merger, consolidation, reorganisation and so on. Financial management was confinedto a description of these infrequent happenings in the life of an enterprise. As a logicalcorollary, the day-to-day financial problems of a normal company did not receive muchattention.
Finally, the traditional treatment was found to have a lacuna to the extent that the focuswas on long-term financing. Its natural implication was that the Issues involved inworking capital management were not in the purview of the finance function.
The limitations of the traditional approach were not entirely based on treatment oremphasis of different aspects. In other words, its weaknesses were more fundamental.The conceptual and analytical shortcoming of this approach arose from the fact thatit confined financial management to issues involved in procurement of external funds,it did not consider the important dimension of allocation of capital. The conceptualframework of the traditional treatment ignored what Solomon aptly describes as thecentral issues of financial management. These issues are reflected in the followingfundamental questions which a finance manager should address. Should an enterprisecommit capital funds to certain purposes do the expected returns meet financial standardsof performance? How should these standards be set and what is the cost of capitalfunds to the enterprise? How does the cost vary with the mixture of financing methodsused? In the absence of the coverage of these crucial aspects, the traditional approachimplied a very narrow scope for financial management. The modern approach providesa solution to these shortcomings.
Modern Approach
The modern approach views the term financial management in a broad sense andprovides a conceptual and analytical framework for financial making. According to it,the finance function covers both acquisition of funds as well as their allocations. Thus,apart from the issues involved in acquiring-external funds, the main concern of financialmanagement is the efficient and wise allocation of funds to various uses. Defined ina broad sense, it is viewed as an integral part of overall management.
The new approach is an analytical way of viewing the financial problems of a firm.The main contents of this approach are what is the total volume of funds an enterpriseshould commit? What specific assets should an enterprise acquire? How should thefunds required be financed? Alternatively, the principal contents of the modern approachto financial management can be said to be: (i) How large should an enterprise be, andhow fast should it grow? (ii) In what form should it hold assets? and (iii) What shouldbe the composition of its liabilities?
The three questions posed above cover between them the major financial problems ofa firm. In other words, financial management, according to the new approach, isconcerned with the solution of three major problems relating to the financial operationsof a firm, corresponding to the three questions of investment, financing and dividenddecisions. Thus, financial management, in the modem sense of the term, can be brokendown into three major decisions as functions of finance: (i) The investment decision,(ii) The financing decision, and (iii) The dividend policy decision.

13Introduction to Financial Management
The investment decision relates to the selection of assets in which funds will beinvested by a firm. The assets which can be acquired fall into two broad group: (i) long-term assets which yield a return over a period of time in future, (ii) short-term orcurrent assets, defined as those assets which in the normal course of business areconvertible into without diminution in value, usually within a year. The first of theseinvolving the first category of assets is popularly known in financial literature as capitalbudgeting. The aspect of financial decision making with reference to current assetsor short-term assets is popularly termed as working capital management.
Capital Budgeting is probably the most financial decision for a firm. It relates to theselection of an asset or investment proposal or course of action whose benefits arelikely to be available in future over the lifetime of the project. The long-term assets canbe either new or old/existing ones. The first aspect of the capital budgeting decisionrelates to the choice of the new asset out of the alternatives available or the reallocationof capital when an existing asset fails to justify the funds committed. Whether an assetwill be accepted or not will depend upon the relative benefits and returns associatedwith it. The measurement of the worth of the investment proposals is, therefore, amajor element in the capital budgeting exercise. This implies a discussion of themethods of appraising investment proposals.
The second element of the capital budgeting decision is the analysis of risk anduncertainty. Since the benefits from the investment proposals extend into the future,their accrual is uncertain. They have to be estimated under various assumptions of thephysical volume of sale and the level of prices. An element of risk in the sense ofuncertainty of future benefits is, thus, involved in the exercise. The returns from capitalbudgeting decisions should, therefore, be evaluated in relation to the risk associatedwith it.
Finally the evaluation of the worth of a long-term project implies a certain norm orstandard against which the benefits are to be judged. The requisite norm is known bydifferent names such as cut-off rate, hurdle rate, required rate, minimum rate ofreturn and so on. This standard is broadly expressed in terms of the cost of capital.The concept and measurement of the cost of capital is, thus, another major aspect ofcapital budgeting decision. In brief, the main elements of capital budgeting decisionsare: (i) the long-term assets and their composition, (ii) the business risk complexion ofthe firm, and (iii) concept and measurement of the cost of capital.
Working Capital Management is concerned wit the management of current assets. Itis an important and integral part of financial management as short-term survival is aprerequisite for long-term success. One aspect of working capital management is thetrade-off between profitability and risk (liquidity). There is a conflict between profitabilityand liquidity. If a firm does not have adequate working capital, that is, it does not investsufficient funds in current assets, it may become illiquid and consequently may not havethe ability to meet its current obligations and, thus, invite the risk of bankruptcy. If thecurrent assets are too large, profitability is adversely affected. The key strategies andconsiderations in ensuring a tradeoff between profitability and liquidity is one majordimension of working capital management. In addition, the individual current assetsshould be efficiently managed so that neither inadequate nor unnecessary funds are
Financial Management14
locked up. Thus, the management of working capital has two basic ingredients: (1) anoverview of working capital management as a whole, and (2) efficient managementof the individual current assets such as cash, receivables and inventory.
The second major decision involved in financial management is the financing decision.The investment decision is broadly concerned with the asset-mix or the compositionof the assets of a firm. The concern of the financing decision is with the financing-mixor capital structure or leverage. The term capital structure refers to the proportion ofdebt (fixed-interest sources of financing) and equity capital (variable-dividend securities/source of funds). The financing decision of a firm relates to the choice of the proportionof these sources to finance the investment requirements. There are two aspects of thefinancing decision. First, the theory of capital structure which shows the theoreticalrelationship between the employment of debt and the return of the shareholders. Theuse of debt implies a higher return to the shareholders as also the financial risk. Aproper balance between debt and equity to ensure a trade-off between risk and returnto the shareholders is necessary. A capital structure with a reasonable proportion ofdebt and equity capital is called the optimum capital structure. Thus, one dimension ofthe financing decision whether there is an optimum capital structure? And in whatproportion should funds be raised to maximise the return to the shareholders?The second aspect of the financing decision is the determination of an appropriatecapital structure, given the facts of a particular case. Thus, the financing decisioncovers two interrelated aspects: (1) capital structure theory, and (2) capital structuredecision.
The third major decision of financial management is the decision relating to the dividendpolicy. The dividend should be analysed in relation to the financing decision of a firm.Two alternatives are available in dealing with the profits of a firm: they can be distributedto the shareholders in the form of dividends or they can be retained in the businessitself. The decision as to which course should be followed depends largely on asignificant element in the dividend decision, the dividend payout ratio, that is, whatproportion of net profits should be paid out to the shareholders. The final decision willdepend upon the preference of the shareholders and investment opportunities availablewithin the firm. The second major aspect of the dividend decision is the factorsdetermining dividend policy of a firm in practice.
To conclude, the traditional approach had a very narrow perception and was devoidof an integrated conceptual and analytical framework. It had rightly been discarded incurrent academic literature. The modern approach has broadened the scope of financialmanagement which involves the solution of three major decisions, namely, investment,financing and dividend. These are interrelated and should be jointly taken so thatfinancial decision-making is optimal. The conceptual framework for optimum financialdecisions is the objective of financial management. In other words, to ensure anoptimum decision in respect of these three areas, they should be related to the objectivesof financial management.

15Introduction to Financial Management
Functions of Financial Management
The traditional function of financial management has been limiting the role of finance toraising and administrating of funds needed by the company to meet their financial needs.It broadly covered:
1. Arrangement of funds through financial institutions
2. Arrangement of funds through financial instruments
3. Looking after the legal and accounting relationship between a corporation and itssources of funds
This has outlived its utility. With the advent of technology and need to tighten shipsbecause of competition, financial management became as much a science as art.Efficient allocation of funds became the imperative. The modern approach is ananalytical way of looking at the financial problems of a firm with the mainconcerns like:
1. What is the total volume of funds committed
2. What specific assets should be acquired or divested
3. How should the funds required be financed and from which markets
The above questions relate to four broad decision areas, these are:
1. Investment decision: Decisions relating to investment in both capital and currentassets. The finance manager has to evaluate different capital investment proposalsand select the best keeping in view the overall objective of the enterprise. CapitalBudgeting is the typical name given to this decision.
2. Financing Decision: Provision of funds required at the proper time is one of theprimary tasks of the finance manager. Identification of the sources, deciding whichtypes of funds to raise (debt or equity), and raising them is one of the crucialtasks.
3. Dividend Decision: Determination of funds requirements and how much of itwill be generated from internal accruals and how much to be sourced from outsideis a crucial decision. Equity holders are the owners and require returns, and howmuch money to be paid to them is a crucial decision.
4. Working Capital Decision: The investment in current assets is a major activitythat a finance manager is engaged in a day to day basis. How much inventory tokeep, how much receivables can be managed, and what is the optimum cashlevels, are three of the key questions that are dealt with regularly.

Financial Management16
All these decisions interact, investment decision cannot be taken without taking thefinancing decision, working capital decision also needs financing, dividend decision is apayout mechanism and has to be taken care of from financing. These tasks are dividedand are taken care of by various entities.
Objectives of Financial Management
To make wise decisions a clear understanding of the objectives which are sought tobe achieved in necessary. The objectives provide a framework for optimum financialdecision-making. In other words, they are concerned with designing a method ofoperating the internal investment and financing of a firm. We discuss in this section thealternative approaches in financial literature. There are two widely-discussed approaches:(i) Profit maximisation approach and (ii) Wealth maximisation approach.
It should be noted at the outset that the term ‘objective’ is used in the sense of a goalor decision criterion for the three decisions involved in financial management. Itimplies that what is relevant is not the overall objective or goal of a business but anoperationally useful criterion by which to judge a specific set of mutually interrelatedbusiness decisions, namely, investment, financing and dividend policy. The second pointthat should be clearly understood to that the term objectives provides a normativeframework. That is the focus in financial literature is on what a firm should try toachieve and on policies that should be followed if certain goals are to be achieve. Theimplication is that these are not necessarily followed by firms in actual practice. Theyare rather employed to serve as a basis for theoretical analysis and do not reflectcontemporary empirical industry practices. Thus, the term is used in a rather narrowsense of what a firm should attempt to achieve with its investment, financing anddividend policy decisions.
Profit Maximisation Decision Ceriterion
According to this approach, actions that increase profits should be undertaken andthose that decrease profits are to be avoided. In specific operational terms, as applicableto financial management, the profit maximisation criterion implies that the investment,financing and dividend policy decisions of a firm should be oriented to the maximisationof profits.
The term ‘profit’ can be used in two senses. As a owner-oriented concept it refersto the amount and share of national income which is paid to the owners of business,that is, those who supply equity capital. As a variant it is described as profitability. Itis an operational concepts and signifies economic efficiency. In other words, profitabilityrefers to a situation where output exceeds input, that is, the value created by the useof resources is more than the total of the input resources. Used in this sense, profitabilitymaximisation would imply that a firm should be guided in financial decision making byone test; select assets, projects and decisions which are profitable and reject thosewhich are not. In the current financial literature, there is a general agreement that profitmaximisation is used in the second sense.
The rationale & behind profitability maximisation, as a guide to financial decisionmaking, is simple. Profit is a test of economic efficiency. It provides the yardstick by

17Introduction to Financial Management
which economic performance can be judged. Moreover, it leads to efficient allocationof resources, as resources tend to be directed to uses which in terms of profitabilityare the most desirable. Finally, it ensures maximum social welfare. The individualsearch for maximum profitability provides the famous ‘invisible hand’ by which totaleconomic welfare is maximised. Financial management is concerned with the efficientuse of an important economic resource (input), namely, capital. It is, therefore, arguedthat profitability maximisation should serve as the basic criterion for financial managementdecisions.
The profit maximisation criterion has, however, been questioned and criticized onseveral grounds. The reasons for the opposition in academic literature all into twobroad groups: (i) those that are based on misapprehensions about the workability andfairness of the private enterprise itself, and (2) those that arise out of the difficulty ofapplying this criterion management, refers to an explicit operational guide for theinternal investment and financing of a firm and not the overall goal of business operations.We, therefore, focus on the second type of limitations to profit maximisation as anobjective of financial management. The main technical flaws of this criterion areambiguity, timing of benefits, and quality of benefits.
Ambiguity. One practical difficulty with profit maximisation criterion for financialdecision making is that the term-profit is a vague and ambiguous concept. It has noprecise connotation. It is amenable to different interpretations by different people. Toillustrate, profit may be short term or long term; it may be total profit or rate of profit;it may be before-tax or before-tax or after-tax; it may be return on total capitalemployed or total assets or shareholders equity and so on. If profit maximisation istaken to be the objectives, the question arises, which of these variable of profit shoulda firm try to maximise? Obviously, a loose expression like profit of operational criterionfor financial management.
Timing of Benefits. A more important technical objection to profit maximisation, asa guide to financial decision making, is that it ignores the differences in the time patternof the benefits received from investment proposals or courses of action. While workingout profitability, ‘the bigger the better’ principle is adopted, as the decision is basedon the total benefits received over the working life of the asset, irrespective of whenthey were received. Consider Table 1.1
Table 1.1 Time-pattern of Benefits (Profits)
Alternative A (Rs. Lakhs) Alternative B (Rs. Lakhs)
Period I 50 –
Period II 100 100
Period III 50 100
Total 200 200
It can be seen from Table 1.1 that the total profits associated with the alternatives, Aand B, are identical. If the profit maximisation is the decision criterion, both thealternatives would be ranked equally. But the returns form both the alternatives differin one important respect, while alternative A provides higher returns in earlier years,

Financial Management18
the returns from alternative B are larger in later years. As a result, the two alternativecourses of "action are not strictly identical. This is primarily because a basic dictumof financial planning is the earlier the better as benefits received sooner are morevoluble than benefits'. received later. The reason for the superiority of benefits nowover benefits later lies in the fact that the former can be reinvested to earn a return.This is referred to as time value of money. The profit maximisation criterion does notconsider the distinction between returns received in different time periods and treatsall benefits irrespective of the timing, as equally valuable. This not true in actualpractice as benefits in early years should be valued more highly than equivalent benefitsin later years. The assumption of equal value is inconsistent with the real worldsituation.
Quality of Benefits. Probably the most important technical limitation of profitmaximistion as an operational objective, is that it ignores the quality aspect of benefitsassociated with a financial course of action. The term quality here refers to the degreeof certainty with which benefits can be expected. As a rule, the more certain theexpected return, the higher is the quality of the benefits. Conversely, the more uncertain/fluctuating is the expected benefits, the lower is the quality of the benefits. An uncertainand fluctuating return implies risk to the investors. It can be safely assumed that theinvestors are risk-averters, that is they want to avoid or at least minimise risk. Theycan, therefore, be reasonably expected to have a preference for a return which is morecertain in the sense that it has smaller variance over the years.
The problem of uncertainty renders profit maximisation unsuitable as an operationalcriterion for financial management as it considers only the size of benefits and givesno weight to the degree of uncertainty of the future benefits. This is illustrated inTable 1.2.
Table 1.2 Uncertainty About Expected Benefits (Profits)
State of Economy Alternative A Alternative B
Recession (Period I) 9 0
Normal (Period II) 10 10
Boom (Period III) 11 20
Total 30 30
It is clear from Table 1.2 that the total returns associated with the two alternatives areidentical in a normal situation but the range of variations is very wide in case of alternativeB, while it is narrow in respect of alternative A. To put it differently, the earningsassociated with alternative. B are more uncertain (risky) as they fluctuate widelydepending on the state. of the economy. Obviously, alternative A is better in terms of riskand uncertainty, The profit maximisation criterion fails to reveal this,
To conclude, the profit maximisation criterion is inappropriate and unsuitable as anoperational objective of investment, financing and dividend decisions of a firm. It is notonly vague and time value of money. It follows from the above that an appropriateoperational decision criterion for financial management should (i) be precise and exact,(ii) be based on the ‘bigger the better’ principal, (iii) consider both quantity and quantitydimensions of benefits, and (iv) recognise the time value of money. The alternative toprofit maximisation, that is wealth maximisation is one such measure.

19Introduction to Financial Management
Wealth Maximisation Decision CriterionThis is also known as value maximisation or net present worth maximisation. In currentacademic literature value maximisation is almost universally accepted as an appropriateoperations decision criterion for financial management decisions as it removes thetechnical limitations which characterise earlier profit maximisation criterion Its operationalfeatures satisfy all the three requirement of a suitable operation objective of financialcourses of action, namely, exactness, quality of benefits and the time value of money.
The value of an asset should be viewed in terms of the benefits it can produce. Theworth of a course of action can similarly be judged in terms of the value of the benefitsit produces less the cost of undertaking it. A significant element in computing the valueof a financial course of action, is the precise estimation of the benefits associated withit. The wealth maximisation criterion is based on the measurement of benefits in thecase of the profit maximisation criterion. Cash flow is a precise concept with a definiteconnotation. Measuring benefits in terms of case flow avoids the ambiguity associatedwith accounting profits. This is the first operational feature of the net present worthmaximisation criterion.
The second important feature of the wealth maximisation criterion is that it considersis that it considers both the quantity and quality dimensions of benefit. At the same, italso incorporates the time value of money. The operational implication of the uncertaintyand timing dimensions of the benefits emanating from a financial decision is thatadjustment should be made in the cash flow pattern, firstly, to incorporate risk and,secondly, to make an allowance for differences in the timing of benefits. The value ofa course of action must be viewed in teams of its worth to those providing theresources necessary for its undertaking. In applying thevalue maximisation criterion, the term value is used in terms of worth to the owners,that is, ordinary shareholders. The capitalisation (discount) rate that is employed is,therefore, the rate that reflects the time and risk preferences of the result of higherrisk longer time period. Thus, a stream of case flows that isquite certain might be associated with a rate a 5 per cent, while a very risky streammay carry a 15 per cent discount rate.
For the above reason the net present value maximisation is superior to the profitsmaximisation as an operational objective. As a decision criterion, it involves a comparisonof value to cost. An action that has a discounted value – reflecting both time and riskthat exceeds its cost can be said to create value. Such actions should be undertaking.Conversely, actions, with lees value than cost, reduce wealth and should be alternativewith the greatest net present value should be selected. In the words of Ezra Solomon,
“The gross present worth of a course of action is equal to the capitalisedvalue of the flow of future expected benefit, discounted (or capitalised)at a rate which reflects their certainty or uncertainty. Wealth or netpresent worth is the difference between gross present worth and theamount of capital investment required to achieve the benefits beingdiscussed. Any financial action which creates wealth or which has a netpresent worth above zero is a desirable one and should be undertaken.Any financial action which does not meet this test should be rejected.

25Cost of Capital
Chapter-2Cost of Capital
Cost of Capital is the rate that must be earned in order to satisfy the required rate ofreturn of the firm's investors. It can also be defined as the rate of return on investmentsat which the price of a firm's equity share will remain unchanged.
Each type of capital used by the firm (debt, preference shares and equity) should beincorporated into the cost of capital, with the relative importance of a particular sourcebeing based on the percentage of the financing provided by each source of capital.Using of the cost a single source of capital as the hurdle rate is tempting to management,particularly when an investment is financed entirely by debt. However, doing so is amistake in logic and can cause problems.
Future Cost and Historical Cost
Future cost of capital refers to the expected cost of funds to be raised to finance aproject. In contrast, historical cost represents cost incurred in the past in acquiringfunds. In financial decisions future cost of capital is relatively more relevant andsignificant. While evaluating viability of a project, the finance manager comparesexpected earnings from the project with expected cost of funds to finance the project.Likewise, in taking financing decisions, attempt of the finance manager is to minimisefuture cost of capital and not the costs already defrayed. This does not imply thathistorical cost is not relevant at all. In fact, it may serve as a guideline in predictingfuture costs and in evaluating the past performance of the company.
Component Cost and Composite Cost
A company may contemplate to raise desired amount of funds by means of differentsources including debentures, preferred stock, and common stocks. These sourcesconstitute components of funds. Each of these components of funds involves cost tothe company. Cost of each component of funds is designated as component or specificcost of capital. When these component costs are combined to determine the overallcost of capital, it is regarded as composite cost of capital, combined cost of capital orweighted cost of capital, The composite cost of capital, thus, represents the averageof the costs of each sources of funds employed by the company. For capital budgetingdecision, composite cost of capital is relatively more relevant even though the firm mayfinance one proposal with only one source of funds and another proposal with anothersource. This is for the fact that it is the overall mix of financing over time which ismaterially significant in valuing firm as an ongoing overall entity.

Financial Management26
Average Cost and Marginal Cost
Average cast represents the weighted average of the costs of each source of fundsemployed by the enterprise, the weights being the relative share of each source offunds in the capita! structure. Marginal cost of capital, by contrast refers to incrementalcost associated with new funds raised by the firm. Average cost is the average of thecomponent marginal costs, while the marginal cost is the specific concept used tocomprise additional cost of raising new funds. In financial decisions the marginal costconcept is most significant.
Explicit Cost and Implicit Cost
Cost of capital can be either explicit cost or implicit. The explicit cost of any sourceof capital is the discount rate that equates the present value of the cash inflows thatare incremental to the taking of the financing opportunity with the present value of itsincremental cash outlay. Thus, the explicit cost of capital is the internal rate of returnof the cash flows of financing opportunity.
A series of each flows are associated with a method of financing. At the time ofacquisition of capital, cash inflow occurs followed by the subsequent cash outflows inthe form, of interest payment, repayment of principal money or payment of dividends.Thus, if a company issues 10 per cent perpetual debentures worth Rs. 10,00,000, therewill be cash inflow to the firm of the order of 10,00,00. This will be followed by theannual cash outflow of Rs. 1,00,000. The rate of discount, that equates the presentvalue of cash inflows with the present value of cash outflows, would be the explicitcost of capital.
The technique of determination of the explicit cost of capital is similar to the one usedto ascertain IRR, with one difference, in the case of computation of the IRR, the cashoutflows occur at the beginning followed by subsequent cash inflows while in thecomputation of the IRR, the cash outflows occur at the beginning followed by subsequentcash inflows, while in the computation of explicit cost of capital, cash inflow takesplace at the beginning followed by a series of cash inflow subsequently.
The formula used to compute the explicit cost of capital (C) is:
CI0 = CO
C
t
tt
n
( )11 +=� ...(1)
Where,
CI0 = net cash inflow in period O.
COt = cash outflow in period under reference
C = Explicit cost of capital
The explicit cost of an interest bearing debt will be the discount rate that equates thepresent value of the contractual future payments of interest and principal with the netamount of cash received today. The explicit cost of capital of a gift is minus 100 percent, since no cash outflow will occur in future.

27Cost of Capital
Similarly, explicit cost of retained earnings which involve no future flows to or from thefirm is minus 100 per cent. This should not tempt one to infer that the retained earningsis cost free. As we shall discuss in the subsequent paragraphs, retained earnings docost the firm. The cost of retained earnings is the opportunity cost of earning oninvestment elsewhere or in the company itself. Opportunity cost is technically termedas implicit cost of capital. It is the rate of return on other investments available to thefirm or the shareholders in addition to that currently being considered. Thus, the implicitcost of capital may be defined as the rate of return associated with the best investmentopportunity for the firm and its Shareholders that will be foregone if the projectpresently under consideration by the firm were accepted. In this connection it may bementioned that explicit costs arise when the firm raises funds for financing the project.It is in this sense that retained earnings has implicit cost. Other forms of capital alsohave implicit costs once they are invested, Thus in a sense, explicit costs may also beviewed as opportunity costs. This implies that a project should be rejected if it has anegative present value when its cash flows are discounted by the explicit cost ofcapital.
It is clear thus that the cost of capital is the rate of return a firm must earn on itsinvestments for the market value of the firm to remain unchanged. Acceptance ofprojects with a rate of return below the cost of capital will decrease the value of thefirm; acceptance of projects with a rate of return above the cost of capital will increasethe value of the firm. The objective of the financial manager is to maximize the wealthof the firm’s owners. Using the cost of capital as a basis for accepting or rejectinginvestments is consistent with this goal.
Risk
A basic assumption of traditional cost of capital analysis is that the firm’s businessand financial risk are unaffected by the acceptance and financing of projects.
Business risk is related to the response of the firm’s earnings before interest andtaxes, or operating profits, to changes in sales. When the cost of capital is used toevaluate investment alternatives, it is assumed that acceptance of the proposed projectswill not affect the firm’s business risk. The types of projects accepted by a firm cangreatly affect its business risk.
If a firm accepts a project that is considerably more risky than average, suppliers offunds to the firm are quite likely to raise the cost of funds. This is because of thedecreased probability of the fund suppliers’ receiving the expected returns on theirmoney. A long-term lender will charge higher interest on loans if the probability ofreceiving periodic interest from the firm and ultimately regaining the principal isdecreased. Common stockholders will require the firm to increase earnings ascompensation for increases in the uncertainty of receiving dividend payments or ablyappreciation in the value of their stock.
In analyzing the cost of capital it is assumed that the business risk of the firm remainsunchanged (i.e., that the projects accepted do not affect the variability of the firm’ssales revenues). This assumption eliminates the need to consider changes in the costof specific sources of financing resulting from changes in business risk. The definition

Financial Management28
of the cost of capital developed in this chapter is valid only for projects that do notchange the firm’s business risk.
Financial risk is affected by the mixture of long-term financing, or the capitalstructure, of the firm. Firms with high levels of long-term debt in proportion to theirequity are more risky than firms maintaining lower ratios of long-term debt to equity.It is the contractual fixed-payment obligations associated with debt financing that makea firm financially risky. The greater the amount of interest and principal (or sinking-fund) payments a firm must make in a given period, the higher the operating profitsrequired to cover these charges. If a firm fails to generate sufficient revenues to coveroperating charges, it may be forced into bankruptcy.
As a firm’s financial structure shifts toward suppliers of funds recognize a more highlylevered position the increased financial risk associated with the firm. They compensatefor this increased risk by charging higher rates of interest or requiring greater returns,In short they react in much the same way as they would to increasing business risks.
Frequently the funds supplied to a firm by lenders will change its financial structure,and the charge for the funds will be based on the changed financial structure. In theanalysis of the cost of capital in this chapter, however, the firm’s financial structure isassumed to remain fixed. This assumption is necessary in order to isolate the costs ofthe various forms of financing. If the firm’s capital structure were not held constant,it would be quite difficult to find its cost of capital, since the selection of a given sourceof financing would change the costs of alternate sources of financing. The assumptionof a constant capital structure implies that when a firm raises funds to finance a givenproject these funds are raised in the same proportions as the firm’s existing financing.The awkwardness of this assumption is obvious since in reality a firm raises funds in“lumps,” it does not raise a mixture of small amounts of various types of funds.’ Forexample, in order to raise Rs. l million a firm may sell either bonds, preferred stock,or common stock in the amount of Rs. l million; or, it may sell Rs. 400,000 worth ofbonds, Rs. 100,000 worth of preferred stock, and Rs. 500,000 worth of common stock.Most firms will use the former strategy, but our analysis of cost of capital is based onthe assumption that the firm will follow the latter strategy. More sophisticated approachesfor measuring the cost of capital when a firm’s capital structure is changing rareavailable.
The key factor affecting financing Costs
Since the cost of capital is measured under the assumption that both the firm’s assetstructure and its capital (financial) structure are fixed, the only factor that affects thevarious specific costs of financing is the supply and demand forces operating in themarket for long-term funds. In other words, as a firm raises long-term funds atdifferent points in time, the only factor affecting their cost is the riskless cost of theparticular type of financing. Regardless of the type of financing used, the followingrelationship should prevail:
kj = rj + b + f ...(2)
where
kj = the specific cost of the various types of long-term financing, j

29Cost of Capital
rj = the riskless cost of the given type of financing, j
b = the business risk premium
f = the financial risk premium
Equation 2 indicates that the cost of each specific type of capital depends on he risklesscost of that type of funds, the business risk of the firm, and the financial risk of thefirm.
Since the firm’s business and financial risk are assumed to be constant, the changingcost of each type of capital, j, over time should be affected only by changes in thesupply of and demand for each type of funds, j. The cost of each type of capital toa given firm compared to the cost to another firm (i.e., the inter firm comparison) candiffer because of differences in the degree of business and financial risk associatedwith each firm, since the riskless cost of the given type of funds remains constant.Different business and financial risk premiums are associated. with different levels ofbusiness and financial risk. These premiums are a function of the business risk, b, andfinancial risk, f, of a firm. For intra firm (i.e., time series) comparisons, the onlydifferentiating factor is the cost of the type of financing, since business and financialrisk are assumed to be constant An example may help to clarify these points.
Example
The W.T. L. Company’s cost of long-term debt two years ago was 8 percent. This 8percent was found to represent a 4- percent risk less cost of long-term debt, a 2-percent financial risk premium. and a 2- petcent financial risk premium. Currently, therisk less cost of long-term debt is 6 percent. How much would you expect the W. T.L.’s cost of debt to be today, assuming that the risk structure of the firm’s assets(business risk) and its capital structure (financial risk) have remained unchanged? Theprevious business risk premium of 2 percent and financial risk premium of 2 percentwill still prevail, since neither of these risks has changed in two years. Adding the 4percent total risk premiums (i.e., the 2-percent business risk and the 2-percent financialrisk premium) to the 6-percent riskless cost of long-term debt results in a cost of long-term debt to the W. T. L. Company of 10 percent. In this time-series comparison,where business risk and financial risk are assumed to be constant, the cost of the long-term funds changes only in response to changes in the riskless cost of a given type offunds.
Let us now suppose that there is another company, the Plate Company, for which therisk less cost of long-term debt is the same as it is for W. T. L. The Plate Companyhas a 2-percent business risk premium and a 4-percent financial risk premium becauseof the high degree of leverage in its financial structure. Although both companies arein the same type of business (and thus have the same business risk premium of 2percent), the cost of long-term debt to the Plate Company is 12 percent (i.e., thedpercent riskless cost of money.
Although the relationship between lj, b, and t, is presented as linear in Equation A, thisis only for simplicity; the actual relationship is likely to be much more complexmathematically. The only definite conclusion that can be drawn is that the cost of a

Financial Management30
specific type of financing for a firm is somehow functionally related to the riskless costof that type of financing adjusted for the firm’s business and financial risk(i.e., that kj = f(r; b, f).
The reader should recognize that the riskless cost of each type of financing, ‘I, maydiffer considerably. In other words, at a given point in time the riskless cost of debt maybe 6 percent while the riskless cost of common stock may he 9 percent. The risklesscost is expected to be different for each type of financing, j· The risk less cost ofdifferent maturities of the same type of debt may differ, since longer-term Issues aregenerally viewed as more risky.
Factors determining the cost of capital
There are several factors that impact the cost of capital of any company. This wouldmean that the cost of capital of any two companies would not be equal. Rightly so asthese two companies would not carry the same risk.
l General economic conditions: These include the demand for and supply ofcapital within the economy, and the level of expected inflation. These are reflectedin the riskless rate of return and is common to most of the companies.
l Market conditions: The security may not be readily marketable when the investorwants to sell; or even if a continuous demand for the security does exist, the pricemay vary significantly. This is company specific.
l A firm’s operating and financing decisions: Risk also results from the decisionsmade within the company. This risk is generally divided into two classes:
n Business risk is the variability in returns on assets and is affected by thecompany's investment decisions.
n Financial risk is the increased variability in returns to the common stockholdersas a result of using debt and preferred stock.
l Amount of financing required: The last factor determining the company's costof funds is the amount of financing required, where the cost of capital increasesas the financing requirements become larger. This increase may be attributable toone of the two factors:
n As increasingly larger public issues are increasingly floated in the market,additional flotation costs (costs of issuing the security) and underpricing willaffect the percentage cost of the funds to the firm.
n As management approaches the market for large amounts of capital relativeto the firm's size, the investors' required rate of return may rise. Suppliers ofcapital become hesitant to grant relatively large amounts of fundswithout evidence of management's capability to absorb this capital into thebusiness.
Generally, as the level of risk rises, a larger risk premium must be earned to satisfycompany's investors. This, when added to the risk-free rate, equals the firm's cost ofcapital.

31Cost of Capital
Significance of the Cost of Capital
It should be recognized at the outset that the cost of capital is one of the most difficultand disputed topics in the finance theory. Financial experts express conflicting opinionsas to the way in which the cost of capital can be measured. It should be noted thatit is a concept of vital importance in the financial decision-making. It is useful as astandard for:
l evaluating investment decisions,
l designing a firm’s debt policy, and
l appraising the financial performance of top management.
Investment evaluation The primary purpose of measuring the cost of capital is its useas a financial standard evaluating the investment projects. In the NPV method, aninvestment project is accepted if it has a positive NPY. The project’s NPV is calculatedby discounting its cash flows by the cost of capital. In this sense, the cost of capitalis the discount rate used for evaluating the desirability of an investment project. In theIRR method, the investment project is accepted if it has an internal rate of returngreater than the cost of capital. In this context, the cost of capital is the minimumreturn on an investment project. It is also known as the cutoff, or the target, or thehurdle rate.
An investment project that provides .positive NPV when its cash flows are discountedby the cost of capital makes a net contribution to the wealth of shareholders. If theproject has zero NPV, it means that its a return just equal to the cost of capital, andthe acceptance or rejection of the project will not affect the wealth of shareholders Thecost of capital is the minimum required rate of return on the investment project thatkeeps the present wealth of shareholders unchanged. It may be, thus, noted that thecost of capital represents a financial standard for allocating the firm’s funds, suppliedby owners and creditors, to the various investment projects in the most efficientmanner.
Designing debt policy The debt policy of a firm is significant influenced by the costconsideration. In designing the financing policy, that is, the proportion of debt and equityin the capital structure, the firm aims at cost of capital. The relationship between thecost of capital and the capital structure decision is discussed later on.
The cost of capital can also be useful in deciding about the methods of financing at apoint of time. For example, cost may be compared in choosing between leasing andborrowing. Of course, equally important considerations are control and risk.
Performance appraisal Further, the cost of capital framework can be used to evluatethe financial performance of top management. I Such an evaluation will involve acomparison of actual profitability of the investment projects undertaken by the firmwith the project overall cost of capital, and the actual cost incurred by managementin raising the required funds.
The cost of capital also plays a useful role in dividend decision and investment incurrent assets. The chapters dealing with these decisions show their linkages themethods of financing with the cost of capital.

Financial Management32
Measurement
Time Value of Money
If an individual behaves rationally, then he would not equate money in hand today withthe same value a year from now. In fact, he would prefer to receive today than receiveafter one year. The reasons sited by him for preferring to have the money today include:
1. Uncertainty of receiving the money later.
2. Preference for consumption today.
3. Loss of investment opportunities.
4. Loss in value because of inflation.
The last two reasons are the most sensible ones for looking at the time value of money.There is a 'risk free rate of return' (also called the time preference rate) which is usedto compensate for the loss of not being able to invest at any other place. To this a 'riskpremium' is added to compensate for the uncertainty of receiving the cash flows.
Required rate of return = Risk free rate + Risk premium
The risk free rate compensates for opportunity lost and the risk premium compensatesfor risk. It can also be called as the 'opportunity cost of capital' for investments ofcomparable risk.
To calculate how the firm is going to benefit from the project we need to calculatewhether the firm is earning the required rate of return or not. But the problem is that theprojects would have different time frames of giving returns. One project may be givingreturns in just two months, another may take two years to start yielding returns. If boththe projects are offering the same %age of returns when they start giving returns, onewhich gives the earnings earlier is preferred.
This is a simple case and is easy to solve where both the projects require the samecapital investment, but what if the projects required different investments and wouldgive returns over a different period of time? How do we compare them? The solutionis not that simple. What we do in this case is bring down the returns of both the projectsto the present value and then compare. Before we learn about present values, we haveto first understand future value.
Future Value
If we are getting a return of 10 % in one year what is the return we are going to get intwo years? 20 %, right. What about the return on 10 % that you are going to get at theend of one year? If we also take that into consideration the interest that we get on this10 % then we get a return of 10 + 1 = 11 % in the second year making for a total returnof 21 %. This is the same as the compound value calculations that you must havelearned earlier

33Cost of Capital
Future Value = (Investment or Present Value) * (1 + Interest) No. of time Periods
The compound values can be calculated on a yearly basis, or on a half-yearly basis, oron a monthly basis or on continuous basis or on any other basis you may so desire. Thisis because the formula takes into consideration a specific time period and the interestrate for that time period only.
To calculate these values would be very tedious and would require scientific calculators.To ease our jobs there are tables developed which can take care of the interest factorcalculations so that our formulas can be written as:
Future Value = (Investment or Present Value) * (Future Value Interest Factor n,i)
where n = no of time periods and i = is the interest rate.
Let us look at an example of how we calculate the future value:
Example
Rs 7000 are invested at 5% per annum compound interest compounded annually. Whatwill be the amount after 20 years?
Solution
Here i = 0.05, P = 7000, and n = 20. Putting it in the formula we get:
FV = 7000 x (1+0.05)20
FV = 7000 x 2.6533 = Rs 18573.1
We have taken a shortcut here. We looked at the future value of Rs 1 at the end of 20years at 5% interest in the Future Value Interest Factor Table given at the end of thisbook (i.e. find the value of Future Value Interest Factor n,i)and found the figure to be2.6533 and then substituted the figure here to get the answer.
Another way of doing it would be to use a scientific calculator and calculate the valuethat comes out to be the same.
A third way of doing this would be even more simple. Use a spreadsheet program. Letus see how we use Microsoft Excel to do the same.
Step 1: Go to the Insert menu and choose function. You get a screen that looks likethis:

Financial Management34
Step 2: In the financial function category choose FV (it stands for Future Value) andpress OK.
Step 3: You would get a screen that would look like this:

35Cost of Capital
Step 4: Insert the values as given in the example. Here r = I = 0.05, Nper is the numberof periods = 20, Pmt is the periodic annuity (how to use it we will see a little later) = 0in this case as there is no annual payment except the first one. Pv is the present value= Rs 7000 in this case and Type is a value representing the timing of the payment = 0 inthis case as the investment is done at the end of the period 0 or at the start of the period1. This also means that we get the returns at the end of the period 20 simultaneouslywhen we make the last payment. Putting these values we get the following screen.
Note that the result of the figures that you input is shown in the formula result sectionwhere it is Rs 18,573.08. Compare this with the figure that you get from using the valuefrom the table, a difference of Rs 0.02. Negligible.
What if the money was payable at the start of the period rather than at the end of theperiod? Here it does not matter as there is only one investment and that is also at thestart of the first period. It would matter when we look at the future value of the annuity.But what is an annuity anyway?

Financial Management36
Future Value of an Annuity
Annuity is defined as periodic payment every period for a number of periods. Thisperiodic payment is the same every year only then it could be called an annuity. Thecompound value (future value) of this annuity can be calculated using a different formula:
Future Value = ��
���
� −+i
iA
n ]1)1[(
Here A is the constant periodic cash flow (annuity), i is the rate of return for one periodand n is the number of time periods. The term within the brackets is the compoundvalue factor of an annuity. We can also use the tables given at the end of the text bookto calculate the compound values of the cash flows and the formula would change to:
Future Value = Annuity * (Future Value Annuity Factorn,i)
Extending the same example we used above, if we were going to pay Rs 7000 everyyear for the next 20 years what is the value at the end of 20 years if the interest ratewas 5 % compounded annually.
Example
An annual payment of Rs 7000 is invested at 5% per annum compounded annually.What will be the amount after 20 years?
Solution
Here i = 0.05, P = 7000, and n = 20. Putting it in the formula we get:
Fugure Value = ��
���
� −+05.0
]1)005.01[( 0007
20
FV = 7000 x 33.066 = Rs 2,31,462
We have taken a shortcut here. We looked at the future value of Rs 1 at the end of 20years at 5% interest in the Future Value Annuity Factor Table given at the end of thisbook (i.e. find the value of Future Value Annuity Factor n,i)and found the figure to be33.066 (try finding the figure yourself) and then substituted the figure here to get theanswer. Another way of doing it would be to use a scientific calculator and calculatethe value that comes out to be the same.
Let us see how we use Microsoft Excel to do the same. Insert the values as given inthe example. Here r = I = 0.05, Nper is the number of periods = 20, Pmt is the periodicannuity = 7000. Pv is the present value = 0 in this case as it an annuity and Type is avalue representing the timing of the payment = 0 in this case as the first investment is

37Cost of Capital
done at the end of the period 1. Note that in the earlier case this also means that we getthe returns at the end of the period 20 simultaneously when we make the last payment.Putting these values we get the following screen.
Can you find the answer? Yes, it is Rs 231,461.68 a difference of Rs 0.32 from theanswer we got using the table above.
A variation on this would be that the payment made at the start of the period instead ofthe end of the period. This means that you earn extra interest for one year. The formulais slightly different in that the whole value is multiplied by (1+i) resulting in the followingformula:
Future Value = )1(]1)1[(
ii
iA
n
+��
���
� −+
In the excel spreadsheet we just have to change the type to 1 to get the desiredresult.
The result now comes to Rs 243,034.76, which is nothing but the earlier figure of Theresult now comes to Rs 2,43,034.76, which is nothing but the earlier figure of Rs2,31,461.68 multiplied by 1.05 (i.e. 1+i).

Financial Management38
Still this leaves one problem unanswered: If the projects have different time spans(which could be as far apart as 50 years or more) how do we use the results that weget from here to compare. It becomes very difficult. Also we cannot be too sure of thediscounting rates and cash flows so getting comparable values would be difficult to saythe least. To solve this problem we solve for the present value.
Present Value
When we solve for the present value, instead of compounding the cash flows to thefuture, we discount the future cash flows to the present value to match with theinvestments that we are making today. Bringing the values to present serves twopurposes:
1. The comparison between the projects become easier as the values of returns ofboth are as of today, and
2. We can compare the earnings from the future with the investment we are makingtoday to get an idea of whether we are making any profit from the investment ornot.
For calculating the present value we need two things, one, the discount rate (or theopportunity cost of capital) and two, the formula.
The present value of a lump sum is just the reverse of the formula of the compoundvalue of the lump sum:
nieFutureValu
esentValue)1(
Pr+
=
Or to use the tables the change would be:
Present Value = Future Value * (Present Value Interest Factor n,i)
where n = no of time periods and i is the interest rate.
Let us look at an example of how we calculate the future value:
Example
Rs.2,00,000 is the amount that you require after 20 years for your retirement. Howmuch should you invest now at 5% per annum compounded annually?
Solution
Here i = 0.05, FV = 2,00,000, and n = 20. Putting it in the formula we get:
20)05.01(200000
Pr+
=esentValue

39Cost of Capital
Solve this or use the present value table.
Using the present value interest factor table we find that present value of Rs 1 of 20years from now at 5% interest is 0.3769. Multiplying it with the future value Rs 2,00,000we get:
PV = 2,00,000 x 0.3769 = Rs 75,380
Let us see how we use Microsoft Excel to do the same.
Step 1: Go to the Insert menu and choose function. In the financial function categorychoose PV (it stands for Present Value) and press OK.
Step 3: You would get a seen that would look like this:

Financial Management40
Step 4: Insert the values as given in the example. Here r = I = 0.05, Nper is the numberof periods = 20, Pmt is the periodic annuity (how to use it we will see a little later) = 0in this case as there is no annual payment except the first one. Fv is the future value =Rs 2,00,000 in this case and Type is a value representing the timing of the payment = 0in this case. Putting these values we get the following screen.
Note that the result of the figures that you input is shown in the formula result sectionwhere it is Rs 75,377.89. Compare this with the figure that you get from using the valuefrom the table, a difference of Rs 2.11. Negligible, but still higher than the differenceswe used to get in the future value. Can you tell why? This is because of the fact thatwhile dividing you require numbers more than four digits to get accuracy.
What if the money was payable at the start of the period rather than at the end of theperiod? Here it does not matter as there is only one future value and that is also at thestart of the first period. It would matter when we look at the present value of theannuity.
Present Value of an Annuity
The present value of an annuity can be calculated by:
��
���
�
+−+= n
n
iii
AesentValue)1(
]1)1[(Pr
Or to use the tables the change would be:
Present Value = Annuity * (Present Value Annuity Factor n,i)
Let us see an example
Example
You have been promised an annual grant of Rs 7000 every year for the next 20 years

41Cost of Capital
If you can invest the amount at 5% per annum compounded annually what will be theamount you would require today to land up with the same position?
Solution
Here i = 0.05, A = 7000, and n = 20. Putting it in the formula we get:
Using the shortcut from the table we get:
��
���
�
+−+= 20
20
)05.01(05.0]1)05.01[(
7000Pr esentValue
PV = 7000 x 12.4622 = Rs 87,235.4
We looked at the present value of an annuity of Rs 1 for 20 years at 5% interest in thePresent Value Annuity Factor Table given at the end of this book (i.e. find the value ofPresent Value Annuity Factor n,i)and found the figure to be 12.4622 (try finding thefigure yourself) and then substituted the figure here to get the answer. Another way ofdoing it would be to use a scientific calculator and calculate the value that comes out tobe the same.
Let us see how we use Microsoft Excel to do the same. Insert the values as given inthe example. Here r = I = 0.05, Nper is the number of periods = 20, Pmt is the periodicannuity = 7000 in this case. Fv is the future value = 0 in this case as it is an annuity andType is a value representing the timing of the payment = 0 in this case as the firstinvestment is done at the end of the period 1. Putting these values we get the followingscreen.
Can you find the answer? Yes, it is Rs 87,235.47 a difference of Rs 0.07 from theanswer we got using the table above.
A variation on this would be that the payment made at the start of the period instead ofthe end of the period. This means that you earn extra interest for one year. The formulais slightly different in that the whole value is multiplied by (1+i) resulting in the followingformula:

Financial Management42
)1()1(
]1)1[(Pr i
iii
AesentValue n
n
+��
���
�
+−+=
In the excel spreadsheet we just have to change the type to 1 to get the desired result.
The result now comes to Rs 91,597.25, which is nothing but the earlier figure of Rs87,235.47 multiplied by 1.05 (i.e. 1+i).
Perpetuity
If the annuity is expected to go on forever then it is called a perpetuity and then theabove formula reduces to:
iA
esentValue =Pr
Perpetuities are not very common in financial decision making as no project is expectedto last forever but there could be a few instances where the returns are expected to befor a long indeterminable period. Especially when calculating the cost of equity perpetuityconcept is very useful.
For a growing perpetuity the formula changes to:
giA
esentValue−
=Pr
All these calculations take into consideration that the cash flow is coming at the end ofthe period.
Valuing Securities
The objective of any investor is to maximise expected returns from his investments,

43Cost of Capital
subject to various constraints, primarily risk. Return is the motivating force, inspiringthe investor in the form of rewards, for undertaking the investment. The importance ofreturns in any investment decision can be traced to the following factors:
l It enables investors to compare alternative investments in terms of what theyhave to offer the investor.
l Measurement of past returns enables the investors to assess how well they havedone.
l Measurement of historical returns also helps in estimation of future returns.
Why are we discussing the return so much? The value of the security to an investor isdirectly proportional to the return that he is expected to get from that security. Higherthe return expected, higher is the value. But what are we going to do with the value ofthe security? Well, value of the security is the price that you are going to pay for thatsecurity. This means that the present value of the security is that value which is dependenton the return from the security and the risk profile of that security. Now let us gofurther on return.
The Components of Return
Return is basically made up of two components:
l The periodic cash receipts or income on the investment in the form of interest,dividends, etc. The term yield is often used in connection with the component ofreturn. Yield refers to the income derived from a security in relation to its price,usually its purchase price.
l The appreciation (depreciation) in the price of the asset is referred to as capitalgain (loss). This is the difference between the purchase price and the price atwhich the asset can be, or is, sold.
Measuring the Rate of Return
The rate of return is the total return the investor receives during the holding period (theperiod when the security is owned or held by the investor) stated as a %age of thepurchase price of the investment at the beginning of the holding period. In other wordsit is the income from the security in the form of cash flows and the difference in priceof the security between and the end of the holding period expressed as a %age of thepurchase price of the security at the beginning of the holding period. Hence, total returncan be defined as:
asset theof price Purchaseperiod over the change Price receivedPayment Cash
Returns Total+=

Financial Management44
The price change over the period, is the difference between the beginning (or purchase)price and the ending (or sales) price. This can be either positive (sales price exceedspurchase price) or negative (purchase price exceeds sales price).
The general equation for calculating the rate of return for one year is shown below:
K = [Dt + (Pt - Pt-1)]
Pt-1
where K = Rate of Return
P t = Price of the security at time "t" i.e. at the end of the holding period.
Pt-1 = Price of the security at time "t-1" i.e. at the beginning of the holdingperiod or purchase price.
Dt = Income or cash flows receivable from the security at time "t".
Valuing Debt Securities
Securities that promise to pay its investors a stated rate of interest and return theprincipal amount at the maturity date are known as debt securities. The maturity periodis typically more than one year which is the key differentiating factor between themand the money market securities. Debt securities are usually secured. Debt securitiesdiffer according to their provisions for payment of interest and principal, assets pledgedas a security and other technical aspects. In the case of bankruptcy of the corporation,the law requires that the debt holders should be paid off before the equity investors.
A legal agreement, called a trust deed, is drawn between the security holders and thecompany issuing the debt securities. Every security issued under it has the same rightand protection. Trust deed is a complicated legal document containing restrictions onthe company, pledges made by the company, and several other details. The trustee,usually a large bank or a financial institution, ensures that the issuing corporation keepsits promises and obeys the restrictions of the contract. The trustee is the watchdog forthe debt securities holders because it is impossible for the individual holders to keep aneye on the functioning of the company.
Debt securities are different from term loans provided by the financial institutions andthe banks to the company. Term loans are long term debt contracts under which aborrower agrees to make a series of interest and principal payments on specific datesto the lender. While this is true for debt securities also, term loans differ in one significantaspect that they are generally sold to one (or few) lenders especially financial institutionsand banks, while debt securities (terms 'debentures' and 'bonds' will be usedinterchangeably for debt securities) are typically offered to the public. Another significantdifference is that principal repayments in term loans are made along with the interest

45Cost of Capital
payments but in debt securities it is usually a lump sum payment at the end of the period(or a series of payments).
Terms Associated with Debt Securities
There are several terms which are used when we talk about debt securities. Beforewe take a look at different kinds of debt securities available in the Indian market, let usfirst understand these terms.
Face Value/ Par Value
Value of the security as mentioned on the certificate of the security. Face values andpar values are two terms which are used interchangeably. Corporate debentures areusually issued with Rs.100 face values and Government bonds with Rs.1 lac facevalues. Although the value of the debenture (or the Government bond) will fluctuate inprice from the time they are issued until redemption, they are usually redeemed atmaturity at their face value (unless a premium is to be given on redemption).
The face value is the amount on which the interest is calculated. Thus, a 15 per centdebenture with a face value of Rs.100 will pay debenture holders Rs.15 per debentureper year.
Coupon Rate
The coupon rate is the stipulated interest rate to be paid on the face value of a bond. Itrepresents a fixed rupee amount that is paid periodically as long as the debtor is solvent.The period could be monthly, quarterly, semi-annually or annually. Zero-coupon bonds(discussed later) are also common. The coupon rate could be a fixed rate or a floatingrate. The floating rate is normally pegged to a base rate (e.g. 1 per cent above bankrate) and fluctuates with the fluctuation in the base rate. The coupon rate is fixed afterthe issuing corporation's merchant banker has weighed the risk of default, the creditrating of the issuer, options attached with the issue, the investment position of the industry,the security backing of the debenture, and the appropriate market rate of interest forthe firm's industry, size, and risk class. The goal is to pick a coupon rate that is just highenough to attract investors.
Interest payments
Debenture interest is usually paid semi-annually, though annual payments are notuncommon. In India we normally have registered debentures on which the interest ispayable to the debenture holder whose name appears on the register when the paymentis made. In developed countries, coupon bonds are also available which have a seriesof attached coupons that are clipped off at the appropriate times and sent to a bank forcollection of the interest. Of course, now with the Electronic Clearing System, theinterest can be directly deposited in the bank account of the bond holder.

Financial Management46
Maturities
Debentures are sometimes grouped by the length of time until maturity that existed onthe date the debenture was first issued. Money Market Securities mature in 364 daysor less. Short-term debentures are those maturing within 1 to 3 years. Medium termdebentures mature between 5 to 8 years and long term debentures are the ones whohave a maturity life of 10 years or more.
Redemption
Redemption is the repayment of the debt security at or before maturity. Redemptioncould at par or at a premium to face value. A debt security will be redeemed beforematurity if the issuer feels that he can borrow the same amount at a lower rate ofinterest or he does not require the funds any longer. If there is a premature redemption(redemption before the maturity date), a premium is usually paid to the debenture holders.
Call/ Put Options Provision
A call/ put option provision allow both the issuing company and the investor to redeemthe bonds at a specified amount before the maturity date. Long term bonds (10 yearsor more) usually have a call/ put option is attached to the bond which is (usually)exercisable after every 5 year intervals. In this case the issuing company has a calloption that it can call back the bonds and repay to the investors the principal and interestdue till that date. If the issuer exercises his call option the investor has no recourse butto submit his bonds and get the money. Similarly the investor has a put option, in whichcase he has an option to return the bonds and get the principal and interest till that date.As in earlier case if the investor exercises his option, the company has no recourse butto pay the investor.
Issuing corporation will use the provision if the interest rates fall substantially below thecoupon rates offered on the security and the investor will use the put option if he canget better returns elsewhere.
For bonds with call/ put options the yields are calculated to the nearest year at whichthe call/ put option is exercisable. This yield is known as yield to call (YTC) which isdifferent from the yield to maturity (YTM).
Sinking Fund
A provision that requires the corporation to set aside a fixed amount each year to helpprovide for the orderly repayment of the debt issue.
Credit Rating
It is mandatory for the issuing companies to get the credit rating done on debt securitiesissues. Credit ratings are also mandatory for Commercial Paper and Fixed Depositsissues of the companies. Ratings reflect the probability of the companies going intodefault. The higher the rating, the lower the risk of default that is associated with the
47Cost of Capital
issue. This also has an effect on the rate of interest offered on the issue. The methodologyand the rating symbols remain the same as in money market securities.
Types of Debt Securities
There are several types of debt securities available in the market. The range includesGovernment Securities, debentures, deep discount bonds, zero coupon bonds, etc.
Government Securities
Government is one of the biggest borrowers from the capital and the money market.We have already taken a look at the money market securities offered by the Governmentas also the schemes run by it through the post office. Government Securities is thegeneric term applied to various kinds of debentures and bonds offered by the Government(centre or state) and quasi-governmental agencies.
The maturities of the Government securities range between 1-20 years and the returnon the securities range between 5 to 7 per cent. The rates have significantly comedown from the high yields of 14 per cent registered in 1996. Most of the GovernmentSecurities are bought by the banks, financial institutions, provident fund trusts, insurancecompanies.
There are two types of Government Securities that are offered:
Government of India Floating Rate Bonds Bonds which pay a floating rate dependingupon the base rate announced by the RBI.
Government Securities Regular debentures which pay a fixed rate of return and theprincipal amount is returned on maturity. The last issue of government stock paid acoupon rate of 6.50 per cent.
The present yield on Government Securities is in the range of 5.50 - 7.00 per centdepending on the maturity.
Non-Convertible Debentures (NCDs)
NCDs are plain debenture securities issued by corporations. They are normally mediumterm in nature, maturing between 1 to 8 years and generally have a repayment schedulestaggered over two to three years. They are secured by a collateral backing and creditrated. Interest rate offered on medium term NCDs is usually lower than the marketrate so many times the companies offer a sop of equity warrants along with NCDs tosweeten the issue. Interest rate on the short term NCDs is in line with the market rateand depends upon the quality of the issuer.
Deep Discount Bond (DDB)
Usually long term with maturities exceeding 10 years, deep discount bonds are normallyissued by blue chip corporations or financial institutions. Like money market securities,these bonds are issued at a discount to their face values. Because of long maturity
Financial Management48
periods the discount is also higher, hence the term deep discount. Although long termmaturity is the norm, short maturities are not uncommon, for example GE Capital hadan issue of DDBs with a maturity period of 17 months and 29 days.
The first issue of DDBs was made by Small Industries Development Bank of India(SIDBI). Each DDB, with a face value of Rs.1,00,000, was issued at a discountedprice of Rs.2,500 with a maturity period of 25 years from the date of allotment. Boththe investors and SIDBI have an option of withdrawing or redeeming the bond (call &put options) respectively at the end of 5th, 9th, 12th, 15th, or 20th year from the date ofallotment at the deemed value of Rs.5,300, Rs.9,600, Rs.15,300, Rs.25,000 and Rs.50,000respectively.
After the success of the SIDBI issue, all the prominent financial institutions like IDBI,ICICI, etc. came out with the issues of DDBs. All these issues, however, were calledby the institutions as the interest rates fell.
Zero Interest Bonds (ZIBs)
Very much alike DDBs, the only crucial difference is that these are issued at facevalues (DDBs are issued at a discount to face value) and the redemption is at a premium.Tax treatment of both is the same.
Secured Premium Notes (SPNs)
SPNs are bonds issued by corporations which are medium term in nature, maturingbetween 3 to 8 years. The advantage is the flexibility it offers in giving the returns aspremium or interest payments depend upon the preferences of the holders.
The only issuer of SPNs in the Indian markets till now is TISCO Ltd. It issued SPNsof Rs.300 each. The repayment started after three years, and there was no paymentof interest in between. The repayment went on for four years starting from the fourthyear to seventh year. Every year there will be a payment of Rs.150 (totallingRs.150*4=Rs.600 in four years). Rs.75 in this would be accounted for as principalrepayment and the rest Rs.75 could be taken as a mixture of interest and premium atthe option of the investor. (Rs.25 as interest + Rs.50 as premium; Rs.37.50 interest +Rs.37.50 premium; Rs.50 interest + Rs.25 premium).
The advantage of this was easier tax planning for the investor, but the tax authoritieswere not happy with this kind of an arrangement. TISCO also attached an equitywarrant which was convertible into equity at a price which was at considerable discountto the market price prevailing at that time.
Floating Rate Bonds (FRBs)
Bonds whose interest payments fluctuate with changes in the general level of interestrates and are tied to a basic rate (known as the reference rate). The first issue in India

49Cost of Capital
was from State Bank of India (SBI). It issued unsecured, redeemable, subordinated,floating interest rate bonds in the nature of promissory notes carrying a coupon rate of3 per cent per annum above the bank's maximum term deposit rate.
Pass Through Certificates (PTCs)
Pass Through Certificates (PTCs) are debt securities that pass through income fromdebtors through intermediaries to investors. Primarily banks who have a strong retailloan portfolio are the intermediaries who issue these certificates. The most commonform if pass through is mortgage backed security, in which the principal and and interestpayment from the home loan (or car loan) takers are passed from the banks or savingsagencies that pool and repackage them in the form of securities, to investors. The bankthat collects the payments from debtors charges a fee fro its services, which is deductedfrom the income passed on to investors. These securities are credit rated and theinterest payment is according to the rating. The rating (i.e. P1+) is followed by (So) todenote the transaction is that of securitization.
Rate of return of a Bond
In case of bonds, instead of dividends, the investor is entitled to payments of interestannually or semi-annually. The investor also benefits if there is an appreciation in thevalue of bond, otherwise there is the redemption of the bond at par value or at premium.
Using the present value formula developed above we can say that:
ni)1(Amount Principal
i)(1AmountInterest
Bond a of ValuePresent n
1tt +
++
=�=
Here interest amount is individually brought to its present value or we can apply theannuity factor table to get its present value. The principal amount is brought to itspresent value when it is due.
Or to use the tables the change would be:
Present Value = Interest Amount * (Present Value Annuity Factorn,i) + Principal Amount* (Present Value Interest Factorn,i)
Example
A bond is paying 10 % interest per annum and is going to mature in the next two yeaRsAt maturity it will pay its principal amount of Rs 100. If the expected return on bondstoday are (i) 7 %, (ii) 10 % and (iii) 15 %, what value would you pay for the bond today.
Solution
Using the above formula for situation 2), we can say that

Financial Management50
221
2
2
1tt
)1.1(100
)1.1(10
)1.1(10
Bond a of ValuePresent
)1.1(Amount Principal
(1.1)AmountInterest
Bond a of ValuePresent
++=
+=�=
Or to use the tables the change would be:
Present Value = 10 * (PVAF2,0.1)
+ 100 * (PVIF2,0.1)
Substituting the values we find that
Present Value = 100
This is no magic. When you are getting a 10 % return and also expect a 10 % return,the price you would pay would equal the par value of the bond. This means that if weexpect higher return i.e. 15% in situation (iii) above, the price that we would be willingto pay for a bond returning only 10 % would be less than the par value. Similarly, if weexpect lower return, i.e., 7% in situation (i) above, the price that we would be willing topay for a bond returning 10 % would be higher than the par value. Can you find out thevalues for these two cases?
There are five variables in this case: (1) present value, (2) future value, (3) interestamount paid, (4) return expected and (5) time period. Properties of mathematics saythat if any four of these five variables are given, you can always find the value of thefifth variable. You can attempt that yourself or turn over to solved examples to look ata similar case.
Valuing Equity Securities
Unlike debt and money market instruments, equity instruments represent the ownershipinterest in the company. As owners must put in their money in the venture beforeanybody would lend to them, equity is always issued before debt is released by theinstitutions. In fact the incorporation of the company requires that the promoters mustpick up some shares in the company, only then the company can be incorporated. Asequity represents the owners it is but logical that all the debt holders must be paid offbefore owners can claim any returns from the company. So the equity has the lowest-priority claim on earnings. Equity also has the last claim on the assets in case thecompany is liquidated (closed down).
This means that the equity carries the highest risk. Not without reason. The flip side ofthe coin is that the equity owners are also the owners of all the profits that remain afterall the debt holders are paid their interest. The interest payment is fixed while there isno limit on the levels of profits that can accrue to the equity holders. Vice Versa doesnot apply here, the liability of the equity holders is limited to the level of investments that

51Cost of Capital
they have put in into the company and not unlimited.
Unlimited profit sharing means that equity shares have an unlimited potential for dividendpayments and price appreciation. Which is why investing in equity is so exciting andfull of opportunities. At the same time the risk is also high because there is nothingfixed about earnings which can fluctuate widely depending upon the businessenvironment. This is also the reason why this book will devote much more time toequity than on debt.
Shareholders, being the owners of the company, elect the board of directors and voteon major issues that affect the functioning and long term plans of the company. Majorshareholders take up seats on the board of directors and influence the decisions thatare taken. Small shareholders cannot exercise the same level of control so when theydo not like the way the company is being run they simply sell their shares and investtheir money somewhere else.
A shareholder, by virtue of being an owner, is normally entitled to four basic rights ofownership:
1. claim on a share of the company's undivided assets in proportion to number ofshares held (this is not to say that he can return the shares and get a part of theassets, he will not get it),
2. proportionate voting power in the election of Directors and other business conductedat annual general meeting which can be exercised either by attending of the meetingor by Proxy,
3. dividends, when earned and declared by the Board of Directors, as also aproportionate share in the residual earnings which the company retains, and
4. pre-emptive right to subscribe to additional share offerings before they are offeredto general investors unless a special resolution has been passed in the annualgeneral meeting to the contrary.
The piece of paper which testifies the ownership position of the shareholder in a companyis called a share certificate. The number of shares, their par value, the certificatenumber, distinctive numbers, the date of issue and the owner's name are mentioned onthe share certificate.
Terms Associated with Equity Securities
Let us look at some of key terms that are associated with equity shares:
Stock
Ownership of a company represented by shares that are a claim on the company'searnings and assets.
Share
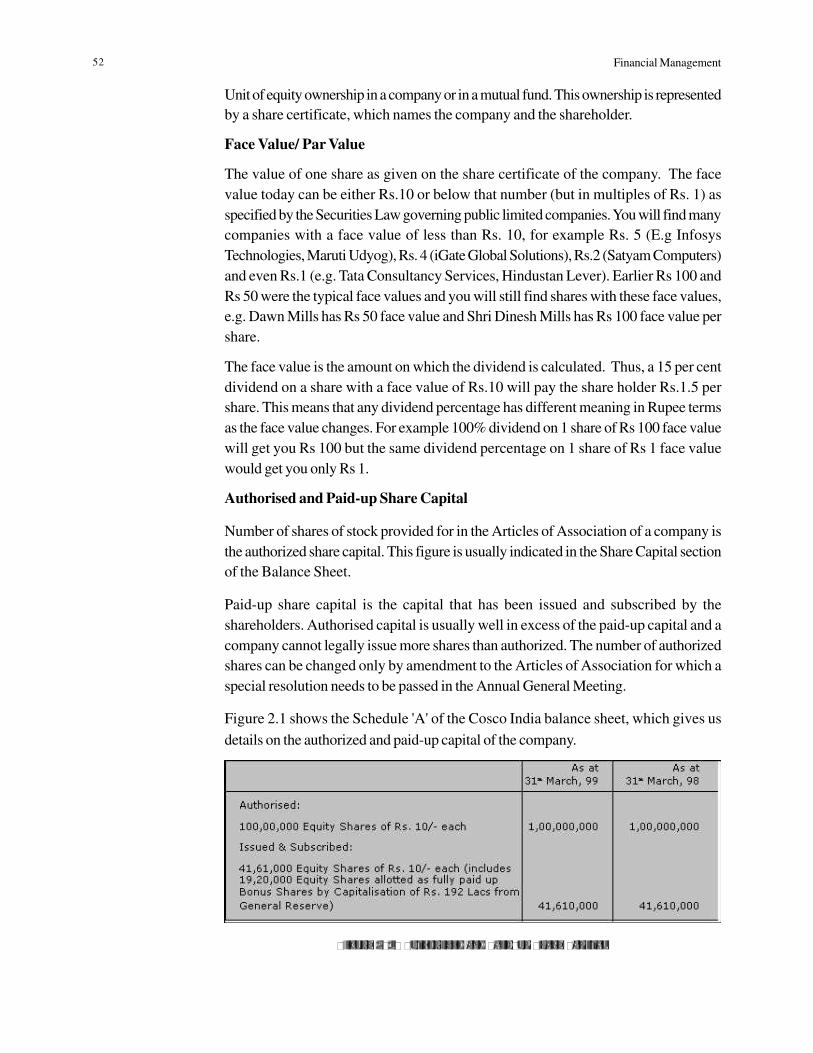
Financial Management52
Unit of equity ownership in a company or in a mutual fund. This ownership is representedby a share certificate, which names the company and the shareholder.
Face Value/ Par Value
The value of one share as given on the share certificate of the company. The facevalue today can be either Rs.10 or below that number (but in multiples of Rs. 1) asspecified by the Securities Law governing public limited companies. You will find manycompanies with a face value of less than Rs. 10, for example Rs. 5 (E.g InfosysTechnologies, Maruti Udyog), Rs. 4 (iGate Global Solutions), Rs.2 (Satyam Computers)and even Rs.1 (e.g. Tata Consultancy Services, Hindustan Lever). Earlier Rs 100 andRs 50 were the typical face values and you will still find shares with these face values,e.g. Dawn Mills has Rs 50 face value and Shri Dinesh Mills has Rs 100 face value pershare.
The face value is the amount on which the dividend is calculated. Thus, a 15 per centdividend on a share with a face value of Rs.10 will pay the share holder Rs.1.5 pershare. This means that any dividend percentage has different meaning in Rupee termsas the face value changes. For example 100% dividend on 1 share of Rs 100 face valuewill get you Rs 100 but the same dividend percentage on 1 share of Rs 1 face valuewould get you only Rs 1.
Authorised and Paid-up Share Capital
Number of shares of stock provided for in the Articles of Association of a company isthe authorized share capital. This figure is usually indicated in the Share Capital sectionof the Balance Sheet.
Paid-up share capital is the capital that has been issued and subscribed by theshareholders. Authorised capital is usually well in excess of the paid-up capital and acompany cannot legally issue more shares than authorized. The number of authorizedshares can be changed only by amendment to the Articles of Association for which aspecial resolution needs to be passed in the Annual General Meeting.
Figure 2.1 shows the Schedule 'A' of the Cosco India balance sheet, which gives usdetails on the authorized and paid-up capital of the company.
Figure 2.1: Authorised and Paid-up Share Capital

53Cost of Capital
The second part in the figure talks about 'Issued & Subscribed Capital'. Issued ShareCapital is that portion of the authorised capital that has been actually offered forsubscription. Subscribed share capital is that portion of issued share capital, which hasactually been subscribed and allotted. Paid-up share capital is that part of the subscribedcapital for which consideration in cash or otherwise has been received. Therefore,subscribed share capital can be less than or equal to the issued share capital. Similarlypaid-up share capital can be less than or equal to subscribed share capital. All thesetypes of share capital also include the bonus shares that have been allotted by theorganisation.
There is another term 'called-up share capital' which you may find in some of thebalance sheets. It refers to that part of the subscribed capital, which shareholders havebeen required or demanded to pay but have not paid as yet. This comes in the casewhere the company has issued partly paid up shares and some shareholders have notpaid the entire amount to make the shares fully paid up.
Book Value
The book value is calculated by adding reserves to the equity capital of the company,multiplied by the face value and divided by the equity capital of the company. Bookvalue tells us how much each share is worth in the books of the company. So if acompany has a face value of Rs.10, equity capital of Rs.10 crores and reserves ofRs.20 crores, then the book value of each Rs.10 share will be:
Book Value = ( . . )
.. .
Rs cr Rs crRs cr
Rs Rs10 20
1010 30
+ × =
The true worth of the share could be very different from the book value so calculatedeven when we are not taking the market price into consideration. Why this is so we willsee later. Book and market values will usually be equal on the day the shares in a newcorporation are issued, but after that only coincidence will ever make them equal at anygiven moment.
Earnings Per Share (EPS)
EPS can be defined as the company's profit allocated to each outstanding equity share.For instance, a company that earned Rs.10 crore last year and has 1 crore sharesoutstanding (with a face value of Rs.10 each) will report a EPS of
EPS = Rs cr
crRs
..
101
10=
The profits that are used to calculate EPS are the profits that are left after payinginterest to debt holders, taxes and dividend on preference shares. EPS is considered tobe a key figure (and also misleading) in evaluating a share's outlook.

Financial Management54
Stock Price Quotations
If you pick up any of the major newspapers (financial or non financial), they carry atleast some of the quotations of the last day's trading on the major stock exchanges, beit National Stock Exchange (NSE), Bombay Stock Exchange (BSE), or any other stockexchange.
The usual format in a financial newspaper is to carry four prices (open, high, low, close)along with volumes of shares traded and number of trades. Price/ Earning Ratio (P/E)and market capitalization is also carried. They also carry the closing share price of theprevious trading day in a bracket before starting with yesterday's prices as also carrythe previous 52 week (one year) high/low prices for that share. The prices mentionedare for one share of the company.
Figure 2.2 shows two samples taken from the Business Standard and The EconomicTimes. See the reporting differences. The Business Standard carries more informationon top 200 companies and different information is carried every day of the week.
Types of Equity Instruments
There are basically two types of equity instruments: equity shares and preference shares.
What we have been discussing till now in equity instruments applies as it is to equityshares. Preference shares are different.
Preference Shares
Sandwiched between debt holders and equity share holders, preference share holdershave the promise of an assured dividend from the company and therefore assume lessrisk than that borne by equity share holders. They do not have any voting rights in thecompany. When a company fails to pay the dividend to them for two years in a row,then these shares get a voting right.
The preference shares are issued by only those companies who are paying a very lowlevel of tax. Why? This is because although the returns desired by the preferenceshare holders is at par with the returns offered by the fixed deposits, the cost to thecompany is after tax in case of preference shares while the interest paid on fixeddeposits is tax deductible.
So a company which is paying 10 per cent dividend on preference shares ends uppaying 11 per cent (including 10 per cent dividend tax). If the company pays no incometax [as in the case of a 100 per cent Export Oriented Unit (EOU)] then this is the costto the company. If the company pays tax at the rate of 35 per cent then the before taxcost shoots above 14 per cent. Compared with a debt cost of 7 to 12 per cent forestablished companies, it is not a viable alternative at all to go in for preference sharesif the tax liabilities are high. Therefore, preference shares would only be issued if thecompany requires a more permanent source of capital.
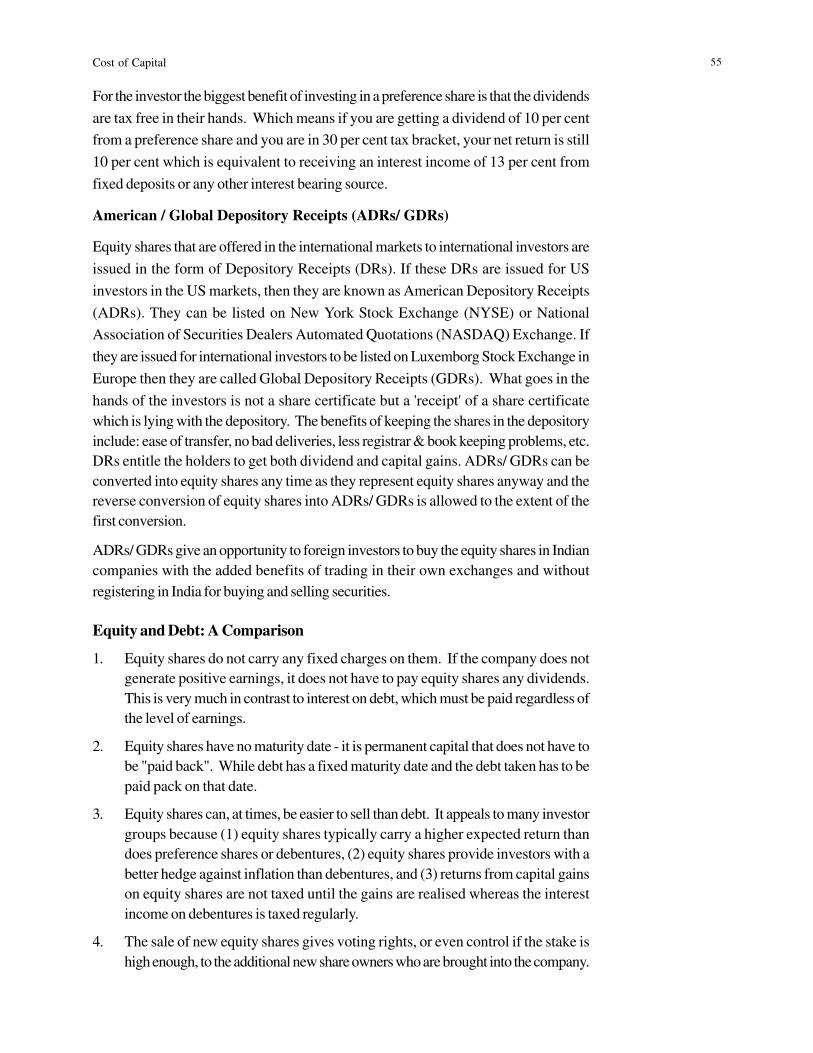
55Cost of Capital
For the investor the biggest benefit of investing in a preference share is that the dividendsare tax free in their hands. Which means if you are getting a dividend of 10 per centfrom a preference share and you are in 30 per cent tax bracket, your net return is still10 per cent which is equivalent to receiving an interest income of 13 per cent fromfixed deposits or any other interest bearing source.
American / Global Depository Receipts (ADRs/ GDRs)
Equity shares that are offered in the international markets to international investors areissued in the form of Depository Receipts (DRs). If these DRs are issued for USinvestors in the US markets, then they are known as American Depository Receipts(ADRs). They can be listed on New York Stock Exchange (NYSE) or NationalAssociation of Securities Dealers Automated Quotations (NASDAQ) Exchange. Ifthey are issued for international investors to be listed on Luxemborg Stock Exchange inEurope then they are called Global Depository Receipts (GDRs). What goes in thehands of the investors is not a share certificate but a 'receipt' of a share certificatewhich is lying with the depository. The benefits of keeping the shares in the depositoryinclude: ease of transfer, no bad deliveries, less registrar & book keeping problems, etc.DRs entitle the holders to get both dividend and capital gains. ADRs/ GDRs can beconverted into equity shares any time as they represent equity shares anyway and thereverse conversion of equity shares into ADRs/ GDRs is allowed to the extent of thefirst conversion.
ADRs/ GDRs give an opportunity to foreign investors to buy the equity shares in Indiancompanies with the added benefits of trading in their own exchanges and withoutregistering in India for buying and selling securities.
Equity and Debt: A Comparison
1. Equity shares do not carry any fixed charges on them. If the company does notgenerate positive earnings, it does not have to pay equity shares any dividends.This is very much in contrast to interest on debt, which must be paid regardless ofthe level of earnings.
2. Equity shares have no maturity date - it is permanent capital that does not have tobe "paid back". While debt has a fixed maturity date and the debt taken has to bepaid pack on that date.
3. Equity shares can, at times, be easier to sell than debt. It appeals to many investorgroups because (1) equity shares typically carry a higher expected return thandoes preference shares or debentures, (2) equity shares provide investors with abetter hedge against inflation than debentures, and (3) returns from capital gainson equity shares are not taxed until the gains are realised whereas the interestincome on debentures is taxed regularly.
4. The sale of new equity shares gives voting rights, or even control if the stake ishigh enough, to the additional new share owners who are brought into the company.

Financial Management56
While the debt and preference share owners do not have any voting rights (exceptin special conditions). For this reason, debt is preferred over additional equityfinancing. Equity financing is often avoided by small companies, whose ownermanagers are not willing to share control.
5. The use of debt enables the firm to acquire funds at a fixed cost, whereas theuse of equity shares means that more shareholders will share in the firm's netprofits.
6. The costs of underwriting and selling equity shares are usually higher than thecosts of underwriting and selling preferred shares or debt, which puts additionalburden on the companies raising resources. But the life and permanency ofthe equity shares more than compensates for the additional expenses in initialfloatation.
Share Capital
Figure 2.2 shows the Schedule 'A' of the Cosco India balance sheet.
Figure 2.2: Share Capital
The first heading is 'Authorised', which means authorised share capital. Authorisedshare capital is the total amount of shares that a company is authorised to sell.'Memorandum and Articles of Association' of the company provides the informationabout the number of shares that the company is authorised to sell and their par value.Par Value is the value per share established at the time of authorisation. Par value ofthe share establishes the minimum legal capital for the company and the shareholdermust invest assets equal to that amount (whether in cash or by transferring the assetsto the company). Par value multiplied by the number of authorised shares form theauthorised capital.
Cosco India Ltd is authorised to sell 10,000,000 equity shares (10 million or 1 croreshares) of Rs 10 each. Here the par value is Rs 10 per share and the total number ofshares that the company can sell is 1 crore. Therefore the total authorised capital is Rs10 crore.
The authorised capital is not fixed forever and can be changed depending upon therequirements. To change the authorised capital, first the company has to take permission
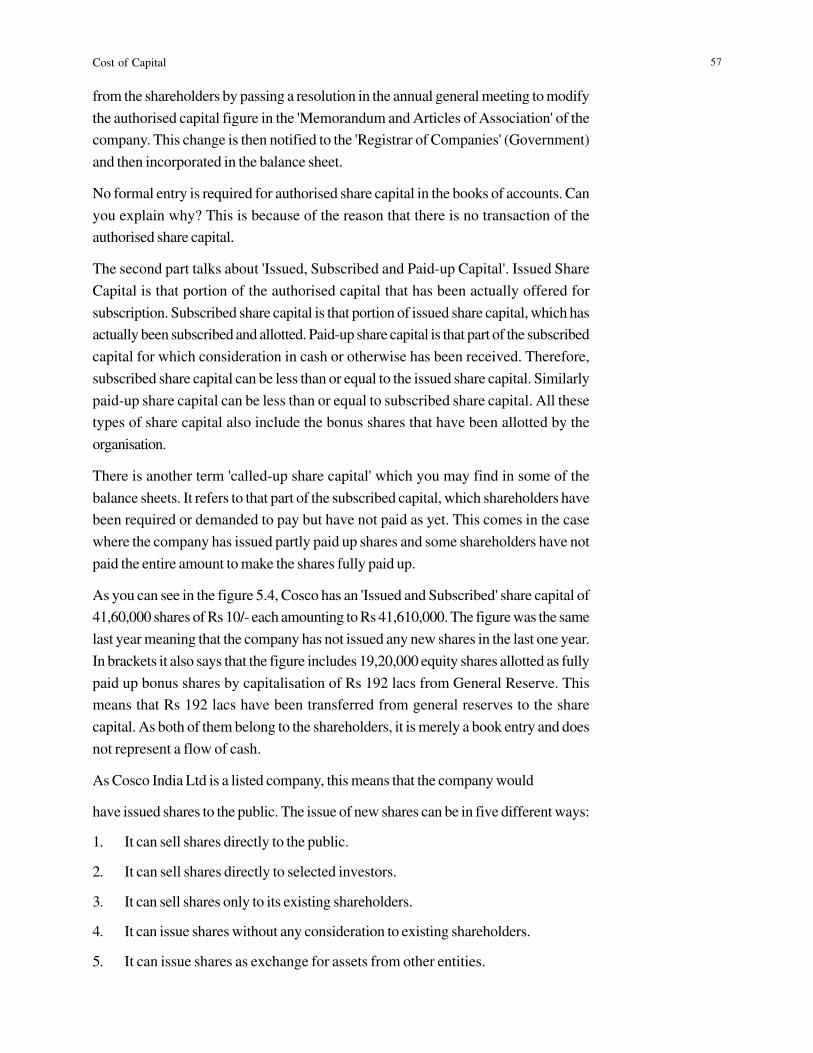
57Cost of Capital
from the shareholders by passing a resolution in the annual general meeting to modifythe authorised capital figure in the 'Memorandum and Articles of Association' of thecompany. This change is then notified to the 'Registrar of Companies' (Government)and then incorporated in the balance sheet.
No formal entry is required for authorised share capital in the books of accounts. Canyou explain why? This is because of the reason that there is no transaction of theauthorised share capital.
The second part talks about 'Issued, Subscribed and Paid-up Capital'. Issued ShareCapital is that portion of the authorised capital that has been actually offered forsubscription. Subscribed share capital is that portion of issued share capital, which hasactually been subscribed and allotted. Paid-up share capital is that part of the subscribedcapital for which consideration in cash or otherwise has been received. Therefore,subscribed share capital can be less than or equal to the issued share capital. Similarlypaid-up share capital can be less than or equal to subscribed share capital. All thesetypes of share capital also include the bonus shares that have been allotted by theorganisation.
There is another term 'called-up share capital' which you may find in some of thebalance sheets. It refers to that part of the subscribed capital, which shareholders havebeen required or demanded to pay but have not paid as yet. This comes in the casewhere the company has issued partly paid up shares and some shareholders have notpaid the entire amount to make the shares fully paid up.
As you can see in the figure 5.4, Cosco has an 'Issued and Subscribed' share capital of41,60,000 shares of Rs 10/- each amounting to Rs 41,610,000. The figure was the samelast year meaning that the company has not issued any new shares in the last one year.In brackets it also says that the figure includes 19,20,000 equity shares allotted as fullypaid up bonus shares by capitalisation of Rs 192 lacs from General Reserve. Thismeans that Rs 192 lacs have been transferred from general reserves to the sharecapital. As both of them belong to the shareholders, it is merely a book entry and doesnot represent a flow of cash.
As Cosco India Ltd is a listed company, this means that the company would
have issued shares to the public. The issue of new shares can be in five different ways:
1. It can sell shares directly to the public.
2. It can sell shares directly to selected investors.
3. It can sell shares only to its existing shareholders.
4. It can issue shares without any consideration to existing shareholders.
5. It can issue shares as exchange for assets from other entities.
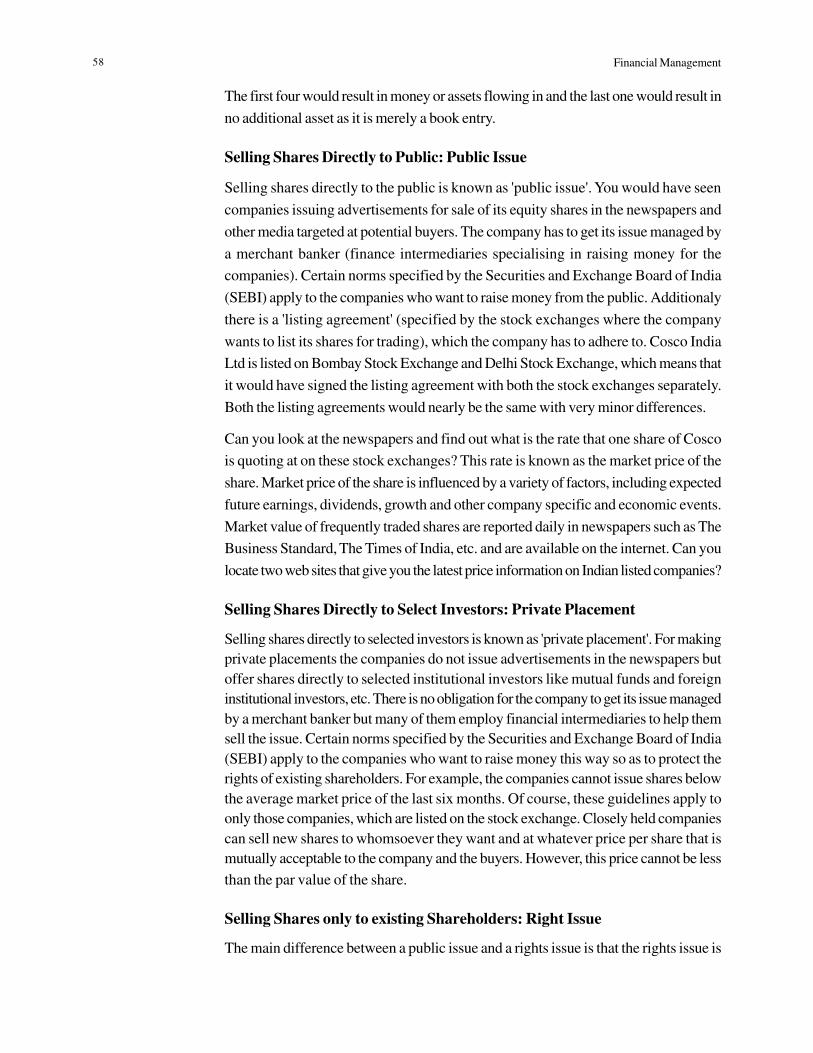
Financial Management58
The first four would result in money or assets flowing in and the last one would result inno additional asset as it is merely a book entry.
Selling Shares Directly to Public: Public Issue
Selling shares directly to the public is known as 'public issue'. You would have seencompanies issuing advertisements for sale of its equity shares in the newspapers andother media targeted at potential buyers. The company has to get its issue managed bya merchant banker (finance intermediaries specialising in raising money for thecompanies). Certain norms specified by the Securities and Exchange Board of India(SEBI) apply to the companies who want to raise money from the public. Additionalythere is a 'listing agreement' (specified by the stock exchanges where the companywants to list its shares for trading), which the company has to adhere to. Cosco IndiaLtd is listed on Bombay Stock Exchange and Delhi Stock Exchange, which means thatit would have signed the listing agreement with both the stock exchanges separately.Both the listing agreements would nearly be the same with very minor differences.
Can you look at the newspapers and find out what is the rate that one share of Coscois quoting at on these stock exchanges? This rate is known as the market price of theshare. Market price of the share is influenced by a variety of factors, including expectedfuture earnings, dividends, growth and other company specific and economic events.Market value of frequently traded shares are reported daily in newspapers such as TheBusiness Standard, The Times of India, etc. and are available on the internet. Can youlocate two web sites that give you the latest price information on Indian listed companies?
Selling Shares Directly to Select Investors: Private Placement
Selling shares directly to selected investors is known as 'private placement'. For makingprivate placements the companies do not issue advertisements in the newspapers butoffer shares directly to selected institutional investors like mutual funds and foreigninstitutional investors, etc. There is no obligation for the company to get its issue managedby a merchant banker but many of them employ financial intermediaries to help themsell the issue. Certain norms specified by the Securities and Exchange Board of India(SEBI) apply to the companies who want to raise money this way so as to protect therights of existing shareholders. For example, the companies cannot issue shares belowthe average market price of the last six months. Of course, these guidelines apply toonly those companies, which are listed on the stock exchange. Closely held companiescan sell new shares to whomsoever they want and at whatever price per share that ismutually acceptable to the company and the buyers. However, this price cannot be lessthan the par value of the share.
Selling Shares only to existing Shareholders: Right Issue
The main difference between a public issue and a rights issue is that the rights issue is

59Cost of Capital
only meant for the existing shareholders of the company. This means that the generalpublic cannot subscribe to the issue. The right issue is made to shareholders in a ratio oftheir existing holdings. This means that if the shareholder holds 100 shares andthe company want to offer right shares in the ratio of 1:1, the shareholder will get aright to subscribe to 100 shares. The shareholder can waive his right to subscribeto these shares and can pass it on or sell it to any other person who is interestedin buying it.
Issuing shares without any consideration to existing shareholders: BonusIssue
The first three types discussed issues that raise money. A company can also issue newshares without any consideration to its existing shareholders. This type of an issue iscalled 'bonus issue.' As in the rights issue, the company offers additional shares to itsexisting shareholders in a particular ratio of their existing shareholding. How can it dothat when the company has a value attached to each share? The company transfer themoney from reserves & surplus (a part of shareholder's money) to share capital, inother words, simply a book entry where the total funds available to the company doesnot change. The money for the bonus issue of shares comes from 'Reserves & Surplus',which means that the total shareholders funds remain constant.
Issuing shares as exchange for assets from other entities
When a company takes over the assets of another company or merges that companywith it, it usually issues shares instead of paying the other company or its shareholders.The consideration paid for acquisition is usually more than the book value of the assetstransferred (Can you explain why?). It could be due to the fact the goodwill of theassets of the company is also transferred or it could be because of the fact that theassets are in working condition and add significantly add to the value of the company.There are several methods of valuation of the future benefits that accrue from theassets, but these are outside of the purview of this book. These methods are discussedin detail in any good valuation book.
Issuing Shares at Par or at Premium
The consideration that the company gets by selling its shares does not necessarily haveto be the face value (par value) per share. The company can issue shares 'at par' or 'atpremium'. At par means that the company will charge only the par value for everyshare issued. This means that if Cosco issues shares at par, what will be the amount itwill get per share? (Ans: Rs 10). At premium means that the company can charge anamount per share which is more than the par value per share. This additional amount iscalled the share premium and is shown as a separate head in the 'Reserves & Surplus'category.

Financial Management60
Reserves & Surplus
General Reserves is the name given to the aggregate amount of corporate earning thathas been reinvested in the business. There is another reserve called share premiumreserve, which represents the premium charged when the company issued shares.The third is the surplus that comes from the profit and loss account. All thesetogether constitute 'Reserves and Surplus'. The reserve and surplus as a whole increaseseach year by the net income that is retained in the company and decreases bylosses.
You should note that the reserves and surplus does not mean cash. In fact, the companycan have large reserves and surplus position and be without cash or it can have a lot ofcash and a very small reserves and surplus balance. Although both cash and reserves& surplus usually increase when a company earns, the amount by which each oneincreases is usually different. Two reasons can be attributed for this difference.
1. The net profit of the company is calculated on accrual basis and not on a cashbasis. Therefore, reserves & surplus would show increase on an accrual basis asagainst cash, which will only show increase if there is real inflow of cash.
2. The cash generated from the net profit can be invested in assets, can be used topay off loans or spend in any number of ways, both of which would not affect netincome or reserves and surplus. For example, if a Managing Director buys aMercedes car for himself on company's account, he is basically making an expensethat would not be reflected in the net income or reserves and surplus but would bereflected in the cash position of the company.
To summarise cash is an asset and retained earning is one of the sources of financing(along with share issues and loans) that a company can use for its businesspurposes.
In the figure 2.3 below, you can see the reserves and surplus figures of Cosco.
Figure 2.3: Reserves & Surplus
There are three items that you can notice in the figure. Let us discuss each one of themone by one. The share premium account shows a balance of Rs 31,230,000 which isunchanged from the last year closing balance. This means that company did not issue

61Cost of Capital
any new shares in the last one year. It also means that the company would have issuedshares at a premium somewhere in the past. When these shares were issued cannot beinterpreted from the information given and no other information on that is available inthis annual report. Searching information from other resources, we come to know thata company had issued shares at a premium of Rs 30 per share. Can you calculate, howmany new shares has the company issued? Simple calculations would tell you that thecompany issued 1,041,000 shares (31,230,000 divided by 30).
Coming to the second item, we see the general reserve has an addition of Rs.7,921,724in the last year's figure to bring the total to Rs.72,699,057. Now this addition has comeagain from the same head appropriations in the profit and loss account where it says'transfer to general reserve' and the same figure is mentioned. There was a differentamount transferred to the balance sheet last year. There is no stipulation that a particularamount should be transferred, it only depends on the company's requirements. Why didit not transfer more money can be traced to the fact that profits have been lower thisyear as compared to last year.
The third item shows the profit and loss account heading. But most of the companiesreport it under the heading 'Reserves & Surplus' as it belongs to the shareholders. Herealso the figure has remained unchanged from the last year. This means that the nextprofit was appropriated fully and no extra surplus from the profit and loss account wascarried to the balance sheet this time. If you look at the profit and loss account inAnnexure I, you see an item in appropriations at the end of the profit and loss accountwhich says balance carried to balance sheet. This confirms that no profit was carriedto balance sheet from profit and loss account this year. For the last year, it shows thefigure of Rs.3,500,000/- which would now be a part of the figure of 8,500,000 that isshown now.
At the end of reserves & surplus, where it shows previous year figures, the additionswork out to Rs 14,980,907 which is exactly the sum that you get when you add the twoamounts that were transferred last year to the balance sheet under their respectiveheads.
A stocks rate of return
In case of shares the first component is "Dt" which is nothing but the income in cashfrom dividends and the second component is the price change (appreciation anddepreciation).
ni)1(Share theof Value Future Expected
i)(1Amount Dividend
Share a of ValuePresent n
1tt +
++
=�=
This means that the price you are willing to pay for a share today is a function of thedividends that you expect to receive and the present value of the expected future shareprice.

Financial Management62
But what if you are going to hold the share to maturity and not sell. Then your onlyreturn is the dividend amount. This means that this perpetual dividend is what youwould use to value the share. So you simply use the perpetuity formulas mentionedabove for constant or growing dividends.
Finding out the present value of the share seems easy-Doesn't it! Now comes thetedious question, what return do you expect from the security? Now every security hasa different risk profile and you being a rational human being would expect a return thatis commensurate with the risk that you are going to bear. So let us devote some time tounderstand the nature of risk and then how do we use this knowledge to reach thedesired rate of return on the share.
Risk
Risk and return go hand in hand in investments and finance. One cannot talk aboutreturns without talking about risk, because, investment decisions always involve a trade- off between risk and return. Risk can be defined as the chance that the actual outcomefrom an investment will differ from the expected return. This means that, the morevariable the possible outcomes that can occur (i.e. the broader the range of possibleoutcomes), the greater the risk.
Risk and Expected Rate of Return
The width of a probability distribution of rates of return is a measure of risk. The widerthe probability distribution, the greater the risk or the greater the variability of return orgreater the variance. An investor cannot expect greater returns without being willing toassume greater risks.
Sources of Risk
l Interest Rate Risk. It is the variability in a security's return from changes in thelevel of interest rates.
l Market Risk. Market risk refers to the variability of returns due to fluctuationsin the securities market.
l Inflation Risk. With rise in inflation there is reduction of purchasing power, hencethis is also referred to as purchasing power risk and affects all securities.
l Business Risk. This refers to the risk of doing business in a particular industryor environment and it gets transferred to the investors who invest in the businessor company. It may be caused by a variety of factors like heightened competition,emergence of new technologies, development of substitute products, shifts inconsumer preferences, etc.
l Financial Risk. Financial risk arises when companies resort to financial leverageor the use of debt financing. The more the company resorts to debt financing, the

63Cost of Capital
greater is the financial risk as it creates fixed interest payments due to debt orfixed dividend payments on preference stock thereby causing the amount of residualearnings available for common stock dividends to be more variable than if nointerest payments were required. It is avoidable to the extent that managementhave the freedom to decide to borrow or not to borrow funds.
l Liquidity Risk. This risk is associated with the secondary market which theparticular security is traded in. A security which can be bought or sold quicklywithout significant price concession is considered liquid. The greater the uncertaintyabout the true element and the price concession , the greater the liquidity risk.Securities that have ready markets like treasury bills have lesser liquidity risk.
Measurement of Total Risk
Risk is associated with the dispersion in the likely outcomes. Dispersion refers tovariability. If an asset's return has no variability, it has no risk. An investor analysing aseries of returns on an investment over a period of years needs to know somethingabout the variability of its returns or in other words the asset's total risk.
There are different ways to measure variability of returns. The range from the highestpossible to lowest possible rate of return is one measure, but the range is based only ontwo extreme values.
A more popular way of measuring variability of returns is standard deviation. Thestandard deviation is simply the square root of the variance of the rates of return.
[ ]�=
−=n
iii kkP
1
2)(σ
where, s = standard deviation
Pi = probability associated with the ith possible outcome
ki = rate of return from the ith possible outcome
k = expected rate of return
n = number of outcomes
Portfolios and Risk
An investment portfolio refers to the group of assets that is owned by an investor.When an investor invests all his funds in a single security, it is more in the nature ofspeculation than of an investment, because the returns to the investor are based on thefuture of the single asset, making it a very risky proposition. Generally, in order toreduce risk, investors hold on to a diversified portfolio which might contain equity capital,

Financial Management64
� ����������� ��������������������� �
� � � � �
� � � � ������������ ����������������������������
� ����������������
� � � � ���������������
���������������������������������������������������������������������������������������������������
� � � � ���� ��������������
� � � � � �����
� � � � �
� � � � ������������������� ���������������
bonds, real estate, savings accounts and various other assets. In other words, the investordoes not put all his eggs into one basket.
Diversifiable and Non-diversifiable Risk
The fact that returns on stocks do not move in perfect tandem means that risk can bereduced by diversification. But the fact that there is some positive correlation meansthat in practice risk can never be reduced to zero. So there is a limit on the amount ofrisk that can be reduced through diversification. The lower the degree of positivecorrelation, the greater is the amount of risk reduction that is possible.
The amount of risk reduction achieved by diversification also depends on the number ofstocks in the portfolio. As the number of stocks in the portfolio increases, the diversifyingeffect of each additional stock diminishes.
As you can see that the major benefits of diversification are obtained with the first 10to 12 stocks, provided they are drawn from industries that are not closely related.Increases beyond this point continue to reduce the total risk but the benefits are marginal.
It is also apparent that it is the diversifiable risk that is being reduced unlike the non-diversifiable risk which remains constant whatever your portfolio is.

65Cost of Capital
Nondiversifiable risk is that part of total risk (from various sources like interest raterisk, inflation risk, financial risk, etc.) that is related to the general economy or the stockmarket as a whole and hence cannot be eliminated by diversification. Nondiversifiablerisk is also referred to as market risk or systematic risk.
Diversifiable risk on the other hand, is that part of total risk that is marginal to thecompany or industry and hence can be reduced by diversification. Diversifiable risk isalso called unsystematic risk or specific risk.
Risk of Stocks in a Portfolio
A portfolio's standard deviation is a good indicator of the risk of a portfolio, to the extentthat if adding a stock to the portfolio increases the portfolio's standard deviation, thestock adds risk to the portfolio. But the risk that a stock adds to a portfolio will dependnot only on the stock's total risk, its standard deviation , but on how that risk breaksdown into diversifiable and nondiversifiable risk. If an investor holds only one stock ,there is no question of diversification, and this risk is therefore the standard deviation ofthe stock. For a diversified investor , the risk of a stock is only that portion of total riskthat cannot be diversified or its nondiversifiable risk. The nondiversifiable risk is generallymeasured by Beta coefficient. Beta measures the relative risk associated with anyindividual portfolio as measured in relation to the risk of market portfolio. The marketportfolio represents the most diversified portfolio of risky assets an investor could buysince it includes all risky assets.
The relative risk can be expressed as:
portfoliomarket ofrisk potfolioor asset ofrisk blediversifia-Non
=β
Thus, the Beta coefficient is a measure of the non-diversifiable or systematic risk of anasset relative to that of the market portfolio.
l A Beta of 1.0 indicates an asset of average risk.
l A Beta coefficient greater than 1.0 indicates above-average risk - stocks whosereturns tend to be more risky than the market.
l A Beta coefficient less than 1.0 indicates below-average risk, i.e., less riskierthan market portfolio.
In case of market portfolio all the diversification possible has been done-thus the risk ofmarket is all non-diversifiable which an investor cannot avoid. Similarly, as long as theasset's returns are not perfectly positively with returns from other assets, there will besome way to diversify away its unsystematic risk. As a result beta depends only onnon-diversifiable risks.
The beta of a portfolio is nothing but the weighted average of betas of the securities

Financial Management66
that constitute the portfolio, the weights being the proportions of investments in respectivesecurities.
Measurement of Beta
The systematic relationship between the return on the security or a portfolio and thereturn on the market can be described using a simple linear regression, identifying thereturn on a security or portfolio as the dependent variable Kj and the return on marketportfolio as the independent variable Km, in the single-index model or market modeldeveloped by William Sharpe.
This can be expressed as:
jmjjj eKK +β+α=
The Beta parameter bj in the model represents the slope of the above regressionrelationship and measures the responsiveness of the security or portfolio to the generalmarket and indicates how extensively the return of the portfolio or security will varywith changes in the market return. The Beta coefficient of a security is defined as theratio of the security's covariance of return with the market to the variance of themarket. This can be calculated as follows:
)(K Var
)KK( Cov
m
mjj =β
The Alpha parameter "a" is the intercept of the fitted line and indicates what the returnof the security or portfolio will be when the market return is zero. For example, asecurity with an a of +2 per cent would earn 2 percent even when the market returnwas zero and would earn an additional 2 percent at all levels of market return. Theconverse is true if a security has a of -2 percent. The positive a thus represents a sortof bonus return and would be a highly desirable aspect of a portfolio or security while anegative a represents a penalty to the investor.
The third term ej is the unexpected return resulting from influences not identified bythe model. Frequently referred to as random or residual return, it may take on any valuebut is generally found to average out to zero.
The Capital Asset Pricing Model (CAPM)
The CAPM developed by William F Sharpe, John Linter and Jan Mossin is one of themajor developments in financial theory. The CAPM establishes a linear relationshipbetween the required rate of return of a security and its systematic or undiversifiablerisk or beta.
This relationship as defined by CAPM can be used to value an equity share.

67Cost of Capital
Mathematically the relationship between the share's return and the market return canbe depicted by the following formula:
Here
Rs stands for return expected on the security,
Rf stands for risk-free return,
Rm stands for return from the market portfolio and
β stands for beta.
This relationship means that if the market goes up by 10 % and the security price alsogoes up by 10 %, and vice versa, the beta is said to be 1.00, i.e., there is a perfectcorrelation between return from the security and return from the market. If the beta is2.00 the security price would up or down by twice the %age of change of the market.If the beta is 0.00 then no correlation exists between the market movement and thesecurity price movement.
It is easy to see that the required return for a given security increases with increases inits beta.
Assumptions
The CAPM is based on a list of critical assumptions, some of which are as follows :
l Investors are risk-averse and use the expected rate of return and standard deviationof return as appropriate measures of risk and return for their portfolio. In otherwords, the greater the perceived risk of a portfolio, the risk-averse investor expectsa higher return to compensate the risk.
l Investors make their investment decisions based on a single-period horizon, i.e.,the next immediate time period.
l Transaction costs in financial markets are low enough to ignore and assets can bebought and sold in any unit desired. The investor is limited only by his wealth andthe price of the asset.
l Taxes do not affect the choice of buying assets.
l All individuals assume that they can buy assets at the going market price and theyall agree on the nature of the return and risk associated with each investment.
In the CAPM, the expected rate of return can also be thought of as a required rate ofreturn because the market is assumed to be in equilibrium. The expected return is thereturn from an asset that investors anticipate or expect to earn over some future period.The required rate of return for a security is defined as the minimum expected rate ofreturn needed to induce an investor to purchase it.
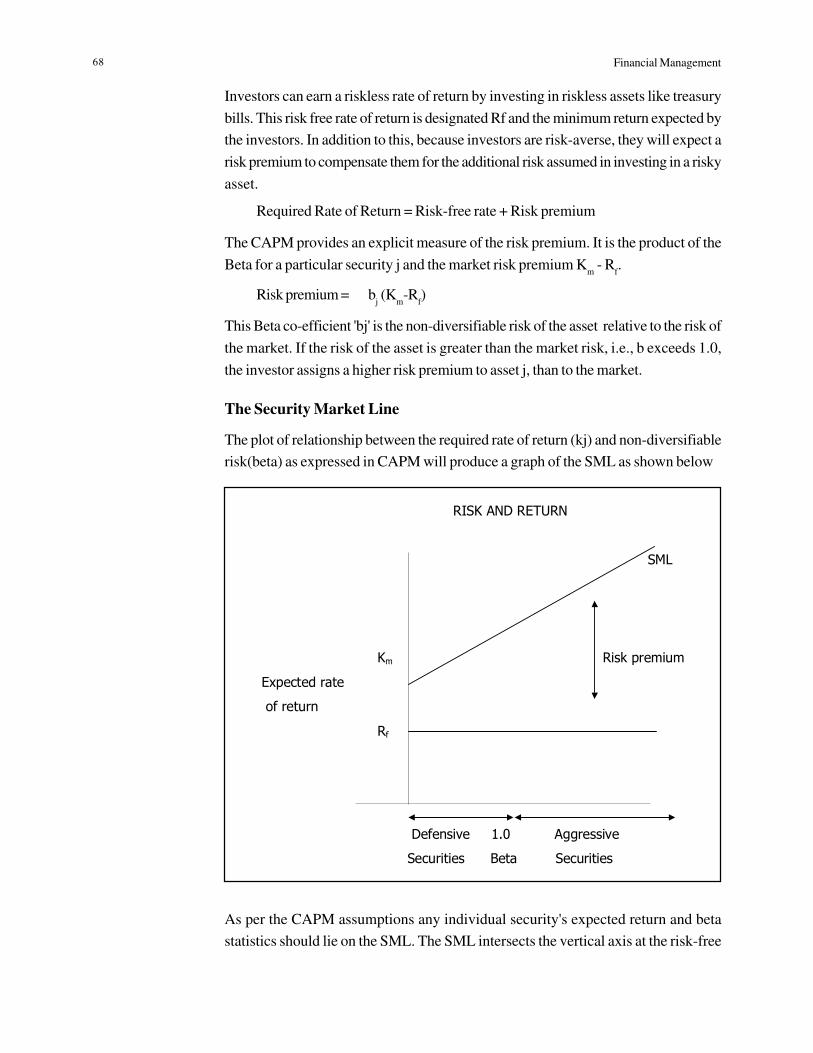
Financial Management68
����������������
�
�� � � � � � � � � �� !�
�
�
�
��������� � � ���������������������������������������������������������������������������������������������
�����"����������������������������������������
������������ �
������ � � ���
�
�
�
� ���� � ������������ ���������#$%�� �����������
� ������ � ���������������������&���������������������
�
Investors can earn a riskless rate of return by investing in riskless assets like treasurybills. This risk free rate of return is designated Rf and the minimum return expected bythe investors. In addition to this, because investors are risk-averse, they will expect arisk premium to compensate them for the additional risk assumed in investing in a riskyasset.
Required Rate of Return = Risk-free rate + Risk premium
The CAPM provides an explicit measure of the risk premium. It is the product of theBeta for a particular security j and the market risk premium Km - Rf.
Risk premium = bj (Km-Rf)
This Beta co-efficient 'bj' is the non-diversifiable risk of the asset relative to the risk ofthe market. If the risk of the asset is greater than the market risk, i.e., b exceeds 1.0,the investor assigns a higher risk premium to asset j, than to the market.
The Security Market Line
The plot of relationship between the required rate of return (kj) and non-diversifiablerisk(beta) as expressed in CAPM will produce a graph of the SML as shown below
As per the CAPM assumptions any individual security's expected return and betastatistics should lie on the SML. The SML intersects the vertical axis at the risk-free

69Cost of Capital
rate of return Rf and km - Rf is the slope of the SML. Since all securities are expectedto plot along the SML, the line provides a direct and convenient way of determining theexpected/required return of a security if we know the Beta of the securities. The SMLcan also be used to classify securities. Those with betas greater than 1.00 and plottingon the upper part of the SML are classified as aggressive securities while those withbetas less than 1.00 and plotting on the lower part of the SML can be classified asdefensive securities which earn below-average returns.
Asset pricing implications of the SML
One of the major assumptions of the CAPM is that the market is in equilibrium and thatthe expected rate of return is equal to the required rate of return for a given level ofmarket risk or beta. In other words, the SML provides a framework for evaluatingwhether high-risk stocks are offering returns more or less in proportion to their risk andvice versa.
Once a security's expected rate of return and beta have been computed they may beplotted with reference to the SML. If the security's required rate of return , the securitymay be over or under priced and may fall below or above the SML.
X
From the figure we see that Rf = 6% and km = 12%.
Two securities X and Y have been shown in the figure. Both X and Y should have beenon the SML but obviously are not. Taking the case of X first, the expected rate ofreturn from X is around 25%. But at a beta of around 1.2, using the SML we see thatthe required rate of return need be only around 13%. This tells us that security X isundervalued or priced too low because its average rate of return is inappropriately highfor the level of risk it bears.
�
� � � � � ����� � � � � �
� � � � ����� � � '�
� ()� � � � � � � � �� !�
� � � � � � ����
� �
����� ���#(����� � � � � �����
����� � � � � � � � � � �
���� �� � � � � ����*� �
� ������+�
�
�
� � � � � � � � � ����&�����
� � � � ����������#$%����#$(��������#$,�
�

Financial Management70
On the other hand, Security Y with a beta of around 1.7 requires a rate of return ofaround 16% but its expected return is only about 7%. This tells us that the asset isovervalued or overpriced and hence unattractive because it is expected to produce areturn lower than stocks with similar betas. These two assets should move toward theirequilibrium - required return positions on the SML (i.e., expected rate of return shouldbe equal to required rate of return and correspond to their respective betas).
To reach equilibrium and their required rate of return positions on the SML both stockshave to go through a temporary price adjustment. In order to reach equilibrium, assumingbetas remain the same, the expected return of X has to be brought down to be equal tothe required rate of return and be plotted on the SML. To accomplish this, the purchaseprice has to be sufficiently increased. Similarly, for security Y, the purchase price has tobe sufficiently reduced so that the expected return rises to be the same level as therequired rate of return.
In practice, investors will be interested in purchasing security X because it offers morethan proportionate returns in comparison to the risk. This demand will push up the priceof X as more of it is purchased and correspondingly bring down the returns. Thisprocess will continue till it reaches the equilibrium price and the expected returns arethe same as the required returns.
In the case of security Y, investors will be tempted to sell as it offers less than therequired rate of return. This increase in the supply of Y will drive down its price andcorrespondingly increase the return until the expected return rises enough to reach theSML and the security is once again in equilibrium.
Thus, the CAPM provides many useful insights for the finance manager to maximisethe value of the firm. It shows the type of risk for which shareholders requirecompensation in the form of higher risk premium, and hence higher returns. Becausefinance managers also perform the investment function on behalf of shareholders, theymust keep sight of the returns shareholders expect for taking risks.
Now let us look at another part of the investment decision, i.e., what cash flows toinclude and what cash flows to exclude.
Cash Flow
In considering investment decisions, it does not matter whether outlays are
termed 'capital' or 'revenue' nor whether inflows are turned 'profit', 'depreciation', 'taxallowance', or whatever. All outlays and income must be taken into account.
Cash flows in this context is not the same as the cash flow through a bank account, noris it identical to accounting profit, since changes in the later can occur without anychange taking place in the cash flow.

71Cost of Capital
For purposes of investment appraisal, the cash flow is the incremental cash
receipts less the incremental expenditures solely attributable to the investment in question.
The future costs and revenues associated with each investment alternative are:
1. Capital costs: These cover (a) the long-term capital outlays necessary to financea project, and (b) working capital. Typically additional working capital will berequired to cover a higher inventory, or a larger number of debtors, and to beworth while the project must earn a turn on this capital as well as on the long-termcapital.
2. Operating costs: Running costs of the operations that are required to generateincome. These include both the variable and the fixed costs.
3. Revenue: Realisations from the sale of goods produced as well as other incomewhich is not directly attributable to operations but contributes to the profitability ofthe operations.
4. Depreciation: In the case of the discounting methods of appraisal, the recoveryof capital is automatically allowed for from the net cash flow, so depreciationneed not be included as an accounting provision. This has the important advantagethat the discounting profitability assessment is not affected by the pattern ofaccounting depreciation chosen.
5. Residual value: As with working capital, the residual assets of the project mayhave a value. This residual value should be included with the net cash flow.
An investment decision implies the choice of an objective, a technique or appraisal, andlength of service-the project's life. The objective and technique must be related todefinite period of time.
No matter how good a company's maintenance policy, its technological forecastingability, or its demand forecasting ability, uncertainty will always be present because ofthe difficulty of predicting the length of project's life.
The actual assessment of a project's profitability is a team exercise in which the expertiseof economist, the market researcher, the engineer, and the controller must all be broughttogether. The outcome of their collaboration will be a forecast of the cash flow over aperiod of yeaRs If this period is incorrectly estimated, the whole analysis will be wrongor at least grossly inaccurate.
As a rule, in investment appraisal, one of two assumptions is adopted-either the cashflow is assumed to be known with certainty, or the best estimate is used. The assumptionof certainty is generally unacceptable, so allowance must be made for the risk inherentin the proposed adoption of the 'best' estimate. To the expected outcome, probabilitiescan be attached to sales, costs, and other elements of the investment proposal to allowfor risk.

Financial Management72
The application of risk analysis enables management to answer the following questions:(1) What is the profitability resulting from given estimates of costs and revenues fromthe project, if they are achieved? and (2) What is the likelihood of such estimates beingachieved?
This then enables top management to concentrate on those factors that are critical tothe financial success of the project, such as selling price, sales volume, capital cost, andso forth.
Measuring cash flows is not a very tedious job if they exist, but always remember youare talking about future projections in these cash flows and projections are perceptionsthat change with each person.
The Weighted Average Cost of Capital
Assumptions of the cost of capital model
A. Constant business risk: We assume that any investment being considered willnot significantly change the firm's business risk. Therefore the overall cost ofcapital would not change with the changing nature of investments in differentmarkets.
B. Constant financial risk: Management is assumed to use the same financial mixas it used in the past with the same combination of debt and equity.
C. Constant dividend policy:
1. For ease of computation, it is generally assumed that the firm's dividends areincreasing at a constant annual growth rate. Also, this growth is assumed tobe a function of the firm's earning capabilities and not merely the result ofpaying out a larger percentage of the company's earnings.
2. We also implicitly assume that the dividend payout ratio (dividend/net income)is constant.
Computing the weighted cost of capital
A firm's weighted cost of capital is a function of (l) the individual costs of capital, (2)the capital structure mix, and (3) the level of financing necessary to make the investment.The individual costs of capital helps in deciding the weigtage that has to be given to thedifferent modes of financing. The capital structure mix decides level of the debt thatthe company would take up. The level of financing helps in working out the amount thatthe company could shell out of its own and deciding whether and how much to financefrom outside sources.

73Cost of Capital
Determining individual costs of capital
a) Cost of Debt: As we discussed in the last chapter the before-tax cost of debt isfound by trial-and-error by solving for kd in
PV = ( ) ( )nd
n
tt
d
t
k
incipal
k
InterestPV
++��
��
�
+=�
= 1
Pr
110
where PV = the market price of the debt, less flotation costs,
Interestt = the annual interest paid to the investor each year,
Principal = the maturity value of the debt
kd = before-tax cost of the debt (before-tax required rate ofreturn on debt)
n = the number of years to maturity.
The after-tax cost of debt equals = kd(1 - T).
b) Cost of preference share (required rate of return on preference share), kps,equals the dividend yield based upon the net price (market price less flotationcosts) or
kps = pricenetdividend
= oNP
D
c) Cost of equity share: There are three measurement techniques to obtain therequired rate of return on equity shares as discussed in the last chapter. The firstis the perpetuity growth model, also known as the dividend growth model. Avariation on the same is to look at the floatation of a new equity share and includethe floatation costs when determining the cost of capital. The second one is theCAPM model. The third one derives its value from the value of the debt of thecompany.
i) Dividend growth model
a. Cost of internally generated common equity, ks
ks = pricemarket 1r yeain dividend
+ ��
���
dividendsin growth annual
ks = oP
D1+ g
b. Cost of new equity share, kns
kns = oNP
D1+ g
Financial Management74
where NPo = the market price of the equity share less flotation costs incurredin issuing new shares.
ii) Capital asset pricing model: As discussed in the last chapter the expected costof equity share is dependent on the risk profile of the share versus the market asa whole.
ks = kf + b(km - kf)
where ks = the cost of equity share
kf = the risk-free rate
b = beta, measure of the stock's systematic risk
km = the expected rate of return on the market
iii) Risk-Premium Approach: All these models are very useful for companies thathave their shares listed in the market or about to get them listed. What about thecompanies that are privately owned. The best way to do it for these companies isto find the general risk premium and take the company specific cost of debt(which is supposed to include the risk premium of the company) and then add thetwo to find out the equity cost of the company.
ks = kd + RPs
where ks = cost of equity share
kd = cost of debt
RPs = risk-premium of equity share
2. Determining capital structure mix
3. The individual costs of capital will be different for each source of capital in thefirm's capital structure. If the company uses debt to the level of fifty percent ofits investment, then the cost of debt should get 50% weightage in the capitalstructure.
To use the cost of capital in investment analyses, we must compute a weighted oroverall cost of capital.
3. Level of financing and the weighted average cost of capital
The weighted marginal cost of capital specifies the composite cost for eachadditional rupee of financing. The firm should continue to invest up to the pointwhere the marginal internal rate of return earned on a new investment (IRR)equals the marginal cost of new capital.
Effect of additional financing on the cost of capital would be threefold.

75Cost of Capital
a. Issuing new equity share will increase the firm's weighted cost of capitalbecause external equity capital has a higher cost than internally generatedcommon equity.
b. As we use additional debt and preference shares, their cost may increase,which will result in an increase in the weighted cost of capital.
c. The increase in the firm's weighted marginal cost of capital curve will occurat the total rupee financing level when all the cheaper funding will be consumedby the firm's investments, given the targeted debt- equity ratio. The increasein the weighted cost of capital will occur when the total financing from allsources equals:
Procedure for determining the weighted marginal cost of capital curve is given belowfor ready reference.
1. Determine financial mix to be used.
2. Calculate the level of total financing at which the cost of equity capital increases.
3. Calculate the costs of each source of capital.
4. Compute the weighted marginal costs of capital at different levels of total financing.
5. Construct a graph that compares the internal rates of return of available investmentprojects with the weighted marginal costs of capital.
Calculation of Weighted average cost of capital
WACC basic computation is given by the formula given below
ko = ks �
��
+ EDE
+ kd [1-T] �
��
+ EDD
where:
ko = the weighted average cost of capital
ks = the cost of equity capital
kd = the before-tax cost of debt capital
T = the marginal tax rate
E/(D+E) = percentage of financing from equity
D/(D+E) = percentage of financing from debt
(D+E) = Total capital employed by the firm
In the formula above we are assuming that the capital has two components only, debt

Financial Management76
and equity. If the preference capital is also there then it is simply added to it the wayother two are denoted.
The cost of capital and cash flows are then utilised to evaluate a project by using anevaluation method.

77Operating and Financial Leverage
One of the most important of the various financial decisions is how much leverage afirm should employ.
A fundamental decision made by any business is the degree to which it incurs fixedcosts. A fixed cost is one that remains the same regardless of the level of operations.As sales increase, fixed costs don't increase in the same proportion. Some fixed costsdo not increase at all till a particular point. As a result, profits can rise faster duringgood times. On the other hand, during bad times fixed costs don't decline, so profits fallmore rapidly than sales do.
The degree to which a firm locks itself into fixed costs is referred to as its leverageposition. The more highly leveraged a firm, the riskier it is because of the obligationsrelated to fixed costs that must be met whether the firm is having a good year or not. Atthe same time, the more highly leveraged the greater the profits during good times. Thispresents a classic problem of making a decision where there is a trade-off between riskand return.
There are two major types of leverage - financial and operating. Financial leverage isspecifically the extent to which a firm gets its cash resources from borrowing (debt) asopposed to issuance of additional shares of (equity). The greater the debt compared toequity, the more highly leveraged the firm because debt legally obligates the firm tointerest payments. These interest payments represent a fixed cost.
Operating leverage is concerned with the extent to which a firm commits itself to highlevels of fixed costs other than interest payments. A firm that rents property usingcancellable leases has less leverage than a firm that commits itself to a long-termnoncancellable lease does. A firm that has substantial vertical integration has created ahighly leveraged situation. Consider what happens if a company vertically integrates byacquiring its raw materials' supplier. Raw materials will now cost the company less,because it doesn't have to buy them from an outside firm. But when times are bad, thefirm will have to bear the fixed costs associated with the supplier subsidiary. Had therestill been two separate companies, the big company could have simply slowed itspurchases of raw materials from supplier without having to bear its fixed costs.
In the cases of both financial and operating leverage, the crucial question is how muchleverage is appropriate. We can't answer that question in absolute terms, but we will
Chapter-3Operating and Financial Leverage

Financial Management78
help you understand the topic. This understanding should make it simpler to makeappropriate choices or to understand what went into making the choices your firm hasalready made.
Operating Leverage
While decisions about financial leverage is strictly the domain of the firm's highestlevels of management, operating leverage is an issue that directly affects the linemanagers of the firm. The level of operating leverage a firm selects should not be madewithout input from the managers directly involved in the production process. For example,one of the most significant operating leverage issues is the choice of technology levels.Selection of the highest level of technology available is not always in the best interestsof the business.
Suppose that we are opening a chain of copy centres. Each centre will provide a fullservice operation. Customers can drop work off in the morning and pick it up later inthe day or the week. The employees will do the actual photocopying. We are facedwith the choice of renting a relatively slow copy machine, or the newest technologymachine, which is considerably faster. The faster machine is also considerably moreexpensive to lease.
It will generally be the case that newer technology has a higher fixed cost and lowervariable cost than the older technology. Variable costs are those that vary directly withvolume. If we double the number of copies made, we double the amount of paper,printing ink toner, and labour time needed for making the copies. One of the principlefunctions of new technology is to reduce the variable costs of production.
It may turn out that a machine that can reduce the variable costs is more expensive tomake, and thus has a higher purchase or lease price than the older generation machine.However, even if it doesn't cost more to make, its manufacturer will charge more forthe new machine than for the older machine. Intuitively, if the new machine is in somerespect better than the old machine (that is, it lowers the variable cost without reducingquality), and doesn't cost more to buy, then no one will buy the older machine. Thus,anytime we see two technologies being sold side by side, such as slow and fast copymachines, we can expect the faster machine to have a higher rental fee or purchaseprice, and therefore a higher fixed cost.
Let's assume that we could lease the slower, older technology copy machine for Rs10,000 per year, or a faster, newer technology copy machine for Rs 15,000 per year.Both produce photocopies of equal quality. Both use the same quantities of paper andink toner, but the faster machine requires less operating time. Therefore, the labourcost is much lower for the faster machine. As a result, the variable cost of copies onthe slow machine is 30 paise each, while the variable cost of copies from the fastmachine is only 25 paise each. Is the faster machine the better bet?
79Operating and Financial Leverage
That depends. Suppose we sell each copy for 50 paise. Then, for each copy we sell wereceive 50 paise and spend extra 30 paise or 25 paise (depending on our choice ofmachine) for the variable costs. The difference between the price and the variablecosts is referred to as the contribution margin. This margin represents the amount ofmoney available to be used to pay fixed costs and provide the firm with a profit.
If we use the slower machine, we receive 50 paise and spend 30 paise, leaving 20 paiseto be used toward paying the rent on the copy machine. If we sell enough copies, therewill be enough individual contributions of 20 paise a piece to pay the full Rs 10,000 rentand leave some receipts for a profit.
So in operating leverage the decision boils down to the production levels that we haveor we anticipate and on that basis we decide the amount of fixed costs that we arewilling to bear. All this leads itself to breakeven analysis or cost-volume-profit analysisthat you have learned earlier.
Financial Leverage
Let's start our discussion of financial leverage with an example. Assume you were tobuy a small building as a piece of investment property. You buy the building for Rs1,00,000 and pay the full amount in cash.
Suppose that an year later you sell the building for Rs 1,30,000. Your pre-tax profit is Rs30,000. This is a 30% pre-tax return on your original investment of Rs 1,00,000.
As an alternative to paying the full Rs 1,00,000 cash for the investment, you might haveto put Rs 10,000 cash down and borrow Rs 90,000 from the bank at 15% interest. Thistime when you sell the property for Rs 1,30,000 you repay Rs 90,000 to the bank, alongwith Rs 13,500 interest. After deducting your original Rs 10,000 investment, Rs 16,500is left as a pre-tax profit. This is a pre-tax return of 165% on your Rs 10,000 investment.Compare the 30% we calculated earlier to this rate of return of 165%. That's financialleverage for you!
Note that we had a net profit of Rs 30,000 without leverage, but only Rs 16,500 in theleveraged case. Although we earned a higher return, we had less profit. That's becausein the unleveraged case we had invested Rs 1,00,000 of our money, but in the leveragedcase we had invested only Rs 10,000. If we have additional investment opportunitiesavailable to us, we could have invested our full Rs 1,00,000, borrowed Rs 900,000, andhad a pre-tax profit of Rs 165,000 on the same investment that yields Rs 30,000 in theunleveraged situation. Financial leverage can not only increase your yield frominvestments, but can also allow you to consider projects that are much larger than whatwould be feasible without borrowing.

Financial Management80
Suppose, however, that the property were sold after one year for Rs 70,000 rather thanRs 1,30,000. On Rs 1,00,000 unleveraged investment, the loss would be Rs 30,000before taxes. This would be a 30% loss on our original Rs 1,00,000 investment.
In the leveraged case, the loss will be magnified. We would have to repay the bank theRs 90,000 loan plus Rs 13,500 of interest. These payments total to Rs 1,03,500, whichis Rs 33,500 greater than the Rs 70,000 proceeds from the sale. Further, we've lost ourinitial Rs 10,000 investment. The total loss is Rs 43,500 before taxes. On our initialinvestment of Rs 10,000, this constitutes a loss of 435 percent. That's financial leveragetoo!
Let us put that into a table so as to see the effect of financial leverage more clearly.
Clearly when the firm is going to accept this level of leverage it must decide if the165% possible gain is worth the risk of a 435% loss. Whether it is or not depends on thelikelihood of the increase in value versus the probability of a decline. Of course itcan accept a lower level of leverage but still the interplay of debt and equity would bethere and a study of its effects in both the good times and the bad times would beimportant.
If the project really was a sure thing, leverage would certainly make sense but projectsare rarely sure things. Yet, managers should try to decide how confident they are of thesuccess of a project, and weigh that confidence against the implications for the firm ifthe project does indeed fail. Not all managers rate the same project as being equallylikely to succeed. Some managers feel a particular project is great, while others maynot think as highly of it.
Further, even if all managers agreed on how likely a project were to succeed, theywould not all make the same decision about financial leverage. Some managers andfirms tend to be more averse to risk than others. There are gamblers and conservatives.Usually shareholders align themselves with a firm that they feel does things the waythey want them done. A person dependent on a steady level of income from sharedividends might prefer to buy the share of a firm that shuns leverage and prefers asteady, if lesser income. A person looking for large potential appreciation in share pricemight prefer the share of a firm that is highly leveraged.
Original investment
Amount Borrowed
Profit/ (Loss) Profit/ (Loss) as percentage of original investment
1,00,000 - 30,000 30 %
10,000 90,000 30,000 1,65 %
1,00,000 - (30,000) (30 %)
10,000 90,000 (30,000) 4,35 %
81Operating and Financial Leverage
How Much Financial Leverage Is Enough
In practice, the leverage decision is based on firm policy. Some firms raise almost all oftheir funds from issuing share to shareholders and from earnings retained in the firm.Other firms borrow as much as they possibly can and raise additional money fromshareholders only when they can no longer raise any additional money by borrowing.Most firms are somewhere in the middle. In the example that we discussed above, youdidn't have to borrow Rs 90,000 or nothing; you could have chosen to borrow someamount in between the two. Likewise, some firms maintain one-fourth as much debt asequity, some firms equal amounts of debt and equity, and some firms more debt thanequity.
The firm's top corporate managers and the board of directors make this decision.Generally, project managers evaluating the potential of individual projects do not makethe decision of issuing share or borrowing money.
Debt or Equity?
In making a decision regarding whether additional funds should be raised from issuingdebt or equity, there are several factors to be considered. The first rule of financialleverage is that it only pays to borrow if the interest rate is less than the rate of returnon the money borrowed. If your firm can borrow money and invest it at a high enoughrate so that the loan can be repaid with interest and still leave some after-tax profit foryour shareholders, then your shareholders have profited. They have made extra profitwith no extra investment. This greatly magnifies the rate of return on the amount theyinvested.
Why are lenders so generously allowing you to benefit at their expense? How canthere be a system where a firm can increase profits to its shareholders without extrainvestment from them? The key is risk. The shareholders of your company don't increasetheir investment, but they do increase their risk. The lender may not reap all of thepossible profits from the use of his money. But the lender does earn a contractuallyguaranteed rate of return. The lender gets back his money plus a set amount of interest,whether we make a fortune or lose our shirts.
The amount that lenders let you borrow depends largely on your available collateral.Merely desiring to be highly leveraged doesn't guarantee that you can borrow enoughto be highly leveraged. Because the lender isn't a partner if you strike it rich, he doesn'twant to be a partner if you go bankrupt.
Assuming that you have enough collateral to borrow as much as you might want, whatfactors should you consider in trying to arrive at a reasonable level of leverage? To agreat degree, your desired leverage position depends on the degree to which your salesand profits fluctuate. The greater the fluctuation in sales and profits, the less leverageyou can afford. If your firm is a stable, noncyclical firm that makes money in goodtimes and bad, then use of debt will help improve the rate of return earned by yourshareholders. If cyclical factors in your industry or the economy at large tend to causeyour business to have both good and bad years, then debt entails a greater risk.

Financial Management82
For example, the petrochemicals industry, with its huge capital requirements hastraditionally been highly leveraged. The results have been very large profits during thegood years, but substantial losses during periods when petrochemical prices falls.
Cyclical factors shouldn't scare companies away from having any debt at all. The keyis to accumulate no more interest and principal repayment obligations than can reasonablybe met in bad times as well as good. Ultimately, considering the variability of your profitstream, a decision must be made regarding the level of extra risk you are willing to taketo achieve a higher potential rate of return on shareholder investments.
Impact of Financial LeverageFinancial leverage acts as a lever to magnify the influence of fluctuations. Any fluctuationin earnings before interest and taxes (EBIT) is magnified on the earnings per share.(EPS) by operation of leverage. The greater the degree of leverage, the wider thevariation in EPS given any change in EBIT. The following illustration would explainhow leverage technique works.IllustrationPramila company is capitalised with Rs. 10,00,000 divided in 1,000 common shares ofRs. 1,000 each. The management wishes to raise another Rs. 10,00,000 to finance amajor programme of expansion through one of our possible financing plans. Themanagement may finance the company with :(I) all common stock,(II) Rs. 5 lakhs in common stock and Rs. 5 lakhs in debt at 5 per cent interest, or(III) all debt at 6 per cent interest or(IV) Rs. 5 lakhs in common stock and Rs. 5 lakhs in preferred stock with 5 per
dividend.The company’s existing earnings before interest and taxes (EBIT) amounted to Rs.1,20,000. Corporation tax is assumed to be 50 percent.Solution:Impact of financial leverage, as observed earlier, will be reflected in earnings per shareavailable to common stockholders. To calculate, the EPS in each of the four alternativeEBIT has to be first of all calculated:
Proposal Proposal Proposal PropsalA B C D
Rs. Rs. Rs. Rs.EBIT 120000 120000 120000 120000Less Interest - 25000 60000 -EBT 120000 95000 60000 120000Less Taxes @ 50% 60000 475000 30000 60000EAT 60000 475000 30000 60000Preferred Dividend - - - 25000Earnings Available toCommon stock holders 60000 47000 30000 35000No of Equity Shares 20000 15000 10000 15000EPS 3.0 3.67 3.0 2.33

83Operating and Financial Leverage
Thus, when EBIT is Rs. 1,20,000, proposal B involving a total capitalisation of 75percent common stock and 25 per cent debt would be the most favorable with respectto earnings per share. It may further be noted that proposition of common stock in totalcapitalisation is the same in both the proposals Band D but EPS is altogether differentbecause of induction of preferred stock. While preferred stock dividend is subject totaxes where as interest on debt is tax-deductible expenditure resulting in variation inEPS in proposals B and D. With a 50 percent tax rate the explicit cost of preferredstock is twice the cost of debt.
We have so far assumed that level of earnings would remain the same even after theexpansion of funds. Now assume that level of earnings before interest and taxesdoubles the present level in correspondence with increase in capitalisation, changes inearnings per share to common stockholders under different alternatives would be asfollows:
Illustration
Proposal Proposal Proposal PropsalA B C D
Rs. Rs. Rs. Rs.
EBIT 2,40,000 2,40,000 2,40,000 2,40,000
Less Interest - 2,5000 60,000 -
EBT 2,40,000 2,15,000 1,80,000 2,40,000
Less Taxes @ 50% 1,20,000 1,07,000 90,000 1,20,000
EAT 1,20,000 1,07,000 90,000 1,20,000
Less: Preferred Dividend - - - 25000
Earnings Available toCommon stock holders 1,20,000 1,07,000 90,000 1,20,000
No of Equity Shares 20,000 15,000 10,000 15,000
EPS 6 7.17 9 6.33
EPS before AdditionalIssue 3 3 3 3
It is evident from illustration that increase in earnings before interest and taxes ismagnified on the earnings per share where debt has been inducted. Thus, in proposalBand d where debt comprises a portion of total capitalisation, EPS would increase bymore than twice the existing level while in proposal A EPS has improved exactly inproportion to increase in earnings before interest and taxes. Since dividend in preferredstock is a fixed obligation and is less than the increase in earnings, EPS in proposal Dalso increases more than twice the rise in earning.
Another important conclusion that could be drawn from the above illustration is thatthe larger the ratio of debt to equity, the greater the return to equity. Thus, in proposalC where debt represents 50 per cent of the total capitalisation, EPS is magnified threetimes over the existing level while in proposal B where debt has furnished one-third

Financial Management84
of the total funds, increase in EPS is little more than double the earlier level. Thisvolatility of earning operates’ during contraction of income as well as during an expansion.
Likewise, financial leverage magnifies all losses sustained by the company. Assumethat the Rekha Company expects to sustain a toss of Rs. 60,000 before interest andtaxes, loss per share under the different alternatives would be:
IlhrstrationProposal Proposal Proposal Propsal
A B C DRs. Rs. Rs. Rs.
Loss before interestand Taxes –60,000 –60,000 –60,000 –60,000
Add: Interest - 25,000 60,000 -
Loss Per Share 3 5.67 12 4
Thus loss per share is highest under alternative C where proportion of debt is, as highas 50 per cent of the total capitalisation and the lowest in proposal A where leverageis zero. This is why the phrase ‘financial leverage magnifies both profits and loss isvery often quoted to explain magic of the financial leverage.
Thus, the financial leverage is useful as long as the borrowed capital can be made topay the company more than what it costs. Naturally it will become source of decreasein profit rates when it costs more than what it earns. To what extent debt capital shouldbe used in order to improve earnings of the company is a major financing problemfacing a finance manager. It should be remembered here that the financial leverageoffers
financial advantages only up to a point. Beyond that point debt financing may bedetrimental to the company. For instance, as we expand the use of debt’ in our capitalstructure, lenders will perceive a greater financial risk for the company. For thatreason, they may raise the average interest rate we pay, and place certain restrictionson the company. Furthermore, concerned equity stockholders’ may drive down theprice of the stock forcing the management away from the company’s main objectivesof maximizing
overall value of the company in the market. Thus, before using the financial leverageas a technique of improving net earnings of the company, its impact on EPS mustcarefully weighed .
A graphical presentation of a financing plan
A financing plan that consisted of Rs.40,000 of 5-percent bonds, 500 shares of Rs. 4preferred stock, and 1,000 shares of common stock was used to illustrate financialleverage in Table 3.1. This financing plan can be illustrated graphically; like all plansof this type, it can be plotted as a straight line. This is because it is affected only bythe deduction of certain fixed rupees costs. Plotting two values of EBIT Rs.10,000 andRs.14,000-and associated earnings per share of Rs. 2 and Rs. 4 gives us the line inFigure 3.1.

85Operating and Financial Leverage
This line shows the earnings per share associated with each level of EBIT. It isinteresting to note that the line intersects the EBIT axis at Rs.6,000. This value of EBITrepresents the level at which the firm’s earnings per share are equal to zero. This zerointercept can be verified by looking at Case 2 in Table 3.1. At levels of EBIT belowRs.6,000, the firm would have negative EPS. This portion of the graph has not beenincluded.
A graphical illustration of different degrees of financial leverage The type of graphicalpresentation in Figure 3.7 can be used to illustrate differences in financial leverage.Suppose we want to compare the financing plan in the preceding example with analternate plan. The alternate plan involves Rs. 20,000 of 5-percent debt, 250 shares ofRs. 4 preferred stock,
Figure 3.1: A Graphical presentation of a financing plan
and 2,000 shares of common stock. The annual interest payment will be Rs.1,000 (.05× Rs.20,000) and the annual preferred dividend payment will be Rs.1,000 (Rs.4/sh. ×250 sh.). in order to graph this plan, two sets of EBIT -EPS coordinates are required.The EPS associated with EBIT values of Rs.10,000 and Rs.14,000 are calculatedbelow.
40%
Rs. Rs.EBIT 10,000 14,000
I 1,000 1,000EBT 9,000 13,000–T (50%) 4,500 6,500–P 1,000 1,000EPC 3,500 3,500
EPS
sh/75.1.Rs000,2
500,3.Rs =
sh/75.2.Rs000,2
500,5.Rs =
+56%
Financing Plan
EBIT(Rs)
EPS
(Rs.
)
l
l

Financial Management86
A 40-percent increase in the firm’s EBIT will result in a 56-percent increase in EPS.Applying Equation 3.6 to these values yields
4.1%40%56 =
++
The value of 1.4, when compared to the financial leverage value of 2.5 calculatedearlier indicates that this plan has a lower degree presented initially. Each of theseplans is graphed m Figure 3.8, The original plan, first graphed in Figure 3.1, is labeledplan A; the current plan is labeled plan B.
Figure 3.2: A graphical comparison of differing financing plans
As Figure 3.8 illustrates, the slope of plan A is steeper than that of plan BThis indicates that plan A has more financial leverage than plan B· This resultis as expected, since the ratio of the change in EPS for a given change inEBIT is 2.5 for plan A and 1.4 for plan B. The higher this ratio is, the moreleverage a plan has. The reader should recognize from Figure 3·8 that financing planswith higher degrees of leverage have steeper slopes when plotted on EBIT -EPS axes.
The point of intersection of each plan with the EBIT axis represents the amount ofearnings before interest and taxes necessary for the firm to cover its fixed financialcharges, that is, the point at which EPS = 0. This point of intersection can be thoughtof a financial break-even point since it represents the level of EBIT necessary forthe firm to break even on its fixed financial charges. The break-even EBIT for planA is Rs. 6,000, and for plan B it is Rs. 3,000 In other words, earnings before interestand taxes of less than Rs.6,000 with plan A or less than Rs.3,000 with plan B will resultin a loss, or negative EPS.
The point labeled X in Figure 3.2 represents, the point of intersection between plan Aloss, or negative EPS. and plan B· It indicates that at a level of EBIT of Rs.9,000, EPSof Rs. 1.50 would result under either plan. At levels of EBIT below Rs.9,000, plan
Plan A
EBIT(Rs)
EPS
(Rs.
)
Plan B

87Operating and Financial Leverage
B results in higher levels of EPS; while at levels of EBIT above Rs,9,COO, plan- Aresults in higher levels of EPS. The usefulness of this type of analysis is discussed inChapter on Capital Structure while discussing methods of evaluating financing plans.
Combined Leverage
The operating leverage has its effects on operating risk and is measure by the percentagechange in EBIT due to percentage change in sales. The financial leverage has itseffects on financial risk and is measured by rthe percentage change in EPS due tpercentage change in EBIT. Since both these leverages are closely concerned withascertaining the ability to cover fixed charges (fixed-operating costs in the case ofoperating leverage and fixed-financial costs in the case of financial leverage), if theyare combined, the result is total leverage and the risk associated with combined leverageis known as total risk. Symbolically,
DCL = DOL X DFL (14.11)
Where DCL = Degree of combined leverage
DOL = Degree of operating leverage
DFL = Degree of financial leverage
Substituting the values of DOL and DFL, we have:
DCL =EBITin change %EPSin change %
salesin change %EBITin change % ×
DCL = salesin change %EBITin change %
DCL = 1-EBITonContributi
1-EBIT
EBITEBIT
onContributi ×
Thus, the DCL measures the percentage change in EPS due to percentage change insales. If the degree of operating leverage of a firm is 6 and its financial leverage is 2.5,the combined leverage of this a firm would be 15(6 X 2.5). That is, 1 per cent changein sales would bring about 15 per cent change in EPS in the direction of the change insales. The combined leverage can work in either direction. It will be favourable ifsales increase and unfavourable when sales decrease because changes in sales willresult in more than proportionate returns in the form of EPS.
The usefulness of DCL lies in the fact that it indicates the effect that sales changes willhave on EPS. Its potential is also great in the area of choosing financial plans for newinvestments. If, for example, a firm begins to invest heavily in more risky assets thanusual, the operating leverage will obviously increase. If it does not change its financing

Financial Management88
policy, that is, the capital structure remains constant, there would be no change in itsfinancial leverage. As a result, the combined leverages would increase causing anincrease in its total risk. The firm, in order to keep its risk constant, may like to lowerits financial leverage. This could be done if the new investments are financed withmore equity than the firm has used in the past. This would lower the financial leverageand compensate for the increased operating leverage caused by investment in morerisky investments. If the operating leverage has decreased due to low fixed costs, thefirm can afford to have a more levered financial plan to keep the total risk constant atthe same time having the same prospects of magnifying effects on EPS due to changein sales.
Solved Problems1. B Corporation is considering a new project which will require the purchase of a
new machine at a cost of 250,000. The project will also require use of a machinewhich has been fully depreciated but which could be sold today for 30,000. Inaddition, the firm expects an increase in net working capital investment of 60,000in the first year of the project. What is the incremental net investment at theoutset of this project? How much of this incremental net investment will the firmbe able to depreciate?
Solution
The incremental investment includes both the cash required to purchase the newmachine and the after-tax disposal value of the old machine, which is calculatedas follows:
Gain on sale = Market value - Book value = 30,000 -0 = 30,000.
Taxes on gain = Gain Tax rate = (30,000)(0.40) = 12,000
Thus the firm's incremental investment flows are:
Cost of new machine : 250,000
Increase in net working capital 60,000
Market value of old machine -30,000
Tax on gain of sale of old machine : 12,000
Incremental investment outlay 292,000
The firm's depreciable value for tax purposes will be only the 250,000 cost of thenew machine. (If the old machine had remaining book value, the incremental taxbasis would be reduced by the loss of this book value.)
2. The Stupid Company is considering a project requiring the purchase of a newmachine costing Rs 200,000. The machine will be depreciated on a straight-line
89Operating and Financial Leverage
basis over its economic life of five years. The project, however, has only a three-year life and the machine will be sold after three years for an estimated Rs 30,000.In addition, the firm will be able to recover Rs 6,000 of working capital investment.What is the after-tax cash flow in year 3 from the sale of this machine and therecovery of the working capital investment? Assume that the firm's marginal taxrate is 40 percent.
Solution
The net cash flow in the final year are after-tax cash flows, including the taxeffect of any asset sale. Note that there is no tax effect on the recovery ofworking capital investment since the recovery involves the collection of accountsreceivable and the sale of inventory which has no tax effect (other than thoserepresented by revenues and expenses).
Gain or loss on asset sale :
Market value of asset 30,000
Less : Book value of aset [200-(3)(40)] 80,000
Loss of sale of asset 50,000
Calculating year 3 after-tax cash flows :
Taxes saved due to loss on sale [(50)(0.40)] 20,000
Decreases in working capital investmen 6,000
Net after-tax cash flow in year 3 56,000
3. The following figures relate to two companies: (Rs lakhs)
P Ltd. Q Ltd.Sales 500 1,000Variable costs 200 300Contribution 300 700Fixed costs 150 400
150 300Interest 50 d 100Profit before Tax 100 200
You are required to:
(i) Calculate the operating, financial and combined leverages for the two companies;and
(ii) Comment on the relative risk position of them.

Financial Management90
Solution: Calculation of leverage :
Operating leverage = Tax & Interest before EarningonContributi
P Ltd =lakhs 150 Rs. lakhs 300 .Rs
= 2
Q Ltd = lakhs 300 Rs. lakhs 700 .Rs
= 2.33
Financial leverage = Tax before ProfitTax & Interest before Earning
P Ltd =lakhs 100 Rs. lakhs 150 .Rs
= 1.5
Q Ltd =lakhs 200 Rs. lakhs 300 .Rs
= 1.5
Combined leverage = Tax before EarningonContributi
(i.e., Operating leverage × Financial leverage)
P Ltd =lakhs 100 Rs. lakhs 300 .Rs
= 3
Q Ltd =lakhs 200 Rs. lakhs 700 .Rs
= 3.5
Comment on the relative risk position of P Ltd. and Q Ltd.
(a) Operating Leverage: The operating leverage of Q Ltd. is higher than P Ltd.'and hence Q Ltd. is exposed to higher business risk than P Ltd. A firm will facebusiness risk when the EBIT does not vary in direct proportion with the change insales.
(b) Financial Leverage: The financial leverage of both the companies is samei.e., 1.5.
(c) Combined Leverage: When we study the overall risk of the companies, iscarrying higher risk than P Ltd.
4. (i) Find the operating leverage from the following data:
Sales Rs. 50,000Variable Costs 60%Fixed costs Rs. 12,000

91Operating and Financial Leverage
(ii) Find the financial leverage from the following data:
Net Worth Rs. 25,00,000
Debt/Equity 3/1
interest rate 12%
Solution:
(i) Calculation of Operating level rage:
Particulars (Rs.)
Sales 50,000
Less: Variable Costs (60% of Sales) 30,000
Contribution 20,000
less: Fixed Costs 12,000
Operating Profit 8,000 d
Operating leverage = Contribution/Operating profit
= Rs. 20,000/Rs. 8,000 = 2.5
(ii) Calculation of Financial Leverage
Working Notes:
Calculation of debt and interest thereon:
(a) Debt =Rs. 25,00,000 × 3 = Rs. 75,00,000
(b) Interest on debt = Rs. 75,00,000 × 12/100 = Rs. 9,00,000
Rs.
Operating Profit 20,00,000
Less: Interest on debt 9,00,000 d
Profit before tax 11,00,000
Financial Leverage = Operating profit/Profit before tax
= Rs. 20,00,000/Rs. 11,00,000 = 1.82
5. Calculate the operating leverage, financial leverage and combined leverage fromthe following data under Situations I and II and Financial Plans A and B:
Installed capacity 4,00 unit
Actual Porduction and sales 75% of the Capacity
Selling Price Rs. 30 per Unit

Financial Management92
Variable Cost Rs. 15 per Unit
Fixed cost:
Under Situation I Rs. 15, 000
Under Situation II Rs. 20,000
Capital structure: Rs.
Financial Plan A B
Equity 10,000 15,000Debt (rate of Interest at 20%) 10,000 5,000 d
20,000 20,000
Solution: (i) Calculation of Operating Leverage
Operating Leverage = (Contribution/operating profit)
Rs.
Situation I Situation II
Sales 90,000 90,000
Less: variable cost 45,000 45,000(3,00 unit@ Rs. 30 per unit)
Contribution 45,000 45,000
Less: Fixed Costs 15,000 20,000
Operating profit (EBIT) 30,000 25,000
Operating Leverage = Rs. 45,000Rs. 30,000 = 1.5
Rs. 45,000Rs. 25,000 =1.8
(ii) Calculation of financial leverage
Financial leverage = Operating profitProfit before tax
Financial plan A BSituation I 30,000 30,000Operation profitLess: Interest on debt 2,000 1,000profit before tax PBT 28,000 29,000
Financial leverage =
Rs. 30,000 Rs. ,28 000
= RsRs
. ,
. ,30 00029 000
= 1.07 = 1.04

93Operating and Financial Leverage
Financial plan A B
Situation II 25,000 25,000
Operation profit 2,000 1,000Less: Interest on debt 23,000 24,000
PBT
Financial leverage =Rs. 25,000
Rs. ,23 000 =Rs. 25,000
Rs. ,24 000 = 1.04
= 1.09
(iii) Calculation of combined leverages
Combined leverage = Operating Leverage × Financial Leverage
Financial plan A B
Situation I (1.5×1.07) (1.5×1.04)
Situation II (1.8×1.09) (1.8×1.04)
= 1.96 = 1.87

Financial Management94
Meaning, Importance, rationale of capital budgeting, nature of investment decision, theadministrative framework, Methods of Appraisal, Capital Rationing, Inflation and capitalbudgeting, Capital Budgeting under Risk and Uncertainties
Meaning, Importance & Rationale of Capital Budgeting
A firm conducts its business in a rapidly changing and highly competitive environment.The changing environment poses both opportunities and threats for the company. Forexample, change in Government policy may cause change in prices of inputs and outputs,demand and supply of products/services. Similarly, technology change may cause theproduction cost change. Also the cash inflows and outflows cannot be ascertained withaccuracy. Therefore, evaluation of investment projects under uncertainty and risk becomeimportant.
Characteristically, a capital budgeting decision involves largely irreversible commitmentof resources that is generally subject to a significant degree of risk. Such decisions havefar reaching effects on a company's profitability and flexibility over the long-term, thusrequiring that they be part of a carefully developed strategy that is based on reliableforecasting procedures.
Capital Budgeting
Capital budgeting may be defined as the decision-making process by which, firmsevaluate the purchase of major fixed assets, including buildings, machinery, and equipmentIt also covers decisions to acquire other firms, either through the purchase of theircommon stock or groups of assets that can be used to conduct an ongoing business.Capital budgeting scribes the firm’s formal planning process for the acquisition andinvestment of capital and results in a capital budget that is the firm’s formal plan forthe expenditure of money to purchased assets.
A capital-budgeting decision is a two-sided process. First, the analyst must evaluate aproposed project to calculate the likely or expected return from the project. Thiscalculation generally begins with expenditure of the project’s service life and a streamof cash flowing into the firm over the life of the project. The calculation of expected,turn may be done by two methods: a internal rate of return, or (b) net present value,These two methods are discussed later in this unit.
Chapter-4Capital Budgeting

Capital Budgeting 95
The second side of a capital-budgeting decision is to determine the required returnfrom a project. We may calculate the likely return to be 12 percent but the questionis whether this is good enough for the proposal to be accepted. In order to determinewhether the return is adequate, the aualyst must evaluate the degree of risk in theproject and then must calculate the, required return for the given risk level. Twotechniques may be used to perform this analysis. The weighted-average cost ofcapital is used when the new proposal is assumed to have the same degree of riskas the firm’s existing activities. The capital asset pricing model is used if the risk inthe project is viewed as different from the firm’s current risk level.
Capital budgeting is important for the future well-being of the firm; it is also a complex,conceptually difficult topic. A, we shall see later in this chapter, the optimum capitalbudget-the level of investment that maximizes the present value of the firm issimultaneously determined by the interaction of supply and demand forces underconditions of uncertainty. Supply forces refer to the supply of capital, the firm or itscost of capital schedule. Demand forces relate to the investmenl opportunities opento the firm, as measured by the stream of revenues that will result from an investmentdecision Uncertainty enters the decision because it is impossible to know exactlyeither the cost of capital or the stream of revenues that will be derived from a project.
Significane of Capital Budgeting
A number of factors cornbine to make capital budgeting perhaps the most importantdecision with which financial management is involved. Further, a departments Of afirm-production, marketing, and so on, are vitally affected by the capital budgetingdecisions, so all executives, no matter what their primary responsibility, must be awareof how capital budgeting decisions are made, These points are discussed in this section.
Long Term Effects
First and foremost, the fact that the results continue over an extended period meansthat the decision maker loses some of his flexibility. He must make a commitment intothe future. For example, the purchase of an asset with an economic life of ten yearsrequires a long period of waiting before the final results of the action can be known.The decision maker must commit funds for this period, and, thus, he becomes a hostageof future events.
Asset expansion is fundamentally related to expected future sales. A decision to buyor to construct a fixed asset that is expected to last five years involves an implicit five-year sales forecast. Indeed, the economic life of a purchased asset represents animplicit forecast for the duration of the economic life of the asset. Hence, failure toforecast accurately will result in over investment or under investmnent in fixed assets.
An erroneous forecast of asset requirements can result in serious consequences. If thefirm has invested too much in assets, it will incur unnecessarily heavy expenses. If it

Financial Management96
has not spent enough on fixed assets, two serious problems may arise. First, the firm’sequipment may not be sufficiently modern to enable it to produce competitively. Second,if it has inadequate capacity, it may lose a portion of its share of the market to rivalfirms. To regain lost customers typically requires heavy selling expenses, price reduction,product improvements, and so forth.
Timing the Availability of Capital Assets
Another problem is to phase properly the availability of capital assets in order to havethem. come “on stream” at the correct time. For example, the executive vice-presidentof a decorative tile company gave the authors an illustration of the importance ofcapital budgeting. His firm tried to operate near capacity most of the time. For aboutfour years there had been intermittent spurts in the demand for its product; when thesespurts occurred, the firm had to turn away orders. After a sharp increase in demand,the firm would add capacity by renting an additional building, then purchasing andinstalling the appropriate equipment. It would take six to eight months to have theadditional capacity ready. At this point the company frequently found that there wasno demand for its increased output-other firms had already expanded their operationsand had taken an increased share of the market, with the result that demand for thisfirm had leveled off. If the firm had properly forecast demand and had planned itsincrease in capacity six months or one year in advance, it would have been able tomaintain its market-indeed, to obtain a larger share of the market.
Quality of Capital Assets
Good capital budgeting will also improve the timing of asset acquisitions and the qualityof assets purchased. This situation follows from the nature of capital goods and theirproducers. Firms do not order capital goods until they see that sales are beginning topress on capacity. Such occasions occur simultaneously for many firms. When theheavy orders come in, the producers of capital goods go from a situation of idlecapacity to one where they cannot meet all the orders that have been placed. Consequently,large backlogs accumulate. Since the production of capital goods involves a relativelylong work-in-process period, a year or more of waiting may be involved before theadditional capital goods are available. This factor has obvious implications for purchasingagents and plant managers.
Asset expansion is fundamentally related to expected future sales. A decision to buyor to construct a fixed asset that is expected to last five years involves an implicit five-year sales forecast. Indeed, the economic life of a purchased asset represents animplicit forecast for the duration of the economic life of the asset. Hence, failure toforecast accurately will result in over investment or under investmnent in fixed assets.
An erroneous forecast of asset requirements can result in serious consequences. If thefirm has invested too much in assets, it will incur unnecessarily heavy expenses. If ithas not spent enough on fixed assets, two serious problems may arise. First, the firm’s

Capital Budgeting 97
equipment may not be sufficiently modern to enable it to produce competitively. Second,if it has inadequate capacity, it may lose a portion of its share of the market to rivalfirms. To regain lost customers typically requires heavy selling expenses, price reduction,product improvements, and so forth.
Timing the Availability of Capital Assets
Another problem is to phase properly the availability of capital assets in order to havethem. come “on stream” at the correct time. For example, the executive vice-presidentof a decorative tile company gave the authors an illustration of the importance ofcapital budgeting. His firm tried to operate near capacity most of the time. For aboutfour years there had been intermittent spurts in the demand for its product; when thesespurts occurred, the firm had to turn away orders. After a sharp increase in demand,the firm would add capacity by renting an additional building, then purchasing andinstalling the appropriate equipment. It would take six to eight months to have theadditional capacity ready. At this point the company frequently found that there wasno demand for its increased output-other firms had already expanded their operationsand had taken an increased share of the market, with the result that demand for thisfirm had leveled off. If the firm had properly forecast demand and had planned itsincrease in capacity six months or one year in advance, it would have been able tomaintain its market-indeed, to obtain a larger share of the market.
Quality of Capital Assets
Good capital budgeting will also improve the timing of asset acquisitions and the qualityof assets purchased. This situation follows from the nature of capital goods and theirproducers. Firms do not order capital goods until they see that sales are beginning topress on capacity. Such occasions occur simultaneously for many firms. When theheavy orders come in, the producers of capital goods go from a situation of idlecapacity to one where they cannot meet all the orders that have been placed. Consequently,large backlogs accumulate. Since the production of capital goods involves a relativelylong work-in-process period, a year or more of waiting may be involved before theadditional capital goods are available. This factor has obvious implications for purchasingagents and plant managers.
Raising Funds
Another reason for the importance of capital budgeting is that asset expansion typicallyinvolves substantial expenditures Before a firm spends a large amount of money, itmust make the proper plans-large amounts of fund are not available automatically. Afirm contemplating, major capital expenditure program may need to arrange its financingseveral years in advance to be sure of having the funds required for the expansion.
Raising Funds Another reason for the importance of capital budgeting is that assetexpansion typically involves substantial expenditures Before a firm spends a large
Financial Management98
amount of money, it must make the proper plans-large amounts of fund are not availableautomatically. A firm contemplating, major capital expenditure program may need toarrange its financing several years in advance to be sure of having the funds requiredfor the expansion.
Ability to Compete
Finally, it has been said with a great deal of truth that many firms fail, not because theyhave too much capital equipment but because they have too little. While the conservativeapproach of having a small amount of capital equipment may be appropriate at times,such an approach may also be fatal if a firm’s competitors install modern, automatedequipmen that permits them to produce a better product and sell it at a lower price.The same thing also holds true for nations: If United States firms fail to modernize butthose of other nations do, then the u.s. will not be able to compete in world marketsThus, an understanding of business investment behavior and of factors that motivatefirms to undertake investment programs is vital for congressional leaders and othersinvolved in governmental policy making.
Application of the Concept
At the applied level, the capital budgeting process is much more complex than whatit looks. Projects do not just appear, a continuing stream of good investment opportunitiesresults from hard thinking, careful planning, and, often, large outlays for research anddevelopment Moreover, some very difficult measurement problems are involved: thesales and costs associated with particular projects must be estimated, frequently manyyears into the future, in the face of great uncertainty. Finally, some difficult conceptualand empirical problems arise over the methods of calculating rates of return and thecost of capital.
Businessmen are required to take action, however, even in the face of the kinds ofproblems described; this requirement has led to the development of procedures thatassist in making optimal investment decisions.
Difficulties in Capital Budgeting
While capital expenditure decisions are extremely important, they also pose difficulties,which stem from three principal sources:
lllll Measurement Problems Identifying and measuring the costs end benefits of acapital expenditure proposal tends to be difficult. This is more so when a capitalexpenditure has a bearing on some other activities of the firm (like cutting intothe sales of some existing product) or has some intangible consequences (likeimproving the morale of workers).
lllll Uncertainty A capital expenditure decision involves costs and benefits thatextend far into future. It is impossible to predict exactly what will happen infuture. Hence, there is usually a great deal of uncertainty characterizing thecosts and benefits of a capital expenditure decision.

Capital Budgeting 99
lllll Temporal Spread The costs and benefits associated with a capital expendituredecision are spread out over a long period of time, usually years for industrialprojects and 20-50 years for infrastructural projects· Such a temporal spreadcreates some problems in estimating discount rates and establishing equivalences.
Project Classification
Project analysis entails time and effort. The costs incurred in this exercise must bejustified by the benefits from it. Certain projects, given their complexity and magnitude,may warrant a detailed analysis while others may call for a relatively simple analysis.Hence firms normally classify projects into different categories. Each category is thenanalysed somewhat differently.
While the system of classification may vary from one firm to another, the followingcategories are found in most classifications.
Mandatory Investment These are expenditures required to comply with statutoryrequirements. examples of such investments are pollution control equipment, medicaldispensary, fire fitting equipment, clr5che in factory premises, and so on. These areoften non-revenue producing investments. In analyzing such investments the focus ismainly on finding the most cost-effective way of fulfilling a given statutoryneed.
Replacement Projects Firms routinely invest in equipments meant to replace Obsoleteand inefficient equipments, even though they may be in a serviceable condition. Theobjective of such investments is to reduce costs (of labor, raw material, and power),increase yield, and improve quality. Replacement projects can be evaluated in a fairlystraightforward manner, though at times the analysis may be quite detailed.
Expansion Projects These investments are meant to increase capacity and/or widenthe diistribution network. Such investments call for an explicit forecast of growth.Since this can be risky and complex, expansion projects normally warrant more carefulanalysis than replacement projects Decision relating to such projects are taken by thetop management.
Diversification Projects These investments are aimed at producing new products orServices or entirely new geographical areas. Often diversiftcation projects entailsubstantial risks, involve large outlays, and require considerable managerial effort andattention. Given their strategic importance, such projects call for a very thoroughevaluation, both quantitative and qualitative. Further, they require a significant involvementof the board of directors.
Research and Development Projects R&D projects absorbed a very Small proportionof capital budget in most Indian companies. Things, however, are changing. Companiesare now allocating mote funds to R&D projects, more so in knowledge-intensive

Financial Management100
industries. R&D projects are characterized by numerous uncertainties and typicallyinvolve sequential decision-making. Hence the standard DCF analysis is not applicableto them. Such projects are decided on the basis of managerial judgment. Firms, whichrely more on quantitative methods, use decision tree analysis and option analysis toevaluate R&D projects.
Miscellaneous Projects This is a catch-all category that includes items like interiorDecoration, recreational facilities, executive aircrafts, landscaped gardens, and so on.
There is no standard approach for evaluating these projects and decisions regardingthem are based on personal preferences of top management.
Rationale
The rationale underlying the capital budgeting decision is efficiency. Thus, a firm mustreplace worn and obsolete plants and machinery, acquire fixed assets for current andnew products and make strategic investment decisions. This will enable the firm toachieve its objective of maximizing profits either by way of increased revenues or costreductions. The quality of these decisions is improved by capital budgeting. Capitalbudgeting decision can be of two types: (i) those which expand revenues, and (ii) thosewhich reduce costs.
Investment Decision Affecting Revenues. Such investment decisions are expectedto bring in additional revenue, thereby raising the size of the firm’s total revenue.They can be the result of either expansion of present operations or the developmentof new product lines. Both types of investment decisions involve acquisition ofnew fixed assets and are income-expansionary in nature in the case of manufacturingfirms.
Investment Decisions Reducing Costs Such decisions, by reducing costs, add to theearnings of firm. A classic example of such investment decisions is the replacementproposals when an asset wears out or becomes outdated. The firm must decidewhether to continue with the existing assets or replace them. The firm evaluates thebenefits from the new machine in terms of lower operating cost and the outlay thatwould be needed to replace the machine. An expenditure on a new machine may bequite justifiable in the light of the total cost savings that result.
A fundamental difference between the above two categories of investment decisionlies in the fact that cost-reduction investment decisions are subject to less uncertaintyin comparison to the revenue-affecting investment decisions. This is so because thefirm has a better ‘feel’ for potential cost savings as it can examine past production andcost data. However, it is difficult to precisely estimate the revenues and costs resultingfrom a new product line, particularly when the firm, knows relatively little about thesame.

Capital Budgeting 101
Nature of Investment Decision
Typical examples of capital budgeting decisions are:l expansion projects;
l replacement projects;
l selection among alternatives; and
l buy or lease decisions.
Good capital budgeting decisions, based on sound investment appraisal procedures,should improve the timing of capital acquisitions as well as the quality of capitalacquisitions.
Investment in expansion/ modernisation is one of the main sources of economic growth,since it is required not only to increase the total capital stock of equipment and buildings,but also to employ labour in increasingly productive jobs as old plant is replaced by new.
The Administrative Framework
Successful administration of capital investments by a company involves
1. Generation of investment proposals
2. Estimation of cash flows for the proposals
3. Evaluation of cash flows
4. Selection of projects based upon an acceptance criterion
5. Continual reevaluation of investment projects after their acceptance
Depending upon the firm involved, investment proposals can emanate from varioussources. For purposes of analysis, projects may be classified into one of five categories.
1. New products or expansion of existing products
2. Replacement of equipment or buildings
3. Research and development
4. Exploration
5. Others
The fifth category comprises miscellaneous items such as the expenditure of funds tocomply with certain health standards or the acquisition of a pollution-control device.For a new product, the proposal usually originates in the marketing department. On theother hand a proposal to replace a piece of equipment with a more sophisticated modelusually emanates from the production area of the firm, in each case, efficientadministrative procedures are needed for channeling in-
Most firms screen proposals at multiple levels of authority. For a proposal originatingin the production area, the hierarchy of authority might run from (1) section chiefs to

Financial Management102
(2) plant managers to (3) the vice-president for operations to (4) a capital expenditurescommittee under the financial manager to (5) the president to (6) the board of directors.How high a proposal must go before it is finally approved usually depends upon its size.The greater the capital outlay, the greater the number of screens usually required. Plantmanagers may be able to approve moderate-sized projects on their own, but only higherlevels of authority approve larger ones. Because the administrative procedures forscreening investment proposals vary greatly from firm to firm, it is not possible togeneralize. The best procedure will depend upon the circumstances.
The level and type of capital expenditure appear to be important to investors, as theyconvey information about the expected future growth of earnings. John J. McConnelland Chris J. Muscarelia test this notion with respect to the level of expenditures of acompany. They find that an increase in capital-expenditure intentions, relative to priorexpectations, results in increased stock returns around the time of the announcement,and vice versa for an unexpected decrease.
Investment Ideas: Who Generates?
Investment opportunities have to be identified or created; they do not occurautomatically? Investment proposals of various types may originate at different levelswithin a firm. Most proposals, in the nature of cost reduction or replacement or processor product improvement take place at plant level. The contribution of top managementin generating investment ideas is generally confined to expansion or diversificationprojects. The proposals may originate systematically or haphazardly in a firm. Theproposal for adding a new product may emanate from the marketing department orfrom the plant manager who thinks of a better way of utilizing idle capacity. Suggestionsfor replacing an old machine or improving the production techniques may arise at thefactory level. In view of the fact that enough investment proposals should be generatedto employ the firm’s funds fully well and efficiently, a systematic procedure for generatingproposals may be evolved by a firm.
In a number of Indian ‘companies, more than 50 per cent of the investment ideas aregenerated at the plant level. The contribution of the board in idea generation is relativelyinsignificant. However, some companies depend on the board for certain investmentideas. Other companies depend on research centers for investment ideas.
Is the investment idea generation primarily a bottom-up process in India? In UK, bothbottom up as well as top-down processes exist.4 The Indian practice is more like thatin USA. Petty and Scott’s study (1981) showed that project initiation was a bottom-up process in USA, with about 82 per cent of investment proposals coming fromdivisional management and plant personnel. 5 However, it is to be noted that the smallnumber of ideas generated at the top may represent a high percentage in terms ofinvestment value, so that what looks to be an entirely bottom-up process may not bereally so.

Capital Budgeting 103
Indian companies use a variety of methods to encourage idea generation. The mostcommon methods used are: (a) management sponsored studies for project identification,(b) formal suggestion schemes, and (c) consulting advice. Most companies use acombination of methods. The offer of financial incentives for generating investmentidea is not a popular practice. Other efforts employed by companies in searchinginvestment ideas are: (a) review of researches done in the country or abroad,(b) conducting market surveys, and (c) deputing executives to international trade fairsfor identifying new products/technology.
Once the investment proposals have been identified, they could be submitted forscrutiny any time. However, some companies do specify a submission time.
Developing Cash Flow Estimation
Estimation of cash flows is a difficult task because the future is uncertain. Operatingmanagers with the help of finance executives should develop cash now estimates. Therisk associated with cash nows should also be property handled and should be takeninto account in the decision process. Estimation of cash nows requires collection andanalysis of all qualitative and quantitative data, both financial and non-financial innature. Large companies would have a management information system providingsuch data.
Executives in practice do not always have clarity about estimating cash flows. A largenumber of companies do not include additional working capital while estimating theinvestment project cash flows. A number of companies also mix up financial flows withoperating flows. Although the companies claim to estimate cash flows on incrementalbasis, some of them make no adjustment for sale proceeds of existing assets whilecomputing the project’s initial cost.
Most Indian companies choose an arbitrary period of 5 or 10 years for forecasting cashflows. This was because companies in India largely depended on government-ownedfinancial institutions for financing their projects, and these institutions required 5 to 10years forecasts of the project Cash flows.
Evaluation
The evaluation of projects should be performed by a group of experts who have no areto grind. Far example, the production people may be generally interested in having themost modem type of equipments and increased production even if productivity isexpected to be low and goods cannot be sold. This attitude can bias their estimates ofcash nows of the proposed projects. Similarly, marketing executives may be toooptimistic about the sales prospects of goods manufactured, and overestimate thebenefits of a proposed new product. It is therefore, necessary to ensure that animpartial group scrutinizes projects and that objectivity is maintained in the evaluationprocess.
Financial Management104
A company in practice should take all care in selecting a method or methods ofinvestment evaluation. The criterion or criteria selected should be a true measure ofevaluating if the investment is profitable (in terms of cash flows), and it should lead tothe net increase in the company’s wealth (that is, its benefits should exceed its costadjusted for time value and risk). It should also be seen that the evaluation criteria donot discriminate between the investment proposals. They should be capable of rankingprojects correctly in terms of profitability. The net present value method is theoreticallythe most desirable criterion as it is a true measure of profitability; it generally ranksprojects correctly and is consistent with the wealth maximisation criterion. In practice,however, managers’ choice may be governed by other practical considerations also.
A formal financial evaluation of proposed capital expenditures has become a commonpractice among companies in India. A number of companies have a formal financialevaluation of almost three-fourths of their investment rojects. Most companies subjectmore than 50 per cent of the projects to some kind of formal evaluation. However,projects, such as replacement or worn-out equipment, welfare and statutorily requiredprojects below certain limits, small value items like office equipment or furniture,replacement of assets of immediate requirements, etc., are not often formallyevaluated.
Methods of Evaluation
As regards the use of evaluation methods, most Indian companies, use payback criterion.In addition to payback and/or other methods, some companies also use internal rate ofreturn (IRR) and net present (NPV) methods. A few companies use accounting rateof return (ARR) method. IRR is the second most popular technique in India.
The major reason for DCF techniques not being as popular as payback is the lack offamiliarity with DCF on the part of executives. Other factors are lack of technicalpeople and sometimes unwillingness of top management to use the DCF techniques.One large manufacturing and marketing organisation, for example, thinks that conditionsof its business are such that the DCF techniques are not needed. By business conditionsthe company perhaps means its marketing nature, and its products being in seller’smarkets. Another company feels that replacement projects are very frequent in thecompany, and therefore, it is not necessary to use DCF techniques for such projects.
The practice of companies in India regarding the use of evaluation criteria is similarto that in USA. A study by Schall, Sundem and Geiljsbeak (1978) showed that whereas86 per cent of the firms used either the internal rate of return or net present valuemodels, only 16 per cent used such discounting techniques without using the paybackperiod or average rate of return methods. The tendency of US firms to use naivetechniques as supplementary tools has also been reported in other studies. However,firms in USA have come to depend increasingly on the DCF techniques, particularlyIRR. According to Rockley’s study (1973X the British companies use both DCF

Capital Budgeting 105
techniques and return on capital, sometimes in combination and sometimes solely, intheir investment evaluation; the use of payback is wide-spread. A recent study by Pikeshows that the use of the DCF methods has significantly increased in UK in 1992, andNPV is more popular than IRR. However, this increase has not reduced the importanceof the traditional methods such as payback and return on investment. Payback continuesto be employed by almost all companies.
One significant difference between practices in India and USA is that payback is usedin India as a ‘primary’ method and IRRJNPV as a ‘secondary’ method, while it is justthe reverse in USA. Indian managers feel that payback is a convenient method ofcommunicating an investment’s desirability, and it best protects the recovery of capital-a scarce commodity in the developing countries.
Cut-off Rate
In the implementation of a sophisticated evaluation system, the use of a minimumrequired rate of return is necessary. The required rate of return or the opportunity costof capital should be based on the riskiness of cash flows of the investment proposal;it is compensation to investors for bearing the risk in supplying capit81 to financeinvestment proposals.
Not all companies in India specify the minimum acceptable rate of return. Some ofthem compute the weighted average cost of capital (WACC) as the discount rate.WACC is defined either as: (i) after-tax cost of debt x weight + after-tax cost of equityx weight (cost of equity is taken as 25 per cent (a judgmental number) and weightsare in proportion to the sources of capital used by a specific project); (ii) (after tax costof borrowing × borrowings + dividend rate × equity) dividend by total capital.
Business executives in India are becoming increasingly aware of the Importance of thecost of capital, but they perhaps lack clarity among them about its computation. Arbitraryjudgment of management also seems to plays role in the assessment of the cost ofcapital. The fallacious tendency of equating borrowing rate with minimum rate ofreturn also persists in the case of some companies. In USA, a little mom than 50 percent companies have been found using WACC as cut-off rate. In UK, only 14 per centfirms were found to attempt any calculation of the cost of capital. As in USA and UK,companies in India have a tendency to equate the minimum rate with interest rate orcost of specific source of finance. The phenomenon of depending on managementjudgement for the assessment of the cost of capital is prevalent as much in USA andUK as in India.
Recognition of Risk
The assessment of risk is an important aspect of an investment evaluation. In theory,a number of techniques are suggested to handle risk. Some of them, such as thecomputer simulation technique are not only quite involved but are also expensive to use.How do companies handle risk in practice?

Financial Management106
Companies in India consider the following as the four most important contributors ofinvestment risk: selling price, product deman4 technological changes and governmentpolicies. India is fast changing from sellers’ market to buyers’ market as competitionis intensifying in a large number of products; hence uncertainty of selling price andproduct demand are being realised as important risk factors. Uncertain governmentpolicies (in areas such as custom and excise duty and import policy), of course, , acontinuous source of investment risk in developing countries like India.
Sensitivity analysis and conservative forecasts are two equally important and widelyused methods of handling investment risk in India. Each of these techniques is usedby a number of Indian companies with other methods while many other companies useeither sensitivity analysis or conservative forecasts with other methods. Some companiesalso use shorter payback and inflated discount rates (risk-adjusted discount rates).
In US4 risk adjusted discount rate is used by 90 per cent companies while only 10 percent use payback and sensitivity analysis. This is also confirmed by another US studyby Petty and Scott (1981). In Rockley’s survey of the British companies only one firmout of 69 used sensitivity analysis.3 The contrasts in risk evaluation practices in India,on the one hand, and USA and UK, on the other, are sharp and significant. Given thecomplex nature of risk factors in developing countries, risk evaluation cannot be handledthrough a single number such as NPV calculation based on conservative forecasts orrisk-adjusted discount rate. Managers must know the impact on project profitability ofthe full range of critical variables. Hastie, an American businessman, strongly advocatesthe use of sensitivity analysis for risk handling and casts doubt on the survey resultsin USA. He states: ‘there appear to be more corporations using sensitivity analysisthan surveys indicate. In some cases firms may not know that what they are undertakingis called ‘sensitivity analysis’, and it probably is not in the sophisticated, computeroriented sense.....................Typically, analysts or middle managers eliminate thealternative assumptions and solutions in order to simplify the decision making processfor higher management”
Capital Rationing
Indian companies, by and large, do not have to reject profitable investment opportunitiesfor lack of funds, despite the capital markets not being so well developed. This maybe due to the existence of the government-owned financial system which is alwaysready to finance profitable projects. Indian companies do not use any mathematicaltechnique to allocate resources under capital shortage which may sometimes arise onaccount of internally imposed restrictions or management’s reluctance to raise capitalfrom outside. Priorities for allocating resources are determined by management, basedon the strategic need for and profitability of projects.


![College of Education Conceptual Framwork [2013]](https://static.documents.pub/doc/80x56/61aadba3561c04518a6977fe/college-of-education-conceptual-framwork-2013.jpg)


