Page 1
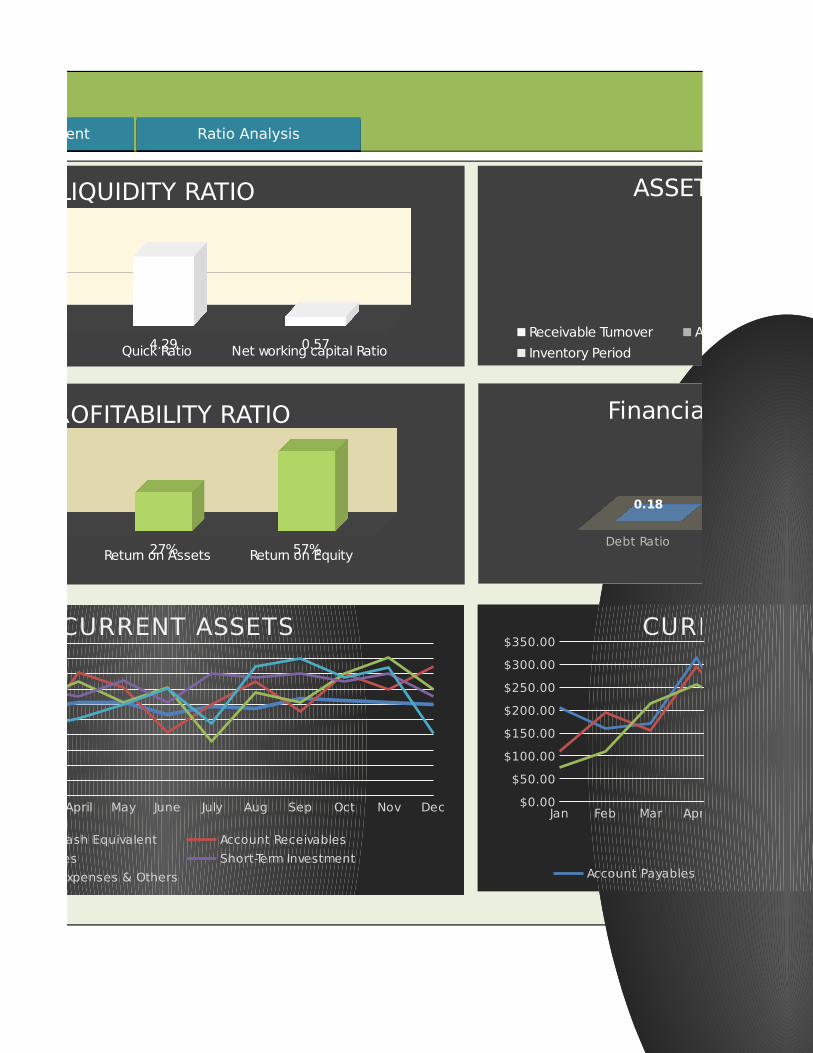
Lquidity Ratio ValueCurrent Ratio 5.42Quick Ratio 4.29Net working capital Ratio 0.57
Asset Turnover Ratio ValueReceivable Turnover 7.69Average Collection Period(in Days) 47.44Inventory Turnover 3.32Inventory Period 9.04
Profitability Ratio ValueGross Margin 56%Return on Assets 27%Return on Equity 57%
Financial Leverage Ratio ValueDebt Ratio 0.18Interest Coverage 30.71Debt to equity ratio 0.15
Values TotalTotal Assests $54,598Total Liabilities $9,868Stockholder equity $26,472
DashboardDashboard Balance SheetBalance Sheet Income StatementIncome Statement
Jan Feb Mar April May June July Aug Sep Oct Nov Dec$0.00
$100.00$200.00$300.00$400.00$500.00$600.00$700.00$800.00$900.00
$1,000.00CURRENT ASSETS
Cash & Cash Equivalent Account Receivables
Inventories Short-Term Investment
Prepaid Expenses & Others
Current Ratio Quick Ratio Net working capital Ratio0.00
2.00
4.00
6.00
5.42 4.29 0.57
LIQUIDITY RATIO
Gross Margin Return on Assets Return on Equity0%
20%
40%
60%
56% 27% 57%
PROFITABILITY RATIO
Financial Ratio Analysis Dashboard
$54,598$9,868
$26,472
Assests, Liabilities and Equity
Total Assests Total Liabilities Stockholder equity
Page 2
Income StatementIncome Statement Ratio AnalysisRatio Analysis
Jan Feb Mar April May June July Aug Sep Oct Nov Dec$0.00
$100.00$200.00$300.00$400.00$500.00$600.00$700.00$800.00$900.00
$1,000.00CURRENT ASSETS
Cash & Cash Equivalent Account Receivables
Inventories Short-Term Investment
Prepaid Expenses & Others
Jan Feb Mar April May June July Aug Sep Oct Nov Dec$0.00
$50.00
$100.00
$150.00
$200.00
$250.00
$300.00
$350.00CURRENT LIABILITIES
Account Payables Short-Term Debt Other Current Liabilities
Current Ratio Quick Ratio Net working capital Ratio0.00
2.00
4.00
6.00
5.42 4.29 0.57
LIQUIDITY RATIO
Gross Margin Return on Assets Return on Equity0%
20%
40%
60%
56% 27% 57%
PROFITABILITY RATIO
Debt Ratio Interest Coverage Debt to equity ratio
0.18
30.71
0.15
Financial Leverage Ratio
7.69
47.44
3.329.04
ASSET TURNOVER RATIO
Receivable Turnover Average Collection Period(in Days) Inventory Turnover
Inventory Period
Page 3
Jan Feb Mar April May June July Aug Sep Oct Nov Dec$0.00
$50.00
$100.00
$150.00
$200.00
$250.00
$300.00
$350.00CURRENT LIABILITIES
Account Payables Short-Term Debt Other Current Liabilities
Debt Ratio Interest Coverage Debt to equity ratio
0.18
30.71
0.15
Financial Leverage Ratio
7.69
47.44
3.329.04
ASSET TURNOVER RATIO
Receivable Turnover Average Collection Period(in Days) Inventory Turnover
Inventory Period
Page 4
Balance SheetAssests Jan Feb Mar
AssetsCurrent Assets
Cash & Cash Equivalent $555.00 $655.00 $570.00Account Receivables $302.00 $901.00 $407.00Inventories $450.00 $750.00 $633.00Short-Term Investment $375.00 $550.00 $705.00Prepaid Expenses & Others $250.00 $305.00 $450.00Total Current Assets $1,932.00 $3,161.00 $2,765.00
Long-Term Assets
Long-Term Investment $450.00 $300.00 $335.00Intangible Assets $450.00 $300.00 $335.00Other Assets $450.00 $300.00 $335.00Total Assests $3,282.00 $4,061.00 $3,770.00
Liabilities
Current Liabilities
Account Payables $205.00 $160.00 $170.00Short-Term Debt $110.00 $195.00 $155.00Other Current Liabilities $75.00 $110.00 $215.00Total Current Liabilities $390.00 $465.00 $540.00
Long-Term Liabililties
Long-Term Debt $150.00 $110.00 $90.00Other Liabilities $150.00 $110.00 $90.00Total Liabilities $690.00 $685.00 $720.00
Shareholder's Equity
Misc. Stock Option Warrant $185.00 $210.00 $225.00Redeemable Preferred $185.00 $210.00 $225.00Preferred Stock $185.00 $210.00 $225.00Common Stock $185.00 $210.00 $225.00Retained Earnings $185.00 $210.00 $225.00Treasury Stock $185.00 $210.00 $225.00
DashboardDashboard Balance SheetBalance Sheet Income StatementIncome Statement
Page 5
Capital Surplus $185.00 $210.00 $225.00Other Stockholder Equity $185.00 $210.00 $225.00
Total Stockholder Equity $1,480.00 $1,680.00 $1,800.00
Net Assets $5,452.00 $6,426.00 $6,290.00
Page 6
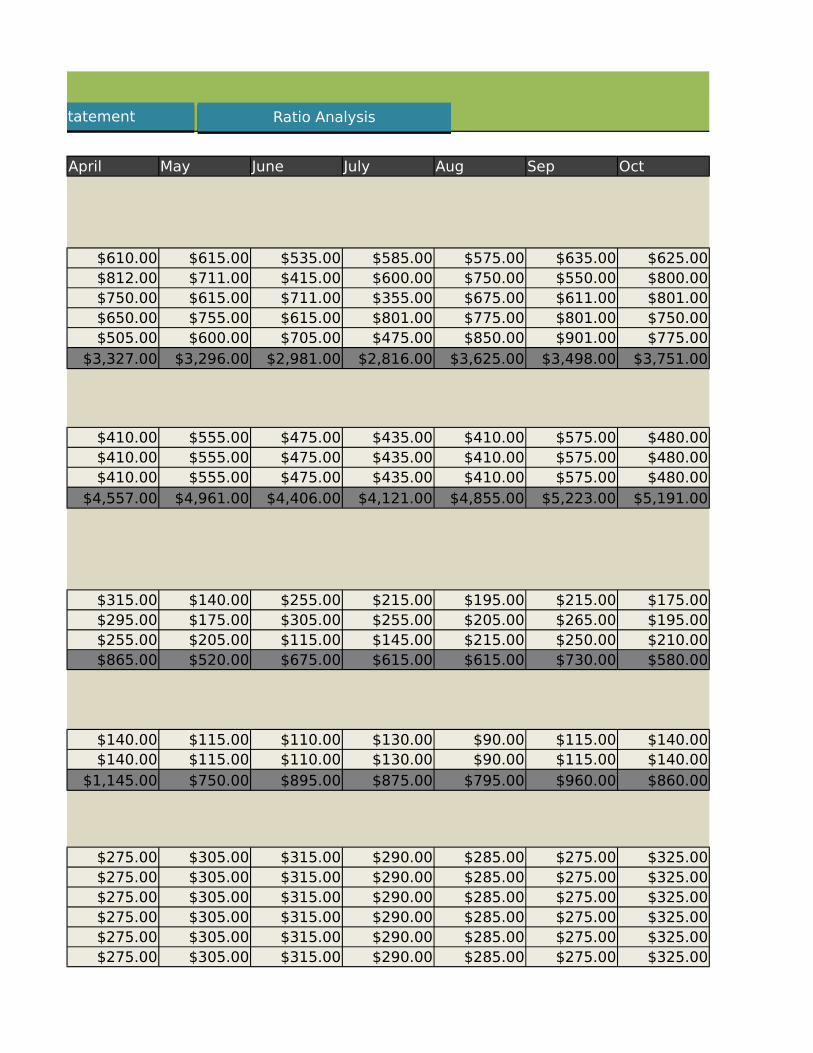
April May June July Aug Sep Oct
$610.00 $615.00 $535.00 $585.00 $575.00 $635.00 $625.00$812.00 $711.00 $415.00 $600.00 $750.00 $550.00 $800.00$750.00 $615.00 $711.00 $355.00 $675.00 $611.00 $801.00$650.00 $755.00 $615.00 $801.00 $775.00 $801.00 $750.00$505.00 $600.00 $705.00 $475.00 $850.00 $901.00 $775.00
$3,327.00 $3,296.00 $2,981.00 $2,816.00 $3,625.00 $3,498.00 $3,751.00
$410.00 $555.00 $475.00 $435.00 $410.00 $575.00 $480.00$410.00 $555.00 $475.00 $435.00 $410.00 $575.00 $480.00$410.00 $555.00 $475.00 $435.00 $410.00 $575.00 $480.00
$4,557.00 $4,961.00 $4,406.00 $4,121.00 $4,855.00 $5,223.00 $5,191.00
$315.00 $140.00 $255.00 $215.00 $195.00 $215.00 $175.00$295.00 $175.00 $305.00 $255.00 $205.00 $265.00 $195.00$255.00 $205.00 $115.00 $145.00 $215.00 $250.00 $210.00$865.00 $520.00 $675.00 $615.00 $615.00 $730.00 $580.00
$140.00 $115.00 $110.00 $130.00 $90.00 $115.00 $140.00$140.00 $115.00 $110.00 $130.00 $90.00 $115.00 $140.00
$1,145.00 $750.00 $895.00 $875.00 $795.00 $960.00 $860.00
$275.00 $305.00 $315.00 $290.00 $285.00 $275.00 $325.00$275.00 $305.00 $315.00 $290.00 $285.00 $275.00 $325.00$275.00 $305.00 $315.00 $290.00 $285.00 $275.00 $325.00$275.00 $305.00 $315.00 $290.00 $285.00 $275.00 $325.00$275.00 $305.00 $315.00 $290.00 $285.00 $275.00 $325.00$275.00 $305.00 $315.00 $290.00 $285.00 $275.00 $325.00
Income StatementIncome Statement Ratio AnalysisRatio Analysis
Page 7
$275.00 $305.00 $315.00 $290.00 $285.00 $275.00 $325.00$275.00 $305.00 $315.00 $290.00 $285.00 $275.00 $325.00
$2,200.00 $2,440.00 $2,520.00 $2,320.00 $2,280.00 $2,200.00 $2,600.00
$7,902.00 $8,151.00 $7,821.00 $7,316.00 $7,930.00 $8,383.00 $8,651.00
Page 8
Nov Dec Total Annualy
$610.00 $600.00 $7,170.00$700.00 $850.00 $7,798.00$905.00 $700.00 $7,956.00$801.00 $650.00 $8,228.00$845.00 $405.00 $7,066.00
$3,861.00 $3,205.00 $38,218.00
$510.00 $525.00 $5,460.00$510.00 $525.00 $5,460.00$510.00 $525.00 $5,460.00
$5,391.00 $4,780.00 $54,598.00
$155.00 $135.00 $2,335.00$185.00 $215.00 $2,555.00$195.00 $170.00 $2,160.00$535.00 $520.00 $7,050.00
$119.00 $100.00 $1,409.00$119.00 $100.00 $1,409.00$773.00 $720.00 $9,868.00
$320.00 $299.00 $3,309.00$320.00 $299.00 $3,309.00$320.00 $299.00 $3,309.00$320.00 $299.00 $3,309.00$320.00 $299.00 $3,309.00$320.00 $299.00 $3,309.00
Page 9
$320.00 $299.00 $3,309.00$320.00 $299.00 $3,309.00
$2,560.00 $2,392.00 $26,472.00
$8,724.00 $7,892.00 $90,938.00
Page 10
Income Statement
Jan Feb Mar AprilSales $5,000.00 $5,000.00 $5,000.00 $5,000.00Cost of Sales $2,200.00 $2,200.00 $2,200.00 $2,200.00Gross Profit $2,800.00 $2,800.00 $2,800.00 $2,800.00Selling Expenses $150.00 $150.00 $150.00 $150.00General and Admin. Expenses $500.00 $500.00 $500.00 $500.00Operating Profit $2,150.00 $2,150.00 $2,150.00 $2,150.00Interest Expense $70.00 $70.00 $70.00 $70.00EBIT $2,080.00 $2,080.00 $2,080.00 $2,080.00Income Tax 40% $832.00 $832.00 $832.00 $832.00
Net Income $1,248.00 $1,248.00 $1,248.00 $1,248.00
DashboardDashboard Balance SheetBalance Sheet Income StatementIncome Statement
Page 11
May June July Aug Sep Oct Nov$5,000.00 $5,000.00 $5,000.00 $5,000.00 $5,000.00 $5,000.00 $5,000.00$2,200.00 $2,200.00 $2,200.00 $2,200.00 $2,200.00 $2,200.00 $2,200.00$2,800.00 $2,800.00 $2,800.00 $2,800.00 $2,800.00 $2,800.00 $2,800.00
$150.00 $150.00 $150.00 $150.00 $150.00 $150.00 $150.00$500.00 $500.00 $500.00 $500.00 $500.00 $500.00 $500.00
$2,150.00 $2,150.00 $2,150.00 $2,150.00 $2,150.00 $2,150.00 $2,150.00$70.00 $70.00 $70.00 $70.00 $70.00 $70.00 $70.00
$2,080.00 $2,080.00 $2,080.00 $2,080.00 $2,080.00 $2,080.00 $2,080.00$832.00 $832.00 $832.00 $832.00 $832.00 $832.00 $832.00
$1,248.00 $1,248.00 $1,248.00 $1,248.00 $1,248.00 $1,248.00 $1,248.00
Income StatementIncome Statement Ratio AnalysisRatio Analysis
Page 12
Dec Total$5,000.00 $60,000.00$2,200.00 $26,400.00$2,800.00 $33,600.00
$150.00 $1,800.00$500.00 $6,000.00
$2,150.00 $25,800.00$70.00 $840.00
$2,080.00 $24,960.00$832.00 $9,984.00
$1,248.00 $14,976.00
Page 13
Financial RatiosJan Feb Mar April
Current Ratio 4.95 6.80 5.12 3.85Quick Ratio/Acid test 3.80 5.18 3.95 2.98Account Recievable Turnover $16.56 $5.55 $12.29 $6.16Average Collection Period (in Days) 1.812 5.406 2.442 4.872Inventory Turnover 4.89 2.93 3.48 2.93Days Sales in Inventory 6.14 10.23 8.63 10.23inventory to Networking Capital 0.29 0.28 0.28 0.30Debt Ratio 0.21 0.17 0.19 0.25Time Interest Earn to Income 30.71 30.71 30.71 30.71Total Assets to Equity 2.22 2.42 2.09 2.07Total Liabilities to Total Assets 0.21 0.17 0.19 0.25Total Liabilities to Equity 0.47 0.41 0.40 0.52Interest Bearing Debt to Equity 0.18 0.18 0.14 0.20Long-Term Debt to Long-Term Capital 0.09 0.06 0.05 0.06
Profitability RatiosReturn on Assets 0.38 0.31 0.33 0.27Return on Equity 0.84 0.74 0.69 0.57Gross Margin 0.56 0.56 0.56 0.56Operating Margin 0.43 0.43 0.43 0.43Profit Margin 0.25 0.25 0.25 0.25Total Assets Turnover 1.52 1.23 1.33 1.10Current Assets Turnover 2.59 1.58 1.81 1.50Dupont Return on Investment 0.38 0.31 0.33 0.27Modified Dupont Return on Equity 0.84 0.74 0.69 0.57
DashboardDashboard Balance SheetBalance Sheet Income StatementIncome Statement
Page 14
May June July Aug Sep Oct Nov6.34 4.42 4.58 5.89 4.79 6.47 7.225.16 3.36 4.00 4.80 3.95 5.09 5.53
$7.03 $12.05 $8.33 $6.67 $9.09 $6.25 $7.144.266 2.49 3.6 4.5 3.3 4.8 4.2
3.58 3.09 6.20 3.26 3.60 2.75 2.438.39 9.70 4.84 9.20 8.33 10.92 12.340.22 0.31 0.16 0.22 0.22 0.25 0.270.15 0.20 0.21 0.16 0.18 0.17 0.14
30.71 30.71 30.71 30.71 30.71 30.71 30.712.03 1.75 1.78 2.13 2.37 2.00 2.110.15 0.20 0.21 0.16 0.18 0.17 0.140.31 0.36 0.38 0.35 0.44 0.33 0.300.12 0.16 0.17 0.13 0.17 0.13 0.120.05 0.04 0.05 0.04 0.05 0.05 0.04
0.25 0.28 0.30 0.26 0.24 0.24 0.230.51 0.50 0.54 0.55 0.57 0.48 0.490.56 0.56 0.56 0.56 0.56 0.56 0.560.43 0.43 0.43 0.43 0.43 0.43 0.430.25 0.25 0.25 0.25 0.25 0.25 0.251.01 1.13 1.21 1.03 0.96 0.96 0.931.52 1.68 1.78 1.38 1.43 1.33 1.300.25 0.28 0.30 0.26 0.24 0.24 0.230.51 0.50 0.54 0.55 0.57 0.48 0.49
Income StatementIncome Statement Ratio AnalysisRatio Analysis
Page 15
Dec Total Annualy6.16 5.424.82 4.29
$5.88 $7.695.1 47.44
3.14 3.329.55 9.040.26 0.260.15 0.18
30.71 30.712.00 2.060.15 0.180.30 0.370.13 0.150.04 0.05
0.26 0.270.52 0.570.56 0.560.43 0.430.25 0.251.05 1.101.56 1.570.26 0.270.52 0.57