Financial results briefing for the 1Q of FY2017 (October 1, 2016-December 31, 2016) GMO Payment Gateway, Inc. February 6, 2017 (3769: Tokyo Stock Exchange Section - 1) http ://corp.gmo-pg.com/ The 48 th IR Meeting Growth acceleration toward 2020 target
Transcript
Financial results briefing for the 1Q of FY2017(October 1, 2016-December 31, 2016)
GMO Payment Gateway, Inc.
February 6, 2017
(3769: Tokyo Stock Exchange Section - 1) h t t p : / / c o r p . g m o - p g . c o m /
The 48th IR Meeting
Growth acceleration toward 2020 target
2Copyright (C) 1995 GMO Payment Gateway, Inc. All Rights Reserved.
The contents of this document are based on generally recognized economic and social conditions, as well as assumptions judged to be reasonable by GMO Payment Gateway as of February 6, 2017. However, please note that they are subject to change without prior notice in the event of changes in the business environment or other unforeseen occurrences.
A Note Aboutthe Contents of this Document
3Copyright (C) 1995 GMO Payment Gateway, Inc. All Rights Reserved.
1. Summary of Financial Results for 1Q FY2017
2. Performance Forecast of FY2017
3. Strategies for Future Growth
4. Financial Highlights
5. Reference Materials
Agenda
4Copyright (C) 1995 GMO Payment Gateway, Inc. All Rights Reserved.
1. Summary of Financial Results for 1Q FY2017
5Copyright (C) 1995 GMO Payment Gateway, Inc. All Rights Reserved.
(Million yen)
Consolidated results of 1Q,
FY2017(cumulative)
Consolidated results of 1Q, FY2016(cumulative)
Progress rate against plan
Actual Change Change% 1H Actual
Sales 4,346 2,732 1,614 59.1% 51.8% 23.2%
Gross income 3,237 2,117 1,119 52.9% - -
Operating income
1,201 870 330 37.9% 48.1% 24.0%
Ordinary income
1,109 924 184 20.0% 47.2% 23.7%
Net income 597 596 0 0.1% 42.4% 21.6%
EBITDA 1,356 952 404 42.4%
Number of operating stores(end of period)
Amount of processed payments (1Q estimate)
Number of processed payments (1Q estimate)
KPI 81,990 Approx.570 Billion Yen Approx. 249 Million
1.1 Summary①
Strong start: OP up 38%, EBITDA up 42%
* EBITDA=Operating income + Depreciation + Amortization of goodwill
6Copyright (C) 1995 GMO Payment Gateway, Inc. All Rights Reserved.
0
500
1,000
1,500
2,000
2,500
3,000
3,500
4,000
4,500
5,000
Sales Operating income Ordinary income Net income
Million yen
FY2016/1Q FY2017/1Q Plan FY2017/1QActual
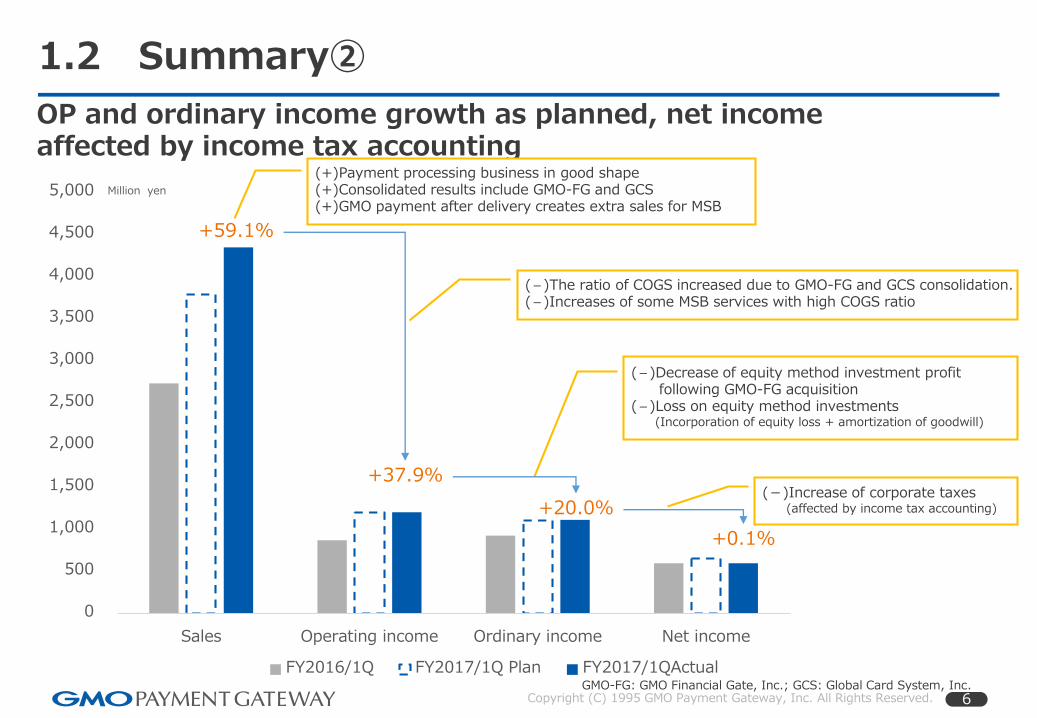
(-)Increase of corporate taxes(affected by income tax accounting)
(-)Decrease of equity method investment profit following GMO-FG acquisition
(-)Loss on equity method investments(Incorporation of equity loss + amortization of goodwill)
1.2 Summary②
OP and ordinary income growth as planned, net income affected by income tax accounting
+37.9%
+20.0%
+0.1%
+59.1%
(+)Payment processing business in good shape(+)Consolidated results include GMO-FG and GCS(+)GMO payment after delivery creates extra sales for MSB
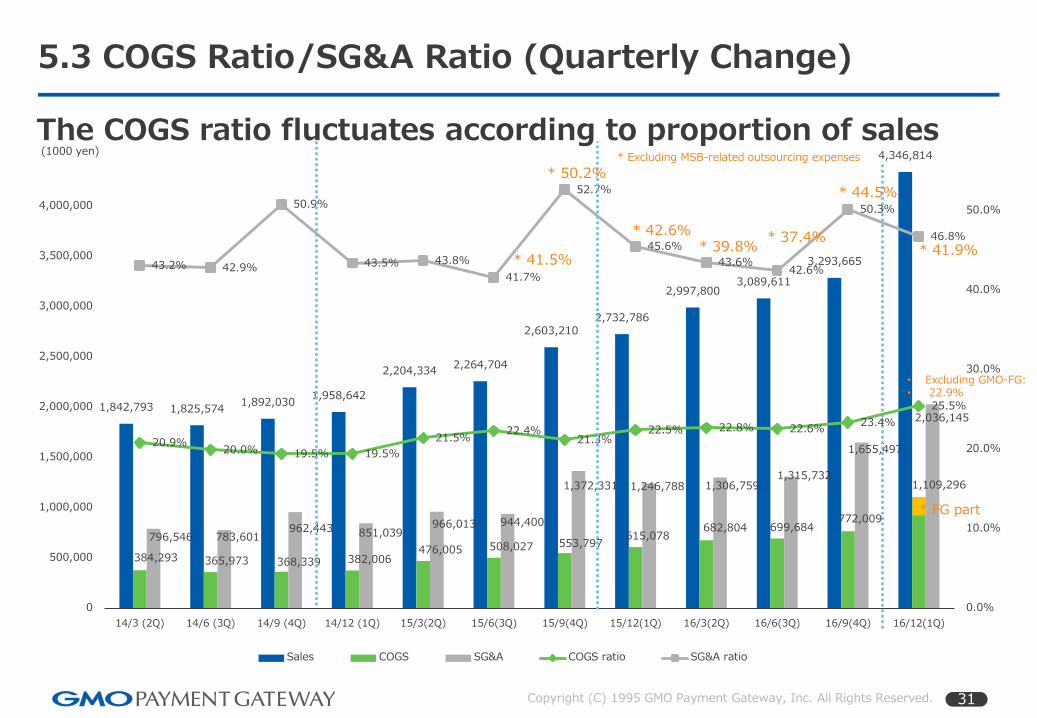
(-)The ratio of COGS increased due to GMO-FG and GCS consolidation.(-)Increases of some MSB services with high COGS ratio
GMO-FG: GMO Financial Gate, Inc.; GCS: Global Card System, Inc.
7Copyright (C) 1995 GMO Payment Gateway, Inc. All Rights Reserved.
0
500,000
1,000,000
(1,000 yen)
FY2014 FY2015 FY2016 FY2017
0
1,000,000
2,000,000
3,000,000
4,000,000
5,000,000
(1,000 yen)
FY2014 FY2015 FY2016 FY2017
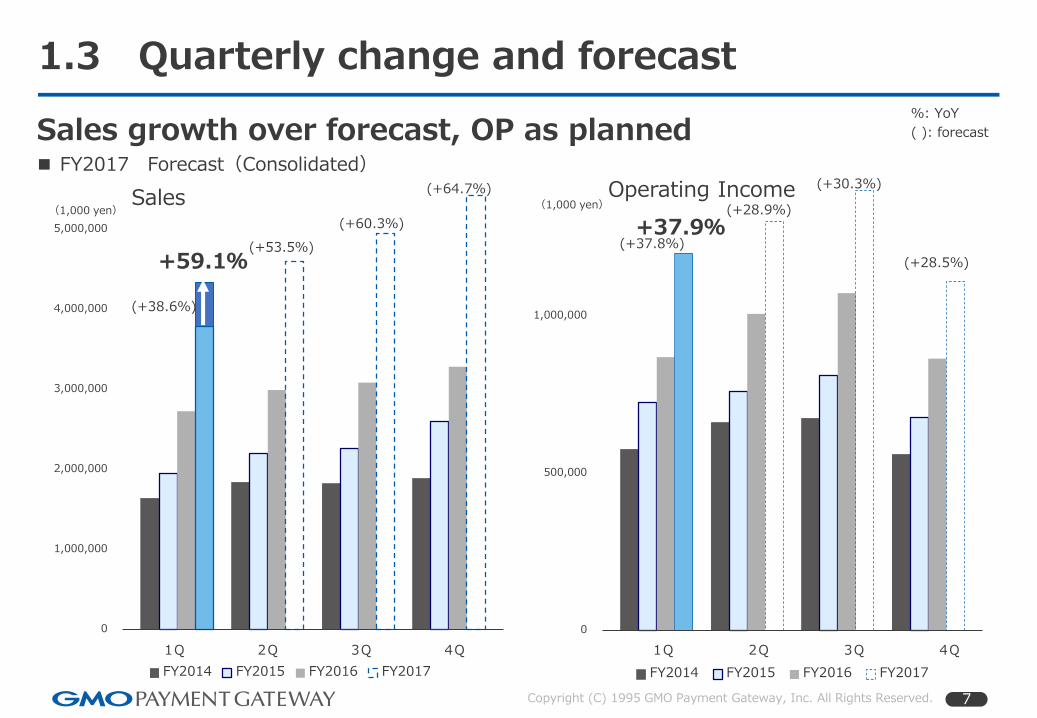
1.3 Quarterly change and forecast
Sales growth over forecast, OP as planned■ FY2017 Forecast(Consolidated)
%: YoY
( ): forecast
Sales Operating Income
(+38.6%)
(+37.8%)(+53.5%)
(+28.9%)(+60.3%)
(+30.3%)(+64.7%)
(+28.5%)
1Q 2Q 3Q 4Q 1Q 2Q 3Q 4Q
+59.1%
+37.9%
8Copyright (C) 1995 GMO Payment Gateway, Inc. All Rights Reserved.
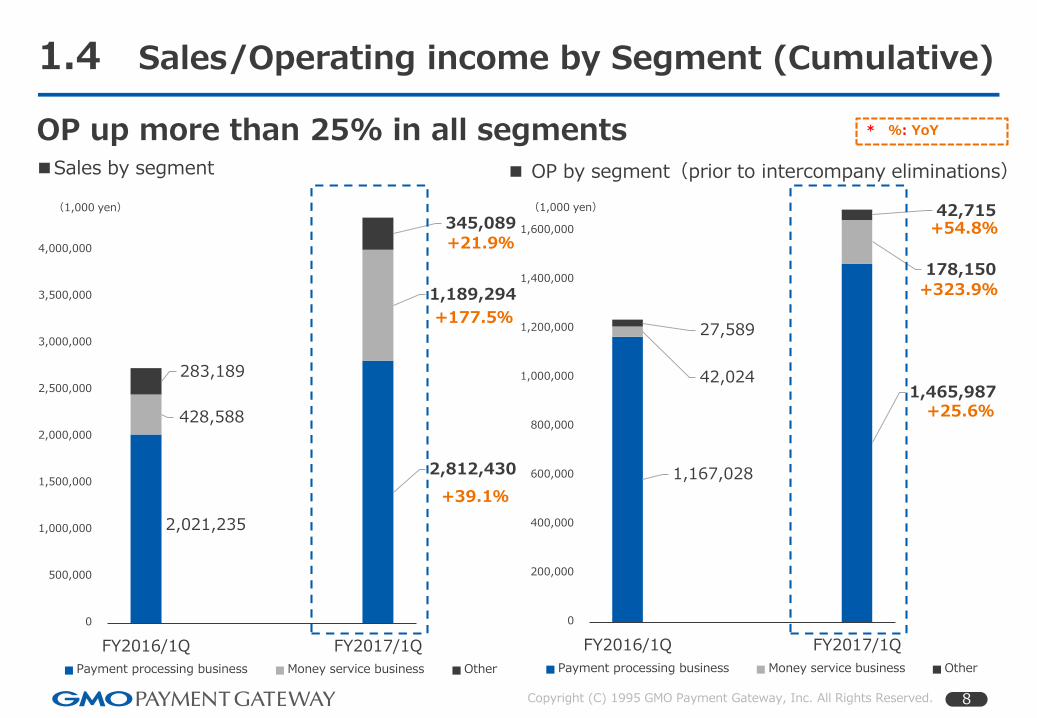
2,021,235
2,812,430
428,588
1,189,294
283,189
345,089
0
500,000
1,000,000
1,500,000
2,000,000
2,500,000
3,000,000
3,500,000
4,000,000
FY2016/1Q FY2017/1Q
(1,000 yen)
Payment processing business Money service business Other
1.4 Sales/Operating income by Segment (Cumulative)
1,167,028
1,465,98742,024
178,150
27,589
42,715
0
200,000
400,000
600,000
800,000
1,000,000
1,200,000
1,400,000
1,600,000
FY2016/1Q FY2017/1Q
(1,000 yen)
Payment processing business Money service business Other
OP up more than 25% in all segments * %: YoY
■ OP by segment(prior to intercompany eliminations)■Sales by segment
+39.1%
+177.5%
+21.9%
+25.6%
+323.9%
+54.8%
9Copyright (C) 1995 GMO Payment Gateway, Inc. All Rights Reserved.
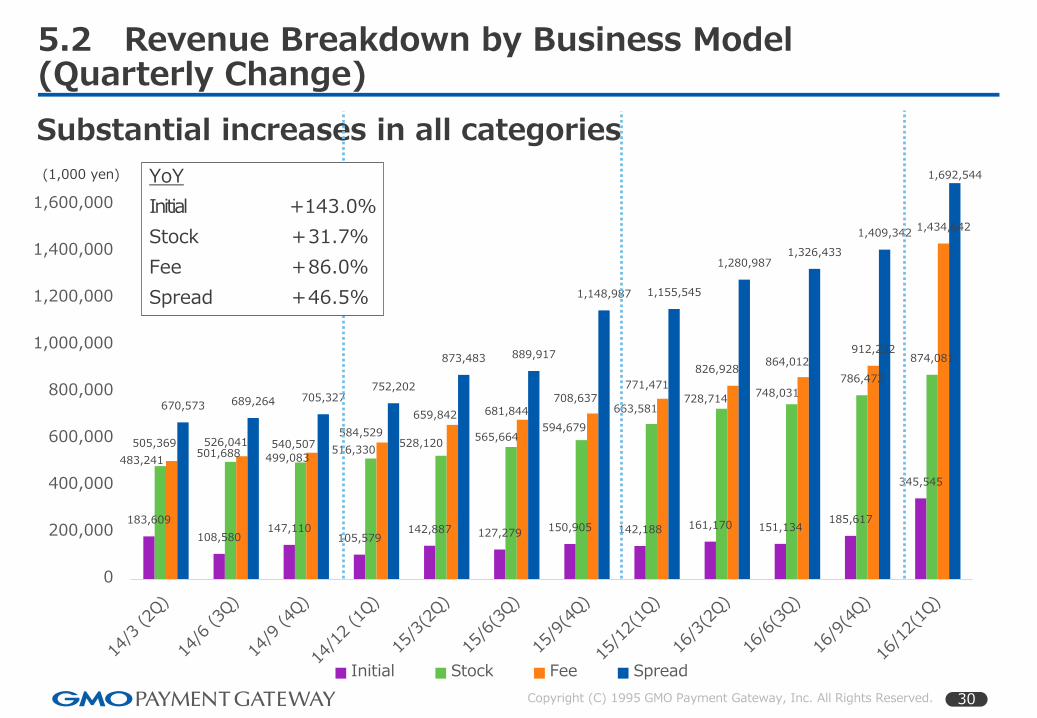
1.5 Revenue Breakdown by Business Model(Cumulative)
Spread revenue up 46.5%、Fee revenue up 86.0% due to GMO payment after delivery growth
142,188 345,545
663,581
874,081
771,471
1,434,6421,155,545
1,692,544
0
500,000
1,000,000
1,500,000
2,000,000
2,500,000
3,000,000
3,500,000
4,000,000
FY2016/1Q FY2017/1Q
(1,000 yen)
Initial Stock Fee Spread
Initial YoY+143.0%・System development and services for
large-sized enterprises・Cultivating major/high-growth merchants・Sales of payment terminals (GMO-FG)
Stock YoY+31.7%・Expansion of business with large-scale
merchants (banks, etc.)・Expansion of “Online Advertising Service”
Fee YoY+86.0%・Strong expansion of MSB (GMO payment
after delivery, Remittance Service)
Spread YoY+46.5%・MSB has continued to steadily grow
(Early payment・FL)・Amount of processed payments has
increased (up to 2 trillion yen in FY2017)
GMO-FG: GMO Financial Gate, Inc.
10Copyright (C) 1995 GMO Payment Gateway, Inc. All Rights Reserved.
2. Performance Forecast for FY2017
11Copyright (C) 1995 GMO Payment Gateway, Inc. All Rights Reserved.
2.1 Forecast (Summary)
OP forecast remains unchanged, up 31.2% excluding GMO payment after delivery growth
SalesOperating income
Ordinary income
Net income EBITDA
Full year 18,767 (54.9%) 5,013 (31.2%) 4,673 (23.6%) 2,762 (-5.1%) 5,811 (38.7%)
・Goodwill amortization due to the increase from group companies (total of ¥230 million)
・We plan to consolidate the income statement of MACROKIOSK from the second quarter accounting period and incorporate their income and losses over the nine months from October 1, 2016 to June 30, 2017.
・The part of ”GMO payment after delivery” offered to ZOZOTOWN (11/1 press release)
is not considered in the forecast
Non-operation expenses
・Goodwill amortization from equity-method affiliate is expected (About ¥160 million)
* EBITDA=Operating income + Depreciation + Amortization of goodwill
12Copyright (C) 1995 GMO Payment Gateway, Inc. All Rights Reserved.
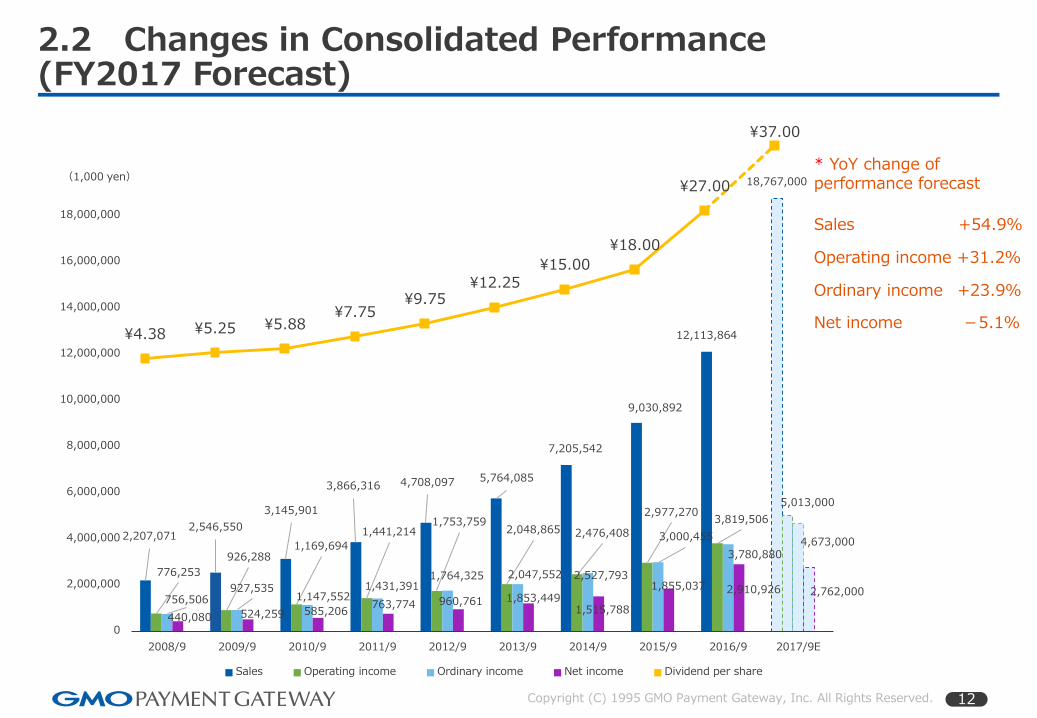
Sales Operating income Ordinary income Net income Dividend per share
2.2 Changes in Consolidated Performance (FY2017 Forecast)
* YoY change of performance forecast
Sales +54.9%
Operating income +31.2%
Ordinary income +23.9%
Net income -5.1%¥4.38 ¥5.25 ¥5.88
¥7.75 ¥9.75
¥12.25 ¥15.00
¥18.00
¥27.00
¥37.00
13Copyright (C) 1995 GMO Payment Gateway, Inc. All Rights Reserved.
3. Strategies for Future Growth
14Copyright (C) 1995 GMO Payment Gateway, Inc. All Rights Reserved.
■Development of FinTech environment: to revise Law of Financial Services Agency,
plan to introduce a registration system for “online payment processing service
providers” (Nikkei, Jan 27th, 2017)・Positive law revision for major companies with strong financial structure and security infrastructure・Expansion of business opportunities through collaboration with financial institutions
■Establishment of revised Installment Sales Act: to be enforced in 2018・It is necessary to strengthen security to prevent data leakage incidents and adopt more effective fraud
prevention systems・Major E-commerce enterprises need to consider the usage of payment processing service from the principle
of self-sufficiency
■Expansion of payment methods by smartphone: ”Apple Pay”, etc.・Full scale expansion of market for card-present cashless payments・Started approach to growth areas of card-present market by acquiring GMO-FG and GCS.
3.1 Industry topics
Our position regarding recent issues
GMO-FG: GMO Financial Gate, Inc.; GCS: Global Card System, Inc.
15Copyright (C) 1995 GMO Payment Gateway, Inc. All Rights Reserved.
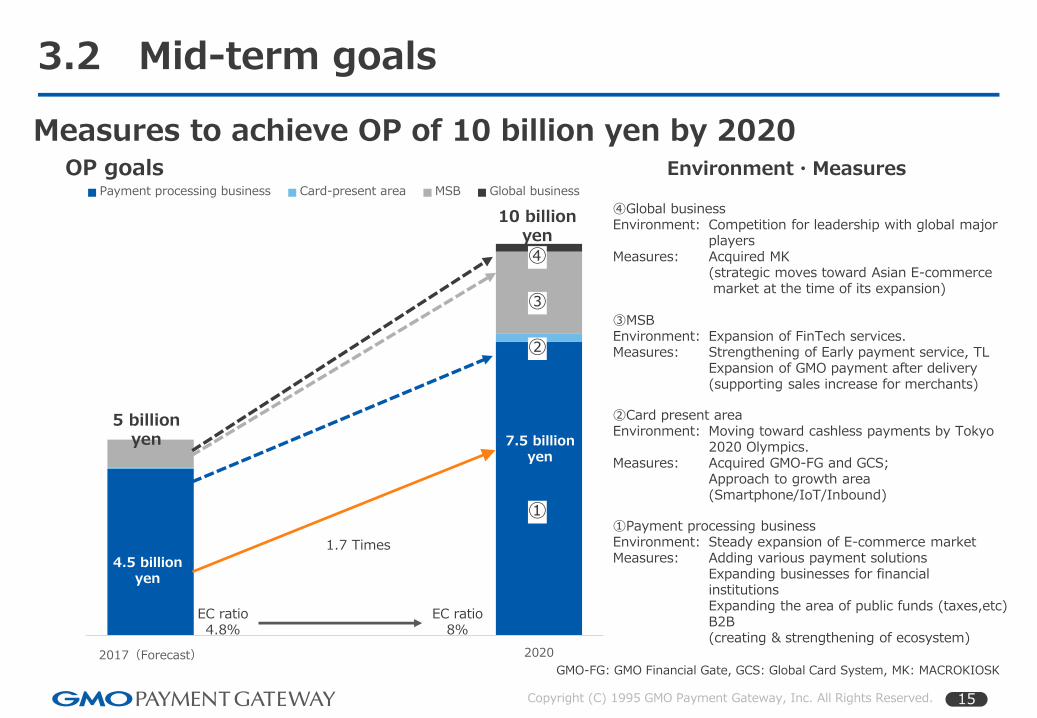
2017(Forecast) 2020
Payment processing business Card-present area MSB Global business
10 billion yen
5 billion yen
OP goals
①Payment processing businessEnvironment: Steady expansion of E-commerce marketMeasures: Adding various payment solutions
Expanding businesses for financial institutionsExpanding the area of public funds (taxes,etc)B2B(creating & strengthening of ecosystem)
③MSBEnvironment: Expansion of FinTech services.Measures: Strengthening of Early payment service, TL
Expansion of GMO payment after delivery(supporting sales increase for merchants)
②Card present areaEnvironment: Moving toward cashless payments by Tokyo
2020 Olympics.Measures: Acquired GMO-FG and GCS;
Approach to growth area(Smartphone/IoT/Inbound)
④Global businessEnvironment: Competition for leadership with global major
playersMeasures: Acquired MK
(strategic moves toward Asian E-commercemarket at the time of its expansion)
EC ratio4.8%
EC ratio8%
Measures to achieve OP of 10 billion yen by 2020
3.2 Mid-term goals
①
②
③
④
Environment・Measures
4.5 billionyen
7.5 billionyen
1.7 Times
GMO-FG: GMO Financial Gate, GCS: Global Card System, MK: MACROKIOSK
16Copyright (C) 1995 GMO Payment Gateway, Inc. All Rights Reserved.
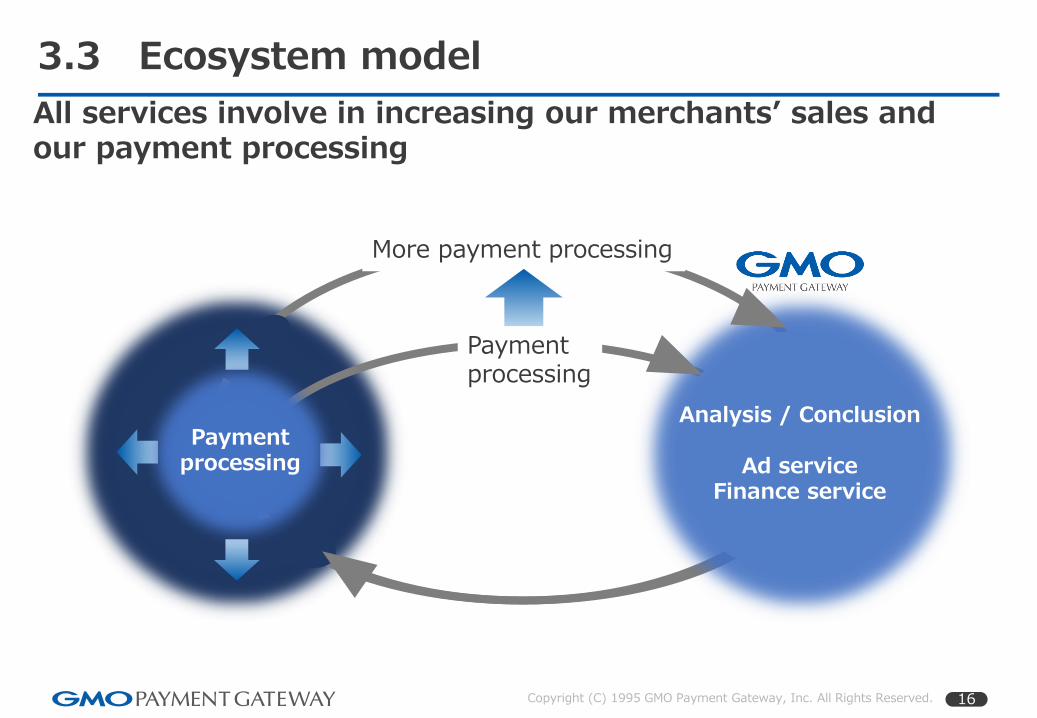
Analysis / Conclusion
Ad serviceFinance service
Paymentprocessing
More payment processing
All services involve in increasing our merchants’ sales and our payment processing
Payment processing
3.3 Ecosystem model
17Copyright (C) 1995 GMO Payment Gateway, Inc. All Rights Reserved.
Expanding services other than online credit card payments
Changes in amount of non-credit card payments processed (Online)
24.6 times
15.2 times
4.5 times
(Scale factor: comparison to2010)
Amount of major types of non-credit card payments processed (Online) and
of card-present payments
CVC(prepaid) CVC(deferred payment)
account transfer FG
18Copyright (C) 1995 GMO Payment Gateway, Inc. All Rights Reserved.
Payment processing service
Remittance service (money transfer business)
TL, Lease, Factoring
Direct payment account
Banking app
P2P remittance
Key component
Analysis of big data
Authentication technology
Real time communication
Cashout
Fraud prevention
Rationalization/labor saving
Credit decision
Service AI(machine learning/deep learning)
Complementation and coexistence of existing financial services
Replacement of existing financial services
3.5 Payment processing business:Services for financial institutions
Delivering value as a “Rebundling player” of FinTech
Expansion of FinTech services focusing on ”Banking app“
19Copyright (C) 1995 GMO Payment Gateway, Inc. All Rights Reserved.
Order receiving
Invoice issuing
3.6 Payment processing business: B2B
New measures to accelerate B2B market cultivation
Supplie
r
Buyer
Shipment / inspection
Payment
Cloud billing
EDI
Payment package for B2B E-commerce
B2B EC market:288 tr. yen*
We will establish a firm position as an industry standard B2B payment platform
・Added “Paid” in ”Payment package for B2B E-commerce”(service launch is April 2017)
Large scale(manufacturing
industry・construction, etc.)
Medium scale(wholesale, etc.)
Small scale(retailing, etc.)
*Reference: METI “Results of the E-Commerce Market Survey Complied (2015)
Partner
・Collaboration with external partners and expansion of partnership-Partnership with cloud billing business-Collaboration with Zuora (supporting subscription-based business)
Credit card payment
Account transfer
Virtual Account
Bank Transfer Paid
20Copyright (C) 1995 GMO Payment Gateway, Inc. All Rights Reserved.
3.7 Payment processing business: Taxes
Started operation of “National tax payment website”
+
(URL: https://kokuzei.noufu.jp/ )
21Copyright (C) 1995 GMO Payment Gateway, Inc. All Rights Reserved.
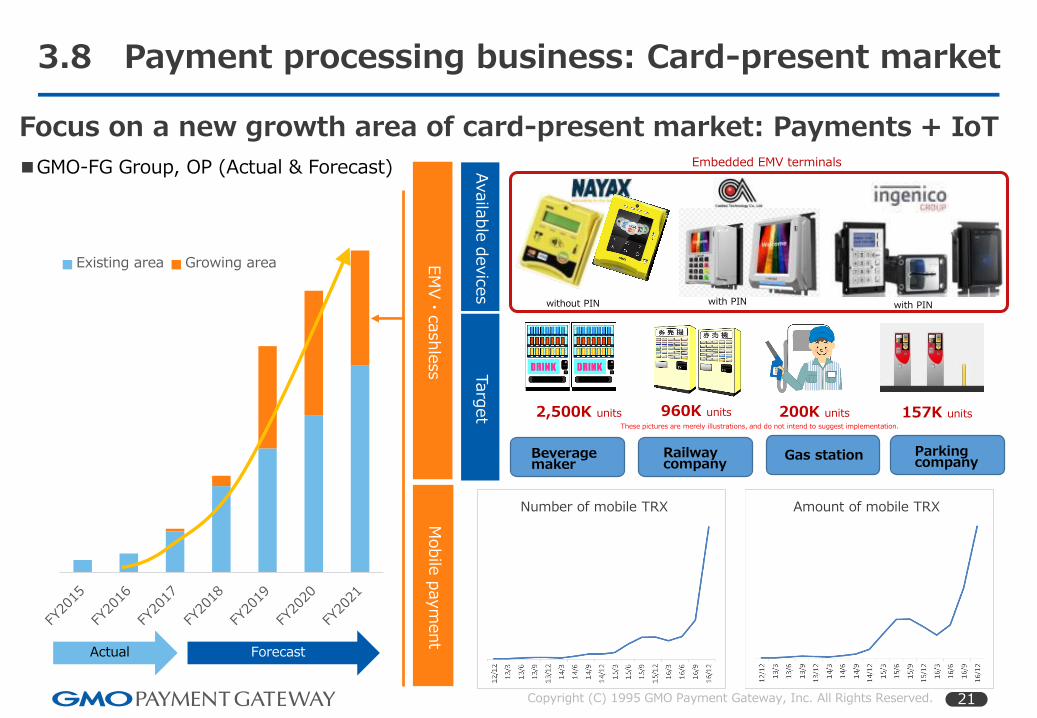
Focus on a new growth area of card-present market: Payments + IoT
2,500K units 960K units 200K units 157K units
without PIN with PIN with PIN
Embedded EMV terminals
Beverage maker
Railway company
Gas station Parking company
These pictures are merely illustrations, and do not intend to suggest implementation.
Availa
ble
devic
es
Targ
et
EM
V・
cashle
ssM
obile
paym
ent
Existing area Growing area
Actual Forecast
■GMO-FG Group, OP (Actual & Forecast)
Number of mobile TRX Amount of mobile TRX
22Copyright (C) 1995 GMO Payment Gateway, Inc. All Rights Reserved.
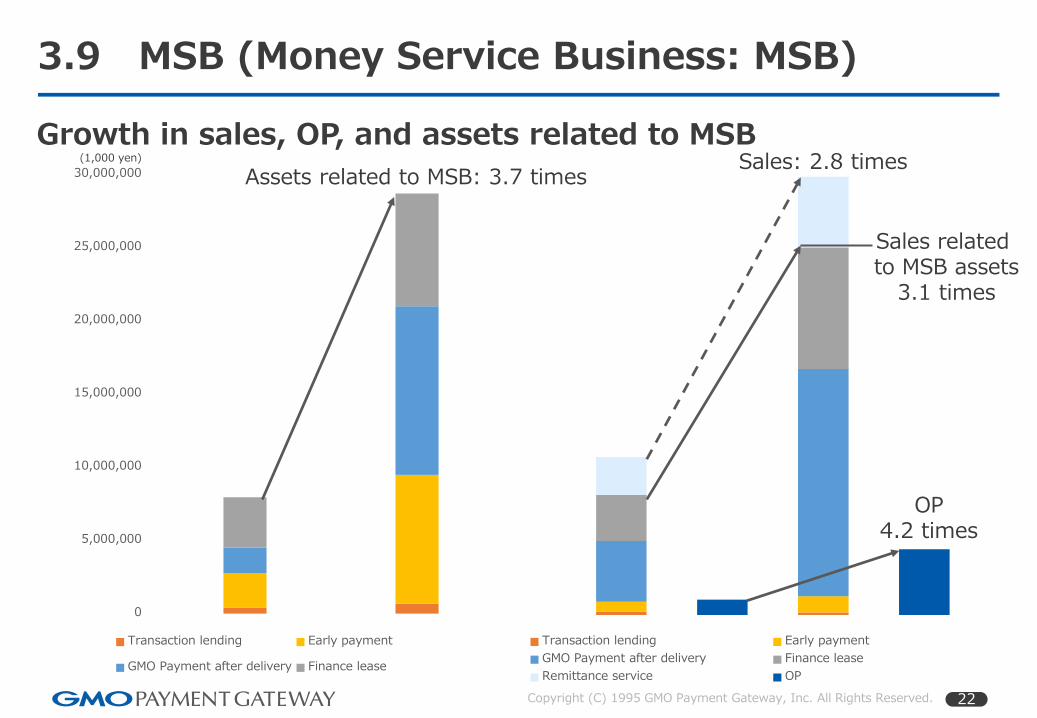
3.9 MSB (Money Service Business: MSB)
Growth in sales, OP, and assets related to MSB
0
5,000,000
10,000,000
15,000,000
20,000,000
25,000,000
30,000,000
Transaction lending Early payment
GMO Payment after delivery Finance lease
Transaction lending Early payment
GMO Payment after delivery Finance lease
Remittance service OP
Assets related to MSB: 3.7 timesSales: 2.8 times
Sales related to MSB assets
3.1 times
OP4.2 times
(1,000 yen)
23Copyright (C) 1995 GMO Payment Gateway, Inc. All Rights Reserved.
■MK 2016: Changes in SMS traffic
3.10 Business expansion: MACROKIOSK
Increased number of mobile transactions as the usage of online accounts grows.Acquired orders from finance and transport related businesses in Indonesia and the Philippines.
■MK October-December 2016: major orders
Orders from transport-related businessesdeploying in SEA
Orders from major financial institution in
the Philippines
Philippines
Orders from foreign financial
institutions
Acquired orders from financial institutions in each county.In Indonesia the service is available for transport-relatedbusinesses
Indonesia
100108
125132
0
20
40
60
80
100
120
140
160
Jan-Mar Apr-Jun Jul-Sep Oct-Dec
(January-March period is set as 100)
Joined GMO-PG in August 2016
24Copyright (C) 1995 GMO Payment Gateway, Inc. All Rights Reserved.
4. Financial Highlights
25Copyright (C) 1995 GMO Payment Gateway, Inc. All Rights Reserved.
Short-term debt of 4 billion yen due to MSB expansion
(Million yen)Results for 1Q,
FY2017Results for 1Q,
FY2016 Change
Current assets 68,067 44,807 23,260
Cash and deposits 34,256 33,772 483
Lease receivable 7,696 3,440 4,256
Advance payments 8,795 2,373 6,422
Accounts receivable 11,527 1,590 9,936
Allowance for doubtful accounts
(605) (223) (381)
Other current assets 6,396 3,853 2,543
Noncurrent assets 9,815 5,306 4,509
Tangible assets 335 214 120
Intangible assets 3,855 1,009 2,845
Goodwill 2,238 24 2,214
Software 1,245 737 508
Investments and other assets
5,624 4,082 1,542
Investment securities 2,442 2,837 (394)
Shares of subsidiaries
and affiliates2,418 279 2,139
Total assets 77,883 50,113 27,769
(Million yen)Results for 1Q, FY2017
Results for 1Q, FY2016 Change
Current liabilities 58,677 33,764 24,913
Short-term debt 4,050 0 4,000
Deposits received 36,827 29,278 7,549
Accounts payable 13,204 2,671 10,533
Other currentliabilities
4,596 1,815 2,781
Noncurrent liabilities 308 211 97
Shareholders’ equity17,891 15,995 1,895
Capital stock 4,712 4,712 0
Total cumulative other comprehensive income
43 140 (97)
Total net assets 18,897 16,137 2,759
Total liabilities andnet assets
77,883 50,113 27,769
Deposits by merchants through representative merchant
service
*Discrepancy occurs with the pace of merchants’ sales growth
due to change in merchants’ cutoff date and payment cycle
Increase in investment securities of subsidiaries and affiliates
Increase in payment after delivery
Related to Finance Lease
Increase in Early Payment Service
4.1 Consolidated Balance Sheet
Short-term loan receivables (=TL-related assets) is included in “Other current assets”
26Copyright (C) 1995 GMO Payment Gateway, Inc. All Rights Reserved.
4.2 Cash flow chart
Borrowed approx. 4 billion yen at the end of October due to MSB expansion
FY2016 FY 20171Q
Operating activities CF -748 6,685
Investing activities CF -3,415 -656
Financing activities CF -654 2,983
Effect of exchange rate changes on cash -107 4
Cash increase/decrease -4,926 9,016
Cash at the end of the period 25,187 34,203
(Million yen)
27Copyright (C) 1995 GMO Payment Gateway, Inc. All Rights Reserved.