20
Financial Results for the Fiscal Year Ending March 2017 (Apr. 2016 – Sep. 2016) Nov. 11, 2016 November 2016

Financial Results for the Fiscal Year Ending March 2017 (Apr. 2016 – Sep. 2016)
Nov. 11, 2016
November 2016

ABBREVIATION LISTS 2
NISH: Nisshinbo Holdings Inc. The followings are consolidated subsidiaries of NISH. JRC: Japan Radio Co., Ltd. NJR: New Japan Radio Co., Ltd. NJRC: Nagano Japan Radio Co., Ltd. UJRC: Ueda Japan Radio Co., Ltd. NISB: Nisshinbo Brake Inc. NISM: Nisshinbo Mechatronics Inc. NISC: Nisshinbo Chemical Inc. NIST: Nisshinbo Textile Inc. NISP: Nisshinbo Paper Products Inc.

3
Mission
Value
Domain
Strategy
Philosophy
May 13, 2016
Management Policy
Corporate Philosophy Public Entity, Consistent Integrity, Innovation Business Conduct Guidelines
Providing solutions to sustainable society as an “environmental and energy company” group
Environment, Safety/Security, Disaster prevention, Health, Comfort, Sustainability, Convenience/Smart
Strategic Business Domains ①Wireless Communications and Electronics ②Automotive Parts and Devices ③Lifestyle and Materials ④New Energy and Smart Society
①M&A ②Expansion of the existing domains ③R&D

CORPORATE VALUE OF NISSHINBO GROUP -As an Environmental and Energy company Group-
Corporate Philosophy Public Entity
Consistent Integrity Innovation
Business Conduct Guideline
Compliance
Environment
Human Rights
Workplace(Safety)
Product Safety
Procurement
Co
rpo
rate
cu
lture
(E
nh
an
ce
me
nt o
f ma
na
ge
me
nt q
ua
lity)
Improvement of performance (Quantitative growth)
Corporate Governance
Technology & Marketing
Diversity
Communication
CSR
Return to Shareholders
ROE, ROA
Strategic Business Domains (Portfolio)
M & A
Net Sales: 1 trillion yen ROE: 12%
Long-term Strategic plan FY2026
Drive Productivity and Performance, Inspire Creativity and Innovation
Environmental management
Cash floe management
Global management
New era of Technological Innovation & Super Smart Society
4
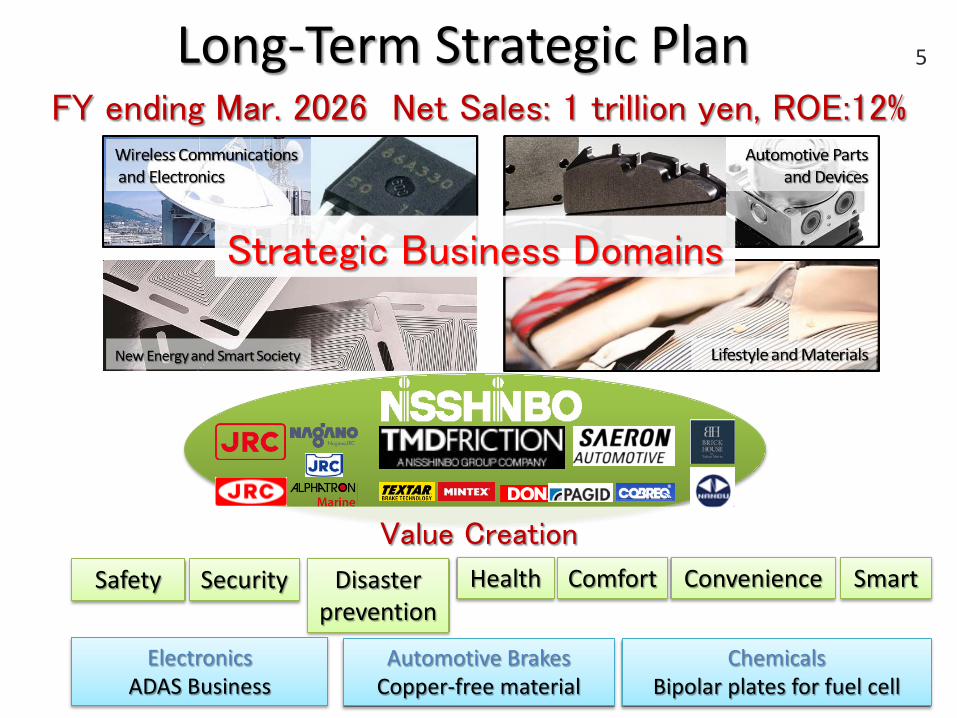
Long-Term Strategic Plan FY ending Mar. 2026 Net Sales: 1 trillion yen, ROE:12%
Safety Security Disaster prevention
Health Comfort Convenience Smart
Electronics ADAS Business
Automotive Brakes Copper-free material
Chemicals Bipolar plates for fuel cell
Value Creation
5
Strategic Business Domains

2Q Results(yr/yr) Net Sales Decrease 6
Nov 11, 2016

2Q Results(yr/yr) Operating Profit Decrease 7
Nov 11, 2016

2Q Results Net income(yr/yr) 8
Nov 11, 2016

Full year Forecast
9
Nov 11, 2016

Full year FC (vs Target) Net Sales 10
Nov 11, 2016

Full year FC (vs Target) Operating Profit 11
Nov 11, 2016

Full year FC (yr/yr) Net Sales 12
Nov 11, 2016
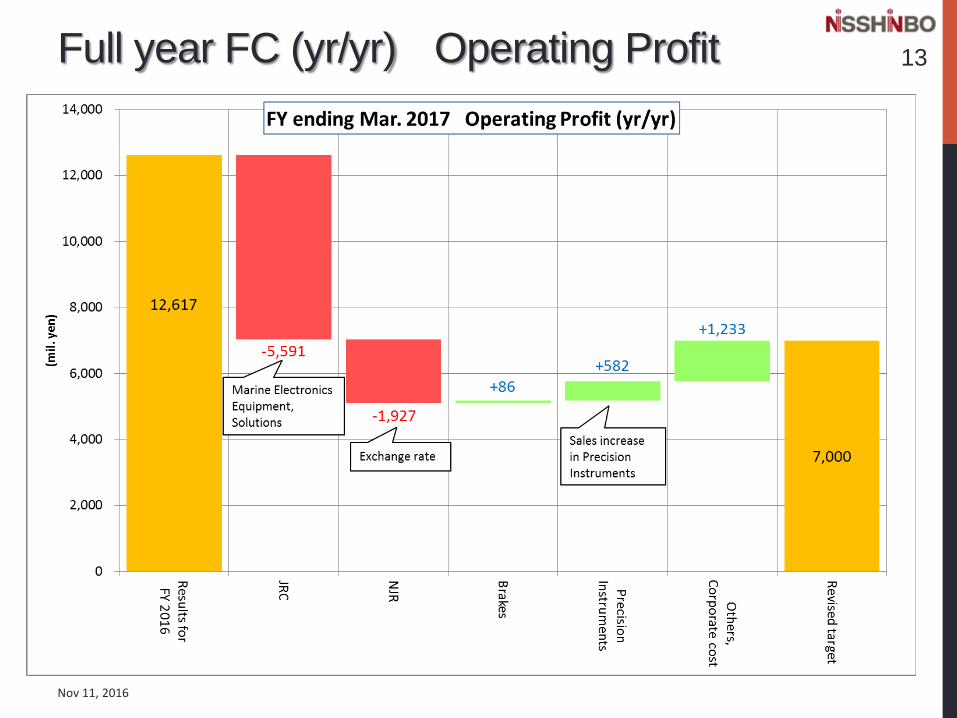
Full year FC (yr/yr) Operating Profit 13
Nov 11, 2016

FY ENDING MAR. 2017 DOWNWARD REVISION
14
Nov 11, 2016
(mil. yen)
Revised FCfor FY 2017
Original FCfor FY 2017
Results forFY 2016
Results forApr.-Sep
2016
FC forApr.-Sep
2016
Results forApr.-Sep
2015
Net sales 197,000 214,000 205,367 76,017 77,000 85,352 Operating income 800 9,400 8,318 ▲ 5,565 ▲ 900 65 Net sales 147,000 163,100 165,037 74,562 80,500 84,107 Operating income ▲ 800 ▲ 500 ▲ 886 ▲ 499 ▲ 600 ▲ 316 Net sales 60,100 60,700 29,525 29,943 29,800 15,009 Operating income 900 1,400 318 435 100 252 Net sales 10,400 10,500 8,285 4,065 4,500 3,967 Operating income 1,300 1,200 753 581 300 293 Net sales 55,700 56,800 57,503 26,979 28,000 28,675 Operating income 1,800 2,300 1,872 857 1,100 889 Net sales 32,700 34,000 32,584 15,400 15,700 15,463 Operating income 2,300 1,600 742 1,053 700 362 Net sales 8,300 8,200 8,357 4,107 3,800 4,103 Operating income 5,100 5,100 5,795 2,917 2,500 2,770 Net sales 20,800 22,700 27,327 13,211 10,700 13,192 Operating income 400 300 ▲ 217 26 100 ▲ 172 Net sales - - - - - - Operating income ▲ 4,800 ▲ 4,800 ▲ 4,076 ▲ 2,105 ▲ 2,300 ▲ 2,040
Net sales 532,000 570,000 533,989 244,287 250,000 249,870
Operating income 7,000 16,000 12,617 ▲ 2,298 1,000 2,105 Ordinary income 11,000 21,000 17,034 563 3,000 5,462 Net inome 5,000 10,000 10,775 834 2,000 2,510
Exchange rate JPY/USD 105.00 120.00 121.03 111.80 120.00 120.48(Average) JPY/EUR 115.00 130.00 133.69 124.36 130.00 133.83
Business Segment
Electronics
Brakes
Precisioninstruments
Chemicals
Total
Textiles
Papers
Real estate
Others
Corporate/Elliminations

TOPICS(1) 15
Nov 11, 2016
Corporate Governance
We have formulated a Corporate Governance Policy to make our business more transparent and support rapid, bold decision-making and generate sustained growth and increase corporate value.
After securing approval at the General Shareholder’s Meeting in June, we have reduced the number of directors from 13 to 10, with no change in the number of four outside directors.
We have voluntarily established a Nomination Committee and a Remuneration Committee to improve management transparency.

TOPICS(2) 16
Nov 11, 2016
Kawagoe site of Japan Radio Japan Radio has established a business site in Fujimino, which focuses on system engineering solutions.

APPENDIX1
Nov 11, 2016
17
Net salesOperatingincome
Net salesOperatingincome
Net salesOperatingincome
Net salesOperatingincome
Net salesOperatingincome
Net salesOperatingincome
Net salesOperatingincome
JRC 150,000 -1,000 165,000 5,400 58,500 -2,500 -16,879 -4,758 52,341 -6,550 125,192 3,183 45,802 -2,353
NJR 48,000 1,200 50,000 3,200 24,600 1,450 190 -1,255 24,058 645 47,817 3,127 23,868 1,900
NJRC 32,481 586 15,244 149
UJRC 16,808 743 8,174 412
198,000 200 215,000 8,600 83,100 -1,050 -16,689 -6,013 76,399 -5,905 222,298 7,639 93,088 108
Elimination -1,000 600 -1,000 800 -6,100 150 7,354 383 -382 340 -16,931 679 -7,736 -43
Total 197,000 800 214,000 9,400 77,000 -900 -9,335 -5,630 76,017 -5,565 205,367 8,318 85,352 65
Net salesOperatingincome
Net salesOperatingincome
Net salesOperatingincome
Net salesOperatingincome
Net salesOperatingincome
Net salesOperatingincome
Net salesOperatingincome
JPN
NISB 24,800 1,200 25,500 1,100 12,500 500 -597 77 12,268 535 25,272 1,142 12,865 458
NISB Subsidiaries 43,200 5,000 46,800 5,000 22,000 1,900 -2,986 -180 20,391 2,636 45,699 5,722 23,377 2,816
TMD group 86,800 -50 98,800 800 50,000 700 -6,142 -237 44,696 -87 99,787 -22 50,838 150
Overseas total 130,000 4,950 145,600 5,800 72,000 2,600 -9,128 -417 65,087 2,549 145,486 5,700 74,215 2,966
Sub total 154,800 6,150 171,100 6,900 84,500 3,100 -9,725 -340 77,355 3,084 170,758 6,842 87,080 3,424
-7,800 -6,950 -8,000 -7,400 -4,000 -3,700 180 157 -2,793 -3,583 -5,721 -7,728 -2,973 -3,740
Total 147,000 -800 163,100 -500 80,500 -600 -9,545 -183 74,562 -499 165,037 -886 84,107 -316
Operatingincome
Operatingincome
Operatingincome
Operatingincome
Operatingincome
Operatingincome
Operatingincome
(a) NISB (JPN + Overseas) 6,200 6,100 2,400 -103 3,171 6,864 3,274
(b)TMD 1,200 2,200 1,400 -354 597 1,725 951
(c) TMD (Adjustment for Japaneseaccounring standard) -2,300 -2,400 -1,200 27 -1,215 -2,899 -1,242
5,100 5,900 2,600 -429 2,553 5,690 2,982
-5,900 -6,400 -3,200 247 -3,052 -6,576 -3,299
-800 -500 -600 -183 -499 -886 -316
Exchange rate JPY/EUR 115.00 130.00 130.00 (9.47) 124.36 133.69 133.83
Electronics
Mar. 2017 est.revised on 27 Oct.
Mar. 2017 est.on 13 May
Apr.-Sep. 2016 est.on 13 May
Mar. 2016Change Apr.-Sep. 2016 Apr.-Sep. 2015
Sub total
Brakes
Mar. 2017 est.revised on 27 Oct.
Mar. 2017 est.on 13 May
Apr.-Sep. 2016 est.on 13 May
Change Mar. 2016 Apr.-Sep. 2015Apr.-Sep. 2016
Operating income
Overs
eas
Elimination
Breakdown of operating income
Operating income beforegoodwill amortization
Goodwill amortization

APPENDIX2
Nov 11, 2016
18
Net salesOperatingincome
Net salesOperatingincome
Net salesOperatingincome
Net salesOperatingincome
Net salesOperatingincome
Net salesOperatingincome
Net salesOperatingincome
NISM 8,700 0 8,500 0 4,100 -100 -833 68 4,051 21 9,958 -105 4,884 -47
Subsidiaries 5,800 550 5,300 400 2,500 100 673 127 2,812 175 4,325 17 2,139 48
Sub total 14,500 550 13,800 400 6,600 0 -160 195 6,863 196 14,283 -88 7,023 1
NISM 4,600 50 4,600 100 2,500 0 201 119 2,562 76 4,801 -43 2,361 -43
Subsidiaries 43,500 1,200 44,800 1,700 21,900 600 14,631 315 22,223 632 13,663 491 7,592 317
Sub total 48,100 1,250 49,400 1,800 24,400 600 14,832 434 24,785 708 18,464 448 9,953 274
Elimination -2,500 -900 -2,500 -800 -1,200 -500 262 -446 -1,705 -469 -3,222 -42 -1,967 -23
Total 60,100 900 60,700 1,400 29,800 100 14,934 183 29,943 435 29,525 318 15,009 252
Net salesOperatingincome
Net salesOperatingincome
Net salesOperatingincome
Net salesOperatingincome
Net salesOperatingincome
Net salesOperatingincome
Net salesOperatingincome
Environmental and energyrelated products (*)
9,150 1,150 9,400 1,000 4,000 300 355 312 3,493 517 6,765 636 3,138 205
Others 650 100 600 100 300 0 -261 -30 310 28 984 18 571 58
9,800 1,250 10,000 1,100 4,300 300 94 282 3,803 545 7,749 654 3,709 263
Subsidiaries 600 50 600 100 300 0 7 7 308 36 644 97 301 29
Elimination 0 0 -100 0 -100 0 -3 -1 -46 0 -108 1 -43 1
Total 10,400 1,300 10,500 1,200 4,500 300 98 288 4,065 581 8,285 753 3,967 293
Net salesOperatingincome
Net salesOperatingincome
Net salesOperatingincome
Net salesOperatingincome
Net salesOperatingincome
Net salesOperatingincome
Net salesOperatingincome
Bipolar plates for fuelcells
1,000 -100 1,200 -100 600 0 -71 1 513 -77 1,166 -107 584 -78
Functional chemicals(Carbodilite)
2,200 500 2,200 400 900 100 167 143 1,053 243 1,834 236 886 100
Insulator 5,950 750 6,000 700 2,500 200 259 168 1,927 351 3,765 507 1,668 183
Breakdown total 9,150 1,150 9,400 1,000 4,000 300 355 312 3,493 517 6,765 636 3,138 205
Mar. 2016Precisioninstruments
Mar. 2017 est.revised on 27 Oct.
Mar. 2017 est.on 13 May
Apr.-Sep. 2016 est.on 13 May
Change Apr.-Sep. 2016 Apr.-Sep. 2015
Pre
cis
e p
rocessin
g e
tc.
Pla
stic m
old
ing
Change Apr.-Sep. 2016
Chemicals
Mar. 2017 est.revised on 27 Oct.
Mar. 2017 est.on 13 May
Apr.-Sep. 2016 est.on 13 May
Apr.-Sep. 2015Mar. 2016
Sub total
* Breakdown

APPENDIX3
Nov 11, 2016
19
Net salesOperatingincome
Net salesOperatingincome
Net salesOperatingincome
Net salesOperatingincome
Net salesOperatingincome
Net salesOperatingincome
Net salesOperatingincome
NIST 21,800 600 23,700 600 11,100 200 -849 156 10,705 275 23,410 291 11,554 119
Subsidiaries 28,100 1,200 27,100 1,500 13,900 900 -1,052 -130 13,538 558 29,257 1,475 14,590 688
JPN total 49,900 1,800 50,800 2,100 25,000 1,100 -1,901 26 24,243 833 52,667 1,766 26,144 807
Brazil 4,300 100 3,600 100 1,900 0 -15 -202 2,090 -15 3,886 105 2,105 187
Indonesia 13,500 200 14,000 400 7,300 200 -323 97 7,056 180 14,701 328 7,379 83
China 2,500 0 3,000 0 1,200 0 -206 22 1,049 -1 2,459 -10 1,255 -23
Overseas total 20,300 300 20,600 500 10,400 200 -544 -83 10,195 164 21,046 423 10,739 247
Sub total 70,200 2,100 71,400 2,600 35,400 1,300 -2,445 -57 34,438 997 73,713 2,189 36,883 1,054
Elimination -14,500 -300 -14,600 -300 -7,400 -200 749 25 -7,459 -140 -16,210 -317 -8,208 -165
Total 55,700 1,800 56,800 2,300 28,000 1,100 -1,696 -32 26,979 857 57,503 1,872 28,675 889
Net salesOperatingincome
Net salesOperatingincome
Net salesOperatingincome
Net salesOperatingincome
Net salesOperatingincome
Net salesOperatingincome
Net salesOperatingincome
Household papers 20,100 1,500 21,300 1,100 9,900 500 -302 400 9,633 685 20,459 809 9,935 285
NISP 9,700 650 9,900 400 4,600 200 -84 160 4,478 268 9,819 305 4,562 108
Subsidiaries 8,200 150 8,200 100 3,700 0 -326 78 3,854 52 8,449 -333 4,180 -26
Fine papers total 17,900 800 18,100 500 8,300 200 -410 238 8,332 320 18,268 -28 8,742 82
Sub total 38,000 2,300 39,400 1,600 18,200 700 -712 638 17,965 1,005 38,727 781 18,677 367
Elimination -5,300 0 -5,400 0 -2,500 0 649 53 -2,565 48 -6,143 -39 -3,214 -5
Total 32,700 2,300 34,000 1,600 15,700 700 -63 691 15,400 1,053 32,584 742 15,463 362
Textiles
Mar. 2017 est.revised on 27 Oct.
Mar. 2017 est.on 13 May
Apr.-Sep. 2016 est.on 13 May
Change Mar. 2016 Apr.-Sep. 2015Apr.-Sep. 2016
Apr.-Sep. 2016
JPN
Overs
eas
Papers
Mar. 2017 est.revised on 27 Oct.
Mar. 2017 est.on 13 May
Apr.-Sep. 2016 est.on 13 May
Change Mar. 2016 Apr.-Sep. 2015
Fin
e p
apers

APPENDIX4
Nov 11, 2016
20
Net salesOperatingincome
Net salesOperatingincome
Net salesOperatingincome
Net salesOperatingincome
Net salesOperatingincome
Net salesOperatingincome
Net salesOperatingincome
NISH 8,800 5,000 8,800 5,000 4,100 2,400 -35 151 4,643 2,868 9,486 5,655 4,678 2,717
Subsidiaries 1,500 100 1,400 100 700 100 10 -5 714 49 1,416 140 704 54
10,300 5,100 10,200 5,100 4,800 2,500 -25 146 5,357 2,917 10,902 5,795 5,382 2,771
Elimination -2,000 0 -2,000 0 -1,000 0 29 1 -1,250 0 -2,545 0 -1,279 -1
Total 8,300 5,100 8,200 5,100 3,800 2,500 4 147 4,107 2,917 8,357 5,795 4,103 2,770
Net salesOperatingincome
Net salesOperatingincome
Net salesOperatingincome
Net salesOperatingincome
Net salesOperatingincome
Net salesOperatingincome
Net salesOperatingincome
Other business 20,800 400 22,700 300 10,700 100 19 198 13,211 26 27,327 -217 13,192 -172
Corporate costs -4,800 -4,800 -2,300 0 -65 0 -2,105 -4,076 0 -2,040
Total 20,800 -4,400 22,700 -4,500 10,700 -2,200 19 133 13,211 -2,079 27,327 -4,293 13,192 -2,212
Net salesOperatingincome
Net salesOperatingincome
Net salesOperatingincome
Net salesOperatingincome
Net salesOperatingincome
Net salesOperatingincome
Net salesOperatingincome
Total 532,000 7,000 570,000 16,000 250,000 1,000 -5,583 -4,403 244,287 -2,298 533,989 12,617 249,870 2,105
Real estate
Mar. 2017 est.revised on 27 Oct.
Mar. 2017 est.on 13 May
Apr.-Sep. 2016 est.on 13 May
Change Apr.-Sep. 2016 Apr.-Sep. 2015Mar. 2016
Sub total
Others,Corporate costs
Mar. 2017 est.revised on 27 Oct.
Mar. 2017 est.on 13 May
Mar. 2016Apr.-Sep. 2016 est.
on 13 MayChange Apr.-Sep. 2016 Apr.-Sep. 2015
Mar. 2016
Segmentation total
Mar. 2017 est.revised on 27 Oct.
Mar. 2017 est.on 13 May
Apr.-Sep. 2016 est.on 13 May
Change Apr.-Sep. 2016 Apr.-Sep. 2015


![Fiscal Year ending March 31, 2016 First Quarter ... · August 6, 2015 Fiscal Year ending March 31, 2016 First Quarter Consolidated Financial Results [IFRS] April 1, 2015 – June](https://static.documents.pub/doc/80x56/5f0382947e708231d4096a8e/fiscal-year-ending-march-31-2016-first-quarter-august-6-2015-fiscal-year-ending.jpg)


