34
Financial results Year ended 30 June 2016 Olympic Dam

Financial resultsYear ended 30 June 2016
Olympic Dam

Forward-looking statements
This presentation contains forward-looking statements, including statements regarding: trends in commodity prices and currency exchange rates; demand for commodities; plans, strategies and objectives of management; closure or divestment of
certain operations or facilities (including associated costs); anticipated production or construction commencement dates; capital costs and scheduling; operating costs and shortages of materials and skilled employees; anticipated productive lives of
projects, mines and facilities; provisions and contingent liabilities; tax and regulatory developments.
Forward-looking statements can be identified by the use of terminology such as ‘intend’, ‘aim’, ‘project’, ‘anticipate’, ‘estimate’, ‘plan’, ‘believe’, ‘expect’, ‘may’, ‘should’, ‘will’, ‘continue’, ‘annualised’ or similar words. These statements discuss future
expectations concerning the results of operations or financial condition, or provide other forward-looking statements.
These forward-looking statements are not guarantees or predictions of future performance, and involve known and unknown risks, uncertainties and other factors, many of which are beyond our control, and which may cause actual results to differ
materially from those expressed in the statements contained in this presentation. Readers are cautioned not to put undue reliance on forward-looking statements.
For example, future revenues from our operations, projects or mines described in this presentation will be based, in part, upon the market price of the minerals, metals or petroleum produced, which may vary significantly from current levels. These
variations, if materially adverse, may affect the timing or the feasibility of the development of a particular project, the expansion of certain facilities or mines, or the continuation of existing operations.
Other factors that may affect the actual construction or production commencement dates, costs or production output and anticipated lives of operations, mines or facilities include our ability to profitably produce and transport the minerals, petroleum
and/or metals extracted to applicable markets; the impact of foreign currency exchange rates on the market prices of the minerals, petroleum or metals we produce; activities of government authorities in some of the countries where we are exploring
or developing these projects, facilities or mines, including increases in taxes, changes in environmental and other regulations and political uncertainty; labour unrest; and other factors identified in the risk factors discussed in BHP Billiton’s filings with
the US Securities and Exchange Commission (the “SEC”) (including in Annual Reports on Form 20-F) which are available on the SEC’s website at www.sec.gov.
Except as required by applicable regulations or by law, the Group does not undertake any obligation to publicly update or review any forward-looking statements, whether as a result of new information or future events.
Past performance cannot be relied on as a guide to future performance.
Non-IFRS financial information
BHP Billiton results are reported under International Financial Reporting Standards (IFRS) including Underlying EBIT and Underlying EBITDA which are used to measure segment performance. This release may also include certain non-IFRS and
other financial measures including Adjusted effective tax rate, Free cash flow, Gearing ratio, Net debt, Net operating assets, Underlying attributable profit, Underlying basic (loss)/earnings per share, Underlying EBIT margin and Underlying EBITDA
margin. These measures are used internally by management to assess the performance of our business, make decisions on the allocation of our resources and assess operational management. Non-IFRS and other financial measures have not
been subject to audit or review and should not be considered as an indication of or alternative to an IFRS measure of profitability, financial performance or liquidity.
Presentation of data
Unless specified otherwise: all data is presented on a continuing operations basis to exclude the contribution from assets that were demerged with South32; references to Underlying EBITDA margin exclude third party trading activities; data from
subsidiaries is shown on a 100 per cent basis and data from equity accounted investments and other operations is shown on a proportionate consolidation basis. Queensland Coal comprises the BHP Billiton Mitsubishi Alliance (BMA) asset, jointly
operated with Mitsubishi, and the BHP Billiton Mitsui Coal (BMC) asset, operated by BHP Billiton. Numbers presented may not add up precisely to the totals provided due to rounding.
No offer of securities
Nothing in this presentation should be construed as either an offer to sell or a solicitation of an offer to buy or sell BHP Billiton securities in any jurisdiction, or be treated or relied upon as a recommendation or advice by BHP Billiton.
Reliance on third party information
The views expressed in this presentation contain information that has been derived from publicly available sources that have not been independently verified. No representation or warranty is made as to the accuracy, completeness or reliability of
the information. This presentation should not be relied upon as a recommendation or forecast by BHP Billiton.
Disclaimer
Financial results
216 August 2016

Financial resultsYear ended 30 June 2016
Andrew Mackenzie Chief Executive Officer
EscondidaSpence
South Walker Creek
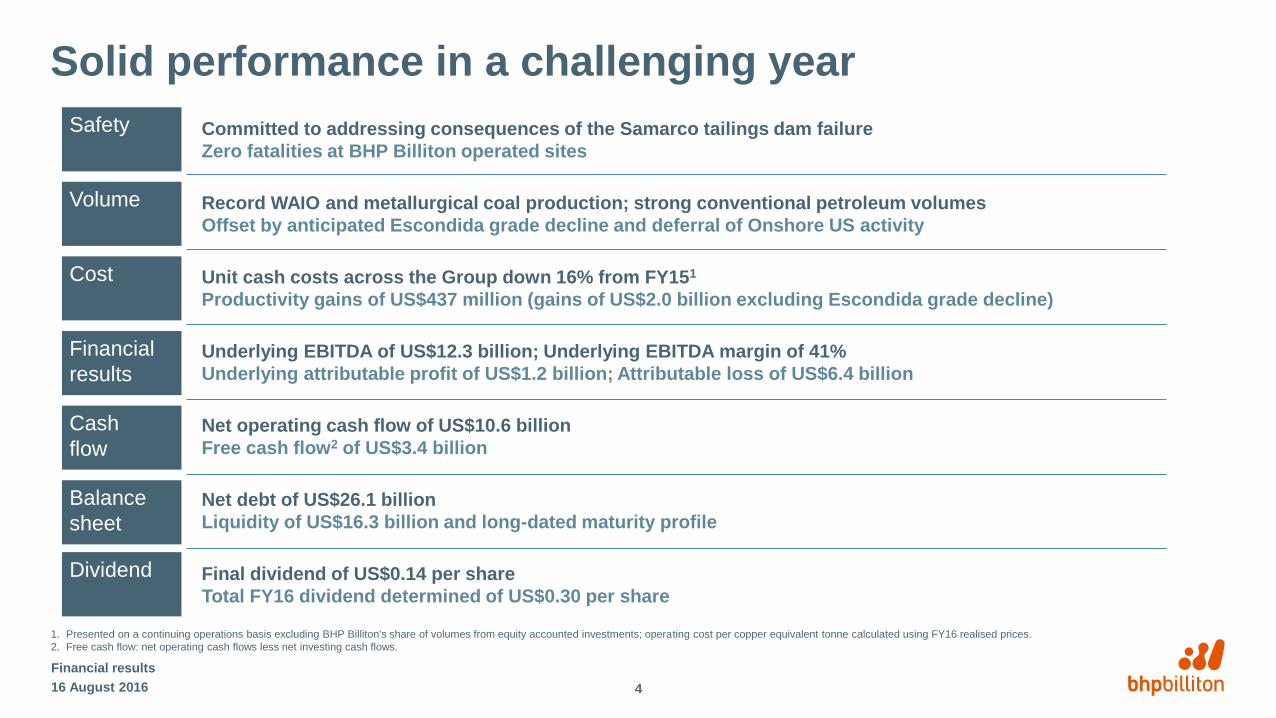
Solid performance in a challenging year
Financial results
Committed to addressing consequences of the Samarco tailings dam failure
Zero fatalities at BHP Billiton operated sites
Safety
Record WAIO and metallurgical coal production; strong conventional petroleum volumes
Offset by anticipated Escondida grade decline and deferral of Onshore US activity
Volume
Unit cash costs across the Group down 16% from FY151
Productivity gains of US$437 million (gains of US$2.0 billion excluding Escondida grade decline)
Cost
Net operating cash flow of US$10.6 billion
Free cash flow2 of US$3.4 billion
Cash
flow
Net debt of US$26.1 billion
Liquidity of US$16.3 billion and long-dated maturity profile
Balance
sheet
Final dividend of US$0.14 per share
Total FY16 dividend determined of US$0.30 per share
Dividend
Underlying EBITDA of US$12.3 billion; Underlying EBITDA margin of 41%
Underlying attributable profit of US$1.2 billion; Attributable loss of US$6.4 billion
Financial
results
1. Presented on a continuing operations basis excluding BHP Billiton's share of volumes from equity accounted investments; operating cost per copper equivalent tonne calculated using FY16 realised prices.
2. Free cash flow: net operating cash flows less net investing cash flows.
416 August 2016

Committed to Samarco
• Rehabilitation progressing well
– Germano and Santarem Dams reinforcement works continue
– 90% of the 41 work programs initiated
– community resettlement ongoing
• Foundation established
– Framework Agreement is the appropriate long-term response
• Expect findings of the external investigation into the cause of
the dam failure to be released shortly
• Preparation for the wet season a priority
• Technical studies indicate Samarco can restart safely
– completion of stabilisation work, range of permits and
community support required
Financial results
Barra Longa, November 2015 River stabilisation at Barra Longa,
May 2016
Santarem Dam, November 2015 Rebuilt Santarem Dam, March 2016
Samarco infrastructure
Environment
516 August 2016

Safety is paramount
• The health and safety of our people and communities always
come first
– tragically 19 lives were lost following the Samarco dam failure
• Strong safety performance at BHP Billiton operated sites
– zero fatalities in FY16
– TRIF of 4.3 per million hours worked
– 20% reduction in high potential safety events
– better investigation quality and learning from past events
0
2
4
6
8
10
FY06 FY07 FY08 FY09 FY10 FY11 FY12 FY13 FY14 FY15 FY16
Financial results
Total Recordable Injury Frequency at operated sites(number of recordable injuries per million hours worked1)
1. FY06 to FY14 presented on a total operations basis.
616 August 2016

Financial resultsYear ended 30 June 2016
Peter Beaven Chief Financial Officer
Shenzi
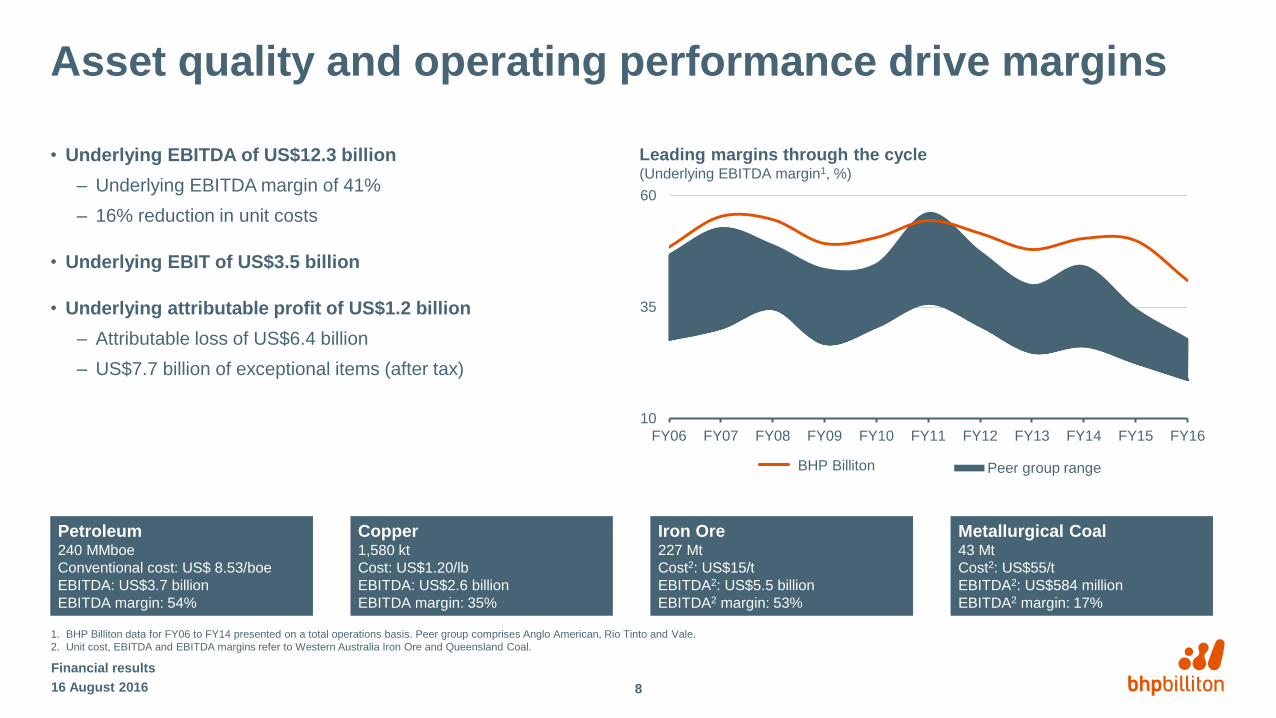
Asset quality and operating performance drive margins
• Underlying EBITDA of US$12.3 billion
– Underlying EBITDA margin of 41%
– 16% reduction in unit costs
• Underlying EBIT of US$3.5 billion
• Underlying attributable profit of US$1.2 billion
– Attributable loss of US$6.4 billion
– US$7.7 billion of exceptional items (after tax)
Financial results
1. BHP Billiton data for FY06 to FY14 presented on a total operations basis. Peer group comprises Anglo American, Rio Tinto and Vale.
2. Unit cost, EBITDA and EBITDA margins refer to Western Australia Iron Ore and Queensland Coal.
BHP Billiton
10
35
60
FY06 FY07 FY08 FY09 FY10 FY11 FY12 FY13 FY14 FY15 FY16
Peer group range
Leading margins through the cycle(Underlying EBITDA margin1, %)
Petroleum240 MMboe
Conventional cost: US$ 8.53/boe
EBITDA: US$3.7 billion
EBITDA margin: 54%
Copper1,580 kt
Cost: US$1.20/lb
EBITDA: US$2.6 billion
EBITDA margin: 35%
Iron Ore227 Mt
Cost2: US$15/t
EBITDA2: US$5.5 billion
EBITDA2 margin: 53%
Metallurgical Coal43 Mt
Cost2: US$55/t
EBITDA2: US$584 million
EBITDA2 margin: 17%
816 August 2016

21.9
12.012.3
(10.7)(0.3) (0.4)
(0.8)
(0.3)
1.1 1.4 0.20.2
0
8
16
24
FY15 Price¹ Foreignexchange
Inflation Sub-total Growthvolumes
Productivityvolumes
Controllablecash costs
Fuel &energy
Non-cash² Other³ FY16
Group EBITDA waterfall
Financial results
Underlying EBITDA variance(US$ billion)
1. Net of price-linked costs.
2. Non-cash includes deferred stripping depletion.
3. Other includes ceased and sold operations, asset sales, one-off items and other items (including profit/loss from equity accounted investments).
External (US$9.9 billion) Controllable US$0.3 billion
916 August 2016
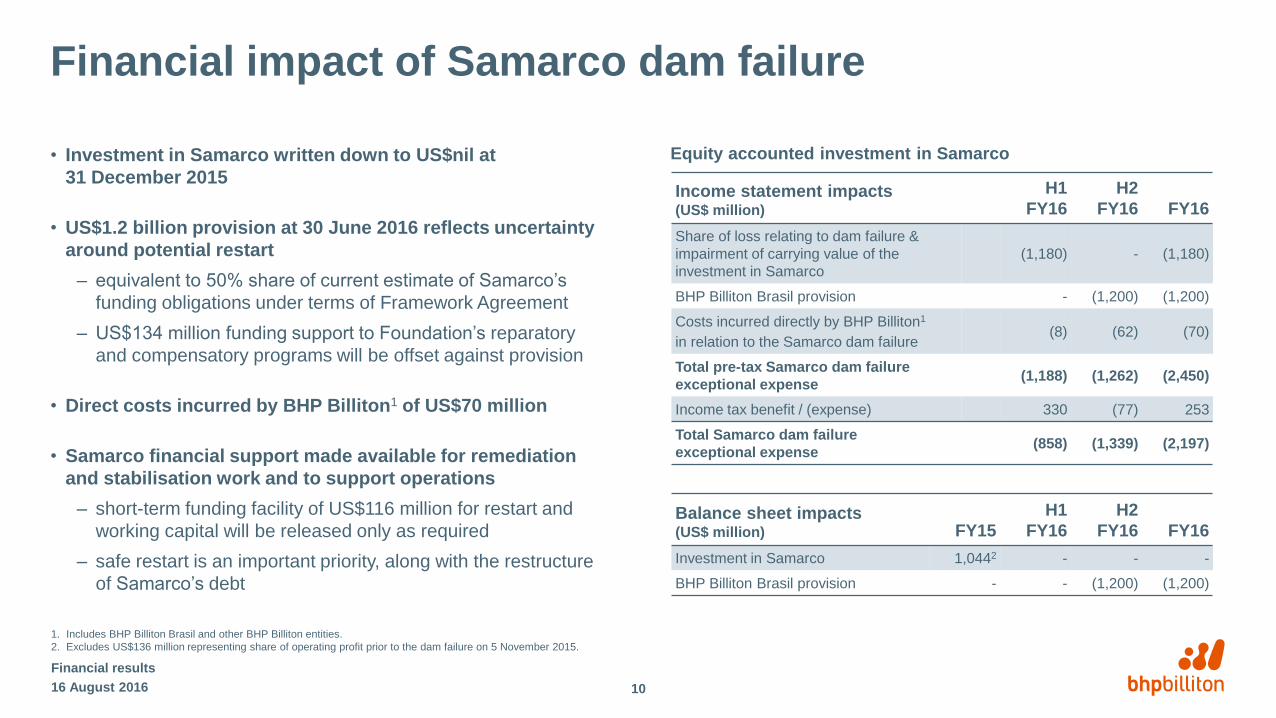
Financial impact of Samarco dam failure
• Investment in Samarco written down to US$nil at
31 December 2015
• US$1.2 billion provision at 30 June 2016 reflects uncertainty
around potential restart
– equivalent to 50% share of current estimate of Samarco’s
funding obligations under terms of Framework Agreement
– US$134 million funding support to Foundation’s reparatory
and compensatory programs will be offset against provision
• Direct costs incurred by BHP Billiton1 of US$70 million
• Samarco financial support made available for remediation
and stabilisation work and to support operations
– short-term funding facility of US$116 million for restart and
working capital will be released only as required
– safe restart is an important priority, along with the restructure
of Samarco’s debt
Financial results
Income statement impacts (US$ million)
H1
FY16
H2
FY16 FY16
Share of loss relating to dam failure &
impairment of carrying value of the
investment in Samarco
(1,180) - (1,180)
BHP Billiton Brasil provision - (1,200) (1,200)
Costs incurred directly by BHP Billiton1
in relation to the Samarco dam failure(8) (62) (70)
Total pre-tax Samarco dam failure
exceptional expense(1,188) (1,262) (2,450)
Income tax benefit / (expense) 330 (77) 253
Total Samarco dam failure
exceptional expense(858) (1,339) (2,197)
Equity accounted investment in Samarco
Balance sheet impacts (US$ million) FY15
H1
FY16
H2
FY16 FY16
Investment in Samarco 1,0442 - - -
BHP Billiton Brasil provision - - (1,200) (1,200)
1016 August 2016
1. Includes BHP Billiton Brasil and other BHP Billiton entities.
2. Excludes US$136 million representing share of operating profit prior to the dam failure on 5 November 2015.
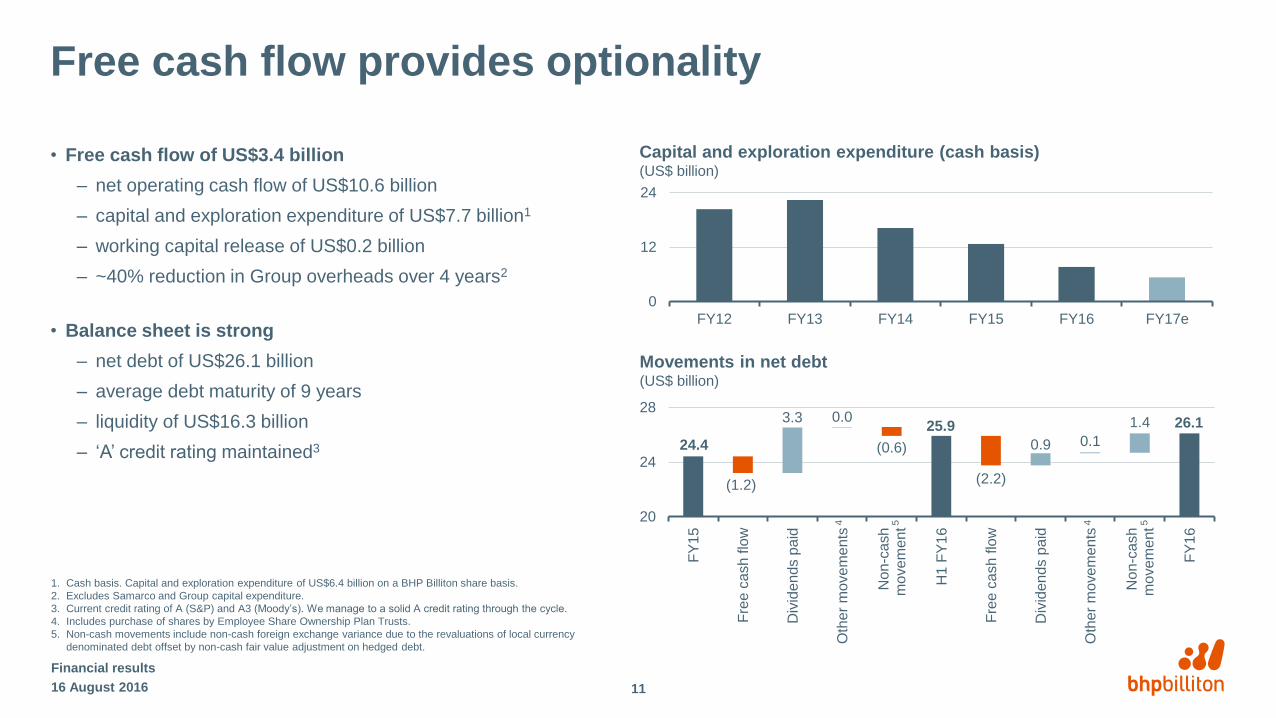
Free cash flow provides optionality
• Free cash flow of US$3.4 billion
– net operating cash flow of US$10.6 billion
– capital and exploration expenditure of US$7.7 billion1
– working capital release of US$0.2 billion
– ~40% reduction in Group overheads over 4 years2
• Balance sheet is strong
– net debt of US$26.1 billion
– average debt maturity of 9 years
– liquidity of US$16.3 billion
– ‘A’ credit rating maintained3
Financial results
0
12
24
FY12 FY13 FY14 FY15 FY16 FY17e
Capital and exploration expenditure (cash basis) (US$ billion)
24.4
25.9 26.1 3.3 0.0
0.9 0.1
1.4
(1.2)
(0.6)
(2.2)
20
24
28
FY
15
Fre
e c
ash flo
w
Div
iden
ds p
aid
Oth
er
mo
vem
ents
Non
-ca
sh
mo
vem
ent
H1
FY
16
Fre
e c
ash flo
w
Div
idends p
aid
Oth
er
mo
ve
me
nts
No
n-c
ash
mo
vem
ent
FY
16
Movements in net debt(US$ billion)
1. Cash basis. Capital and exploration expenditure of US$6.4 billion on a BHP Billiton share basis.
2. Excludes Samarco and Group capital expenditure.
3. Current credit rating of A (S&P) and A3 (Moody’s). We manage to a solid A credit rating through the cycle.
4. Includes purchase of shares by Employee Share Ownership Plan Trusts.
5. Non-cash movements include non-cash foreign exchange variance due to the revaluations of local currency
denominated debt offset by non-cash fair value adjustment on hedged debt.
1116 August 2016
44 55

Disciplined capital allocation
• Our Capital Allocation Framework balances value
creation, shareholder returns and balance sheet
strength
– ‘A’ credit rating maintained1
– total dividends paid of US$4.1 billion
– growth capital and exploration expenditure
of US$5.7 billion
• Board will consider additional cash returns over
minimum 50% payout at every reporting period
• US$0.30 per share dividend determined in FY16
– H1: US$0.16 per share
(US$0.04 plus US$0.12 additional)
– H2: US$0.14 per share
(US$0.08 plus US$0.06 additional)
16 August 2016
Financial results
12
Capital allocation in FY16(US$ billion)
balance sheet
Net operating cash flow
maintenance capital
minimum dividend paid
balance sheet
organic growth investment
additional dividend amount
buy-backs
acquisitions/(divestments)Ma
xim
ise
re
turn
s
and
va
lue
1. Current credit rating of A (S&P) and A3 (Moodys). We manage to a solid A credit rating through the cycle.
2. Final dividend determined under progressive dividend policy in August 2015.
Excess cash
Solid A credit rating through the cycle
H1 H2 FY16
5.3 5.3 10.6
1.0 1.0 2.0
3.3² 0.2 3.5
(2.3)
3.4
-
-
(0.1)
1.3
2.3
0.6
-
(0.2)
(0.9)
5.7
0.6
-
(0.3)
1.0 4.1 5.1
Financial resultsYear ended 30 June 2016
Andrew Mackenzie Chief Executive Officer
Escondida
Eastern Ridge

Well placed for the conditions we expect
• Near-term is difficult
– well-supplied markets across our commodity suite
– ineffective monetary policy, political uncertainty,
populist rejection of free trade suppressing
business confidence
• Fundamentals to return as markets rebalance over
the medium term
• Robust longer-term demand outlook
– China’s industrial output and fixed investment solid
– urbanisation, industrialisation and freer trade will lift
demand from other emerging markets
Financial results
1416 August 2016
Commodity market outlook to 2025
Time until expected market rebalance
Iron ore
Potash
Copper
Petroleum1
Metallurgical
coal
Su
pp
ly o
pp
ort
unity b
y 2
02
5 (
ve
rsu
s 2
01
5)
Energy coal
Source: Wood Mackenzie, BHP Billiton analysis.
1. Includes crude and US gas.

Focused portfolio and simplified operating model
• Optimal portfolio after divestments and demerger
– well-capitalised, low-cost, long-life assets with
expansion options
– diversified across the right commodities
– favourable geographic concentration
• New operating model accelerates productivity gains
– assets focused solely on safety, volume and cost
– globally integrated functions co-located with the assets
– centres of excellence for maintenance, projects and
geoscience
– new structure has lowered overheads through fewer
layers and increased spans of control
Financial results
Tier 1 portfolio(FY16 Underlying EBITDA margin, %)
0
20
40
60
80
1st 2nd 3rd 4th
Cost curve position2 (quartile)
Copper
Metallurgical
coal
PetroleumIron ore
Energy coal
Note: Bubble size
represents FY16
copper equivalent
production1
Source: AME; Wood Mackenzie; BHP Billiton analysis.
1. Copper equivalent production based on FY16 realised prices.
2. Based on weighted average equity share of production using quality-adjusted operating cost curves versus contestable demand in the markets in which our assets operate.
1516 August 2016
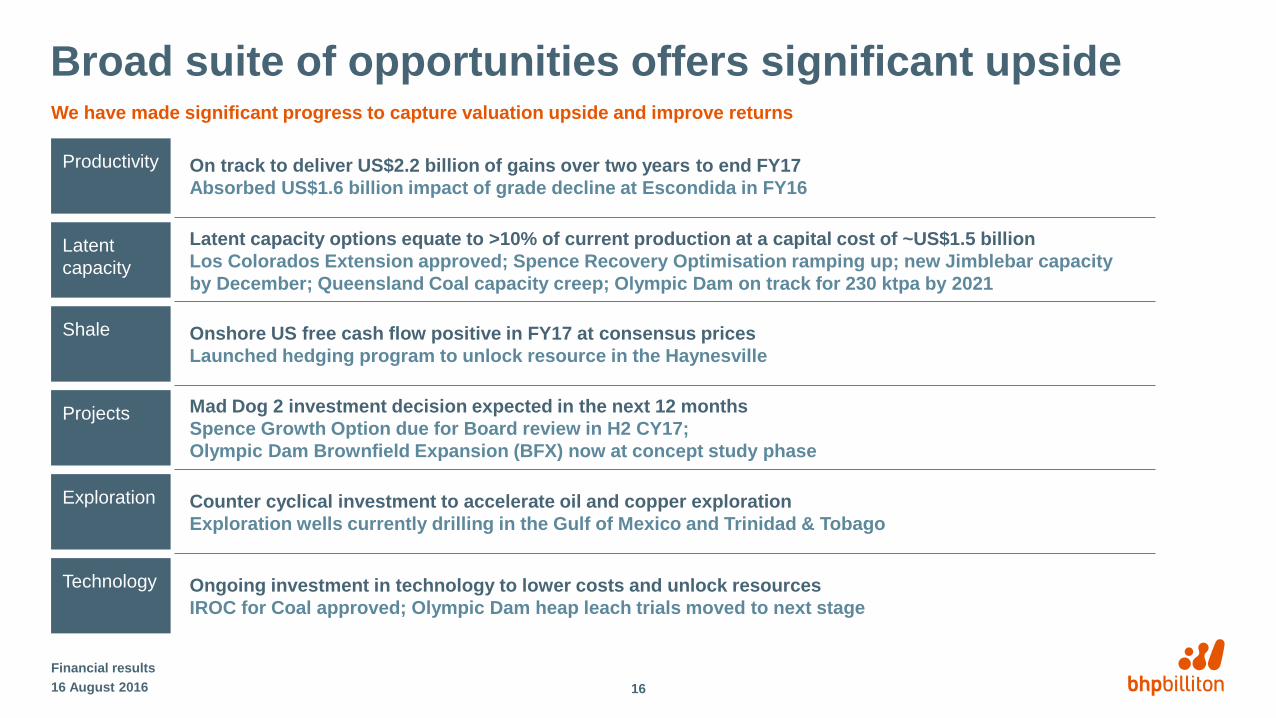
Broad suite of opportunities offers significant upside
Financial results
We have made significant progress to capture valuation upside and improve returns
Productivity On track to deliver US$2.2 billion of gains over two years to end FY17
Absorbed US$1.6 billion impact of grade decline at Escondida in FY16
Latent
capacity
Latent capacity options equate to >10% of current production at a capital cost of ~US$1.5 billion
Los Colorados Extension approved; Spence Recovery Optimisation ramping up; new Jimblebar capacity
by December; Queensland Coal capacity creep; Olympic Dam on track for 230 ktpa by 2021
Shale Onshore US free cash flow positive in FY17 at consensus prices
Launched hedging program to unlock resource in the Haynesville
Projects Mad Dog 2 investment decision expected in the next 12 months
Spence Growth Option due for Board review in H2 CY17;
Olympic Dam Brownfield Expansion (BFX) now at concept study phase
Exploration Counter cyclical investment to accelerate oil and copper exploration
Exploration wells currently drilling in the Gulf of Mexico and Trinidad & Tobago
Technology Ongoing investment in technology to lower costs and unlock resources
IROC for Coal approved; Olympic Dam heap leach trials moved to next stage
1616 August 2016

Momentum builds into the new financial year
Steady volumes…
• FY17 copper equivalent volume growth of up to 4% (ex-Onshore US)
• Onshore US will respond to market conditions
…lower costs…
• productivity gains of US$1.8 billion expected in FY17
• unit costs expected to reduce by 12%1
…and higher capital productivity…
• FY17 capital and exploration expenditure of US$5.4 billion2
• biased to latent capacity and low-cost growth
…will drive free cash flow and lower debt
• free cash flow of over US$7 billion in FY17 at spot prices3
• FY16 net debt of US$26.1 billion expected to be the peak this cycle
Financial results
Lowest unit operating costs in a decade expected in FY17(Mt, operating cost per copper equivalent tonne)
FY
07
FY
08
FY
09
FY
10
FY
11
FY
12
FY
13
FY
14
FY
15
FY
16
FY
17e
Volumes¹ Operating cost per copper equivalent tonne¹
1. Presented on a continuing operations basis excluding BHP Billiton's share of volumes from equity accounted investments;
operating cost per copper equivalent tonne calculated using FY16 realised prices.
2. On a cash basis. Capital and exploration expenditure of US$5.0 billion on BHP Billiton share basis.
3. Spot prices at 8 August 2016.
1716 August 2016

Positioned to grow value and returns
Financial results
The right commodities…
• optimal diversification with petroleum and copper markets expected
to rebalance first
…the right assets…
• optimal portfolio of well-capitalised, low-cost, long life assets
…the right structure…
• 12 operated assets, 4 commodities, 3 operating groups
…to maximise free cash flow1
• free cash flow of over US$7 billion in FY17 at spot prices2
The right capital allocation framework…
• balances value creation, shareholder returns and balance sheet strength
…to drive value and returns
• strong progress on suite of opportunities to grow value and improve ROIC
We have opportunities to significantly increase returns(Return on Capital Employed3 at consensus prices, nominal)
1. Free cash flow: operating cash flow less capital expenditure and exploration.
2. Spot prices at 8 August 2016.
3. Assumes all latent capacity and growth options (including Onshore US) proceed.
1816 August 2016
(Years)

Appendix
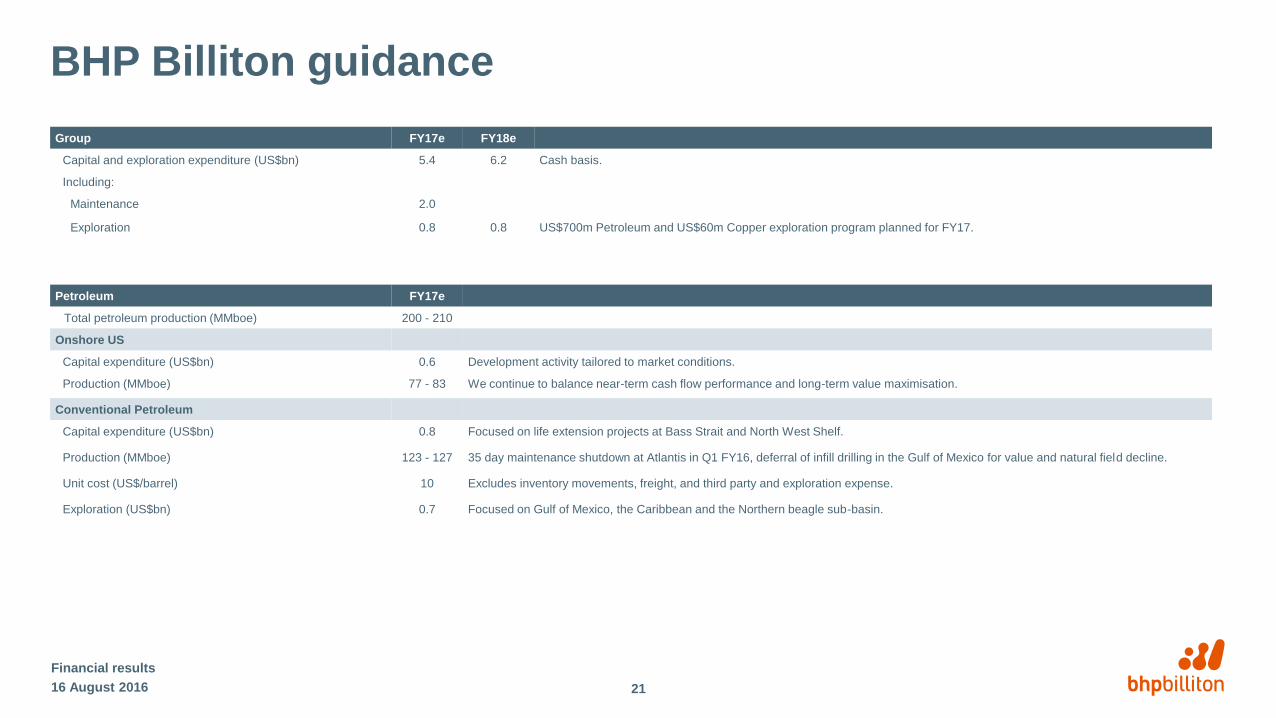
BHP Billiton guidance
Financial results
Group FY17e FY18e
Capital and exploration expenditure (US$bn) 5.4 6.2 Cash basis.
Including:
Maintenance 2.0
Exploration 0.8 0.8 US$700m Petroleum and US$60m Copper exploration program planned for FY17.
Petroleum FY17e
Total petroleum production (MMboe) 200 - 210
Onshore US
Capital expenditure (US$bn) 0.6 Development activity tailored to market conditions.
Production (MMboe) 77 - 83 We continue to balance near-term cash flow performance and long-term value maximisation.
Conventional Petroleum
Capital expenditure (US$bn) 0.8 Focused on life extension projects at Bass Strait and North West Shelf.
Production (MMboe) 123 - 127 35 day maintenance shutdown at Atlantis in Q1 FY16, deferral of infill drilling in the Gulf of Mexico for value and natural field decline.
Unit cost (US$/barrel) 10 Excludes inventory movements, freight, and third party and exploration expense.
Exploration (US$bn) 0.7 Focused on Gulf of Mexico, the Caribbean and the Northern beagle sub-basin.
2116 August 2016

BHP Billiton guidance (continued)
Financial results
Copper FY17e
Total copper production (Mt) 1.66 Guidance for Escondida at 1.07 Mt. Pampa Norte production is expected to increase. Olympic Dam production guidance to remain unchanged.
Guidance for Antamina production to decrease to 130 kt as planned mining sequence moves through lower a copper grade zone.
Escondida
Production (Mt, 100% basis) 1.07 Enabled by the commissioning of the Escondida Water Supply project and the ramp up of the Los Colorados Extension.
Unit cash costs (US$/lb) 1.00 Excludes freight and treatment and refining charges. Net of by-product credits. Based on an exchange rate of USD/CLP 698.
Iron Ore FY17e
Total iron ore production (Mt) 228 - 237 Excludes production from Samarco.
Western Australia Iron Ore
Production (Mt, 100% basis) 265 - 275
Unit cash costs (US$/t) 14 Excludes freight and royalties; based on an exchange rate of AUD/USD 0.71.
Sustaining capital expenditure (US$/t) 4 Long term average; +/- 50% in any given year.
Coal FY17e
Total metallurgical coal production (Mt) 44
Total energy coal production (Mt) 30 The divestment of Navajo Coal to Navajo Transitional Energy Company was completed on 29 July 2016.
Queensland Coal
Production (Mt) 44
Unit cash costs (US$/t) 52 Excludes freight and royalties; based on an exchange rate of AUD/USD 0.71.
Sustaining capital expenditure (US$/t) 6 Long term average; +/- 50% in any given year.
NSW Energy Coal
Production (Mt) 19
Unit cash costs (US$/t) 38 Excludes freight and royalties; based on an exchange rate of AUD/USD 0.71.
Sustaining capital expenditure (US$/t) 4 Long term average; +/- 50% in any given year.
16 August 2016 22

Key Underlying EBITDA sensitivities
Financial results
1. Assumes total volume exposed to price; determined on the basis of BHP Billiton’s existing portfolio.
2. Excludes impact of equity accounted investments.
3. Excludes impact of change in input costs across the Group.
4. Based on average exchange rate for the period.
Approximate impact1 on FY17 Underlying EBITDA of changes of: US$ million
US$1/t on iron ore price2 217
US$1/bbl on oil price3 79
US¢10/MMbtu on US gas price 26
US$1/t on metallurgical coal price 42
US¢1/lb on copper price2 34
US$1/t on energy coal price2 18
US¢1/lb on nickel price 2
AUD (US¢1/A$) operations4 78
2316 August 2016

7.2
3.5 3.7
(3.6) (0.1) (0.0)(0.4)
(0.0)(0.1)
0.7
0.0
4.0
8.0
FY15 Price¹ Foreignexchange
Inflation Sub-total Growthvolumes
Controllablecash costs
Fuel &energy
Non-cash² Other³ FY16
Petroleum EBITDA waterfall
Financial results
Underlying EBITDA variance(US$ billion)
1. Net of price-linked costs.
2. Non-cash includes change in deferred stripping depletion.
3. Other includes ceased and sold operations, asset sales, one-off items and other items (including profit/loss from equity accounted investments).
External (US$3.7 billion) Controllable US$0.2 billion
2416 August 2016
0.0
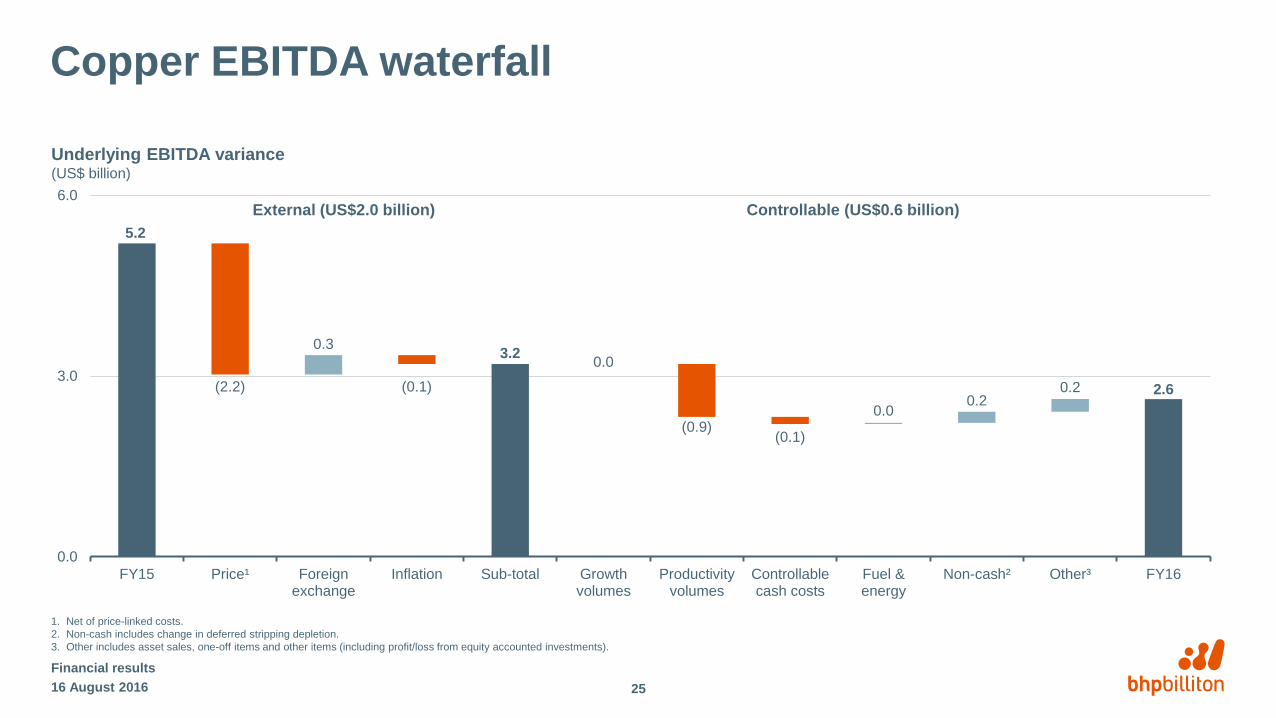
5.2
3.2
2.6(2.2) (0.1)
(0.9)(0.1)
0.3
0.0
0.00.2
0.2
0.0
3.0
6.0
FY15 Price¹ Foreignexchange
Inflation Sub-total Growthvolumes
Productivityvolumes
Controllablecash costs
Fuel &energy
Non-cash² Other³ FY16
Copper EBITDA waterfall
Financial results
Underlying EBITDA variance(US$ billion)
1. Net of price-linked costs.
2. Non-cash includes change in deferred stripping depletion.
3. Other includes asset sales, one-off items and other items (including profit/loss from equity accounted investments).
2516 August 2016
External (US$2.0 billion) Controllable (US$0.6 billion)

8.6
5.25.6
(3.6) (0.1)
(0.0) (0.1)0.3 0.1
0.30.1
0.0
5.0
10.0
FY15 Price¹ Foreignexchange
Inflation Sub-total Growthvolumes
Productivityvolumes
Controllablecash costs
Fuel &energy
Non-cash² Other³ FY16
Iron Ore EBITDA waterfall
Financial results
1. Net of price-linked costs.
2. Non-cash includes change in deferred stripping depletion.
3. Other includes ceased and sold operations, asset sales, one-off items and other items (including profit/loss from equity accounted investments).
0.0
2616 August 2016
Underlying EBITDA variance(US$ billion)
External (US$3.4 billion) Controllable US$0.4 billion

1.2
0.60.6
(0.9)
(0.1)(0.3)
0.40.0 0.0
0.20.1
0.0
0.8
1.6
FY15 Price¹ Foreignexchange
Inflation Sub-total Growthvolumes
Productivityvolumes
Controllablecash costs
Fuel &energy
Non-cash² Other³ FY16
Coal EBITDA waterfall
Financial results
1. Net of price-linked costs.
2. Non-cash includes change in deferred stripping depletion.
3. Other includes ceased and sold operations, asset sales, one-off items and other items (including profit/loss from equity accounted investments).
0.0
2716 August 2016
Underlying EBITDA variance(US$ billion)
External (US$0.6 billion) Controllable US$0.0 billion

Other items affecting profitability
Financial results
(0.3) (0.2) (0.2) (0.2) (0.2)
(0.6)
(2.2)
(4.9)
(6.0)
(4.0)
(2.0)
0.0
Redundancies andclosure costs
Royalty andtaxation matters
Redundancies andclosure costs
Minor impairments Royalty andtaxation matters
Global taxationmatters
Samarco dam failure Impairment ofOnshore US
Other items(US$ billion)
1. Post tax consequences.
Underlying EBITDA Exceptional items1
Underlying
attributable profit1
2816 August 2016
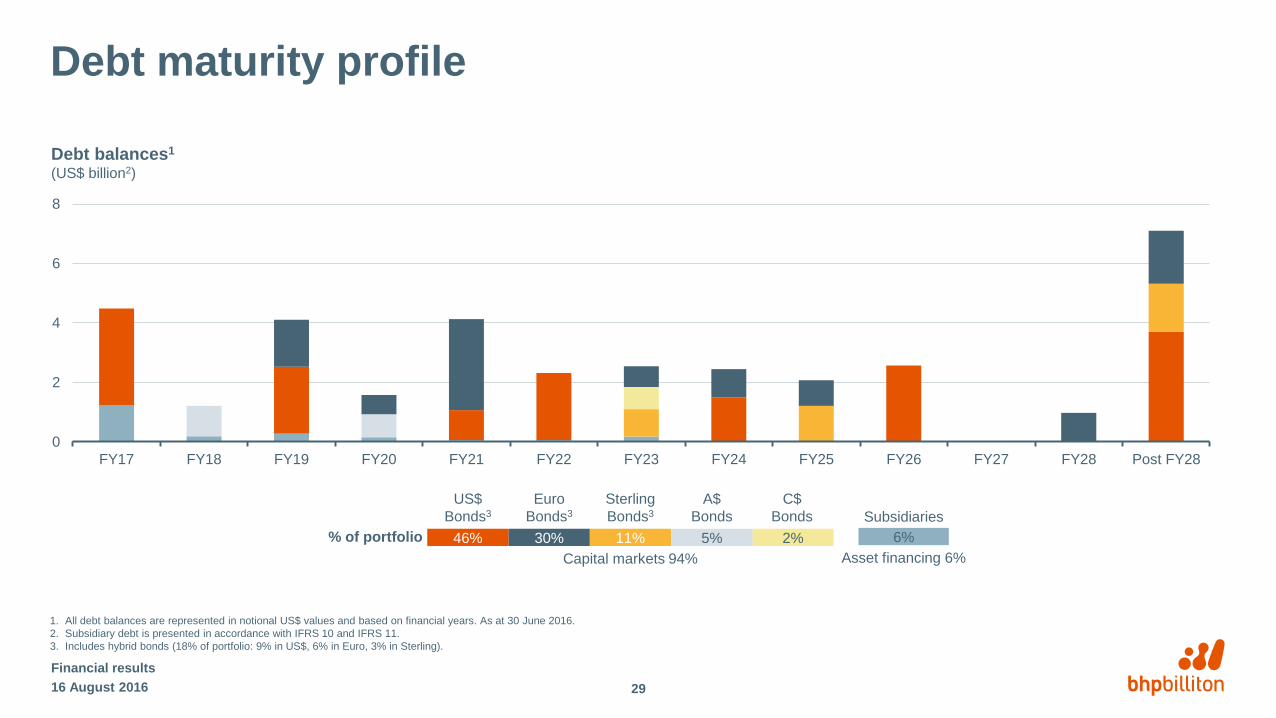
Debt maturity profile
Financial results
Debt balances1
(US$ billion2)
1. All debt balances are represented in notional US$ values and based on financial years. As at 30 June 2016.
2. Subsidiary debt is presented in accordance with IFRS 10 and IFRS 11.
3. Includes hybrid bonds (18% of portfolio: 9% in US$, 6% in Euro, 3% in Sterling).
0
2
4
6
8
FY17 FY18 FY19 FY20 FY21 FY22 FY23 FY24 FY25 FY26 FY27 FY28 Post FY28
% of portfolio 6%
Subsidiaries
Asset financing 6%
2%
C$
Bonds
46% 30%
US$
Bonds3
Euro
Bonds3
Capital markets 94%
11% 5%
Sterling
Bonds3
A$
Bonds
2916 August 2016

21.0
21.5
22.0
22.5
CY14 China RoW CIS/S America
CY15
Global demand slow recently, but long run trend is still positive(Refined copper demand1, Mt)
We remain positive on long-term copper fundamentals
Short-term overcapacity in copper remains persistent
• Subdued demand with slower than expected growth in China
and recession in key non-Asian emerging economies
• Increased supply from new and expanded operations with
more growth expected near term
Long-term fundamentals are sound
• Demand growth will continue as China transitions to a
consumer-driven economy, and copper-intensive renewable
energy capacity and electric vehicles grow rapidly
• Emerging markets will recover and converge to their natural
intensity curves
• Grade decline and mine depletions will require investment in
new supply
Financial results
Source: Wood Mackenzie.
1. The two upper panels are not set to the same scale.
2. Based on average grade weighted by paid copper.
Continued global ore grade decline expected(Copper grades2, %)
3016 August 2016
CY15 CY30e
CAGR 1.5%
0.9
1.1
1.3
1.5
CY00 CY05 CY10 CY15 CY20e CY25e

Oil and US gas markets expected to rebalance
Outlook remains healthy
• Fundamentals tightening, as healthy demand growth intersects with
slower global production growth due to falling production in the US
• Rate of inventory drawdown will impact price recovery - OPEC and
US production remain key watch points
• Higher prices will be required to induce the new supply needed to
offset natural field decline and meet growing demand
Near-term US natural gas prices driven by storage and weather;
long-term market supported by robust demand growth
• Mild winter, industry-wide productivity gains and resilient supply
resulted in record inventory levels
• Inventories forecast to return to average levels by end CY16 on
strong demand growth and declining production
• While investment in new supply sources will be required, the
abundant lower-cost supply will moderate price inflation
16 August 2016
Financial results
31
Gas storage: US Lower 48(tcf)
Oil mass balance: global(Inventory change, MMbbl/d)
(1.0)
0.0
1.0
2.0
CY12 CY13 CY14 CY15 CY16e CY17e
0.0
3.0
6.0
Jan 15 Apr 15 Jul 15 Oct 15 Jan 16 Apr 16 Jul 16 Oct 16
5 year min/max 5 year average
Gas stock Storage forecastSource: BHP Billiton analysis; US Energy Information Administration (August 2016).
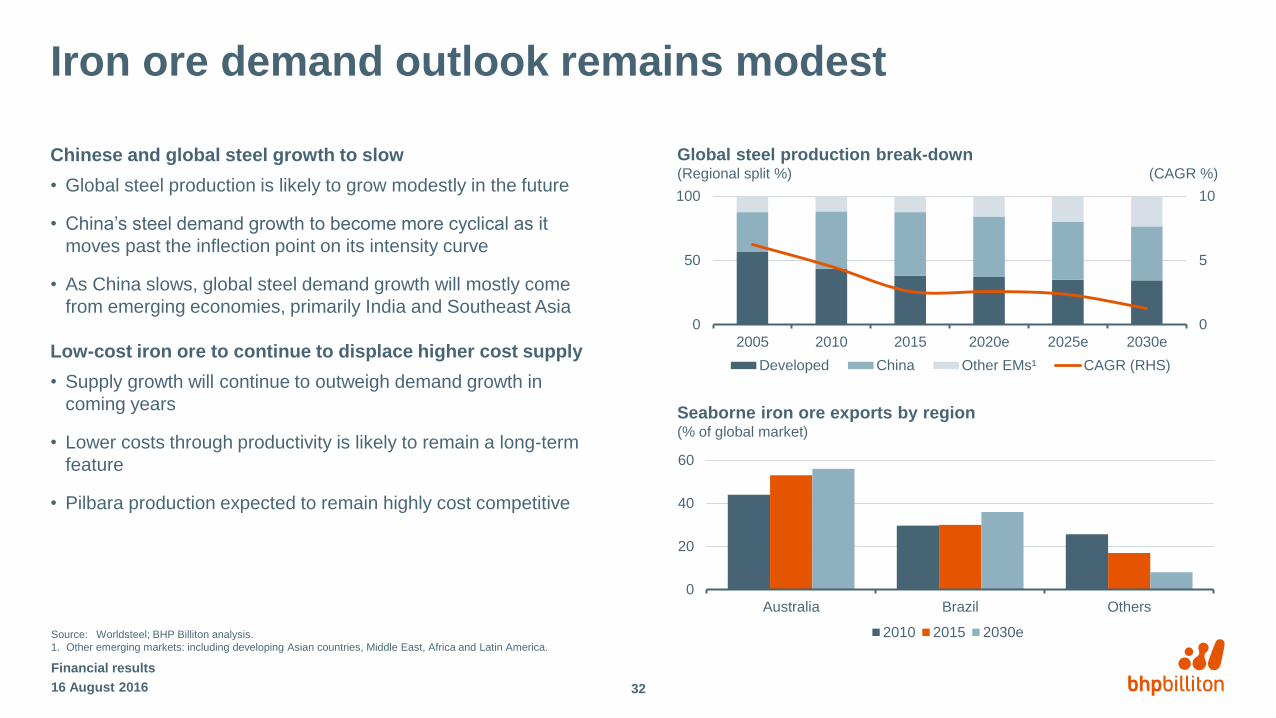
Iron ore demand outlook remains modest
Chinese and global steel growth to slow
• Global steel production is likely to grow modestly in the future
• China’s steel demand growth to become more cyclical as it
moves past the inflection point on its intensity curve
• As China slows, global steel demand growth will mostly come
from emerging economies, primarily India and Southeast Asia
Low-cost iron ore to continue to displace higher cost supply
• Supply growth will continue to outweigh demand growth in
coming years
• Lower costs through productivity is likely to remain a long-term
feature
• Pilbara production expected to remain highly cost competitive
16 August 2016
Financial results
32
Seaborne iron ore exports by region (% of global market)
0
5
10
0
50
100
2005 2010 2015 2020e 2025e 2030e
Developed China Other EMs¹ CAGR (RHS)
Global steel production break-down(Regional split %) (CAGR %)
Source: Worldsteel; BHP Billiton analysis.
1. Other emerging markets: including developing Asian countries, Middle East, Africa and Latin America.
0
20
40
60
Australia Brazil Others
2010 2015 2030e

Metallurgical coal outlook supported by growing demand for high-quality productDemand improvement to be moderate, supply slowly adjusting
• Cost curve has flattened
• Lower prices are leading to closures and reduced investment
The world continues to require steel and metallurgical coal is
essential for pig iron production
• China expected to continue to import seaborne metallurgical coal
– demand supported by coastal market access and requirement
for consistent, quality product in larger blast furnaces
– encouraging signs following domestic coal supply reforms
• Robust outlook underpinned by scarcity of high-quality resources
and demand growth in emerging economies
– particularly in India where we expect strong steel production
growth
Financial results
3316 August 2016
Source: Wood Mackenzie; Worldsteel; BHP Billiton analysis.
1. Includes productivity improvements.
2. Emerging Asia includes India, ASEAN and other South Asia. Excludes China, Japan, Taiwan and South Korea.
0
5
10
15
2000 2015 2020e 2025e 2030e 2035e
Emerging Asia² China US Europe
Gap to close in emerging market steel stock(finished steel per capita, t)
Seaborne metallurgical coal supply and demand (Bt)
2015 2020e 2025e 2030e 2035e
Supply
opportunity
Existing supply1 Demand range Demand

2015 2020e 2025e 2030e 2035e
Energy coal expected to remain an important part of the global energy complexMarkets expected to remain oversupplied in the near term
• China’s demand for imports is likely to fall further as domestic
overcapacity persists, however coal supply reforms encouraging
• More supply rationalisation is required to balance the market
Coal’s share of the fuel mix will decline but total volume will grow
due to cost competitiveness in Asia
• Absolute demand expected to increase by 10-15% by the mid-2020s,
despite a declining share in the global electricity generation fuel mix
• India and South East Asia have 26% of the world’s population, but
still account for only 13% of global electricity generation
– low-cost energy coal is expected to be a preferred fuel source
Source: Wood Mackenzie; IEA; BHP Billiton analysis.
1. Includes productivity improvements.
2. Based on IEA data from WEO2015_AnnexA © OECD/IEA, www.iea.org/statistics. Licence: www.iea.org/t&c;
as modified by BHP Billiton.
Global electricity fuel mix2
(PWh) (coal share, %)
Energy coal use in electricity2
(PWh)
India China
Other non-OECD Asia
RoW
Additional seaborne supply required to meet expected demand(Bt)
0
25
50
0
25
50
2013 2020e 2030e 2035e
Coal Oil and gas
Nuclear Hydro
Other Coal share
0
5
10
15
2013 2020e 2030e 2035e
Existing supply1 Demand range Demand
Financial results
3416 August 2016
Supply
opportunity


