FINANCIAL STABILITY REPORT 25 – JUNE 2013 87 1 Introduction and Motivation 1 For most banks, interest income repre- sents a substantial part of their operating income. In particular, this applies to small and medium-sized banks that are involved in relationship banking with a strong emphasis on the German-style “Hausbank” (see e.g. Allen and Gale, 1995). In Austria, interest income still accounts for nearly 50% of banks’ oper- ating income, which is why, in commer- cial banking, the importance of the net interest margin (NIM) as a measure of profitability of financial intermediation cannot be neglected. Interestingly, there has been a sub- stantial reduction in the NIM through- out Europe over the past years. Liebeg and Schwaiger (2006) report such a decline for euro area banks between 2000 and 2005. Annual Bankscope data for Western Europe confirm a further decline in rates in most countries between 2005 and 2011. Austria is no exception to this trend, as already noted earlier by Liebeg and Schwaiger (2006): the NIM shrank by almost 50% between 1996 and mid-2012 (see chart 1). The seminal work of Ho and Saunders (1981), which is covered in section 2 in more detail, laid a good foundation for empirical research aimed at detecting the driving forces of inter- est margins. These papers already pro- vide comprehensive theoretical guidance about which variables could be tested empirically. We find a considerable number of papers that present the following determinants of the NIM. First, banks may have established complementary sources of income (e.g. income from fees and commissions) or refinancing opportunities (e.g. covered bonds). Allen (1988) extended the origi- nal Ho-Saunders model by considering different types of loans and deposits. Beyond their theoretical extension, the Macroeconomic, Market and Bank-Specific Determinants of the Net Interest Margin in Austria The objective of this article is to identify key determinants of the net interest margin (NIM) in the Austrian banking sector. In Austria, the NIM is one of the most important income drivers of banks given the importance of relationship banking, where interest income dominates other sources of revenue. However, the NIM differs substantially among Austrian banks. Drawing on a unique supervisory dataset for the Austrian banking sector of around 42,000 observations between the first quarter of 1996 and the second quarter of 2012, we analyze under which circumstances a bank has a relatively high or low NIM. We contribute to the empirical literature on the NIM by factoring in a bank’s business model in terms of its balance sheet structure and by accounting for the financial crisis from the third quarter of 2007 onward. Our estimation results suggest that not only the determinants identified in the existing empirical literature (different types of non-interest income and expenses, various risk measures, competition, macroeconomic environment) have a significant influence on the NIM, but also our two inno- vations (balance sheet structure, financial crisis). JEL classification: E43, G21, D40, L11 Keywords: Net interest margin, balance sheet structure, panel estimation Ulrich Gunter, Gerald Krenn, Michael Sigmund 1 1 MODUL University Vienna, Department of Tourism and Service Management, ulrich.gunter@modul.ac.at, Oesterreichische Nationalbank (OeNB), Financial Markets Analysis and Surveillance Division, gerald.krenn@oenb.at and michael.sigmund@oenb.at. The authors would like to thank OeNB intern Maria Ilieva for helpful comments. The views expressed in this paper are those of the authors and do not necessarily reflect those of MODUL University Vienna or the OeNB.
Transcript
FINANcIAl stAbIlIty report 25 – juNe 2013 87
1 Introduction and Motivation1
For most banks, interest income repre-sents a substantial part of their operating income. In particular, this applies to small and medium-sized banks that are involved in relationship banking with a strong emphasis on the German-style “Hausbank” (see e.g. Allen and Gale, 1995). In Austria, interest income still accounts for nearly 50% of banks’ oper-ating income, which is why, in commer-cial banking, the importance of the net interest margin (NIM) as a measure of profitability of financial intermediation cannot be neglected.
Interestingly, there has been a sub-stantial reduction in the NIM through-out Europe over the past years. Liebeg and Schwaiger (2006) report such a decline for euro area banks between 2000 and 2005. Annual Bankscope data for Western Europe confirm a further decline in rates in most countries between 2005 and 2011. Austria is no
exception to this trend, as already noted earlier by Liebeg and Schwaiger (2006): the NIM shrank by almost 50% between 1996 and mid-2012 (see chart 1).
The seminal work of Ho and Saunders (1981), which is covered in section 2 in more detail, laid a good foundation for empirical research aimed at detecting the driving forces of inter-est margins. These papers already pro-vide comprehensive theoretical guidance about which variables could be tested empirically. We find a considerable number of papers that present the following determinants of the NIM.
First, banks may have established complementary sources of income (e.g. income from fees and commissions) or refinancing opportunities (e.g. covered bonds). Allen (1988) extended the origi-nal Ho-Saunders model by considering different types of loans and deposits. Beyond their theoretical extension, the
Macroeconomic, Market and bank-specific Determinants of the Net Interest Margin in Austria
The objective of this article is to identify key determinants of the net interest margin (NIM) in the Austrian banking sector. In Austria, the NIM is one of the most important income drivers of banks given the importance of relationship banking, where interest income dominates other sources of revenue. However, the NIM differs substantially among Austrian banks. Drawing on a unique supervisory dataset for the Austrian banking sector of around 42,000 observations between the first quarter of 1996 and the second quarter of 2012, we analyze under which circumstances a bank has a relatively high or low NIM. We contribute to the empirical literature on the NIM by factoring in a bank’s business model in terms of its balance sheet structure and by accounting for the financial crisis from the third quarter of 2007 onward. Our estimation results suggest that not only the determinants identified in the existing empirical literature (different types of non-interest income and expenses, various risk measures, competition, macroeconomic environment) have a significant influence on the NIM, but also our two inno-vations (balance sheet structure, financial crisis).
1 MODUL University Vienna, Department of Tourism and Service Management, [email protected], Oesterreichische Nationalbank (OeNB), Financial Markets Analysis and Surveillance Division,
[email protected] and [email protected]. The authors would like to thank OeNB intern Maria Ilieva for helpful comments. The views expressed in this paper are those of the authors and do not necessarily reflect those of MODUL University Vienna or the OeNB.
Macroeconomic, Market and bank-specific Determinants of the Net Interest Margin in Austria
88 FINANcIAl stAbIlIty report 25 – juNe 2013
question remains whether certain types of loans/deposits are strategic substitutes or complements. For lack of sufficiently granular data, most empirical studies use the idea of different types of loans and deposits only by defining broad cat-egories such as bank, consumer, foreign currency and corporate loan shares on the asset side and deposit shares on the liability side.2 Another approach is to model different sources of income directly. Liebeg and Schwaiger (2006) follow this approach by considering non-interest revenues as a share of total income, income from fees and commis-sions and also the share of foreign cur-rency loans.
Second, banks could have increased their efficiency by improving their cost-to-income ratios and/or reducing their staff and other expenditures. Almost all empirical papers incorporate some kind of cost-related variable. Prominent examples are the cost-to-income ratio (see e.g. Liebeg and Schwaiger, 2006, or Entrop et al., 2012), some kind of efficiency index (see Hamadi and Awdeh, 2012) or cost variables in relation to total assets (see e.g. Horvath, 2009).
Third, banks might change their risk appetite. Ho and Saunders (1981) originally considered absolute risk aversion in a bank’s utility function. Empirically, there are several ways to incorporate this idea. Saunders and Schu macher (2000), among others, use interest rate volatility to control for major portfolio risks. Another approach, which is more popular in empirical work, is to link risk appetite to credit risk-related variables such as loan loss provisions and/or the nonperforming loan ratio. Hanweck and Ryu (2005) argue that risk-averse bank managers will shift to lower-yielding assets and
funds that are less prone to default as credit risk increases. Controlling for the asset structure, as we suggest, could help identify the partial influence of other risk appetite variables on the NIM. Maudos and de Guevara (2004) propose that the risk of nonpayment or default on a credit requires banks to implicitly include a risk premium in interest rates and therefore the NIM.
Fourth and more market-based, competition in the banking system may have intensified, causing margins to decline. Most empirical studies use either the Herfindahl-Hirschman index (HHI; see Herfindahl, 1955, and Hirschman, 1964) or the Lerner index as a measure of competition. Whereas the HHI deter-mines how uniformly market shares are distributed, the Lerner index measures the degree of competition on a bank-by-bank basis (see Angelini and Cetorelli, 2003, for details). As noted by Keeley (1990), banking sector competition and (de)regulation of the banking sector are closely related. In this context, the introduction of (additional) regulatory requirements such as Basel II could impose new restrictions on a bank’s optimal interest margin-setting problem. The theoretical impact of capital regu-lations and deposit insurance was ana-lyzed by Zarruk and Madura (1992).
Fifth, also macroeconomic condi-tions influence the NIM in terms of changes in the economic environment affecting the banking system as a whole at a given point in time. In most empiri-cal studies, GDP growth is used as a control variable and is assumed to have a positive correlation (see e.g. Horvath, 2009). Many papers consider market interest rates of different maturities and/or their respective standard devia-tion to capture the development of both
2 Maudos and de Guevara (2004) include the loan-to-total assets ratio and deposit-to-total assets ratio. Horvath (2009) only considers the share of total loans.
Macroeconomic, Market and bank-specific Determinants of the Net Interest Margin in Austria
FINANcIAl stAbIlIty report 25 – juNe 2013 89
the short and the long end of the yield curve.3 Only a few papers control for additional macroeconomic variables such as inflation (see e.g. Horvath, 2009, and Entrop et al., 2012) and market interest rate spreads (see Rumler and Waschiczek, 2012).
From a financial stability perspec-tive, it is not clear whether a relatively high or relatively low NIM is optimal. On the one hand, a high NIM is associ-ated with a low degree of efficiency, a low degree of financial deepening and noncompetitive market conditions. On the other hand, low net interest rate margins might induce aggressive and highly risky “search-for-yield” activities by banks as suggested by Delis and Kouretas (2011), which pose a threat to financial stability. The 2008 financial crisis showed how such a scenario almost caused the global financial system to collapse. From this perspective, the development of the NIM could pro-foundly influence the future develop-ment of the Austrian banking sector.
The purpose of our study is to iden-tify the most important macroeco-nomic, market and bank-specific deter-minants of the NIM and thereby explain the declining margins in Austria. We combine the most suitable determinants from the existing literature and add two innovations. To the best of our know-ledge, we are the first to approximate banks’ business models by their balance sheet structure and to account for the financial crisis from the third quarter of 2007 onward.4 The remainder of this article is structured as follows. Section 2 introduces the theoretical model by Ho and Saunders (1981) and game the-oretic refinements that put an emphasis
on competition. Section 3 describes the data base used for our empirical ana-lysis as well as the data preparation pro-cess including outlier detection and summarizes the variables eventually used for estimation. Section 4 lays out the econometric model, and section 5 presents and discusses the estimation results. Finally, section 6 concludes.
2 Theoretical Model
In the theoretical literature, we find two major approaches to modeling the NIM. Most papers follow the seminal work of Ho and Saunders (1981), where the bank’s intermediation role is defined as a passive dealer between providers and users of funds.
As mentioned by Marrouch and Turk Ariss (2011), their theory rests on banks’ ability to match the random arrival and departure of deposits and loans, which allows banks to set the interest margin or spreads for deposits a and loans b with respect to the exogenously assumed money market rate m.5 The random arrival and departure of deposits results in transaction uncertainty, which in turn produces the so-called pure spread/margin. Put simply, the pure margin in Ho and Saunders (1981) is affected by the degree of bank management’s risk aversion, the market structure in which the bank operates, the average size of bank transactions and the variance of interest rates.
Maudos and Solis (2009) consider-ably extended the basic model by in-cluding operating costs, credit risk, interaction between credit and market risk, non-interest income, income from fees and commissions and trading income into the pure spread dealership model.
3 Maudos and de Guevara (2004), e.g., include the standard deviations of the three-month, three-year and ten-year interest rate.
4 Memmel and Schertler (2011), who included the change of the balance sheet structure into their NIM model, match up closest with our first innovation.
5 The interest on deposits and loans is then defined as m–a and b+m, respectively, which results in a NIM of a+b.
Macroeconomic, Market and bank-specific Determinants of the Net Interest Margin in Austria
90 FINANcIAl stAbIlIty report 25 – juNe 2013
As already noted by Ho and Saunders (1981), there are other variables outside the theoretical pure margin model which influence the NIM. In the most com-prehensive study by Maudos and Solis (2009), these variables, such as implicit interest payments, opportunity costs of holding reserves, quality of management and loans to total assets as well as deposits to total assets, are included in their theoretical model. Finally, GDP growth and inflation are added.
The less popular alternative for mod-eling the NIM applies standard theory from industrial organization. The Monti-Klein model considers a monopoly bank where it can be shown that interest rates on loans and deposits can be determined separately (separability the-orem) if there is no default risk (see Monti, 1972, and Klein, 1971). With credit risk, the separability theorem no longer holds. However, as stated by van Hoose (2010), pure monopoly or monopsony is a rare occurrence in any modern setting. A bank typically faces at least a few rivals, although banking markets may not be perfectly competi-tive either.
Imperfectly competitive banking markets can be modeled in several ways and enrich the theory on NIM deter-minants. The basic idea is to integrate imperfect competition in the loan and deposit market into one game theoretic model.6
Not surprisingly, this approach high-lights the importance of competition and, in more complex models, product differentiation as a major determinant of the NIM. As a consequence, we im-
plement the standard measure of com-petition, the Lerner index, in our model. We follow the estimation approach by Angelini and Cetorelli (2003), where it is assumed that a bank sets equilibrium prices and quantities in order to maxi-mize its profits Πi :
Π imax = max
qi [p(Q,z)–C(qi ,ωi )]. (1)
Such a decision is based on cost consid-erations (C(qi ,ωi
)) and on the degree of competition in the market measured by the inverse demand function p(Q,z) where Q is the industry output. For lack of data on different products/ser-vices of a bank, we summarize all out-puts of a bank in an aggregate banking product. The same is done on the cost side.7
The corresponding first order con-dition to equation (1) is
pi = C' (qi ,ωi )–Θi /ε̃ (2)
where the second term on the right-hand side measures the departure from a perfectly competitive benchmark.8 In line with Angelini and Cetorelli (2003), the separate identification of Θi and ε̃is not required if one aims to analyze the bank’s overall degree of market power. It is sufficient to estimate λ = Θi /ε .̃ Dividing λ by the average price p yields the Lerner index. The Lerner index is defined to be between 0 and 1, measur-ing the relative markup of price over marginal cost. A Lerner index of zero would describe a market with perfect competition, whereas an index of one would imply monopoly power.
6 Different combinations of loan and deposit market forms, such as oligopolies and oligopsonies or monopolisties and monopsonisties, are possible.
7 The input variables are interest expenses, staff and other operating expenses, whereas the price of the aggregate banking product is defined as the ratio of the sum of interest income and income from fees and commissions to total assets.
8 The term Θ is usually defined as the conjectural elasticity of total industry output with respect to the output of the ith firm and ε ̃ is the market demand semi-elasticity to the price.
Macroeconomic, Market and bank-specific Determinants of the Net Interest Margin in Austria
FINANcIAl stAbIlIty report 25 – juNe 2013 91
For further estimation details, we refer to Angelini and Cetorelli (2003). The result of their estimation technique is a Lerner index for each bank in each quarter, which is integrated in our empirical setup described in section 4.
3 Data and Definitions
Our empirical analysis is based on quarterly supervisory data reported by domestically operating banks at the un-consolidated level according to national GAAP. This implies that interest income earned by Austrian banks’ subsidiaries in Central, Eastern and Southeastern Europe or the Commonwealth of Independent States is not included in the NIM that is analyzed in the next sections.9 Instead, by using unconsoli-dated data, we put the focus on the domestic market, as we are primarily interested in gaining insight into the determinants of the decline of the NIM in Austria (see chart 1).
Bank-specific variables and the Lerner index are built from data on balance sheet items, the profit and loss state-ment and data on regulatory capital and capital requirements. The observation horizon runs from the first quarter of 1996 to the second quarter of 2012, yielding T = 66 time periods. We con-sider all institutions that held a banking license at some point during the obser-vation horizon but exclude special pur-pose banks and affiliates of foreign banks in Austria and arrive at a sample of N = 1,011 banks.
To prevent outliers from distorting the empirical analysis, we apply a two-stage cleaning algorithm to the variables used. First, we eliminate outliers across banks for each time period. An obser-vation is considered an outlier if it is too far from the median (more than four times the distance between the median
and the 2.5% or 97.5% quantile). In a second stage, we eliminate outliers across time for each bank. Here, the threshold distance is defined as 12 times the dis-tance between the median and the 10% or 90% quantile. Such parameters ensure that the number of removed observa-tions remains limited and the resulting distributions exhibit a reasonable shape when judged from a qualitative per-spective. This procedure leaves us with around 42,000 observations.
With regard to our two innovations, we use the share of different types of assets and liabilities as approximation for the business model and a crisis dummy from the third quarter of 2007 onward to account for the new chal-lenges banks have faced in the global financial crisis. Since the overall balance sheet structure does not change signifi-cantly at a quarterly frequency and stays reasonably stable over time, it can be considered a good proxy.
Finally, we use the Lerner index and a primary-bank dummy as market variables. The latter dummy variable indicates whether or not a bank is a
9 However, nondomestic business is taken into account in terms of cross-border loans granted by domestically operating banks.
% p.a.
3.0
2.5
2.0
1.5
1.0
0.5
0.01996
Austrian Banks’ Net Interest Margin (unconsolidated data)
Chart 1
Source: OeNB.
Note: The definition of primary banks is given in this section. Interest on other assets and liabilities is included in the numerator of the NIM.
Non-primary banks Primary banks
1998 2000 2002 2004 2006 2008 2010
Macroeconomic, Market and bank-specific Determinants of the Net Interest Margin in Austria
92 FINANcIAl stAbIlIty report 25 – juNe 2013
“primary bank,” i.e. typically a small retail-oriented bank in the bottom layer of one of the tiered sectors of the Aus-trian banking system (savings banks, Raiffeisen credit cooperatives, Volks-bank credit cooperatives).
Macroeconomic data are taken from the OeNB’s macroeconomic dataset which serves as input for the Austrian Quarterly Macroeconomic Model AQM (see Schneider and Leibrecht, 2006). Specifically, we use real GDP growth,
the GDP deflator and long- and short-term interest rates.
Descriptions of variables are given in table 1. For the ease of readability, those variables that are normalized by dividing by total assets are named by their numerator in the sequel (e.g. “bank loans” instead of “bank loans divided by total assets”).10 The column “Normal-ized by total assets” in table 1 indicates whether this naming convention applies. Profit data (i.e. net interest income, net
table 1
Description of Variables
Name Description Normalized by total assets
expected sign1
Net interest margin Net interest income over total assets2 by definitioneuro-denominated loans to domestic nonbanks
loans to domestically domiciled nonbanks (i.e. customers) denominated in euro yes +
Foreign currency loans to domestic nonbanks
loans to domestically domiciled nonbanks (i.e. customers) denominated in foreign currency
yes +
loans to foreign nonbanks loans to foreign domiciled nonbanks (i.e. customers), all currencies yes +bank loans loans to domestic and foreign banks, all currencies yes +Interest-bearing securities exchange-traded interest-bearing securities (held as assets) issued by domestic and
foreign banks and nonbanks, all currenciesyes +
Nonbank deposits Deposits taken from domestic and foreign nonbanks (i.e. customers), all currencies yes –bank deposits Deposits taken from domestic and foreign banks, all currencies yes –securitized debt liabilities in the form of securitized debt obligations and transferable certificates yes –Net fee income Net income from fees and commissions (smoothed) yes –staff expenses staff expenses yes +other operating expenses operating expenses other than staff expenses yes +leverage ratio eligible tier 1 capital over total assets by definition ±rWA risk-weighted assets (credit risk only) yes ±llp ratio specific loan loss provisions over gross exposure (loans to domestic and foreign
nonbanks, all currencies), smoothed3no ±
lerner index relative markup of the price of an aggregate bank product over marginal costs; estimated by three-stage least squares in a simultaneous equation model
no +
crisis dummy time dummy from the third quarter of 2007 onward no –primary bank dummy Dummy variable indicating whether a bank is a “primary bank” no +GDp growth Annual growth rate of quarterly real GDp no +GDp deflator Annual growth rate of the level of prices of all new, domestically produced, final
goods and services in Austriano ±
short-term interest rate (–1) short-term nominal interest rate (3-month eurIbor) p.a. at lag 1 (previous quarter)
no +
long-term interest rate (–1) long-term nominal interest rate (10-year Austrian government bond yield) p.a. at lag 1 (previous quarter)
no +
Source: OeNB.1 Theoretical considerations and/or evidence in the existing literature suggest that the impact of a variable on the NIM is either positive (+), negative (–) or mixed (±).2 Interest on other assets and other liabilities (e.g. receivables from goods and services) is excluded from net interest income. Including these items basically has only a negligible effect on
the estimation results.3 According to national GAAP, specif ic loan loss provisions essentially are set aside only for loss events that have already occurred in the past, i.e. they do not exhibit a forward-looking
character.
10 In table 2, which presents the estimation results, normalization by total assets is mentioned explicitly.
Macroeconomic, Market and bank-specific Determinants of the Net Interest Margin in Austria
FINANcIAl stAbIlIty report 25 – juNe 2013 93
fee income, staff expenses, other oper-ating expenses, various profit compo-nents for constructing the Lerner index) refer to quarterly flows.
4 Empirical Analysis
In this section, we briefly outline the econometric approach to the applica-tion of the Ho and Saunders (1981) model and its later refinements, as laid out in section 2, to the data described in section 3. The structure of our data (N=1,011 banks are observed for T=66 time periods) calls for a panel-data anal-ysis. As not all institutions were active during the entire observation horizon, the resulting panel is unbalanced.
In its general form, a static one-way regression with panel-specific effects reads as follows:11
yi,t=α+β'Xi,t+ ui+ei,t
i = 1,…,N, t = 1,…,T (3)
where yi,t denotes the dependent variable (NIM), Xi,t the K explanatory variables, and ei,t the idiosyncratic error term, which we assume – for the time being – to be independent and identically dis-tributed (i.i.d.): ei,t~N(0,σe
2).α represents the global intercept, β the corresponding K regression coefficients, and ui the panel-specific effect, for which we still need to determine whether it should be treated as a fixed parameter, i.e. fixed effect ui with
∑Ni=1 ui=0
for the global intercept to be identified or rather as an i.i.d. random variable, i.e. random effect ui with
ui~N(0,σu2 ),
Corr[x(k)i,t ,ui ]=0 t=1,...,T, k=1,...K.
The Breusch-Pagan Lagrangian multi-plier test for random effects supports this view as it rejects the null of poola-bility at the 1% level, thereby under-lining the importance of taking the presence of any type of bank-specific effect into account. Moreover, the Wooldridge test for autocorrelation in panel data rejects the null of no first-order autocorrelation in the idiosyn-cratic error terms at the 1% level (see Wooldridge, 2002, and Drukker, 2003). A modified Wald test for groupwise heteroskedasticity likewise rejects the null of homoskedasticity of the idiosyn-cratic error variances at the 1% level. In the presence of autocorrelation and heteroskedasticity within panels, we have to make a more general assumption about the distribution of the error term and thus employ robust estimators of the variance-covariance matrix herein-after (see, e.g., Hoechle, 2007, for an overview of robust estimators in panel-data analysis).12
It is still unclear which specification of the bank-specific effects in static panel regression – fixed or random – better describes the data-generating process. As we are confronted with heteroskedasticity in the error variance, we need a variant of the Hausman test
11 We do not follow the original two-stage estimation technique of Saunders and Schumacher (2000) to distinguish the deter-minants of the NIM into a pure and a total margin. This approach would not mix bank-specific and macroeconomic variables in a single equation and hence would avoid any estimation bias due to group effects as argued by Moulton (1986). Our panel estimation approach, however, controls for bank-specific characteristics and for the fact that all banks operate in virtually the same macroeconomic environment.
12 Note that preliminary robust fixed effects regressions allowing for variance clustering at (potential) clusters other than the panel identifier (e.g. the sectors within the banking system to which the individual banks belong or the Austrian provinces where the banks’ headquarters are located) do not produce substantially different results. The correlation of the error term across panels therefore does not seem to be much of an issue. Another preliminary fixed effects regression allowing for AR(1) disturbances only but not for heteroskedasticity produces similar results.
Macroeconomic, Market and bank-specific Determinants of the Net Interest Margin in Austria
94 FINANcIAl stAbIlIty report 25 – juNe 2013
to decide for either random or fixed effects that is robust against heteroske-dasticity. We therefore employ the Hansen (1982) J-test of overidentifying restrictions, which tests whether the additional moment condition Et [Xi,t ui ]=0 as imposed by random effects estima-tion holds (see Arellano, 1993). As the null of the test of validity of this partic-ular overidentifying restriction is re-jected at the 1% level, we conclude that a model with fixed effects better de-scribes the underlying data-generating process.13
Even if random effects or pooled OLS estimation may not fit the data as well as fixed effects, we will still present estimation results based on these meth-ods since quantitatively and qualitatively similar estimation results across vari-ous estimation methods corroborate the explanatory power of the regressors. In addition, we allow for a primary-bank dummy to capture the difference in evolution of the NIM of this particu-lar type of bank over time as depicted in chart 1. It would not be possible to include such a dummy in a fixed effects regression.
To provide additional evidence for the goodness of fit of our chosen speci-fication, we also cover estimation results based on the feasible generalized least squares (FGLS) estimation, which is another estimator for producing results that are robust against autocorrelation and heteroskedasticity in the idiosyn-cratic error terms. In particular, we apply two variants: one variant estimates a common autoregressive coefficient and the other allows for panel-specific autocorrelation. As discussed in Hoechle (2007) and as can be seen in section 5, however, the reported robust standard errors of these estimators have to be
interpreted with a grain of salt, as they tend to produce downward-biased results.
5 Estimation Results
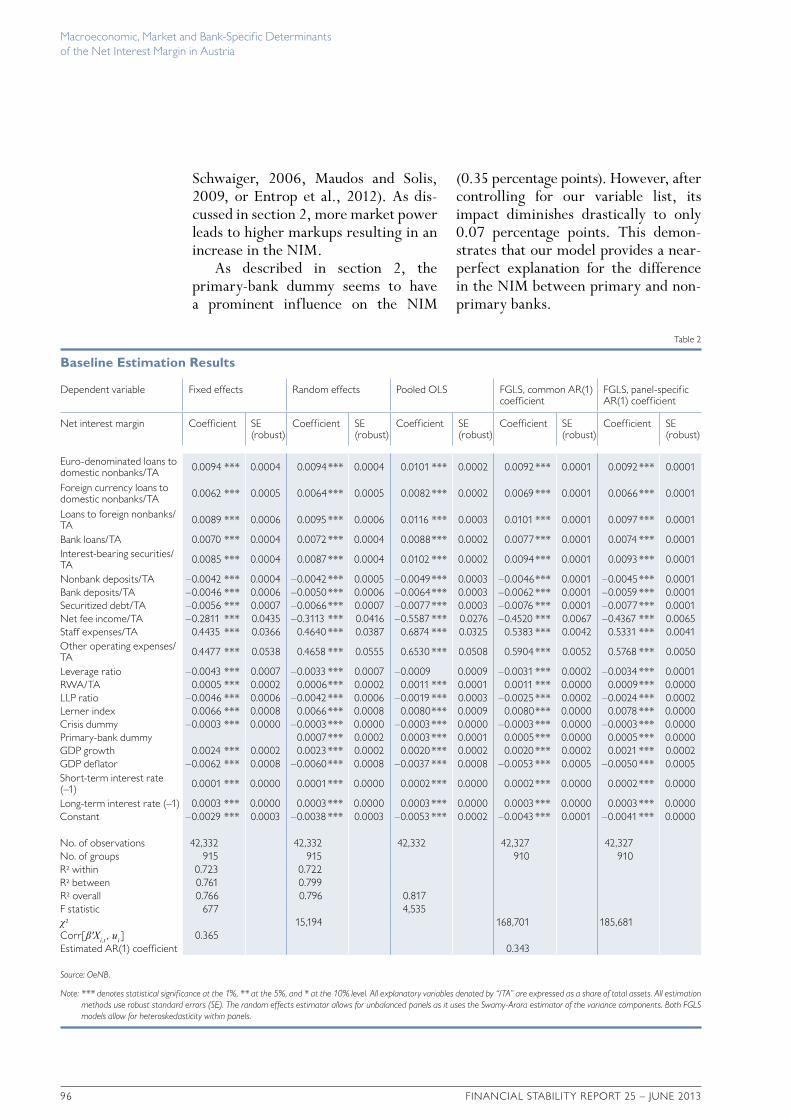
We present our estimation results in table 2, where the NIM is the dependent variable. Generally speaking, not only is the vast majority of coefficient estimates highly significant and has the expected sign, but also the results discussed be-low hold across estimation techniques. This gives us confidence in the validity of the employed econometric model.
It is not surprising that the influ-ence of the balance sheet structure on the NIM is substantial. The balance sheet structure not only summarizes past and current management decisions, thereby approximating the results of a multi-stage period dynamical optimiza-tion problem, but also sheds light on the business model of a bank.
On the asset side, euro-denominated loans to domestic nonbanks generate the highest positive contribution to the NIM, followed by loans to domestic non-banks and interest-bearing securities. Foreign currency loans to domestic non-banks only have a coefficient estimate two-thirds as high as their euro-denomi-nated counterpart. Albacete et al. (2012), who conducted an analysis on foreign currency mortgage holders based on the Household Finance and Consumption Survey14, show that foreign currency borrowers have substantially higher risk buffers than their domestic currency counterparts. As a consequence, the former might have a stronger position in loan contract bargaining, which results in a lower interest rate.
On the liability side, the cheapest refinancing sources are nonbank depos-its, followed by bank deposits and secu-
13 Note that the fixed effects estimation in section 5 delivers an empirical value of Corr(β'Xi,t ,ui )=0.3649.14 See http://www.ecb.int/home/html/researcher\_hfcn.en.html for more information.
Macroeconomic, Market and bank-specific Determinants of the Net Interest Margin in Austria
FINANcIAl stAbIlIty report 25 – juNe 2013 95
ritized debt. Here, their coefficient esti-mates are more or less in the same range and have the expected negative sign.
The negative sign for net fee income is a standard result. Maudos and Solis (2009) argue that more diversified banks have lower intermediation mar-gins. This may reflect a strategy of cross-subsidization with traditional activities. Also Lepetit et al. (2008) find that higher income shares from fees and commissions are associated with lower margins and loan spreads. The latter result is consistent with the conjecture that banks price (or misprice) loans to increase sales of other services.
Staff and other operating expenses represent our cost- or efficiency-related variables. They have a relatively high negative impact on the NIM, which highlights the importance of banks being efficient. From a different perspective, only approximately 45% of an increase in staff or other operating expenses can be passed on to customers by increasing the NIM.
The financial crisis has uncovered the vulnerability of highly leveraged banks. Our results suggest that the higher the leverage ratio, the lower the NIM, which is in accordance with a recently published article by Hamadi and Awdeh (2012).
However, our results are in contrast to most of the empirical literature that is based on the Ho-Saunders dealership model, where the leverage ratio is used to approximate risk aversion and has a positive sign (see Saunders and Schumacher, 2000, Maudos and de Guevara, 2004, and Maudos and Solis, 2009). As we control for more vari-ables, especially for the balance sheet structure, our findings suggest that holding regulatory tier 1 capital is
costly in terms of generating net inter-est income. In other words, the lever-age ratio has the same interpretation as other balance sheet liability variables (e.g. nonbank deposits). From a finan-cial stability perspective, it is important to note that it is the second cheapest refinancing source, while, at the same time, a higher leverage ratio increases the risk-bearing capacity of banks, thereby contributing to the overall stability of the banking system.
To factor in the risk appetite of banks, we incorporate risk-weighted assets (RWA) and the loan loss provision (LLP) ratio in our estimation. To the best of our knowledge, we are the first to integrate both variables in a model.15 Although it is debatable if RWA under Basel II measure risk perfectly, the coefficient estimate is still positive, which indicates that banks demand compensa-tion for riskier assets.
The LLP ratio shows a negative sign, however. At the first glance, this result seems surprising and in contrast to most of the existing literature. Nonetheless, when we control for RWA and consider the fact that provisioning does not exhibit a forward-looking character under local GAAP, the nega-tive coefficient makes perfect sense. Following Hanweck and Ryu (2005), our estimation shows that rising loan losses or nonperforming loans relative to earning assets causes banks to lose interest income generated from these loans and to move funds to lower-yield-ing assets that are less prone to default. Both effects tend to negatively influ-ence the NIM in the short run, i.e. deteriorations in credit quality tend to decrease the NIM.
The Lerner index has the expected positive sign (see e.g. Liebeg and
15 Whereas only Liebeg and Schwaiger (2006) and Entrop et al. (2012) consider RWA, the LLP ratio or closely related variables are standard in the empirical literature on the NIM.
Macroeconomic, Market and bank-specific Determinants of the Net Interest Margin in Austria
96 FINANcIAl stAbIlIty report 25 – juNe 2013
Schwaiger, 2006, Maudos and Solis, 2009, or Entrop et al., 2012). As dis-cussed in section 2, more market power leads to higher markups resulting in an increase in the NIM.
As described in section 2, the primary-bank dummy seems to have a prominent influence on the NIM
(0.35 percentage points). However, after controlling for our variable list, its impact diminishes drastically to only 0.07 percentage points. This demon-strates that our model provides a near-perfect explanation for the difference in the NIM between primary and non-primary banks.
table 2
Baseline Estimation Results
Dependent variable Fixed effects random effects pooled ols FGls, common Ar(1) coefficient
No. of observations 42,332 42,332 42,332 42,327 42,327No. of groups 915 915 910 910r² within 0.723 0.722 r² between 0.761 0.799 r² overall 0.766 0.796 0.817 F statistic 677 4,535 χ² 15,194 168,701 185,681 corr[β'Xi,t , ui ] 0.365 estimated Ar(1) coefficient 0.343
Source: OeNB.
Note: *** denotes statistical signif icance at the 1%, ** at the 5%, and * at the 10% level. All explanatory variables denoted by “/TA” are expressed as a share of total assets. All estimation methods use robust standard errors (SE). The random effects estimator allows for unbalanced panels as it uses the Swamy-Arora estimator of the variance components. Both FGLS models allow for heteroskedasticity within panels.
Macroeconomic, Market and bank-specific Determinants of the Net Interest Margin in Austria
FINANcIAl stAbIlIty report 25 – juNe 2013 97
The importance of economic condi-tions for the NIM is reflected by the significant contribution of GDP growth, GDP deflator growth as well as short- and long-term interest rates.
Consistent with the literature, GDP growth has the expected positive influ-ence on the NIM. Higher overall eco-nomic activity generally boosts credit demand.
Instead of GDP deflator growth, most empirical studies on the NIM use an inflation proxy based on the con-sumer price index (CPI). Horvath (2009) and Rumler and Waschiczek (2012) observe a positive influence on the NIM. We think, however, that GDP deflator growth is a better indica-tor of price changes in the economy, as it reflects price changes of all goods and services produced within the country, whereas the CPI only reflects the prices of a more or less representative basket of goods and services purchased by consumers. Moreover, our results show a negative coefficient estimate for GDP deflator growth, which coincides with the theoretical considerations of Boyd et al. (2001), who claim that there is a negative relationship between financial sector performance and inflation. They also argue that in economies with high inflation, intermediaries will lend less and allocate capital less efficiently.16 We believe that banks try to optimally allo-cate their resources by setting real rates and taking inflation expectations into account. With perfect foresight of infla-tion there should be no influence on the NIM, at least in theory. In Austria, inflation has been stable for a long period of time, which is in contrast to the
countries analyzed in the other studies mentioned here, where a positive coef-ficient for inflation was estimated. In other words, inflation variance has been very low, which may have caused banks to refrain from pricing in inflation.
We include long- and short-term nominal interest rates lagged by one quarter to avoid problems with interest rate adjustment clauses of banks.17 The positive coefficient estimates of both interest rates suggest that low interest rate environments put pressure on banks’ NIM as nominal (deposit) rates have a lower bound at zero. Additionally, long- and short-term interest rate coef-ficients enable us to indirectly observe the effects of the market interest rate spread on the NIM. The spread (long-term minus short-term interest rate) also has a positive sign, which is con-firmed in Rumler and Waschiczek (2012) since a steeper yield curve helps banks boost their NIM.
To the best of our knowledge, we are the first to quantify the influence of the global financial crisis on banks’ NIM. The crisis dummy has the expected negative sign, which points to the fact that the costs of the crisis could not be fully passed on to banks’ customers. The significant contribution of the crisis dummy shows that the global financial crisis had an enormous impact on banks’ business environment, which was not fully reflected in the macroeconomic variables considered above.
6 Summary and Conclusions
In this paper, we investigate the deter-minants of the net interest margin in the Austrian banking sector. We assess
16 The robustness of our negative coefficient for the GDP deflator is confirmed by an alternative estimation where we obtain a negative coefficient for consumer price inflation as well.
17 Although the standard literature on the NIM uses interest rate volatility as an explanatory variable, we think that in the special case of Austria, where the majority of loans are floaters, banks have a natural hedge against interest rate risk and therefore we can gain more insight by including rates. An alternative estimation shows that the short-term interest rate volatility coefficient estimate has the expected positive sign.
Macroeconomic, Market and bank-specific Determinants of the Net Interest Margin in Austria
98 FINANcIAl stAbIlIty report 25 – juNe 2013
to what extent macroeconomic, market and bank-specific variables influence the NIM. Based on a unique supervi-sory panel-data set for the Austrian banking sector, which comprises around 42,000 observations between the first quarter of 1996 and the second quarter of 2012, we apply different panel esti-mation techniques to the determinants of the NIM that have proven to work best according to the existing literature as well as to our two new contribu-tions, namely banks’ business models in terms of their balance sheet structure and the global financial crisis. Our esti-mation results suggest that not only the determinants identified in the existing empirical literature (different types of non-interest income and expenses, var-ious risk measures, competition, the macroeconomic environment) have sig-nificant explanatory power with regard to the NIM, but also our two innova-tions (balance sheet structure, global financial crisis). Since the results are generally robust across estimation tech-niques and since alternative specifica-tions of dependent and explanatory variables yield very similar outcomes, we are confident that we have identi-fied the key contributors to the NIM in the Austrian banking sector.
For the bank-specific variables net fee income, staff expenses and other operating expenses, we obtain results in accordance with the existing empiri-cal literature. On average, the efficiency of Austrian banks has increased since 1996, which has led to lower positive contributions of staff expenses and – to a minor extent – of other operating expenses to the NIM.
The balance sheet structure is an important driver of the NIM. In fact,
the reduction of euro-denominated loans to domestic nonbanks in favor of foreign currency loans to domestic nonbanks and loans to foreign nonbanks (i.e. cross-border loans), which is par-ticularly pronounced for non-primary banks, has driven down the NIM con-siderably since 1996.18 The balance sheet structure as a proxy for banks’ business models is also the most signifi-cant difference between primary and non-primary banks. In fact, this shift partly reflects the expansion to banking markets in Central, Eastern and South-eastern Europe and the Commonwealth of Independent States.
In the context of regulatory require-ments, risk-weighted assets play an im-portant role in determining the NIM. Their positive influence is consistent with theoretical considerations that, for riskier assets, higher margins are re-quested from a forward-looking per-spective. Moreover, in contrast to most other empirical studies, the LLP ratio has a negative impact on the NIM. However, this result fits in perfectly with the legal framework when consid-ering the backward-looking character of loan loss provisioning.
Our last bank-specific variable, namely the leverage ratio, confirms that holding more equity is costly in terms of generating net interest income.
The policy implications of these findings are twofold: First, banks price RWA into their NIM. Second, the leverage ratio, which will be an addi-tional part of the Basel III framework, also has a significant impact on the NIM. As more equity (in terms of tier 1 capital) is supposed to serve as a buffer to absorb shocks, the leverage ratio must be gradually increased after the
18 This shift toward foreign currency loans to domestic nonbanks and loans to foreign nonbanks was already highlighted as a driving force of the declining NIM by Liebeg and Schwaiger (2006), who analyzed a similar Austrian dataset covering the period from 1996 to 2005.
Macroeconomic, Market and bank-specific Determinants of the Net Interest Margin in Austria
FINANcIAl stAbIlIty report 25 – juNe 2013 99
introduction of Basel III. However, our findings suggest that holding more equity is only 1 basis point more expen-sive than customer deposits (the cheap-est refinancing source) in terms of a contribution to the NIM. In light of our analysis, the argument that a higher leverage ratio will put downward pres-sure on credit supply cannot be sup-ported. In fact, the estimated impact of a higher leverage ratio is much lower than the benefits from an increased leverage ratio in terms of the shock-ab-sorbing capacity of the banking system.
Aside from bank-specific variables and the regulatory environment, the Lerner index has the foreseen positive impact on the NIM. Therefore, we can support the structure-conduct-perfor-mance theory from industrial organiza-tion.19 Our findings uncover the fol-lowing: First, the Lerner index had been rather stable between the first quarter of 1996 and the second quarter of 2007 before dropping during the financial crisis, after which the index came back to its long-run level. Second, there is a significant difference between the Lerner index of primary and non-primary banks. Based on the classifica-tion of Fischer and Hempell (2006), primary banks with an average Lerner index of 0.22 operate in regional mar-
kets with low competition, whereas non-primary banks with an average Lerner index of 0.12 face high competition.
Finally, the macroeconomic environ-ment – approximated by Austrian short- and long-term interest rates, GDP growth and the GDP deflator – has a significant impact on the NIM. The most signifi-cant contribution stems from the inter-est rate environment. More specifically, a low interest rate environment and/or a low spread between long- and short-term market interest rates are a detri-mental scenario for the NIM.
As expected, GDP growth boosts the NIM. In contrast to most findings in the literature, inflation does not have a positive impact on the NIM in Austria. We obtain a negative relationship, which could be attributed to the fact that Austria is a low-inflation country with a high share of floating-rate loans that serve as a natural hedge against inflation.
From a macroprudential perspective, it is crucial to monitor banking activi-ties in the current low interest rate environment, as such conditions had prevailed at the beginning of the sub-prime crisis. In the years to come, detecting excessive search for yield behavior by banks will therefore be high on banking supervisors’ radar.
19 This paradigm assumes that the market structure determines firm conduct, which in turn determines performance.
Macroeconomic, Market and bank-specific Determinants of the Net Interest Margin in Austria
100 FINANcIAl stAbIlIty report 25 – juNe 2013
ReferencesAlbacete, N., P. Fessler and M. Schürz. 2012. risk buffer profiles of Foreign currency Mort-
gage Holders. In: oeNb Financial stability report 23. 62–75.Allen, F. and D. Gale. 1995. A welfare comparison of intermediaries and financial markets in
Germany and the us. In: european economic review 39. 179–209.Allen, L. 1988. the Determinants of bank Interest Margins: A Note. In: the journal of Financial
and Quantitative Analysis 23(2). 231–235.Angelini, P. and N. Cetorelli. 2003. the effects of regulatory reform on competition in the
banking Industry. In: journal of Money, credit and banking 35(5). 663–684.Arellano, M. 1993. on the testing of correlated effects with panel data. In: journal of econometrics
59. 87–97.Boyd, J., R. Levine and B. Smith. 2001. the impact of inflation on financial sector performance.
In: journal of Monetary economics 47(2). 221–248.Delis, M. and G. Kouretas. 2011. Interest rates and bank risk-taking. In: journal of banking and
Finance 35(4). 840–855.Drukker, D. M. 2003. testing for serial correlation in linear panel-data models. In: the stata
journal 3. 1–10.Entrop, O., C. Memmel, B. Ruprecht and M. Wilkens. 2012. Determinants of bank
Interest Margins: Impact of Maturity transformation. Deutsche bundesbank Discussion paper 17/2012.
Fischer, K. and H. Hempell. 2006. regional Markets, oligopoly, and Market power in banking. unpublished.
Hamadi, H. and A. Awdeh. 2012. the Determinants of bank Net Interest Margin: evidence from the lebanese banking sector. In: journal of Money, Investment and banking 23(3). 85–98.
Hansen, L. P. 1982. large sample properties of generalized method of moments estimators. In: econometrica 50. 1029–1054.
Hanweck, G. and L. Ryu. 2005. the sensitivity of bank net interest margins and profitability to credit, interest rate, and term-structure shocks across bank product specializations. technical report. school of Management, George Mason university and Federal Insurance corporation.
Herfindahl, O. 1955. comment on rosenbluth’s measures of concentration. In: stigler, G. j. (ed.). business concentration and price policy. princeton: princeton university press.
Hirschman, A. 1964. the paternity of an index. In: American economic review 54(5). 761–762.Ho, T. and A. Saunders. 1981. the Determinants of bank Interest Margins: theory and
empirical evidence. In: the journal of Financial and Quantitative Analysis 16(4). 581–600.Hoechle, D. 2007. robust standard errors for panel regressions with cross-sectional dependence.
In: the stata journal 7. 281–312.Horvath, R. 2009. Interest Margins Determinants of czech banks. Working papers Ies 2009/11.
charles university prague, Faculty of social sciences, Institute of economic studies.Keeley, M. 1990. Deposit insurance, risk, and market power in banking. In: American economic
review 80(5). 1183–1200.Klein, M. 1971. A theory of the banking firm. In: journal of Money, credit, and banking 3. 205–218.Lepetit, L., E. Nys, P. Rous and A. Tarazi. 2008. the expansion of services in european
banking: Implications for loan pricing and interest margins. In: journal of banking and Finance 32(11). 2325–2335.
Liebeg, D. and M. Schwaiger. 2006. Determinants of the Interest rate Margins of Austrian banks. In: oeNb Financial stability report 12. 104–116.
Marrouch, W. and R. Turk Ariss. 2011. bank pricing under oligopsonistic-oligopoly: evidence from 103 Developing countries. Working papers series. lebanese American university.
Macroeconomic, Market and bank-specific Determinants of the Net Interest Margin in Austria
FINANcIAl stAbIlIty report 25 – juNe 2013 101
Maudos, J. and J. de Guevara. 2004. Factors explaining the interest margin in the banking sectors of the european union. In: journal of banking and Finance 28(9). 2259–2281.
Maudos, J. and L. Solis. 2009. the determinants of net interest income in the Mexican banking system: An integrated model. In: journal of banking and Finance 33(10). 1920–1931.
Memmel, C. and A. Schertler. 2011. banks’ management of the net interest margin: evidence from Germany. Deutsche bundesbank Discussion paper 13/2011.
Monti, M. 1972. Deposit, credit, and interest rate determination under alternative bank objectives. In: szego, G. p. and K. shell (eds.). Mathematical Methods in Investment and Finance. Amsterdam: North-Holland.
Moulton, B. 1986. random group effects and the precision of regression estimates. In: journal of econometrics 32(3). 385–397.
Rumler, F. and W. Waschiczek. 2012. Have changes in the Financial structure Affected bank profitability? evidence for Austria. oeNb Working paper 180.
Saunders, A. and L. Schumacher. 2000. the determinants of bank interest rate margins: an international study. In: journal of International Money and Finance 19(6).
Schneider, M. and M. Leibrecht. 2006. AQM-06: the Macroeconomic Model of the oeNb. oeNb Working paper 132.
Van Hoose, D. 2010. the Industrial organization of banking. Dordrecht, Heidelberg, london, New york: springer.
Wooldridge, J. M. 2002. econometric Analysis of cross section and panel Data. cambridge, MA: the MIt press.
Zarruk, E. and J. Madura. 1992. optimal bank Interest Margin under capital regulation and Deposit Insurance. In: the journal of Financial and Quantitative Analysis 27(1). 143–149.